Neuroinflammation and White Matter Alterations in Obesity Assessed by Diffusion Basis Spectrum Imaging
 Amjad Samara1
  Tatianna Murphy1
  Jeremy Strain2 Jerrel Rutlin1
  Peng Sun3
  Olga Neyman1 Nitya Sreevalsan1 Joshua S. Shimony3
  Beau M. Ances2
  Sheng-Kwei Song3
  Tamara Hershey1,2,3,4
  Sarah A. Eisenstein1,3*
- 1Department of Psychiatry, Washington University School of Medicine, St. Louis, MO, United States
- 2Department of Neurology, Washington University School of Medicine, St. Louis, MO, United States
- 3Mallinckrodt Institute of Radiology, Washington University School of Medicine, St. Louis, MO, United States
- 4Department of Psychological & Brain Sciences, Washington University School of Medicine, St. Louis, MO, United States
Human obesity is associated with low-grade chronic systemic inflammation, alterations in brain structure and function, and cognitive impairment. Rodent models of obesity show that high-calorie diets cause brain inflammation (neuroinflammation) in multiple regions, including the hippocampus, and impairments in hippocampal-dependent memory tasks. To determine if similar effects exist in humans with obesity, we applied Diffusion Basis Spectrum Imaging (DBSI) to evaluate neuroinflammation and axonal integrity. We examined diffusion-weighted magnetic resonance imaging (MRI) data in two independent cohorts of obese and non-obese individuals (Cohort 1: 25 obese/21 non-obese; Cohort 2: 18 obese/41 non-obese). We applied Tract-based Spatial Statistics (TBSS) to allow whole-brain white matter (WM) analyses and compare DBSI-derived isotropic and anisotropic diffusion measures between the obese and non-obese groups. In both cohorts, the obese group had significantly greater DBSI-derived restricted fraction (DBSI-RF; an indicator of neuroinflammation-related cellularity), and significantly lower DBSI-derived fiber fraction (DBSI-FF; an indicator of apparent axonal density) in several WM tracts (all corrected p < 0.05). Moreover, using region of interest analyses, average DBSI-RF and DBSI-FF values in the hippocampus were significantly greater and lower, respectively, in obese relative to non-obese individuals (Cohort 1: p = 0.045; Cohort 2: p = 0.008). Hippocampal DBSI-FF and DBSI-RF and amygdalar DBSI-FF metrics related to cognitive performance in Cohort 2. In conclusion, these findings suggest that greater neuroinflammation-related cellularity and lower apparent axonal density are associated with human obesity and cognitive performance. Future studies are warranted to determine a potential role for neuroinflammation in obesity-related cognitive impairment.
Introduction
Obesity is a rapidly growing epidemic around the world. According to the World Health Organization, in 2016 more than 1.9 billion adults were overweight and 650 million (about 9% of the world population) were obese (≥30 kg/m2) (WHO, 2018). Obesity is associated with comorbidities including type 2 diabetes, hypertension, heart disease, and cancer (Haslam and James, 2005). In addition, obesity is linked to cognitive deficits and is a risk factor for Alzheimer’s disease (Miller and Spencer, 2014; Walker and Harrison, 2015; Alford et al., 2018). These latter features have raised the question of how obesity and its comorbidities may influence brain function and structure. Neuroimaging studies have found both structural and functional abnormalities in obesity, but the mechanisms underlying these differences are not well understood (Devoto et al., 2018; van Galen et al., 2018; Garcia-Garcia et al., 2019). One potential mechanism for brain structural and functional findings is brain inflammation (neuroinflammation), but this has not been explored thoroughly in humans (Guillemot-Legris and Muccioli, 2017).
Obesity is a disease of low-grade chronic systemic inflammation that affects many body organs (Gregor and Hotamisligil, 2011). Also, evidence from rodent models shows that obesity causes neuroinflammation (Guillemot-Legris et al., 2016). Similarly, in humans with obesity, postmortem brain examination shows evidence of gliosis and abnormal microglia activation in the hypothalamus and altered mRNA expression of inflammatory markers in frontal cortex suggestive of neuroinflammation (Baufeld et al., 2016; Lauridsen et al., 2017). Hypercaloric diet induces breakdown of the BBB, allowing pro-inflammatory cytokines to enter the CNS (Guillemot-Legris et al., 2016; Stranahan et al., 2016; Guillemot-Legris and Muccioli, 2017) and promotes peripheral macrophage infiltration to the brain (Stranahan et al., 2016), which subsequently contributes, among other factors such as increased peripheral free fatty acid circulation (O’Brien et al., 2017), to obesity-associated neuroinflammation. Intriguingly, hippocampal neuroinflammation causes deficits in memory tasks in rodent models of obesity (Pistell et al., 2010; Beilharz et al., 2016; Cope et al., 2018). In humans, higher adiposity is generally associated with poorer cognitive performance in a variety of measures, yet the underlying mechanism is not entirely understood (Wright et al., 2016; Gameiro et al., 2017; Tsai et al., 2017). Taken together, it is reasonable to hypothesize that obesity-related neuroinflammation impacts the function and structure of the human brain and could be an underlying mechanism of obesity-associated cognitive impairment.
Evaluation of obesity-associated neuroinflammation in humans via imaging is technically challenging and there are few research studies in this area. Measuring specific processes related to neuroinflammation (e.g., microglial activation) with neuroimaging is possible via PET with radiotracers (e.g., TSPO radiotracer) (Vivash and O’Brien, 2016; Alam et al., 2017). However, these PET radiotracers vary in specificity, and some individuals (∼34% of Caucasians) have genotypes that confer very low to mixed binding affinity for TSPO ligands (Owen et al., 2012). Other research groups utilized MRI-based techniques to evaluate obesity-associated neuroinflammation. For example, alterations in T2-weighted MRI signal intensity (an indicator of gliosis) in the hypothalamus have been found in obese individuals (Thaler et al., 2012; Schur et al., 2015; Kreutzer et al., 2017). Also, plasma fibrinogen, a driver of inflammation, has been related to alterations in diffusivity characteristics of extra-hypothalamic brain regions including orbitofrontal cortex and amygdala in overweight and obese individuals (Cazettes et al., 2011). Interestingly, a recent study has also shown sex-specific effects of central adiposity and systemic inflammatory markers on limbic system microstructure (Metzler-Baddeley et al., 2019).
At the same time, a large number of neuroimaging studies have focused on the impact of obesity on WM microstructure using standard DTI modeling (Kullmann et al., 2015; Alfaro et al., 2018). DTI models a single diffusion tensor within an image voxel, to derive the standard diffusion tensor metrics (AD, RD, FA). Using this standard model, several studies have found that individuals with higher BMI have lower FA in many WM tracts (Marks et al., 2011; Mueller et al., 2011; Stanek et al., 2011; Verstynen et al., 2012; Karlsson et al., 2013; Xu et al., 2013; Lou et al., 2014; Bolzenius et al., 2015; He et al., 2015; Kullmann et al., 2015; Kullmann et al., 2016; Mazza et al., 2017; Papageorgiou et al., 2017; Alfaro et al., 2018) and mixed effects on AD and RD (Mueller et al., 2011; Xu et al., 2013; Kullmann et al., 2016; Mazza et al., 2017; Papageorgiou et al., 2017). In the healthy brain or disease conditions with limited edema and inflammation, lower FA and AD reflects impaired overall WM integrity and axonal injury, respectively, while greater RD reflects myelin damage (Wheeler-Kingshott and Cercignani, 2009; Winklewski et al., 2018). However, neuroinflammation-related processes such as cellularity and edema may confound standard DTI modeling, lead to mixed effects on AD and RD, and decrease the sensitivity and specificity to detect WM microstructural alterations (Winklewski et al., 2018).
In recent years, a novel data-driven DBSI (Wang et al., 2011; Wang et al., 2014) approach has been developed that shows sensitivity to both neuroinflammation and WM microstructural alterations. DBSI resolves intra-voxel partial volume effects arising from anisotropic and isotropic diffusion signals, and models both simultaneously to obtain the best estimation of anisotropic and isotropic diffusion tensors. Anisotropic tensor components modeled by DBSI consider water diffusion of WM tracts within the image voxel, deriving the rate of water diffusion parallel to the axon (DBSI-axial diffusivity or DBSI-AD) and perpendicular to the axon (DBSI-radial diffusivity or DBSI-RD) or fiber-tract specific diffusion anisotropy (DBSI-fractional anisotropy or DBSI-FA) reflecting the integrity of axon bundles. DBSI-derived fiber fraction (DBSI-FF) indicates axonal density. Simultaneously, DBSI models restricted isotropic diffusion into DBSI-restricted fraction (DBSI-RF; an indicator of resident and neuroinflammation-related cellularity) and non-restricted diffusion into DBSI-hindered fraction (DBSI-HF; an indicator of tissue edema). DBSI-derived isotropic measures (DBSI-RF and DBSI-HF) are sensitive to inflammation-related cellularity and tissue edema, respectively (Cross and Song, 2017), and both are present in neuroinflammation (Frohman et al., 2006; Stamatovic et al., 2006). Validation studies of DBSI in animal models have shown that this method can differentiate axonal injury, demyelination, and neuroinflammation in white and gray matter (Wang et al., 2014; Cross and Song, 2017; Zhan et al., 2018). In humans, DBSI has been used to detect indicators of neuroinflammation in MS (Chiang et al., 2014), cervical spondylotic myelopathy (Murphy et al., 2016), traumatic spinal cord injury (Sun et al., 2017), HIV (Strain et al., 2017), and Alzheimer’s disease (Wang et al., 2019). Importantly, when neuroinflammation is present, DBSI can provide further insight into WM microstructural integrity (Wang et al., 2011; Chiang et al., 2014; Wang et al., 2014; Wang et al., 2015; Murphy et al., 2016; Cross and Song, 2017; Lin et al., 2017; Strain et al., 2017; Sun et al., 2017; Shirani et al., 2018; Zhan et al., 2018; Lin et al., 2019).
The goal of the current study was to apply DBSI in humans to evaluate the presence of neuroinflammation and provide further insight into WM microstructural integrity in obesity. DBSI-derived metrics may also help resolve some of the conflicting findings from the DTI literature in obesity (Kullmann et al., 2015). We hypothesized that obese individuals would have greater DBSI-RF (an indicator of increased neuroinflammation-related cellularity), greater DBSI-HF (an indicator of increased edema), and lower DBSI-FF (an indicator of decreased apparent axonal density) compared to non-obese individuals. We tested these hypotheses in a cohort of obese and non-obese individuals recruited specifically for a study of brain alterations in obesity (Cohort 1). We then examined a more heterogeneous convenience sample to confirm the presence of similar patterns related to BMI status (Cohort 2). Since obese individuals show impaired cognitive function relative to non-obese individuals (Wright et al., 2016; Gameiro et al., 2017; Tsai et al., 2017), hippocampal neuroinflammation causes impairment on memory tasks in rodent models of obesity (Pistell et al., 2010; Beilharz et al., 2016; Cope et al., 2018), and the hippocampus and amygdala operate together to form emotion-associated memory (Yang and Wang, 2017), we selected the hippocampus and amygdala to perform region of interest (ROI) analyses and explored the presence of similar alterations in these regions and their relation to cognitive performance.
Materials and Methods
Participants
In both cohorts, obesity was defined as ≥30 kg/m2. Non-obesity was defined as ≤25 kg/m2. All studies were approved by the Washington University School of Medicine Human Research Protection Office and were carried out in accordance with the principles expressed in the Declaration of Helsinki. All participants gave written, informed consent prior to participation.
Cohort 1: Healthy obese and non-obese adults were recruited through an online research participant database at Washington University, advertisements, and word of mouth for a neuroimaging study on obesity. All participants were assessed for the presence of diabetes with an oral glucose tolerance test and excluded from further participation if glucose or hemoglobin A1c levels met American Diabetes Association criteria for Type 2 diabetes (American Diabetes Association, 2016). Participants were also assessed with a detailed history, including neurological and physical examinations, psychiatric interviews using the Structured Interview for DSM-IV-TR Axis I Disorders (SCID) (First et al., 2002), and routine blood tests. Volunteers were excluded for history of medical problems as well as other significant neurological, cerebrovascular, cardiovascular, or psychiatric diagnosis (DSM-IV Axis I disorders except for specific phobias), head trauma, any current or recent dopaminergic drug use (e.g., stimulants, agonists, bupropion, neuroleptics or metoclopramide), current heavy alcohol use (males > 2 drinks per day, females > 1 drink per day) or illicit drug use, history of substance abuse or dependence, and IQ < 80 as measured by the Wechsler Abbreviated Scale of Intelligence (WASI) (Wechsler, 1999). Data from individuals in this sample have been reported previously (Eisenstein et al., 2013; Eisenstein et al., 2015a, b; Pepino et al., 2016).
Cohort 2: Healthy obese and non-obese adults were recruited through an online research database at Washington University and flyers to be a control group for ongoing studies. Exclusion criteria included self-reported diabetic medication use or unknown diabetic medication status, current or past history of confounding neurological disorders, depression as assessed by the Beck Depression Inventory II (BDI-II) (Beck et al., 1996), current alcohol or substance abuse, head injury with loss of consciousness greater than 30 min, claustrophobia or seizures, and fewer than 8 years of education. Data from some individuals in this sample have been reported previously (Strain et al., 2017).
BMI Measures
Body mass index was calculated as kg/m2 in both cohorts. Cohort 1: Height and weight measurements were taken by a trained nurse. Cohort 2: Height and weight were self-reported by participants.
Neuropsychological Performance
As described previously (Strain et al., 2017), individuals in Cohort 2 completed a cognitive test battery that included executive function, verbal and visuospatial learning and memory, and psychomotor speed. These included the Wechsler Adult Intelligence Scale III [WAIS-III including digit span, digit symbol, symbol search, and letter number sequencing subtests (Wechsler, 1997)]; Trail-making Test Parts A and B (Reitan, 1958); Multilingual Aphasia Examination verbal fluency subtest (Benton and Hamsher, 1976); F-A-S test (Spreen and Benton, 1977); animal (category) fluency (Goodglass and Kaplan, 1972); Delis-Kaplan Executive Function System [D-KEFS including Color-Word Interference Task (Delis et al., 2001)]; Hopkins Verbal Learning Test (HVLT) learning and recall (Brandt, 1991); Brief Visuospatial Memory Test-Revised (BVMT-R) (Benedict, 1997); Grooved Peg Board (Baser and Ruff, 1987); and finger-tapping test (FTT) (Schmitt, 2013). The Wide Range Achievement Test 3 (WRAT3) (Snelbaker et al., 2001) was also administered.
MRI Acquisition
Cohort 1: Magnetic resonance imaging scanning was performed on a Siemens Trio 3T scanner with a 20 channel head coil. Structural magnetic resonance T1-weighted anatomical images were obtained using a 3-D MPRAGE sequence [sagittal orientation, repetition time (TR) = 2400 ms, echo time (TE) = 3.16 ms, inversion time (TI) = 1000 ms, voxel resolution = 1 × 1 × 1 mm3, frames = 176, flip angle = 8°, FOV = 256 × 256 mm]. We acquired two echo planar DTI sequences, of similar phase encoding direction, with 27 volumes each (transverse orientation, 2 × 2 × 2 mm3 voxels, TR = 12,300 ms, TE = 108 ms, flip angle = 90°, 25 directions, b-values ranging from 0 to 1400 s/mm2, and two non-diffusion weighted images).
Cohort 2: Magnetic resonance imaging scanning was performed on the same Siemens Trio 3T scanner with a 12 channel head coil. Structural magnetic resonance T1-weighted anatomical images were obtained using the 3-D MPRAGE sequence described for Cohort 1. Two sequential diffusion-weighted scans, of similar phase encoding direction, were obtained (transverse orientation, 2 × 2 × 2 mm3 voxels, TR = 9,900 ms, TE = 102 ms, flip angle = 90°, 23 directions, b-values ranging from 0 to 1400 s/mm2, and one non-diffusion weighted image).
Image Preprocessing and DTI Processing
For both cohorts, all DTI volumes were manually inspected to exclude the presence of large artifacts. FMRIB Software Library (FSL) (Smith et al., 2004) was used to perform all preprocessing steps and fit the DTI diffusion tensor model at each imaging voxel. Non-brain tissue was removed using FSL BET (brain extraction tool) (Smith, 2002), followed by motion and eddy-current distortions correction. Field maps were not acquired as part of these studies and thus corrections for susceptibility-induced distortions were not performed. For DTI analyses, FSL DTIFIT tool was used to compute diffusivities from fitting the diffusion tensor model and to generate DTI-FA (DTI-fractional anisotropy), DTI-MD (DTI-mean diffusivity), DTI-RD (DTI-radial diffusivity), and DTI-AD (DTI-axial diffusivity) volumes for each subject. DTI-derived image volumes for each participant were subsequently processed through the TBSS (Smith et al., 2006) pipeline to allow for whole-brain WM voxel-wise analyses as described below.
Since head motion during MRI scans is positively related to and shares genetic factors with BMI (Hodgson et al., 2017), and because registration-based correction methods do not exclude the effects of head motion entirely, we also computed motion parameters as described by Yendiki et al. (2014). These motion parameters include average volume-by-volume translation, average volume-by-volume rotation, percentage of slices with signal drop-out, and signal drop-out severity. In order to obtain these motion measures, we completed the image correction and quality assessment steps of the TRACULA pipeline (TRActs Constrained by UnderLying Anatomy), without running the WM pathways reconstruction steps (Yendiki et al., 2011). TRACULA-derived average volume-by-volume translation and average volume-by-volume rotation were included as regressors in subsequent voxel-wise and statistical analyses. The readout of percentage of slices with signal drop-out and signal drop-out severity were 0 and 1, respectively, for every participant in both cohorts.
DBSI Processing
Diffusion basis spectrum imaging measures were calculated using in-house software scripted in MATLAB and Statistics Toolbox Release (2012), and as first described in Wang et al. (2011). Unlike conventional DTI modeling, DBSI modeling simultaneously differentiates and quantifies several intravoxel pathological processes (axonal injury/loss, axonal demyelination, neuroinflammation-related cellularity, and vasogenic edema) by assigning a dedicated diffusion tensor for each of these pathological processes. While DTI-derived FA quantifies the degree of anisotropy for the whole image voxel, DBSI estimates anisotropy of fiber tracts within the image voxel without being confounded by isotropic diffusion. The total diffusion signal (Sk) measured by DBSI includes both anisotropic (Ak) and isotropic (Ik) diffusion tensor components, and the weighted sum of these components is presented in Eq. 1.
Where Sk and are the signal and b-value of the kth diffusion gradient; NAniso is the number of anisotropic tensors, Φik is the angle between the principal direction of the ith anisotropic tensor and the kth diffusion gradient; λ||i and λ⊥i are the AD and RD of the ith anisotropic tensor, fi is the signal intensity fraction for the ith anisotropic tensor, and a and b are the isotropic diffusion spectrum f(D) low and high diffusivity limits.
Moreover, DBSI assesses isotropic diffusion tensor signal distribution within the whole spectrum of apparent isotropic diffusivity (resulting from intracellular and sub-cellular structures, and edematous extracellular tissue). Through previous experimental analyses (Wang et al., 2011; Wang et al., 2015), we grossly grouped isotropic diffusion as restricted diffusion (D ≤ 0.3 μm2/ms; a proxy measure of water diffusion in the intracellular compartment hence cellularity), and non-restricted isotropic diffusion (D > 0.3 μm2/ms; a proxy measure of water diffusion in the extracellular space). By solving the DBSI model, we obtain a group of anisotropic and isotropic metrics that include: DBSI-FA (indicates overall WM integrity), DBSI-AD (indicates axonal loss/injury), DBSI-RD (indicates myelin loss), DBSI-fiber fraction or DBSI-FF (indicates apparent axonal density), DBSI-RF (D ≤ 0.3 μm2/ms; indicates inflammation-related cellularity), and DBSI-hindered fraction or DBSI-HF (D > 0.3 μm2/ms; indicates extracellular tissue edema). DBSI-derived image volumes for each subject were subsequently processed through the TBSS pipeline to allow for whole-brain WM voxel-wise analyses as described below.
TBSS and Voxel-Wise Analyses
Post-processing and voxel-wise analyses of DTI- and DBSI-derived metrics were completed with TBSS (Smith et al., 2006). DTI-FA images were used to create an average WM skeleton. First, all DTI-FA were slightly eroded and end slices were excluded to remove potential outliers from diffusion tensor fitting. Secondly, all images were non-linearly registered to FMRIB58-FA standard-space image as a target image. Aligned FA images were then averaged to create a mean FA image, and fed into the skeletonization step to create a WM skeleton using a threshold of FA > 0.2. Using the same transformation process, all DTI- and DBSI-derived images, for each subject, were projected onto the mean FA skeleton, which represents the center of WM tracts common to all subjects, and used to perform further voxel-wise and ROI analyses.
Finally, the FSL Randomize tool (Winkler et al., 2014) was applied to perform separate voxel-wise statistical analyses within each cohort, and determined which skeleton voxels were significantly different between obese and non-obese groups (p < 0.05, corrected for multiple comparisons). We used GLMs controlling for age, sex, and race. Also, to account for the effects of head motion, we also controlled for TRACULA-derived motion measures (volume-by-volume translation and rotation). The TFCE option was used in TBSS analysis to correct for family-wise error (Nichols and Holmes, 2002).
Hippocampal and Amygdalar ROI and WM Tracts Analyses
In both cohorts, total hippocampal and amygdalar volumes for each individual were computed using FreeSurfer 6.0 segmentation1 of corresponding structural MRI images. Hippocampal and amygdalar volumes were corrected for total intracranial volumes (ICV) and compared between obese and non-obese groups. For all individuals, average DBSI-derived metrics (both anisotropic and isotropic) in the right and left hippocampus and amygdala were extracted using ROIs from the 50% thresholded Harvard-Oxford Subcortical Structural Atlas provided by the Harvard Center for Morphometric Analysis in FSL (Smith et al., 2004). Average hippocampal and amygdalar DBSI-metrics were compared between obese and non-obese groups in each cohort separately. Additionally, the JHU-ICBM-DTI-81 WM labels atlas was used to create masks to define WM ROIs for further analyses (Mori et al., 2008). To assess whether differences in DBSI metrics between obese and non-obese groups were spatially and qualitatively similar across cohorts, we computed the percentage of overlap between cohorts in all 48 WM tracts for significant differences in DBSI-RF, DBSI-FF, and DBSI-AD. Importantly, the hypothalamus was not included in our ROI analyses. In our experience, anatomical boundaries of the hypothalamus are not clearly visible on MRIs, making it difficult to be certain whether measures are not affected by partial volume effects. Therefore, we did not include this region in our analyses.
Statistical Analyses
Differences in demographic, motion parameters, and hippocampal volume variables between non-obese and obese individuals were assessed with between-subjects Student’s t-tests or, if data were not normally distributed, Mann–Whitney U tests. Differences in race and sex distributions between obese and non-obese groups were assessed with Chi-square tests. Voxel-wise analyses compared DTI- and DBSI-derived metrics between obese and non-obese groups within each cohort separately, using GLM controlling for age, sex, race, and TRACULA-derived motion parameters (volume-by-volume translation and rotation). Further voxelwise GLM analyses determined whether BMI related to DBSI metrics of interest within each group in both cohorts. For each GLM, the FSL statistical package Randomize (Winkler et al., 2014) was used to correct for multiple comparisons via a TFCE approach with a family-wise error rate derived from 5000 Monte Carlo permutations (Nichols and Holmes, 2002). Statistical significance was thresholded at corrected p ≤ 0.05. Average hippocampal and amygdalar DTI- and DBSI-derived metrics were compared between obese and non-obese groups, within each cohort separately, using a multiple linear regression model with age, sex, race, average hippocampal or amgydalar volume, and motion parameters as covariates. Additionally, in Cohort 2, we used partial Pearson r correlations controlling for age to relate main DBSI outcomes in the hippocampus and amygdala with performance on cognitive tasks. It was not expected that these exploratory correlational analyses would survive multiple comparison correction [0.05/(19 tests × 2 brain regions) = 0.0013]. Differences in cognitive performance between obese and non-obese individuals in Cohort 2 were assessed with two-tailed between-subjects Student’s t-tests.
Results
Participants
Participant demographics and descriptive statistics for Cohort 1 and Cohort 2 are shown in Table 1.
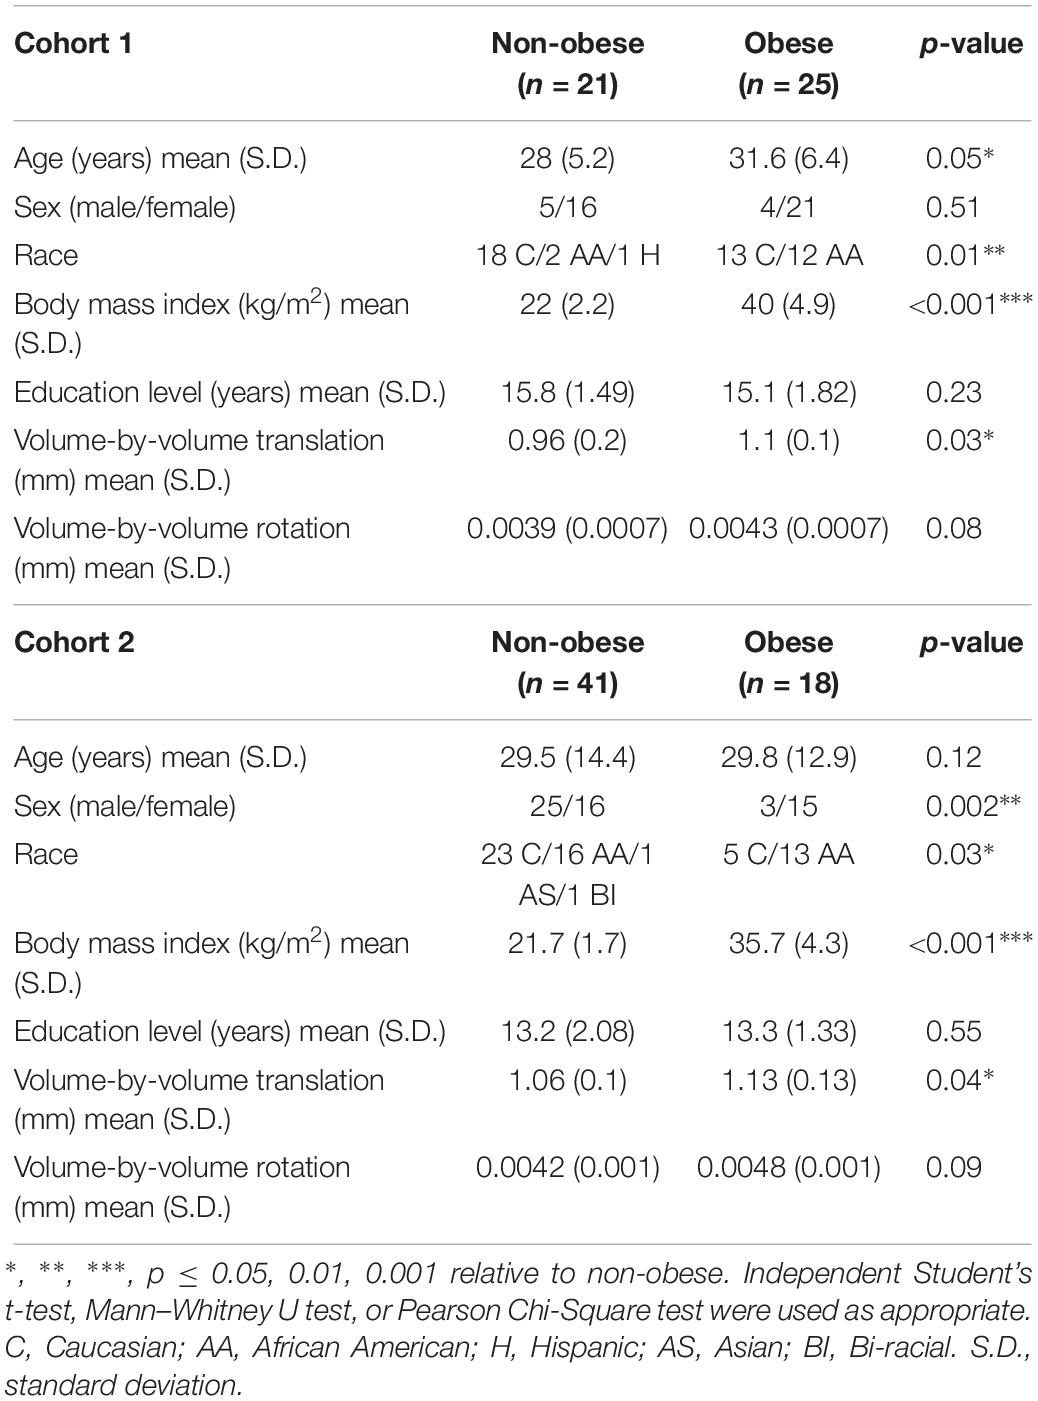
Table 1. Demographic data and TRACULA-derived motion parameters for obese and non-obese participants in Cohort 1 and Cohort 2.
Cohort 1: Twenty-five obese (BMI = 33.4–51 kg/m2) and twenty-one non-obese (BMI = 18.6–25.9 kg/m2) participants contributed DTI scans for analyses. Data from two individuals whose BMIs were 25.1 and 25.9 kg/m2 were included as non-obese since they met criteria for normal percent body fat and other metabolic parameters. Obese participants were older than non-obese participants and had a larger proportion of African Americans compared to the non-obese group. Non-obese and obese groups did not differ in sex distribution or years of education.
Cohort 2: Eighteen obese (BMI = 30–43 kg/m2) and forty-one non-obese (BMI = 18.5–25 kg/m2) participants contributed DTI scans for analyses. Sex and race distributions differed between obese and non-obese groups such that there were higher proportions of females and African Americans in the obese group. Obese and non-obese groups did not differ in age or years of education.
Motion Parameters
TRACULA-derived motion parameters for Cohort 1 and Cohort 2 are shown in Table 1. In both cohorts, the obese group required greater volume-by-volume translation for motion correction during the DTI scans. However, neither this measure nor volume-by-volume rotation related to BMI within non-obese (r ≤ 0.31, p ≥ 0.18) or obese (r ≤ 0.21, p ≥ 0.40) groups in either cohort.
Voxel-Wise Comparison of DBSI and DTI Metrics
Cohort 1: In TBSS analyses that covaried age, sex, race, and motion parameters, DBSI-FA was lower in obese compared to non-obese individuals, while DBSI-AD and RD were greater in obese compared to non-obese individuals (Figures 1A–C). DBSI-FF was lower in obese compared to non-obese individuals (Figure 1D) while DBSI-RF and DBSI-HF were greater in obese compared to non-obese individuals (Figures 1E,F). Lower DTI-FA and DTI-AD were observed in obese compared to non-obese individuals (Figure 2A). DTI-MD and DTI-RD were not significantly different between obese and non-obese individuals (data not shown).
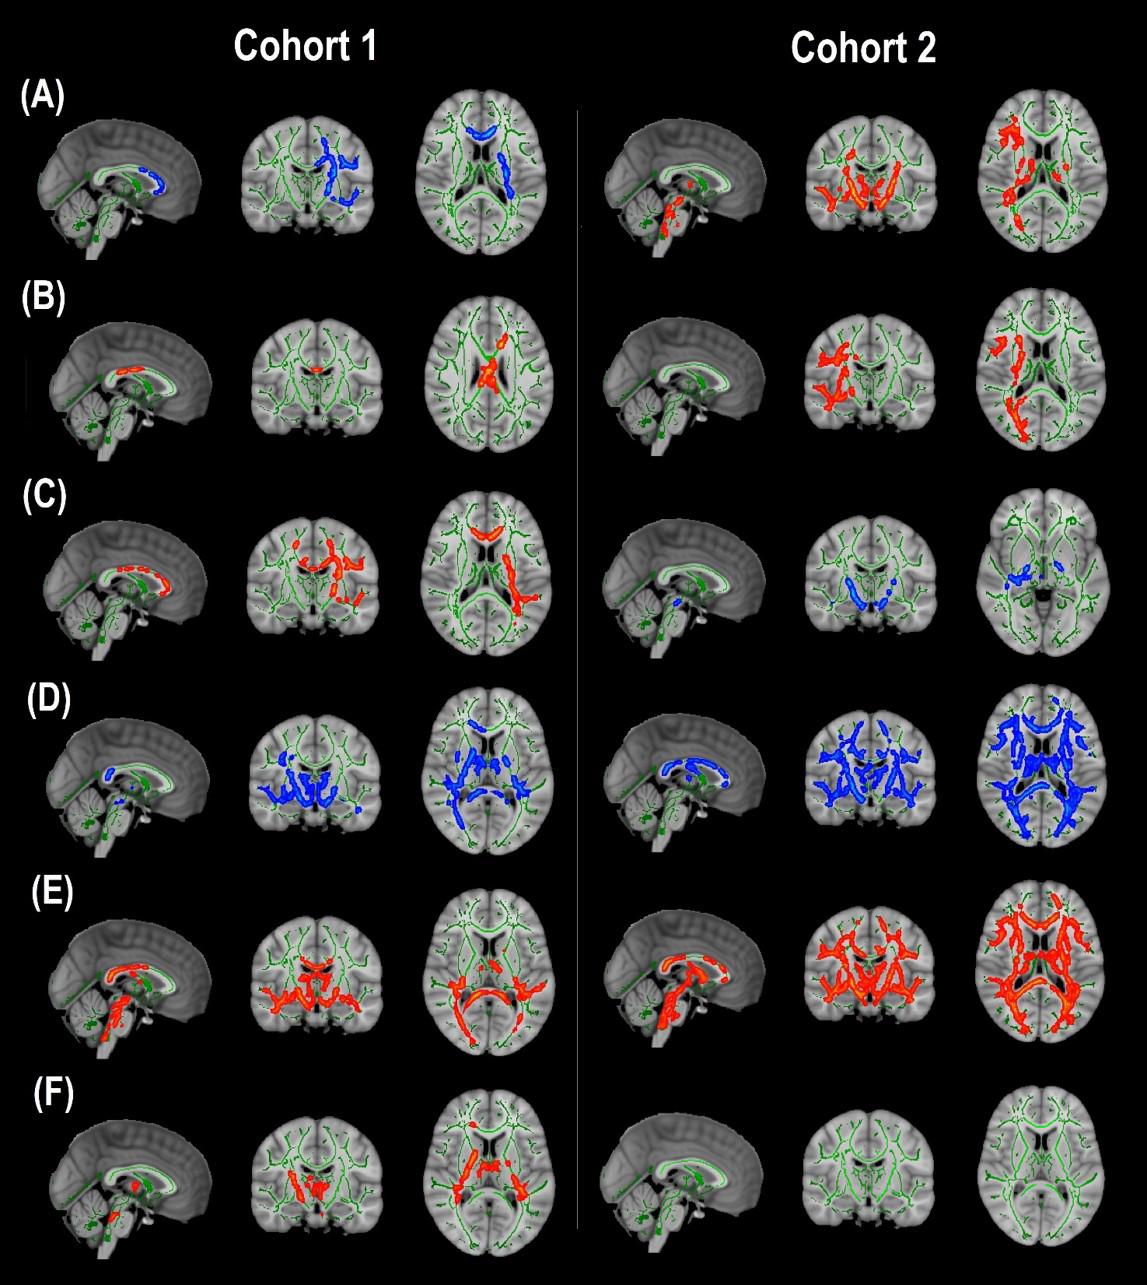
Figure 1. Diffusion basis spectrum imaging-derived measures of white matter integrity and indicators of neuroinflammation in Cohort 1 and Cohort 2. (A) DBSI-derived fractional anisotropy. (B) DBSI-derived axial diffusivity. (C) DBSI-derived radial diffusivity. (D) DBSI-derived fiber fraction. (E) DBSI-derived restricted fraction. (F) DBSI-derived hindered fraction. Green, white matter skeleton; red-yellow, obese greater than non-obese group (p < 0.05, corrected); blue-light blue, obese lower than non-obese group (p < 0.05, corrected).
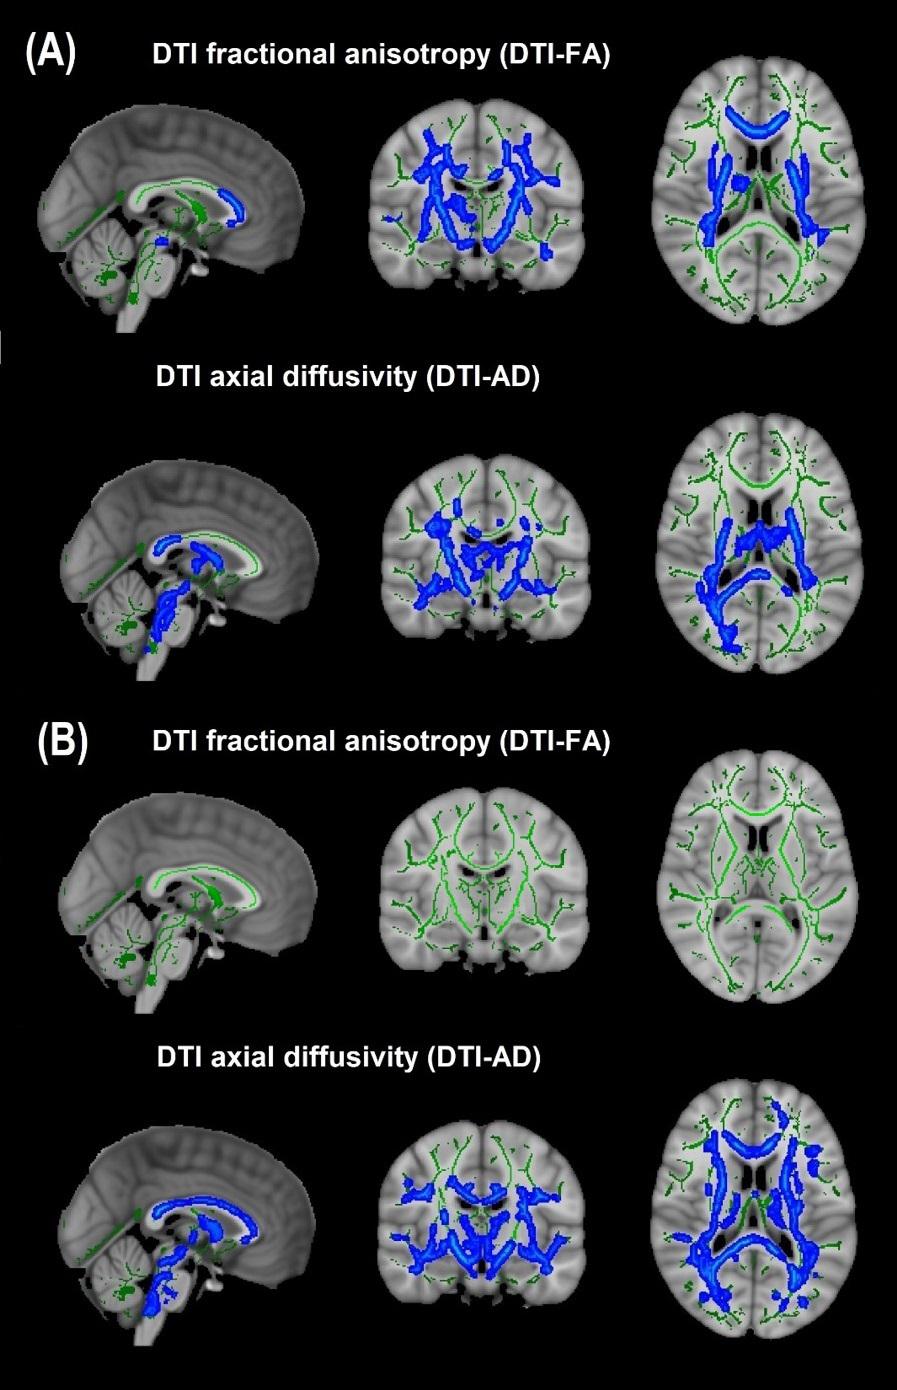
Figure 2. Diffusion tensor imaging-derived measures of white matter integrity in Cohort 1 and Cohort 2. (A) Cohort 1: Obese individuals had lower white matter fractional anisotropy (FA) and axial diffusivity (AD) than non-obese individuals. (B) Cohort 2: Obese individuals had similar white matter FA but lower AD than non-obese individuals. Green, white matter skeleton; blue-light blue, obese lower than non-obese group (p < 0.05, corrected).
Cohort 2: In TBSS analyses that covaried age, sex, race, and motion parameters, similar to Cohort 1, the obese group had lower DBSI-FF and greater DBSI-RF when compared to the non-obese group (Figures 1D,E). DBSI-FA and DBSI-AD were greater in the obese compared to the non-obese group while DBSI-RD was lower in the obese group compared to the non-obese group (Figures 1A–C). DBSI-HF did not differ between obese and non-obese groups. DTI-AD was lower in the obese compared to the non-obese group (Figure 2B). DTI-FA (Figure 2B), DTI-MD and DTI-RD were not significantly different between obese and non-obese individuals (data not shown).
For the group differences in DBSI-FF and DBSI-RF, we determined the degree to which WM tracts overlapped in both cohorts (Figure 3). Differences in DBSI-RF and DBSI-FF were observed in widespread WM tracts and the percentage of overlap between both cohorts in all 48 WM tracts are included in Supplementary Table 1, in which columns are sorted in descending order according to the number of voxels that overlap for DBSI-RF.
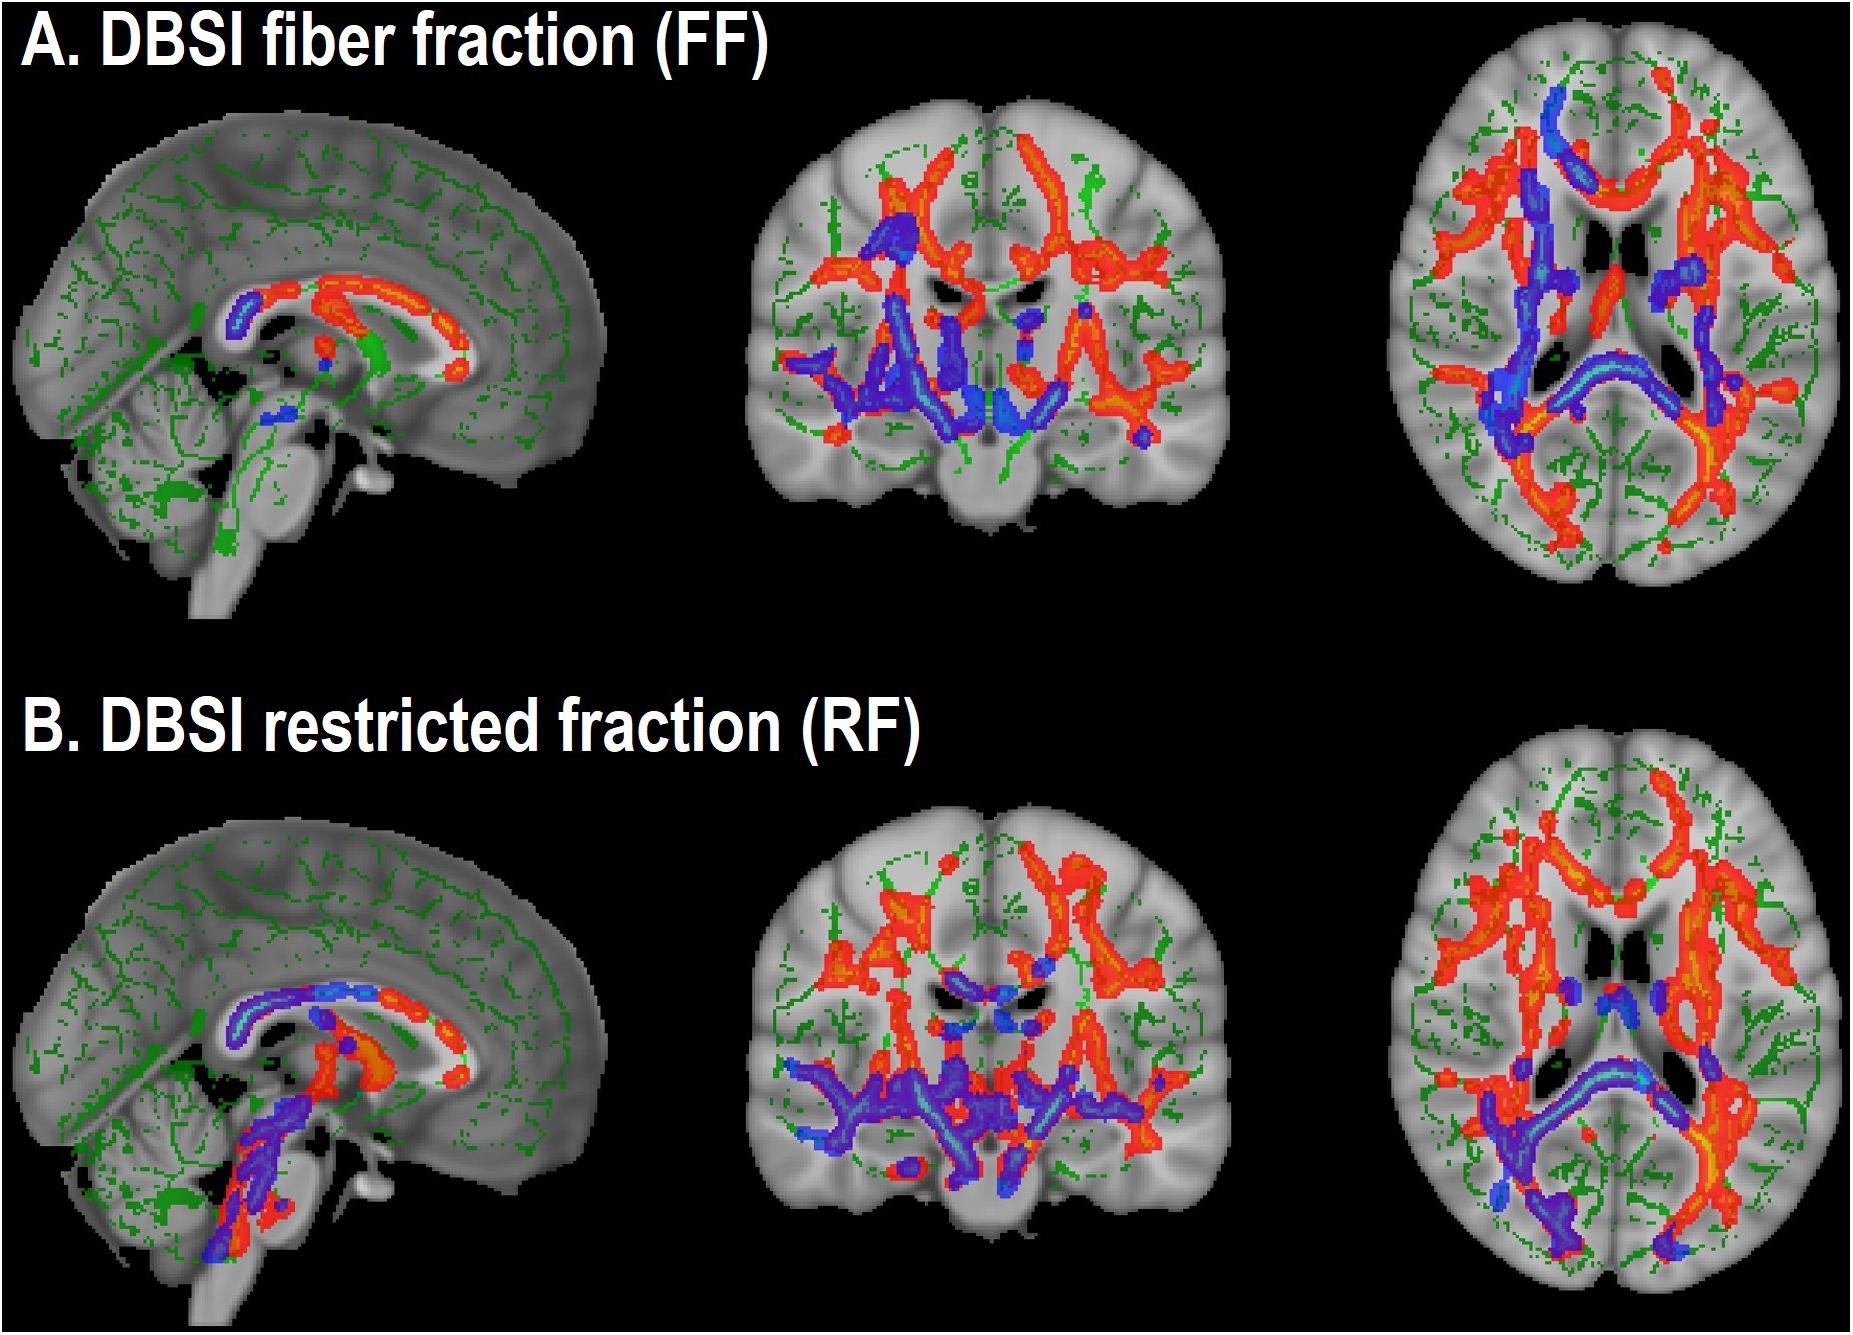
Figure 3. Overlap in white matter tracts with significant differences between obese and non-obese groups in both cohorts (Cohort 1: Blue-purple; Cohort 2: Red-yellow). (A) Lower DBSI fiber fraction in obese compared to non-obese. (B) Greater DBSI restricted fraction in obese compared to non-obese.
Voxelwise Correlations Between BMI and DBSI Metrics of Interest
Higher BMI related to greater voxelwise DBSI-RF in WM tracts within obese and non-obese groups in Cohort 1 but not within either group in Cohort 2. BMI did not relate to voxelwise DBSI-FF in WM tracts in either group in either cohort (data not shown).
ROI Analyses of Hippocampal and Amygdalar DBSI Metrics
In both Cohort 1 and Cohort 2, we compared average hippocampal and amygdalar volumes and hippocampal and amygdalar DBSI-derived metrics (DBSI-FA, DBSI-AD, DBSI-RD, DBSI-FF, DBSI-RF, DBSI-HF) between obese and non-obese groups using multiple linear regression, covarying for age, sex, race, average hippocampal or amygdalar volumes, and motion measures (volume-by-volume translation and rotation) (Figure 4 and Tables 2, 3). In Cohort 1, hippocampal DBSI-RF was greater in the obese group when compared to the non-obese group (Cohen’s d effect size = 1.03; 19.7% increase). Amygdalar DBSI metrics were not different between obese and non-obese groups in Cohort 1. In Cohort 2, hippocampal DBSI-AD and DBSI-RF were greater in the obese compared to the non-obese group (Cohen’s d effect sizes = 0.59 and 0.70, 3.4% increase and 12.2% increase, respectively) and amygdalar DBSI-FF and DBSI-RF were lower and greater in the obese compared to the non-obese group, respectively (Cohen’s d effect sizes = 1.2 for both comparisons, 8.3% decrease and 22% increase, respectively). Amygdalar volume was larger in obese relative to non-obese individuals in both cohorts. Hippocampal volumes and other DBSI-derived metrics were not different between obese and non-obese individuals in either cohort.

Figure 4. Comparison of DBSI metrics in the hippocampus (A,B) and amygdala (C,D) between obese and non-obese groups in Cohort 1 and Cohort 2. FA, fractional anisotropy; AD, axial diffusivity; RD, radial diffusivity; FF, fiber fraction; HF, hindered fraction. Median, first and third quartiles, 1.5 × interquartile range shown. ∗, ∗∗, p ≤ 0.05, 0.01, respectively.
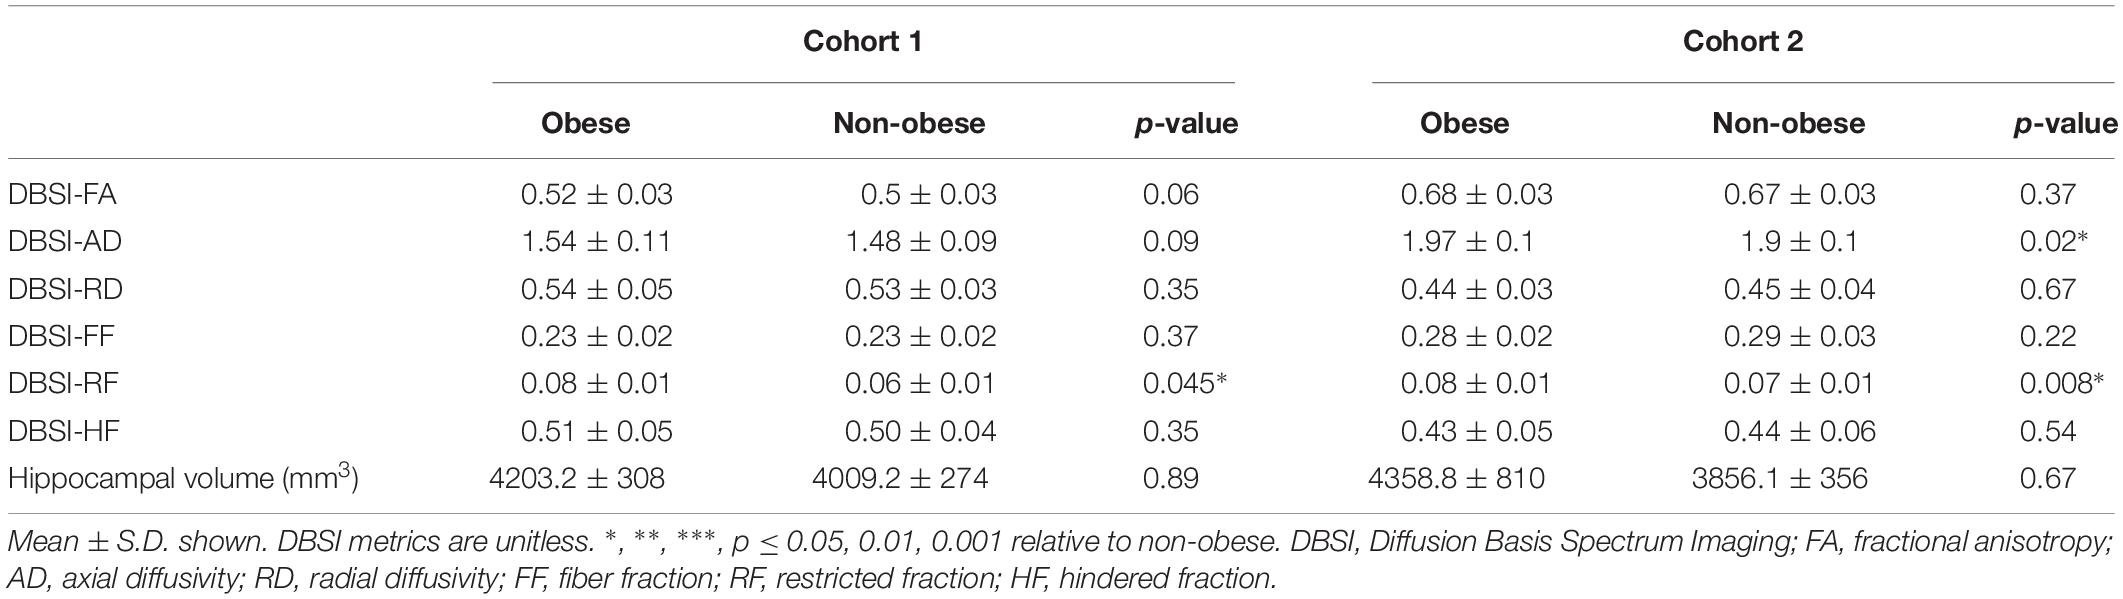
Table 2. Hippocampal DBSI metrics and volumes in obese and non-obese groups in Cohort 1 and Cohort 2.
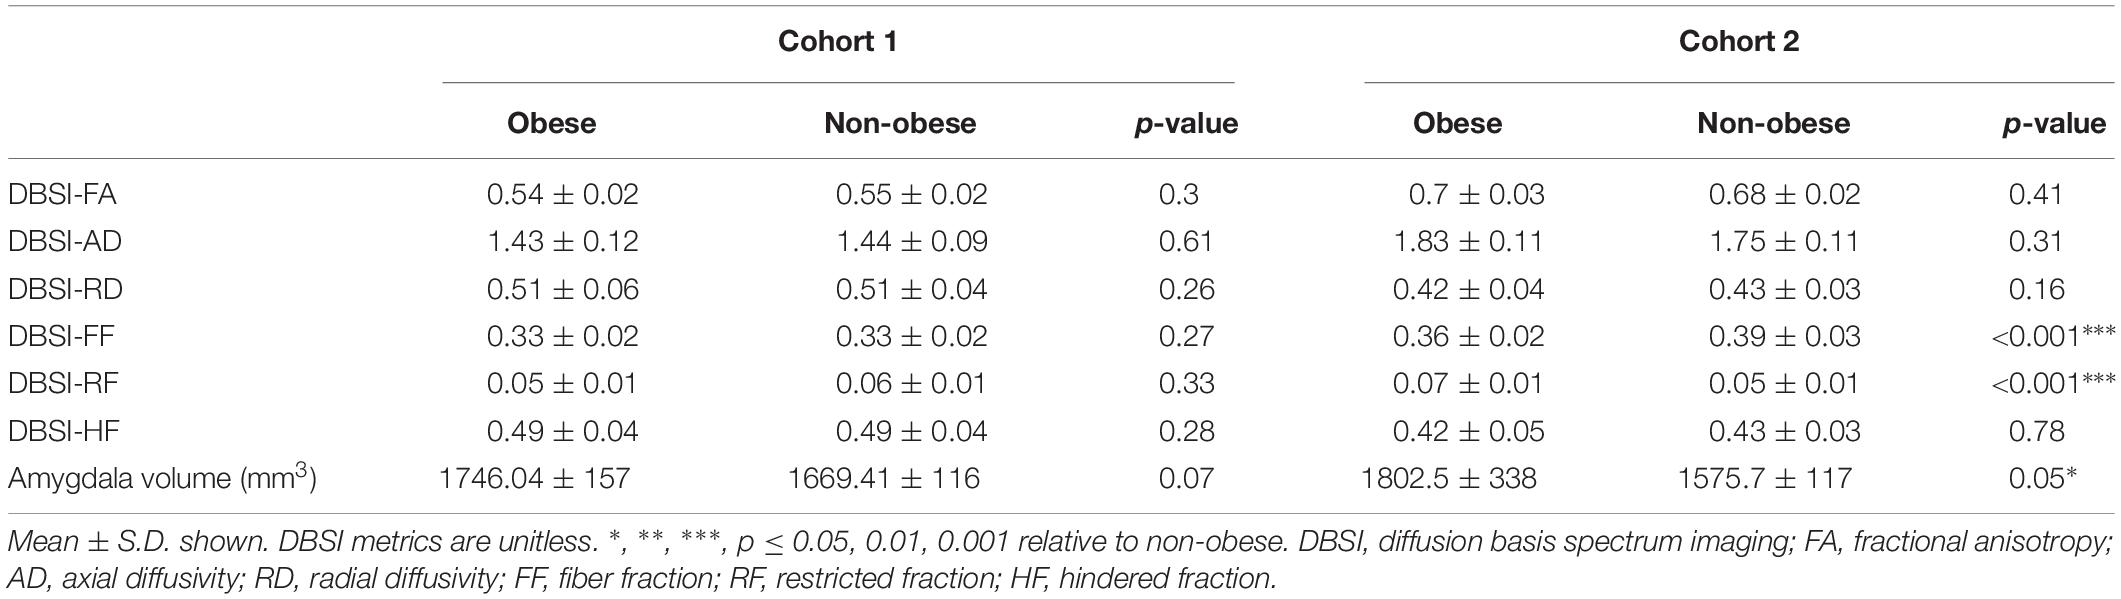
Table 3. Amygdalar DBSI metrics and volumes in obese and non-obese groups in Cohort 1 and Cohort 2.
Cognitive Correlations With Hippocampal and Amygdalar DBSI-RF and DBSI-FF
Scores from cognitive measures acquired from Cohort 2 were correlated across obese and non-obese individuals with DBSI-RF and DBSI FF in the hippocampus and amygdala, controlling for age (Figure 5). Eighteen cognitive measures had enough data points to be included in these exploratory analyses. BVMT, WAIS-III digit span subtest and FTT for the non-dominant hand performances were not included due to insufficient data points (≥20 subjects did not have one or more of these data points). All other correlations between ROI DBSI-FF or DBSI-RF and cognitive measures were not significant (p ≥ 0.06; data not shown). Also, we compared cognitive measure scores to assess between-group differences (data not shown). The obese group showed lower total recall (HVLT total recall, p = 0.02) and lower delayed verbal recall (HVLT delayed recall; p = 0.007), while no differences were observed in other cognitive measures (p ≥ 0.11).
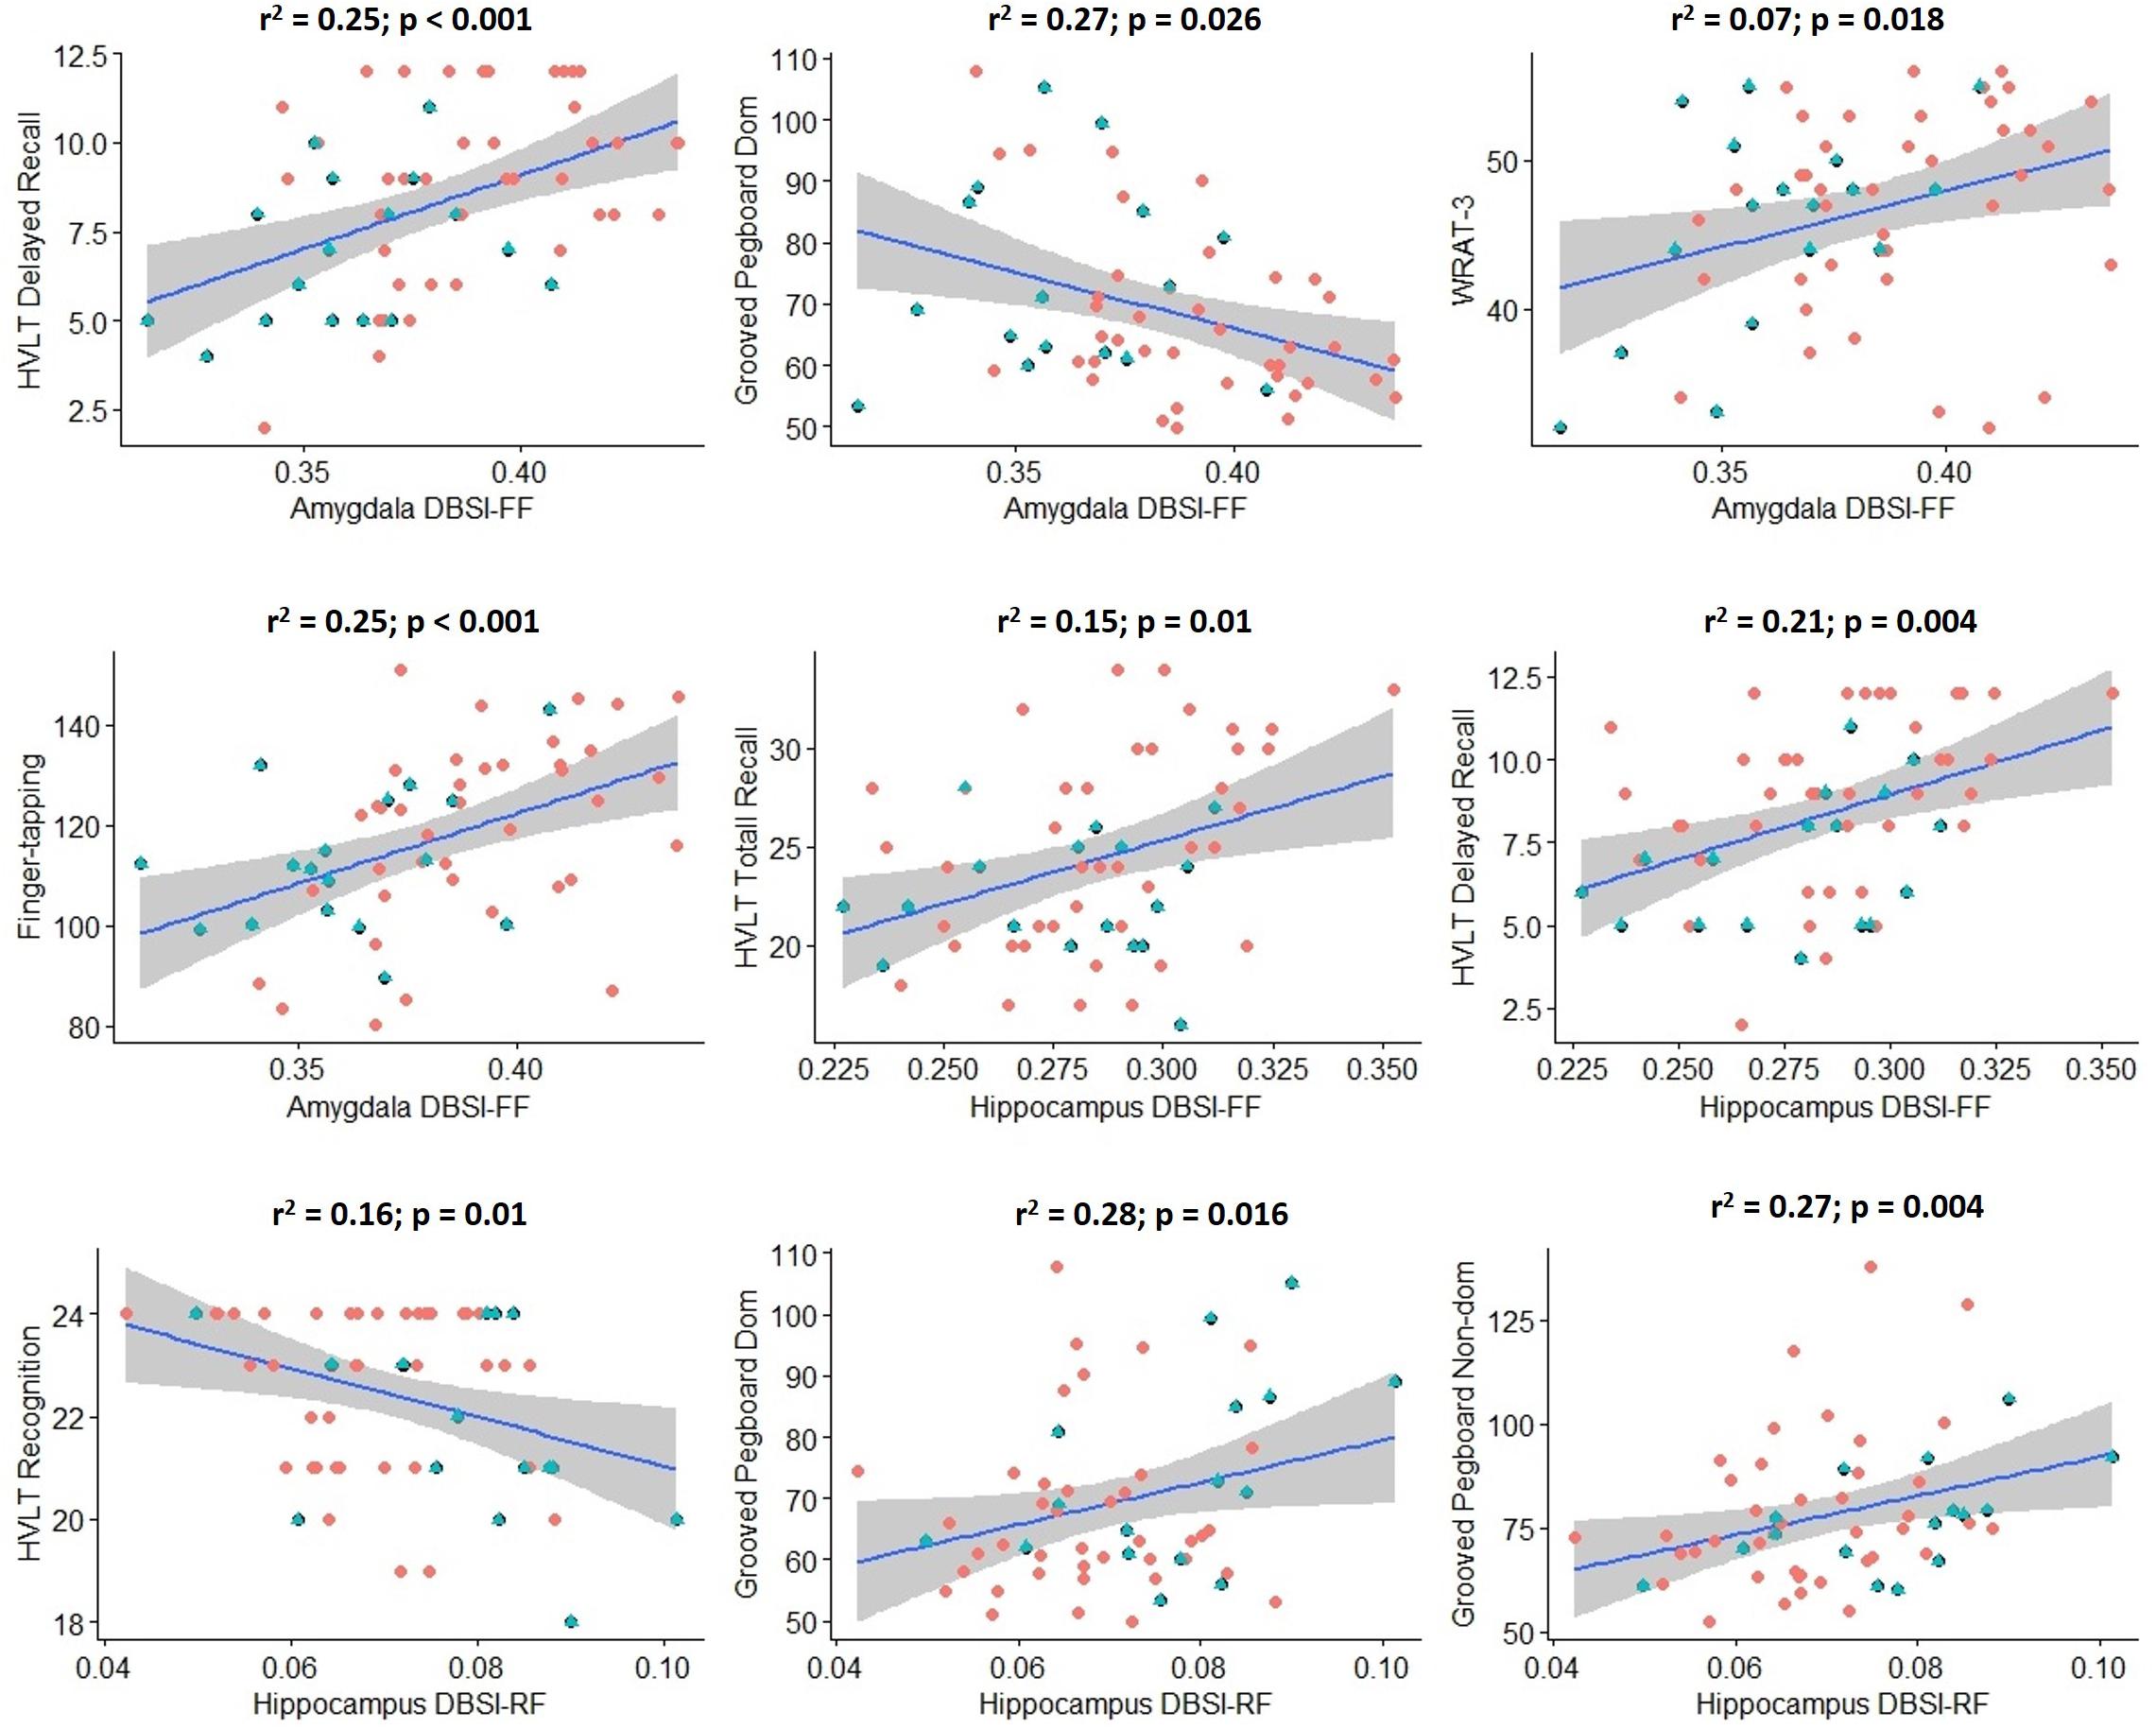
Figure 5. Significant correlations between hippocampus/amygdala DBSI fiber fraction and DBSI restricted fraction with performance in key measures of cognition in Cohort 2 (blue: obese; red: non-obese). Shaded area surrounding regression lines are 95% confidence intervals). DBSI-FF, fiber fraction; DBSI-RF, restricted fraction; HVLT, Hopkins Verbal Learning Test; WRAT-3, Wide Range Achievement Test 3; Dom, dominant; Non-dom, Non-dominant.
Discussion
The findings of our current study indicate the presence of diffuse neuroinflammation (greater DBSI-RF) in several WM tracts and hippocampus in both cohorts and amygdala in Cohort 2 and lower apparent axonal density (DBSI-FF) in several WM tracts in both cohorts and amygdala in Cohort 2 in obese individuals as assessed by DBSI. Additionally, obese groups had consistently higher DBSI-AD when compared to non-obese groups, but DBSI-FA and DBSI-RD were inconsistent across cohorts (lower DBSI-FA and greater DBSI-RD in Cohort 1; greater DBSI-FA and lower DBSI-RD in Cohort 2). These findings might also indicate that neuroinflammation-related processes (cellular infiltration and tissue edema) could have confounded DTI-derived metrics. Exploratory analyses showed correlations between hippocampal and amygdalar DBSI-RF or DBSI-FF and some cognitive variables in Cohort 2.
Comparison Between DTI and DBSI Findings in Obesity
Diffusion tensor imaging has been extensively used to evaluate WM microstructure changes associated with obesity. Consistently, lower DTI-FA has been observed in obese compared to non-obese groups (Kullmann et al., 2015), while DTI-AD and DTI-RD alterations have been mixed (Mueller et al., 2011; Xu et al., 2013; Kullmann et al., 2016; Mazza et al., 2017; Papageorgiou et al., 2017). In our study, in several WM tracts, DTI-AD was lower in obese groups in both cohorts, DTI-FA was lower in the obese group in Cohort 1, while DTI-RD was not different between groups in either cohort. Using the traditional interpretation of DTI results, these findings indicate impaired overall WM integrity and axonal injury in the obese groups. Because DTI models both intra-axonal and extra-axonal water diffusion, cellularity associated with obesity might lead to decreased diffusion in all directions, resulting in the observed decrease in DTI-AD even without the presence of axonal injury. When isotropic diffusion was accounted for in the DBSI modeling, DBSI-AD was slightly greater in the obese groups in both cohorts, which could indicate increased water diffusion parallel to the axons in the extracellular compartment as a result of increased tissue edema. The presence of tissue edema could also contribute to the lower apparent axonal density (lower DBSI-FF) in the obese groups. These findings indicate that neuroinflammation-related processes (cellular infiltration and tissue edema) could have confounded DTI-derived metrics. This notion was previously suggested by some authors and demonstrated by histopathological studies in animal models of neuroinflammatory diseases (Wang et al., 2014; Cross and Song, 2017; Winklewski et al., 2018; Zhan et al., 2018).
The inconsistent differences in DBSI-FA and DBSI-RD (lower DBSI-FA and greater DBSI-RD in Cohort 1; greater DBSI-FA and lower DBSI-RD in Cohort 2) could also support the hypothesis that different biological processes may underlie obesity-related WM microstructure alterations (Haley et al., 2018). In each cohort, the pattern of change in DBSI-FA, DBSI-AD, and DBSI-RD might represent a different stage of WM reorganization post-injury. This hypothesis has been used to explain the bi-directional changes in DTI-FA in other conditions (e.g., a rodent model of traumatic brain injury) (Harris et al., 2016). In the case of obesity, the underlying mechanism could be an ongoing process of WM structural reorganization (demyelination/remyelination, loss of long WM tracts, axon sprouting) associated with persistent neuroinflammatory process. Nevertheless, although this hypothesis is a plausible explanation for the inconsistent diffusivity differences observed in our study, these differences might also be due to between-cohort differences in hardware used, such as head coils, and DTI acquisition parameters or participant characteristics due to sample selection criteria. As mentioned above, while DTI data from Cohort 2 participants were primarily selected from a convenience sample comprising the HIV- control group of an HIV neuroimaging study, Cohort 1 participants were selected specifically for a study of brain alterations in obesity unconfounded by current or past co-morbid disease. Therefore, more stringent screening for diabetes, mental illness, substance and alcohol abuse, and IQ/education was performed in Cohort 1 relative to Cohort 2. We excluded individuals with diabetes in order to study neuroinflammation in obesity per se, unconfounded by hyperglycemia and insulin resistance, factors already linked to neuroinflammation (Pugazhenthi et al., 2017). More rigorous experimental designs are necessary to confirm the validity of these hypotheses and to determine what non-BMI factors relate to DBSI measures.
Histopathological Abnormalities Associated With Neuroinflammation in Obesity
In obese groups, greater DBSI-RF in WM tracts and hippocampus presumably reflect an increase in CNS resident inflammatory cells. Significant increases in glial fibrillary acidic protein (GFAP) immunoreactive astrocytes were observed in the hippocampus and frontal and parietal cortices in rodent models of obesity (Tomassoni et al., 2013). Evidence of increased gliosis was observed in the mediobasal hypothalamus of living obese humans assessed by MRI (Thaler et al., 2012; Schur et al., 2015), which related to greater post-mortem GFAP staining intensity (Schur et al., 2015). Peripheral inflammation as indicated by plasma fibrinogen related to alterations in DTI-measured apparent diffusivity in the amygdala (Cazettes et al., 2011). In several rodent studies, obesity-induced microglia activation and other types of neuroinflammation were frequently observed in hypothalamus, hippocampus, amygdala, and other brain regions (Erion et al., 2014; Tucsek et al., 2014; Guillemot-Legris and Muccioli, 2017). Obesity-related microglial activation in rodents mediates the relationship between synaptic dysfunction and cognitive deficits, which are blocked by inhibition of microglial activation (Erion et al., 2014; Cope et al., 2018). Reversal of obesity-related macrophage infiltration into leaky BBB improves obesity-associated cognitive dysfunction (Stranahan et al., 2016). Since DBSI doesn’t distinguish different cell types, it would be necessary to perform validation studies, e.g., correlation of DBSI-derived metrics with histopathological measures of neuroinflammation in rodent models of obesity and in human postmortem brain, to confirm that these altered properties truly reflect neuroinflammation and detect which cell types are responsible for the observed changes in DBSI-RF in our study.
Interestingly, in Cohort 1, DBSI-HF was greater in obese compared to non-obese individuals. DBSI-HF models non-restricted water diffusion in the extracellular compartment and reflects tissue edema in acute neuroinflammatory conditions (Wang et al., 2011; Wang et al., 2014; Zhan et al., 2018). In the case of possible chronic neuroinflammation in disease states such as obesity, histopathological evaluation is needed to determine the mechanism that underlies greater DBSI-HF.
Neuroinflammation, Axonal Density, and Cognitive Performance
In the current study, we showed that DBSI-RF, an indicator of neuroinflammation, and DBSI-FF, an indicator of axonal density, in hippocampus and amygdala related to cognitive performance in some measures. These results are in line with studies in which impaired performance on memory tasks is induced by hippocampal neuroinflammation in rodents with diet-induced obesity (Pistell et al., 2010; Beilharz et al., 2016; Cope et al., 2018) and the observed association between plasma fibrinogen and water diffusion in the amygdala in obese and overweight individuals (Cazettes et al., 2011). The current results suggest altered water diffusivity in the brain, and perhaps neuroinflammation, may relate to altered cognitive performance. However, these data should be considered preliminary since analyses were exploratory and not corrected for multiple comparisons. Future studies may determine whether putative neuroinflammation modulates the relationship between BMI and cognitive performance.
Limitations and Future Directions
The primary strength of the current study is the replication of the findings that DBSI-RF, a putative marker of neuroinflammation, and DBSI-FF, a marker of axonal density, are greater and lower, respectively, in obese than non-obese individuals in two independent cohorts. The main weakness of this study is that data were not available to link DBSI metrics to alterations in inflammation-related behavior or proinflammatory cytokines in plasma or CSF. Without histopathological validation, though plausible, it remains speculative that the DBSI-measured alterations truly reflect neuroinflammation. Previous studies showed that DBSI-RF is associated with activated microglia and astrogliosis in several neuroinflammatory conditions (Wang et al., 2011; Chiang et al., 2014; Wang et al., 2014) but this has not been examined in obesity. Interestingly, the regions of increased DBSI-RF and decreased DBSI-FF in obese individuals in Cohort 1, from a study designed to test for differences in the brain due to obesity unconfounded by other health issues, falls almost entirely within the regions of the findings from obese individuals in Cohort 2, a convenience sample, as described above. Lack of convergent findings for some DBSI anisotropic metrics could be due to variations in stage of WM reorganization and differences between cohorts including participant characteristics and DTI sequence parameters, as discussed above. A third weakness is that age, sex and race distributions differed between obese and non-obese individuals in one or both cohorts. There are age, sex, and racial differences in adiposity and associated traits including systemic inflammation severity due to physiological, social and psychological factors (Thorand et al., 2006; Stepanikova et al., 2017a, b). While we controlled for age, sex and race in our data analyses, we cannot rule out the possibility that differences between groups in these factors contributed to our results. Clearly, age, sex, and race should be included in future studies as variables of primary interest with sufficient sample size to power these studies. DTI sequence parameters were slightly different between cohorts, which prevented us from combining data across cohorts. Future studies should be prospective in nature, include larger sample sizes and obtain complimentary measures of neuroinflammation using PET with radiotracers specific for activated microglia, plasma and CSF inflammatory marker levels, and measures of cognitive function. Also, studies of animal models of obesity would allow for histopathological validation of DBSI metrics.
Conclusion
In two independent cohorts, we showed that a DBSI-derived indicator of neuroinflammation is greater and axonal density is lower in obese compared to non-obese humans. In addition, the discrepancies between DBSI- and DTI-derived anisotropic metrics demonstrate the limitations of DTI when applied to disease states that may be accompanied by neuroinflammation. Additionally, these findings highlight the significance of applying multi-component models of diffusion imaging in these populations. Future studies are warranted to determine whether high-calorie diet-induced neuroinflammation occurs in ROIs outside hippocampus, amygdala, and hypothalamus and its potential role in obesity-associated impairment in behaviors thought to be regulated by these regions. Finally, the results of the current study indicate that putative neuroinflammation and associated cognitive impairment occurs even in obese individuals without diabetes. Given the evidence implicating diabetes in the development of neuroinflammation and cognitive impairment (Pugazhenthi et al., 2017), it will be important to assess relationships between metabolic markers, cognition, and MRI-derived neuroinflammation metrics in individuals who do and do not develop insulin resistance over time. Also, further histopathological studies in postmortem brain are necessary to confirm that the altered DBSI properties we observed in obese humans truly reflect neuroinflammatory processes.
Data Availability Statement
The datasets generated and used to perform analyses for this study are available upon a request to the corresponding author.
Ethics Statement
All studies were approved by the Washington University School of Medicine Human Research Protection Office and were carried out in accordance with the principles expressed in the Declaration of Helsinki.
Author Contributions
TH, NS, and SE contributed to the conception of the study. NS, JS, PS, JSS, BA, S-KS, TH, and SE provided the imaging datasets and the expertise in neuroimaging. AS, TM, JR, ON, NS, and SE conducted pre-processing, neuroimaging, and statistical analysis. AS, TM, and SE wrote the initial draft of the manuscript. All authors critically revised the manuscript, contributed to the interpretation of the results, and approved the final version.
Funding
The studies presented in this work were conducted using the Center for Clinical Imaging Research (CCIR) located at the Washington University Medical Center. This research was funded by the National Institutes of Health (grant numbers R01 DK-085575, 2T32HL007456-26, R01NR01449, R01NR015738, and P30 DK020579 to the Washington University Diabetes Research Center), National Institute on Drug Abuse (grant number 5T32DA007261-27), Clinical and Translational Science Awards (CTSA) Program (grant number UL1 RR024992), and Washington University Summer Undergraduate Research Award (SURA). Support was also provided by the Eunice Kennedy Shriver National Institute of Child Health and Human Development of the National Institutes of Health to the Intellectual and Developmental Disabilities Research Center at Washington University NIH U54 HD087011. The funders had no role in study design, data collection and analysis, decision to publish, or preparation of the manuscript.
Conflict of Interest
The authors declare that the research was conducted in the absence of any commercial or financial relationships that could be construed as a potential conflict of interest.
Supplementary Material
The Supplementary Material for this article can be found online at: https://www.frontiersin.org/articles/10.3389/fnhum.2019.00464/full#supplementary-material
Abbreviations
AD, axial diffusivity; BBB, blood-brain barrier; BMI, body mass index; CNS, central nervous system; CSF, cerebrospinal fluid; DBSI, Diffusion basis spectrum imaging; DTI, diffusion tensor imaging; FA, fractional anisotropy; FF, fiber fraction; GLM, general linear model; HF, hindered fraction; ICV, intra-cranial volume; MRI, magnetic resonance imaging; MS, multiple sclerosis; PET, positron emission tomography; RD, radial diffusivity; RF, restricted fraction; ROI, region of interest analysis; TBSS, tract-based spatial statistics; TFCE, Threshold-Free Cluster Enhancement; TSPO, translocator protein; WM, white matter
Footnotes
References
Alam, M. M., Lee, J., and Lee, S. Y. (2017). Recent progress in the development of TSPO PET ligands for neuroinflammation imaging in Neurological Diseases. Nucl. Med. Mol. Imaging 51, 283–296. doi: 10.1007/s13139-017-0475-8
Alfaro, F. J., Gavrieli, A., Saade-Lemus, P., Lioutas, V. A., Upadhyay, J., and Novak, V. (2018). White matter microstructure and cognitive decline in metabolic syndrome: a review of diffusion tensor imaging. Metabolism 78, 52–68. doi: 10.1016/j.metabol.2017.08.009
Alford, S., Patel, D., Perakakis, N., and Mantzoros, C. S. (2018). Obesity as a risk factor for Alzheimer’s disease: weighing the evidence. Obes. Rev. 19, 269–280. doi: 10.1111/obr.12629
American Diabetes Association (2016). 2. Classification and diagnosis of Diabetes. Diabetes Care 39, S13–S22.
Baser, C. A., and Ruff, R. M. (1987). Construct validity of the San Diego neuropsychological test battery. Arch. Clin. Neuropsychol. 2, 13–32. doi: 10.1016/0887-6177(87)90031-x
Baufeld, C., Osterloh, A., Prokop, S., Miller, K. R., and Heppner, F. L. (2016). High-fat diet-induced brain region-specific phenotypic spectrum of CNS resident microglia. Acta Neuropathol. 132, 361–375. doi: 10.1007/s00401-016-1595-4
Beck, A. T., Steer, R. A., and Brown, G. K. (1996). Manual for The Beck Depression Inventory-II. San Antonio, TX: Psychological Corporation.
Beilharz, J. E., Maniam, J., and Morris, M. J. (2016). Short-term exposure to a diet high in fat and sugar, or liquid sugar, selectively impairs hippocampal-dependent memory, with differential impacts on inflammation. Behav. Brain Res. 306, 1–7. doi: 10.1016/j.bbr.2016.03.018
Benedict, R. H. B. (1997). Brief Visuospatial Memory Test - Revised: Professional Manual. Lutz, FL: Psychological Assessment Resources, Inc.
Benton, A. L., and Hamsher, K. (1976). Multilingual Aphasia Examination: Manual of Instruction. Iowa City, IA: University of Iowa.
Bolzenius, J. D., Laidlaw, D. H., Cabeen, R. P., Conturo, T. E., Mcmichael, A. R., Lane, E. M., et al. (2015). Brain structure and cognitive correlates of body mass index in healthy older adults. Behav. Brain Res. 278, 342–347. doi: 10.1016/j.bbr.2014.10.010
Brandt, J. (1991). The Hopkins verbal learning test: development of a new memory test with six equivalent forms. Clin. Neuropsychol. 5, 125–142. doi: 10.1080/13854049108403297
Cazettes, F., Cohen, J. I., Yau, P. L., Talbot, H., and Convit, A. (2011). Obesity-mediated inflammation may damage the brain circuit that regulates food intake. Brain Res. 1373, 101–109. doi: 10.1016/j.brainres.2010.12.008
Chiang, C. W., Wang, Y., Sun, P., Lin, T. H., Trinkaus, K., Cross, A. H., et al. (2014). Quantifying white matter tract diffusion parameters in the presence of increased extra-fiber cellularity and vasogenic edema. Neuroimage 101, 310–319. doi: 10.1016/j.neuroimage.2014.06.064
Cope, E. C., Lamarca, E. A., Monari, P. K., Olson, L. B., Martinez, S., Zych, A. D., et al. (2018). Microglia play an active role in obesity-associated cognitive decline. J. Neurosci. 38, 8889–8904. doi: 10.1523/JNEUROSCI.0789-18.2018
Cross, A. H., and Song, S. K. (2017). A new imaging modality to non-invasively assess multiple sclerosis pathology. J. Neuroimmunol. 304, 81–85. doi: 10.1016/j.jneuroim.2016.10.002
Delis, D. C., Kaplan, E., and Kramer, J. H. (2001). Delis-Kaplan Executive Function System (D-KEFS). San Antonio, TX: The Psychological Corporation.
Devoto, F., Zapparoli, L., Bonandrini, R., Berlingeri, M., Ferrulli, A., Luzi, L., et al. (2018). Hungry brains: A meta-analytical review of brain activation imaging studies on food perception and appetite in obese individuals. Neurosci. Biobehav. Rev. 94, 271–285. doi: 10.1016/j.neubiorev.2018.07.017
Eisenstein, S. A., Antenor-Dorsey, J. A., Gredysa, D. M., Koller, J. M., Bihun, E. C., Ranck, S. A., et al. (2013). A comparison of D2 receptor specific binding in obese and normal-weight individuals using PET with (N-[(11)C]methyl)benperidol. Synapse 67, 748–756. doi: 10.1002/syn.21680
Eisenstein, S. A., Bischoff, A. N., Gredysa, D. M., Antenor-Dorsey, J. A., Koller, J. M., Al-Lozi, A., et al. (2015a). Emotional eating phenotype is associated with central dopamine D2 receptor binding independent of body mass index. Sci. Rep. 5:11283. doi: 10.1038/srep11283
Eisenstein, S. A., Gredysa, D. M., Antenor-Dorsey, J. A., Green, L., Arbelaez, A. M., Koller, J. M., et al. (2015b). Insulin, central dopamine D2 receptors, and monetary reward discounting in obesity. PLoS One 10:e0133621. doi: 10.1371/journal.pone.0133621
Erion, J. R., Wosiski-Kuhn, M., Dey, A., Hao, S., Davis, C. L., Pollock, N. K., et al. (2014). Obesity elicits interleukin 1-mediated deficits in hippocampal synaptic plasticity. J. Neurosci. 34, 2618–2631. doi: 10.1523/JNEUROSCI.4200-13.2014
First, M. B., Spitzer, R. L., Gibbon, M., and Williams, J. B. W. (2002). Structured Clinical Interview for DSM-IV-TR Axis I Disorders, Research Version, Patient Edition With Psychotic Screen (SCID-I/P W/PSY SCREEN). New York, NY: New York State Psychiatric Institute.
Frohman, E. M., Racke, M. K., and Raine, C. S. (2006). Multiple sclerosis–the plaque and its pathogenesis. N. Engl. J. Med. 354, 942–955. doi: 10.1056/nejmra052130
Gameiro, F., Perea, M. V., Ladera, V., Rosa, B., and Garcia, R. (2017). Executive functioning in obese individuals waiting for clinical treatment. Psicothema 29, 61–66. doi: 10.7334/psicothema2016.202
Garcia-Garcia, I., Michaud, A., Dadar, M., Zeighami, Y., Neseliler, S., Collins, D. L., et al. (2019). Neuroanatomical differences in obesity: meta-analytic findings and their validation in an independent dataset. Int. J. Obes. 43, 943–951. doi: 10.1038/s41366-018-0164-4
Goodglass, H., and Kaplan, E. (1972). The Assessment of Aphasia and Related Disorders. Philadelphia, PA: Lea and Febiger.
Gregor, M. F., and Hotamisligil, G. S. (2011). Inflammatory mechanisms in obesity. Annu. Rev. Immunol. 29, 415–445. doi: 10.1146/annurev-immunol-031210-101322
Guillemot-Legris, O., Masquelier, J., Everard, A., Cani, P. D., Alhouayek, M., and Muccioli, G. G. (2016). High-fat diet feeding differentially affects the development of inflammation in the central nervous system. J. Neuroinflammation 13:206. doi: 10.1186/s12974-016-0666-8
Guillemot-Legris, O., and Muccioli, G. G. (2017). Obesity-induced neuroinflammation: beyond the hypothalamus. Trends Neurosci. 40, 237–253. doi: 10.1016/j.tins.2017.02.005
Haley, A. P., Oleson, S., Pasha, E., Birdsill, A., Kaur, S., Thompson, J., et al. (2018). Phenotypic heterogeneity of obesity-related brain vulnerability: one-size interventions will not fit all. Ann. N. Y. Acad. Sci. 1428, 89–102. doi: 10.1111/nyas.13673
Harris, N. G., Verley, D. R., Gutman, B. A., and Sutton, R. L. (2016). Bi-directional changes in fractional anisotropy after experiment TBI: Disorganization and reorganization? Neuroimage 133, 129–143. doi: 10.1016/j.neuroimage.2016.03.012
He, Q., Chen, C., Dong, Q., Xue, G., Chen, C., Lu, Z. L., et al. (2015). Gray and white matter structures in the midcingulate cortex region contribute to body mass index in Chinese young adults. Brain Struct. Funct. 220, 319–329. doi: 10.1007/s00429-013-0657-9
Hodgson, K., Poldrack, R. A., Curran, J. E., Knowles, E. E., Mathias, S., Goring, H. H. H., et al. (2017). Shared genetic factors influence head motion during MRI and body mass index. Cereb. Cortex 27, 5539–5546. doi: 10.1093/cercor/bhw321
Karlsson, H. K., Tuulari, J. J., Hirvonen, J., Lepomaki, V., Parkkola, R., Hiltunen, J., et al. (2013). Obesity is associated with white matter atrophy: a combined diffusion tensor imaging and voxel-based morphometric study. Obesity 21, 2530–2537. doi: 10.1002/oby.20386
Kreutzer, C., Peters, S., Schulte, D. M., Fangmann, D., Turk, K., Wolff, S., et al. (2017). Hypothalamic inflammation in human obesity is mediated by environmental and genetic factors. Diabetes 66, 2407–2415. doi: 10.2337/db17-0067
Kullmann, S., Callaghan, M. F., Heni, M., Weiskopf, N., Scheffler, K., Haring, H. U., et al. (2016). Specific white matter tissue microstructure changes associated with obesity. Neuroimage 125, 36–44. doi: 10.1016/j.neuroimage.2015.10.006
Kullmann, S., Schweizer, F., Veit, R., Fritsche, A., and Preissl, H. (2015). Compromised white matter integrity in obesity. Obes. Rev. 16, 273–281. doi: 10.1111/obr.12248
Lauridsen, J. K., Olesen, R. H., Vendelbo, J., Hyde, T. M., Kleinman, J. E., Bibby, B. M., et al. (2017). High BMI levels associate with reduced mRNA expression of IL10 and increased mRNA expression of iNOS (NOS2) in human frontal cortex. Transl. Psychiatry 7:e1044. doi: 10.1038/tp.2016.259
Lin, T. H., Chiang, C. W., Perez-Torres, C. J., Sun, P., Wallendorf, M., Schmidt, R. E., et al. (2017). Diffusion MRI quantifies early axonal loss in the presence of nerve swelling. J. Neuroinflammation 14:78. doi: 10.1186/s12974-017-0852-3
Lin, T. H., Sun, P., Hallman, M., Hwang, F. C., Wallendorf, M., Ray, W. Z., et al. (2019). Noninvasive quantification of axonal loss in the presence of tissue swelling in traumatic spinal cord injury mice. J. Neurotrauma 36, 2308–2315. doi: 10.1089/neu.2018.6016
Lou, B., Chen, M., Luo, X., and Dai, Y. (2014). Reduced right frontal fractional anisotropy correlated with early elevated plasma LDL levels in obese young adults. PLoS One 9:e108180. doi: 10.1371/journal.pone.0108180
Marks, B. L., Katz, L. M., Styner, M., and Smith, J. K. (2011). Aerobic fitness and obesity: relationship to cerebral white matter integrity in the brain of active and sedentary older adults. Br. J. Sports Med. 45, 1208–1215. doi: 10.1136/bjsm.2009.068114
MATLAB and Statistics Toolbox Release (2012). MATLAB and Statistics Toolbox Release, The MathWorks, Inc., Natick, MA. doi: 10.1136/bjsm.2009.068114
Mazza, E., Poletti, S., Bollettini, I., Locatelli, C., Falini, A., Colombo, C., et al. (2017). Body mass index associates with white matter microstructure in bipolar depression. Bipolar Disord. 19, 116–127. doi: 10.1111/bdi.12484
Metzler-Baddeley, C., Mole, J. P., Leonaviciute, E., Sims, R., Kidd, E. J., Ertefai, B., et al. (2019). Sex-specific effects of central adiposity and inflammatory markers on limbic microstructure. Neuroimage 189, 793–803. doi: 10.1016/j.neuroimage.2019.02.007
Miller, A. A., and Spencer, S. J. (2014). Obesity and neuroinflammation: a pathway to cognitive impairment. Brain Behav. Immun. 42, 10–21. doi: 10.1016/j.bbi.2014.04.001
Mori, S., Oishi, K., Jiang, H., Jiang, L., Li, X., Akhter, K., et al. (2008). Stereotaxic white matter atlas based on diffusion tensor imaging in an ICBM template. Neuroimage 40, 570–582. doi: 10.1016/j.neuroimage.2007.12.035
Mueller, K., Anwander, A., Moller, H. E., Horstmann, A., Lepsien, J., Busse, F., et al. (2011). Sex-dependent influences of obesity on cerebral white matter investigated by diffusion-tensor imaging. PLoS One 6:e18544. doi: 10.1371/journal.pone.0018544
Murphy, R. K., Sun, P., Xu, J., Wang, Y., Sullivan, S., Gamble, P., et al. (2016). Magnetic resonance imaging biomarker of axon loss reflects cervical spondylotic myelopathy severity. Spine 41, 751–756. doi: 10.1097/BRS.0000000000001337
Nichols, T. E., and Holmes, A. P. (2002). Nonparametric permutation tests for functional neuroimaging: a primer with examples. Hum. Brain Mapp. 15, 1–25. doi: 10.1002/hbm.1058
O’Brien, P. D., Hinder, L. M., Callaghan, B. C., and Feldman, E. L. (2017). Neurological consequences of obesity. Lancet. Neurol. 16, 465–477.
Owen, D. R., Yeo, A. J., Gunn, R. N., Song, K., Wadsworth, G., Lewis, A., et al. (2012). An 18-kDa translocator protein (TSPO) polymorphism explains differences in binding affinity of the PET radioligand PBR28. J. Cereb. Blood Flow Metab. 32, 1–5. doi: 10.1038/jcbfm.2011.147
Papageorgiou, I., Astrakas, L. G., Xydis, V., Alexiou, G. A., Bargiotas, P., Tzarouchi, L., et al. (2017). Abnormalities of brain neural circuits related to obesity: a diffusion tensor imaging study. Magn. Reson. Imaging 37, 116–121. doi: 10.1016/j.mri.2016.11.018
Pepino, M. Y., Eisenstein, S. A., Bischoff, A. N., Klein, S., Moerlein, S. M., Perlmutter, J. S., et al. (2016). Sweet dopamine: sucrose preferences relate differentially to striatal D2 receptor binding and age in obesity. Diabetes 65, 2618–2623. doi: 10.2337/db16-0407
Pistell, P. J., Morrison, C. D., Gupta, S., Knight, A. G., Keller, J. N., Ingram, D. K., et al. (2010). Cognitive impairment following high fat diet consumption is associated with brain inflammation. J. Neuroimmunol. 219, 25–32. doi: 10.1016/j.jneuroim.2009.11.010
Pugazhenthi, S., Qin, L., and Reddy, P. H. (2017). Common neurodegenerative pathways in obesity, diabetes, and Alzheimer’s disease. Biochim. Biophys. Acta Mol. Basis Dis. 1863, 1037–1045. doi: 10.1016/j.bbadis.2016.04.017
Reitan, R. (1958). Validity of the trail making test as an indicator of organic brain damage. Percept. Mot. Skill. 8, 271–276. doi: 10.2466/pms.1958.8.3.271
Schur, E. A., Melhorn, S. J., Oh, S. K., Lacy, J. M., Berkseth, K. E., Guyenet, S. J., et al. (2015). Radiologic evidence that hypothalamic gliosis is associated with obesity and insulin resistance in humans. Obesity 23, 2142–2148. doi: 10.1002/oby.21248
Shirani, A., Sun, P., Schmidt, R. E., Trinkaus, K., Naismith, R. T., Song, S. K., et al. (2018). Histopathological correlation of diffusion basis spectrum imaging metrics of a biopsy-proven inflammatory demyelinating brain lesion: a brief report. Mult. Scler. 25, 1937–1941. doi: 10.1177/1352458518786072
Smith, S. M. (2002). Fast robust automated brain extraction. Hum. Brain Mapp. 17, 143–155. doi: 10.1002/hbm.10062
Smith, S. M., Jenkinson, M., Johansen-Berg, H., Rueckert, D., Nichols, T. E., Mackay, C. E., et al. (2006). Tract-based spatial statistics: voxelwise analysis of multi-subject diffusion data. Neuroimage 31, 1487–1505. doi: 10.1016/j.neuroimage.2006.02.024
Smith, S. M., Jenkinson, M., Woolrich, M. W., Beckmann, C. F., Behrens, T. E., Johansen-Berg, H., et al. (2004). Advances in functional and structural MR image analysis and implementation as FSL. Neuroimage 23(Suppl. 1), S208–S219.
Snelbaker, A. J., Wilkinson, G. S., Robertson, G. J., and Glutting, J. J. (2001). Wide Range Achievement Test 3 (wrat3). Boston, MA: Springer.
Spreen, O., and Benton, A. L. (1977). Neurosensory Center Comprehensive Examination for Aphasia : Manual of directions. revised edition. Victoria BC: University of Victoria.
Stamatovic, S. M., Dimitrijevic, O. B., Keep, R. F., and Andjelkovic, A. V. (2006). Inflammation and brain edema: new insights into the role of chemokines and their receptors. Acta Neurochir. Suppl. 96, 444–450. doi: 10.1007/3-211-30714-1_91
Stanek, K. M., Grieve, S. M., Brickman, A. M., Korgaonkar, M. S., Paul, R. H., Cohen, R. A., et al. (2011). Obesity is associated with reduced white matter integrity in otherwise healthy adults. Obesity 19, 500–504. doi: 10.1038/oby.2010.312
Stepanikova, I., Bateman, L. B., and Oates, G. R. (2017a). Systemic inflammation in midlife: race, socioeconomic status, and perceived discrimination. Am. J. Prev. Med. 52, S63–S76. doi: 10.1016/j.amepre.2016.09.026
Stepanikova, I., Oates, G. R., and Bateman, L. B. (2017b). Does one size fit all? The role of body mass index and waist circumference in systemic inflammation in midlife by race and gender. Ethn. Health 22, 169–183. doi: 10.1080/13557858.2016.1235681
Strain, J. F., Burdo, T. H., Song, S. K., Sun, P., El-Ghazzawy, O., Nelson, B., et al. (2017). Diffusion basis spectral imaging detects ongoing brain inflammation in virologically well-controlled HIV+ patients. J. Acquir. Immune. Defi.c Syndr. 76, 423–430. doi: 10.1097/QAI.0000000000001513
Stranahan, A. M., Hao, S., Dey, A., Yu, X., and Baban, B. (2016). Blood-brain barrier breakdown promotes macrophage infiltration and cognitive impairment in leptin receptor-deficient mice. J. Cereb. Blood Flow Metab. 36, 2108–2121. doi: 10.1177/0271678x16642233
Sun, P., Murphy, R. K., Gamble, P., George, A., Song, S. K., and Ray, W. Z. (2017). Diffusion assessment of cortical changes, induced by traumatic spinal cord injury. Brain Sci. 7:21. doi: 10.3390/brainsci7020021
Thaler, J. P., Yi, C. X., Schur, E. A., Guyenet, S. J., Hwang, B. H., Dietrich, M. O., et al. (2012). Obesity is associated with hypothalamic injury in rodents and humans. J. Clin. Invest. 122, 153–162. doi: 10.1172/JCI59660
Thorand, B., Baumert, J., Doring, A., Herder, C., Kolb, H., Rathmann, W., et al. (2006). Sex differences in the relation of body composition to markers of inflammation. Atherosclerosis 184, 216–224. doi: 10.1016/j.atherosclerosis.2005.04.011
Tomassoni, D., Nwankwo, I. E., Gabrielli, M. G., Bhatt, S., Muhammad, A. B., Lokhandwala, M. F., et al. (2013). Astrogliosis in the brain of obese Zucker rat: a model of metabolic syndrome. Neurosci. Lett. 543, 136–141. doi: 10.1016/j.neulet.2013.03.025
Tsai, C. L., Huang, T. H., and Tsai, M. C. (2017). Neurocognitive performances of visuospatial attention and the correlations with metabolic and inflammatory biomarkers in adults with obesity. Exp. Physiol. 102, 1683–1699. doi: 10.1113/EP086624
Tucsek, Z., Toth, P., Sosnowska, D., Gautam, T., Mitschelen, M., Koller, A., et al. (2014). Obesity in aging exacerbates blood-brain barrier disruption, neuroinflammation, and oxidative stress in the mouse hippocampus: effects on expression of genes involved in beta-amyloid generation and Alzheimer’s disease. J. Gerontol. A Biol. Sci. Med. Sci. 69, 1212–1226. doi: 10.1093/gerona/glt177
van Galen, K. A., Ter Horst, K. W., Booij, J., La Fleur, S. E., and Serlie, M. J. (2018). The role of central dopamine and serotonin in human obesity: lessons learned from molecular neuroimaging studies. Metabolism 85, 325–339. doi: 10.1016/j.metabol.2017.09.007
Verstynen, T. D., Weinstein, A. M., Schneider, W. W., Jakicic, J. M., Rofey, D. L., and Erickson, K. I. (2012). Increased body mass index is associated with a global and distributed decrease in white matter microstructural integrity. Psychosom. Med. 74, 682–690. doi: 10.1097/PSY.0b013e318261909c
Vivash, L., and O’Brien, T. J. (2016). Imaging microglial activation with TSPO PET: lighting up Neurologic Diseases? J. Nucl. Med. 57, 165–168. doi: 10.2967/jnumed.114.141713
Walker, J. M., and Harrison, F. E. (2015). Shared neuropathological characteristics of obesity, Type 2 diabetes and Alzheimer’s Disease: impacts on cognitive decline. Nutrients 7, 7332–7357. doi: 10.3390/nu7095341
Wang, Q., Wang, Y., Liu, J., Sutphen, C. L., Cruchaga, C., Blazey, T., et al. (2019). Quantification of white matter cellularity and damage in preclinical and early symptomatic Alzheimer’s disease. Neuroimage Clin. 22:101767. doi: 10.1016/j.nicl.2019.101767
Wang, X., Cusick, M. F., Wang, Y., Sun, P., Libbey, J. E., Trinkaus, K., et al. (2014). Diffusion basis spectrum imaging detects and distinguishes coexisting subclinical inflammation, demyelination and axonal injury in experimental autoimmune encephalomyelitis mice. NMR Biomed. 27, 843–852. doi: 10.1002/nbm.3129
Wang, Y., Sun, P., Wang, Q., Trinkaus, K., Schmidt, R. E., Naismith, R. T., et al. (2015). Differentiation and quantification of inflammation, demyelination and axon injury or loss in multiple sclerosis. Brain 138, 1223–1238. doi: 10.1093/brain/awv046
Wang, Y., Wang, Q., Haldar, J. P., Yeh, F. C., Xie, M., Sun, P., et al. (2011). Quantification of increased cellularity during inflammatory demyelination. Brain 134, 3590–3601. doi: 10.1093/brain/awr307
Wechsler, D. (1997). Wechsler Adult Intelligence Scale III/Wechsler Memory Scale Third Edition Technical Manual, San Antonio, TX: The Psychological Corporation.
Wechsler, D. (1999). Wechsler Abbreviated Scale of Intelligence (WASI), San Antonio, TX: Harcourt Assessment.
Wheeler-Kingshott, C. A., and Cercignani, M. (2009). About “axial” and “radial” diffusivities. Magn. Reson. Med. 61, 1255–1260. doi: 10.1002/mrm.21965
WHO (2018). Obesity and Overwieght. Available at: https://www.who.int/en/news-room/fact-sheets/detail/obesity-and-overweight (Accessed March 1, 2018)Google Scholar
Winkler, A. M., Ridgway, G. R., Webster, M. A., Smith, S. M., and Nichols, T. E. (2014). Permutation inference for the general linear model. Neuroimage 92, 381–397. doi: 10.1016/j.neuroimage.2014.01.060
Winklewski, P. J., Sabisz, A., Naumczyk, P., Jodzio, K., Szurowska, E., and Szarmach, A. (2018). Understanding the physiopathology behind axial and radial diffusivity changes-what do we know? Front. Neurol. 9:92. doi: 10.3389/fneur.2018.00092
Wright, R. S., Cole, A. P., Ali, M. K., Skinner, J., Whitfield, K. E., and Mwendwa, D. T. (2016). Examining the influence of measures of adiposity on cognitive function in middle age and Older African Americans. Arch. Clin. Neuropsychol. 31, 23–28. doi: 10.1093/arclin/acv086
Xu, J., Li, Y., Lin, H., Sinha, R., and Potenza, M. N. (2013). Body mass index correlates negatively with white matter integrity in the fornix and corpus callosum: a diffusion tensor imaging study. Hum. Brain Mapp. 34, 1044–1052. doi: 10.1002/hbm.21491
Yang, Y., and Wang, J. Z. (2017). From structure to behavior in basolateral amygdala-hippocampus circuits. Front. Neural. Circuits 11:86. doi: 10.3389/fncir.2017.00086
Yendiki, A., Koldewyn, K., Kakunoori, S., Kanwisher, N., and Fischl, B. (2014). Spurious group differences due to head motion in a diffusion MRI study. Neuroimage 88, 79–90. doi: 10.1016/j.neuroimage.2013.11.027
Yendiki, A., Panneck, P., Srinivasan, P., Stevens, A., Zollei, L., Augustinack, J., et al. (2011). Automated probabilistic reconstruction of white-matter pathways in health and disease using an atlas of the underlying anatomy. Front. Neuroinform. 5:23. doi: 10.3389/fninf.2011.00023
Keywords: obesity, white matter, neuroinflammation, diffusion tensor imaging, diffusion basis spectrum imaging
Citation: Samara A, Murphy T, Strain J, Rutlin J, Sun P, Neyman O, Sreevalsan N, Shimony JS, Ances BM, Song S-K, Hershey T and Eisenstein SA (2020) Neuroinflammation and White Matter Alterations in Obesity Assessed by Diffusion Basis Spectrum Imaging. Front. Hum. Neurosci. 13:464. doi: 10.3389/fnhum.2019.00464
Received: 10 October 2019; Accepted: 18 December 2019;
Published: 14 January 2020.
Edited by:
Dieter J. Meyerhoff, University of California, San Francisco, United StatesReviewed by:
Natalie M. Zahr, Stanford University, United StatesMohammed Hankir, Leipzig University, Germany
Copyright © 2020 Samara, Murphy, Strain, Rutlin, Sun, Neyman, Sreevalsan, Shimony, Ances, Song, Hershey and Eisenstein. This is an open-access article distributed under the terms of the Creative Commons Attribution License (CC BY). The use, distribution or reproduction in other forums is permitted, provided the original author(s) and the copyright owner(s) are credited and that the original publication in this journal is cited, in accordance with accepted academic practice. No use, distribution or reproduction is permitted which does not comply with these terms.
*Correspondence: Sarah A. Eisenstein, seisens@wustl.edu