3D inversion recovery ultrashort echo time MRI can detect demyelination in cuprizone-treated mice
 Adam C. Searleman1‡
  Yajun Ma1‡
  Srihari Sampath1 Srinath Sampath1 Robert Bussell1†
  Eric Y. Chang1,2 Lisa Deaton3 Andrew M. Schumacher3
  Jiang Du1,2,4*
- 1Department of Radiology, University of California, San Diego, San Diego, CA, United States
- 2Radiology Service, Veterans Affairs San Diego Healthcare System, San Diego, CA, United States
- 3Novartis Institutes for BioMedical Research, San Diego, CA, United States
- 4Department of Bioengineering, University of California, San Diego, San Diego, CA, United States
Purpose: To test the ability of inversion-recovery ultrashort echo time (IR-UTE) MRI to directly detect demyelination in mice using a standard cuprizone mouse model.
Methods: Non-aqueous myelin protons have ultrashort T2s and are “invisible” with conventional MRI sequences but can be detected with UTE sequences. The IR-UTE sequence uses an adiabatic inversion-recovery preparation to suppress the long T2 water signal so that the remaining signal is from the ultrashort T2 myelin component. In this study, eight 8-week-old C57BL/6 mice were fed cuprizone (n = 4) or control chow (n = 4) for 5 weeks and then imaged by 3D IR-UTE MRI. The differences in IR-UTE signal were compared in the major white matter tracts in the brain and correlated with the Luxol Fast Blue histochemical marker of myelin.
Results: IR-UTE signal decreased in cuprizone-treated mice in white matter known to be sensitive to demyelination in this model, such as the corpus callosum, but not in white matter known to be resistant to demyelination, such as the internal capsule. These findings correlated with histochemical staining of myelin content.
Conclusions: 3D IR-UTE MRI was sensitive to cuprizone-induced demyelination in the mouse brain, and is a promising noninvasive method for measuring brain myelin content.
1 Introduction
In the central nervous system, myelin is a component of oligodendrocytes defined by its ultrastructure of multiple lamellae of protein-rich lipid bilayers; myelin insulates the axons of certain nerves to facilitate saltatory conduction and provides trophic support (Morell and Quarles, 1999a). The extent of myelination modulates the function and health of axons and is dynamically regulated throughout the lifespan and in response to a variety of neurologic conditions (Young et al., 2013; Duncan and Radcliff, 2016).
The development of robust and specific biomarkers of myelination would facilitate further advancements in the diagnosis, monitoring, and treatment of demyelinating diseases. For instance, there has been recent interest in the development of promoters of remyelination as complementary to the current immunosuppressive treatment of multiple sclerosis (Magalon et al., 2012; Deshmukh et al., 2013; Plemel et al., 2017; Lubetzki et al., 2020), an autoimmune demyelinating disease that most commonly affects young adults and ultimately results in progressive functional impairment, cognitive deficits, and early mortality (Lucchinetti et al., 2005; Popescu et al., 2013). An imaging-based biomarker of myelin would be crucial for the development of these potential remyelinating agents at both the pre-clinical and clinical stages.
Myelin imaging is challenging because the T2 of myelin protons (T2 from several μs to a few 100's of μs) is much shorter than the minimal echo times (TEs; no less than several ms) of conventional sequences (Horch et al., 2011; Wilhelm et al., 2012; Du et al., 2014a; Sheth et al., 2016). In addition, the longer T2 water protons comprise over 90% of the MRI signal in the brain (Fan et al., 2018). We have previously shown that adiabatic inversion recovery prepared ultrashort echo time (IR-UTE) sequences with nominal TEs as short as 8 μs are able to robustly suppress long-T2 water signals and generate a high contrast myelin image on a clinical 3T scanner (Du et al., 2014a,b). This short T2 signal persists after removing most of the myelin-associated water fraction by D2O exchange (Fan et al., 2017, 2018; Seifert et al., 2017), suggesting that the IR-UTE sequence is detecting signal from semisolid myelin protons. Myelin is comprised of ~40–45% lipids/cholesterol, 10–15% protein, and 40% water (Morell and Quarles, 1999b). The majority of the myelin protons detected by UTE sequences are thought to originate from the long-chain methylenes of the bilayers, with additional contributions from cholesterol, choline, and proteins (Horch et al., 2011; Wilhelm et al., 2012). The IR-UTE sequence has also been shown to detect demyelinated MS lesions as confirmed by autopsy (Sheth et al., 2016, 2017).
This study was designed to test the capability of the IR-UTE sequence in detection of demyelination using an animal model. In adult C57BL/6 mice, the copper chelator cuprizone induces demyelination with well-characterized temporal and regional dynamics, notably resulting in pronounced demyelination of the caudal corpus callosum (CC) after 5–6 weeks of exposure (Hiremath et al., 1998; Mason et al., 2001; Matsushima and Morell, 2001; Taylor et al., 2010). Additional acute changes are likely reactive to demyelination including mild edema, microgliosis, astrocytosis, and axonal injury; however there is minimal inflammation compared to models such as experimental autoimmune encephalitis (Matsushima and Morell, 2001; Gudi et al., 2009). Thus, the C57BL/6 cuprizone model is well-suited for determining the sensitivity of IR-UTE for acute demyelination.
In this study, eight 8-week-old C57BL/6 mice were fed cuprizone (n = 4) or control chow (n = 4) for 5 weeks and then imaged by 3D IR-UTE MRI and compared with conventional diffusion tensor imaging (DTI). The differences in IR-UTE signal were compared in the major white matter tracts in the brain and correlated with the Luxol Fast Blue (LFB) histochemical marker of myelin.
2 Materials and methods
2.1 Sample preparation
All animal studies conformed to institutional IACUC-approved protocols. Ten 8-week-old female C57BL/6 mice were included in this study. Five mice were given 0.2% cuprizone chow (Sigma Aldrich, St Louis, MO; Harlan Laboratories, Inc., Madison, Wisconsin) ad lib for 5 weeks, and five controls were given chow lacking cuprizone for 5 weeks prior to being sacrificed for imaging and analysis. This cuprizone dose and duration were chosen to induce maximal regional demyelination in the caudal corpus callosum in this mouse strain (Horch et al., 2011; Wilhelm et al., 2012; Du et al., 2014a; Sheth et al., 2016). One mouse from each group was used for image optimization and excluded from further analysis due to extended imaging times, which may have altered the biological characteristics of the myelin and surrounding tissues. The mice were decapitated and their heads skinned and then flash frozen in liquid nitrogen until analysis to prevent temporal effects related to scan order. Each head was warmed in a room temperature water bath for 2 h immediately prior to MRI to allow for a consistent brain temperature between specimens given the effect of temperature on T1 and thus nulling time.
2.2 MRI
Brain imaging was performed on a Bruker 7T BioSpec (Billerica, MA) scanner using a mouse brain surface coil for signal reception. The specimens were placed in 15 mL conical tubes on a cardboard insert to facilitate consistent positioning in the center of the coil. No solution was added to the tubes. A conventional T2-weighted fast spin echo (T2-FSE) sequence, with repetition time (TR) = 2,760 ms, TE = 40 ms, and echo train length (ETL) = 8, was used for anatomic imaging. A conventional two-dimensional adiabatic inversion recovery prepared FSE (2D IR-FSE) sequence, with TR = 8,000 ms, TE = 18.6 ms, and inversion times (TIs) = 60, 150, 300, 450, 600, 750, 900, 1,200, 1,500, and 2,000 ms, was used to measure T1 of the long T2 white matter components using a single coronal image of the ventral hippocampal commissure. A 3D IR-UTE sequence was used to image myelin, using the following parameters: TR = 1,000 ms, TI = 382.5 ms, TE = 20 μs, FOV = 2.0 × 2.0 × 2.0 cm3, matrix = 110 × 110 × 110, flip angle = 15°, number of excitations (NEX) = 4. To speed up data acquisition, 25 spokes centered on TI were acquired per IR preparation, with 5 ms from the start of one spoke to the next, leading to a total scan time of 100 min. The same 3D IR-UTE sequence was repeated with TE = 2.0 ms and NEX = 1. Similar imaging parameters were used for the T2-FSE and IR-FSE sequences. Echo planar imaging based DTI MRI was performed using 30 non-colinear gradient directions with gradient b-values = 0, 750, 1,500, and 2,000 s/mm2, TR = 4,000 ms, TE = 23 ms, and ETL = 13, for a total scan time of 25 min.
2.3 Histology
Immediately after imaging, mouse brains were removed intact, fixed in zinc formalin, and then embedded in paraffin using standard protocols as previously described (Beckmann et al., 2018). One of the control mouse brains was damaged during sample processing and excluded from further histological analysis. Five micron sections were stained with LFB using standard protocols as previously described (Beckmann et al., 2018). Myelin content was semi-quantitatively measured in the genu of the corpus callosum based on staining density as follows: the corpus callosum in each section was visually identified and outlined as the region of interest (ROI) for analysis using the NDP View software for NanoZoomer scanners (Hamamatsu, Photonics, Shizuoka, Japan). The myelin density was then calculated as the LFB optical density within this ROI. LFB densities from nine corpus callosum sections per animal were averaged, and this was compared across 3–4 animals per group.
2.4 Region of interest selection
The 3D IR-UTE images of a control mouse were mapped to anatomical structures using the Allen Mouse Brain Atlas as a reference (Allen Institute for Brain Science, 2004). Regions of interest (ROIs) were generated in two ways. First, ROIs were drawn manually for the genu and splenium of the CC, ventral hippocampal commissure (VHC), and internal capsule by an investigator blinded to group assignment using standardized criteria for ROI selection to ensure consistency. Secondly, ROIs were generated in a semi-automated fashion from a common IR-UTE template. To remove the influence of signal from the calvarium and other extracranial structures on the registration method, brain extraction was performed using custom Matlab scripts (The Mathworks Inc., Natick, MA). The IR-UTE template was generated using Advanced Normalization Tools (Avants et al., 2008) using symmetric diffeomorphic image registration with a cross-correlation metric from IR-UTE images of an untreated mouse. Each specimen was individually registered to this common template. The ROI analysis was done by manually drawing the ROI on the template and using the inverse transformation to map to the corresponding ROI in the original image space. Both ROI analyses were comparable; however, the backpropagation of the ROIs was not as reliable and therefore the first analysis is presented as it was considered to be more accurate. The template-registered IR-UTE images were also analyzed by averaging the registered IR-UTE images in the control mice and the cuprizone-treated mice to obtain averaged IR-UTE signal for each voxel. Subtraction of the averaged control IR-UTE map from the averaged cuprizone-treated IR-UTE map will demonstrate differences in signal for each voxel between these two groups, which was then analyzed for regional patterns of change.
2.5 Data analysis
The IR-UTE absolute signal was obtained from magnitude images. A coil sensitivity map was generated using the magnitude images from the same IR-UTE sequence on a degassed phantom of 20% H2O and 80% D2O with 35.5 mM MnCl2 (for of 355 ms) in a 15 mL conical tube. The map was then smoothened with a Gaussian filter with size = 4 and σ = 2 and scaled to a maximum value of 1. The IR-UTE signal from each specimen was normalized to this coil sensitivity map by simple division. The fractional anisotropy (FA), axial diffusivity (AD), and radial diffusivity (RD) were generated using the dtifit function in FDT (Jbabdi et al., 2012), and compared to the IR-UTE signal using the Pearson correlation coefficient. T1 values of white matter were calculated using custom code in Matlab in the ventral hippocampal commissure using the normalized maximum likelihood estimate (assuming a Rician distribution) and non-linear least squares fitting. Statistical analysis was performed using the R statistical programming language (v3.4.1) using the Wilcoxon rank-sum test for each ROI. A p-value of < 0.05 was considered statistically significant.
3 Results
Representative images of the optimized IR-UTE sequence of a control mouse brain are shown in Figure 1. The IR-UTE image in Figures 1B, C demonstrates high signal intensity in the major white matter tracts, including the corpus callosum, internal capsule, dorsal and ventral hippocampal commissures, and deep cerebellar white matter; intermediate signal in mixed white and gray matter structures such as the basal ganglia and both superior and inferior colliculi; and minimal signal from cortical gray matter and cerebral spinal fluid (CSF). The high signal in the calvarium seen only on IR-UTE and not FSE images reflects ultrashort T2 signal from cortical bone, and there is additional signal from retrobulbar fat. The later echo time of TE = 2 ms in Figure 1D has dramatically reduced signal intensities, notably with the majority of the white matter tracts now demonstrating less signal than residual CSF, indicating that the majority of the white matter IR-UTE signal has ultrashort T2. The retrobulbar fat, bone marrow fat, and minimal CSF signal are more apparent in the TE = 2 ms image due to longer T2s.
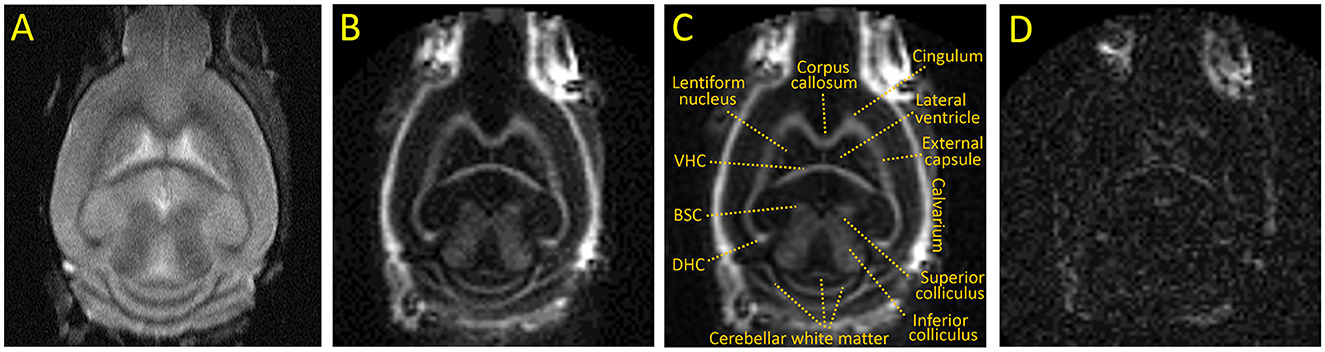
Figure 1. Representative coronal images of an untreated adult C57BL/6 mouse. (A) T2 weighted FSE, (B, C) IR-UTE at TE = 0.020 ms with and without annotations, (D) IR-UTE at TE = 2 ms [displayed with a 10X narrower window than (B) to show detail]. BSC, Brachium of the superior colliculus; DHC and VHC, dorsal and ventral hippocampal commissure, respectively.
The IR-UTE signal visually decreased in the cuprizone-treated mice in several white matter tracts that are known to be sensitive to cuprizone-induced demyelination (Figure 2). Axial images through the ventral hippocampal commissure and splenium of the corpus callosum demonstrate the greatest decrease in signal intensity in the corpus callosum and to a lesser extent in the ventral hippocampal commissure and white matter of the basal ganglia. In contrast, there was no significant signal change in the internal capsule, which is known to be resistant to cuprizone (Yang et al., 2009). These findings are confirmed to be statistically significant with quantitative analysis using ROIs (Figure 3).
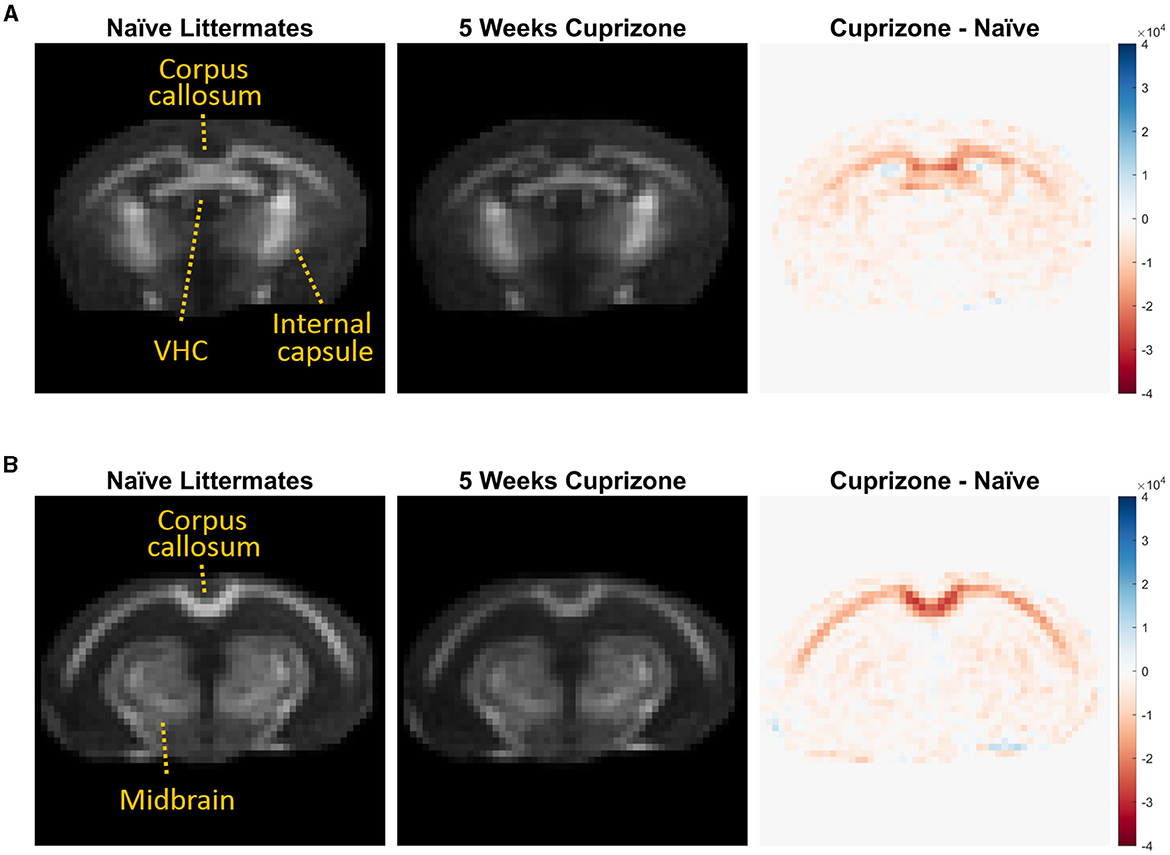
Figure 2. Averaged IR-UTE signal from untreated and cuprizone treated mice. IR-UTE images were registered to a common template after brain extraction and then averaged. These averaged axial images are displayed at the level of the (A) ventral hippocampal commissure and (B) splenium corpus callosum. On the right, subtraction images are shown such that areas of decreased signal in the cuprizone-treated mice are red, and areas of no change are white. Note that the largest decrease in signal was in the splenium of the corpus callosum (B), and the lack of signal differences in the internal capsule (A) and midbrain structures (B) that are resistant to cuprizone.
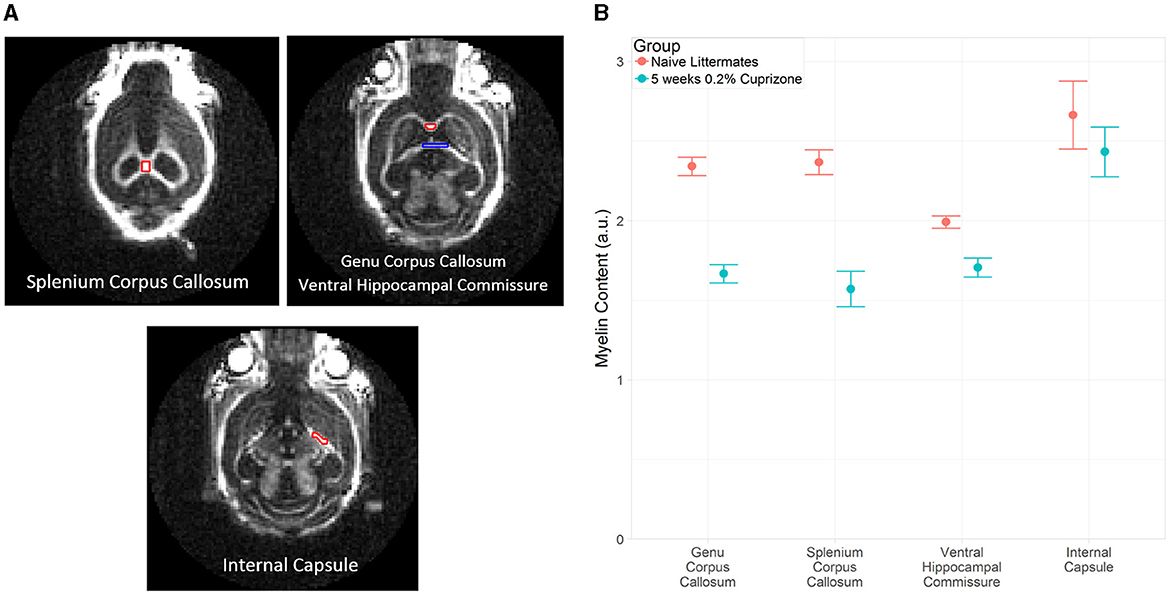
Figure 3. (A) Example of ROI placement in a representative control mouse on coronal IR-UTE images at TE = 0.02 ms. In the top right figure, the red ROI corresponds to the genu corpus callosum and the blue ROI corresponds to the ventral hippocampal commissure. (B) Average magnitude of IR-UTE images at TE = 0.02 ms for selected ROIs. Bars represent 95% confidence intervals. (a.u.), arbitrary units.
DTI imaging also was able to detect a difference between the control and cuprizone-treated mice. Demyelination is thought to be associated with a decrease in total fractional anisotropy, specifically with an increase in radial diffusivity as the loss of myelin bilayers allows water molecules to diffuse in a radial direction from the axon tracts (Xie et al., 2010). In contrast, axial diffusivity is more sensitive to axonal damage, which transiently changes during early treatment with cuprizone (Sun et al., 2006). As expected and in line with prior studies of DTI imaging of cuprizone-treated mice, a decrease in fractional anisotropy and an increase in radial diffusivity were seen in the splenium of the corpus callosum, whereas there was no statistically significant change in axial diffusivity. The IR-UTE signal correlated with both fractional anisotropy and radial diffusivity, but only had a weak correlation with axial diffusivity that was not statistically significant (Figure 4).
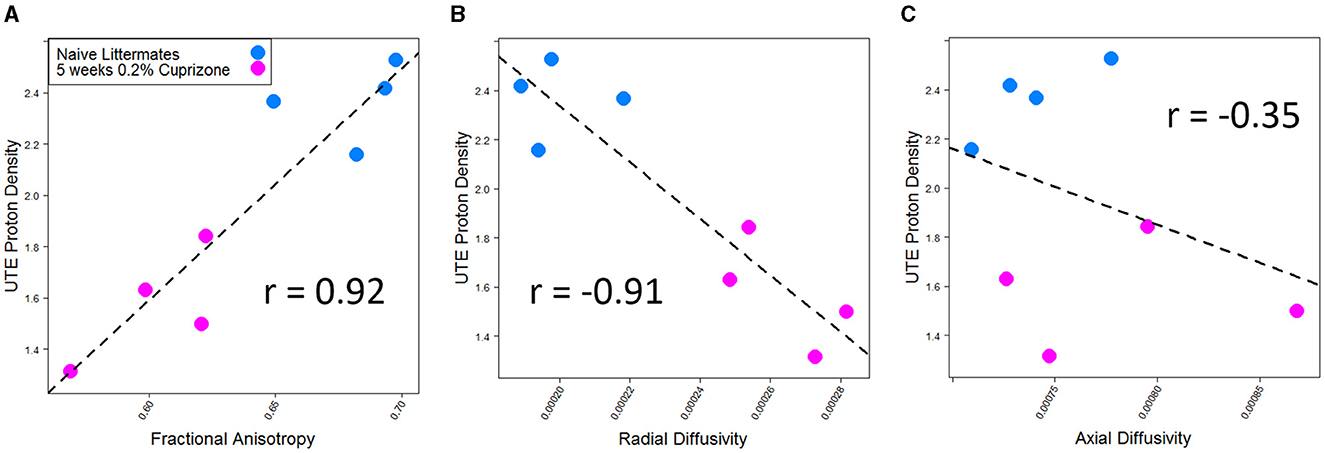
Figure 4. IR-UTE signal correlates with (A) fractional anisotropy and (B) radial diffusivity, but not (C) axial diffusivity in cuprizone-treated mice. Both fractional anisotropy and radial diffusivity but not axial diffusivity were different between cuprizone-treated and untreated mice with p < 0.05.
Both the IR-UTE and DTI imaging results are corroborated by semi-quantitative histochemical analysis of myelin using LFB staining (Figure 5). All of the cuprizone-treated mice had decreased myelin staining in the genu of the corpus callosum compared to the control mice; however complete demyelination was not achieved in this study. Additionally, T1 mapping demonstrates that cuprizone treatment did not significantly change the T1 of the ventral hippocampal commissure (Figure 6). Therefore, the TInull of the long components does not significantly change in this model. Otherwise, it could have resulted in artifactual signal intensity changes.
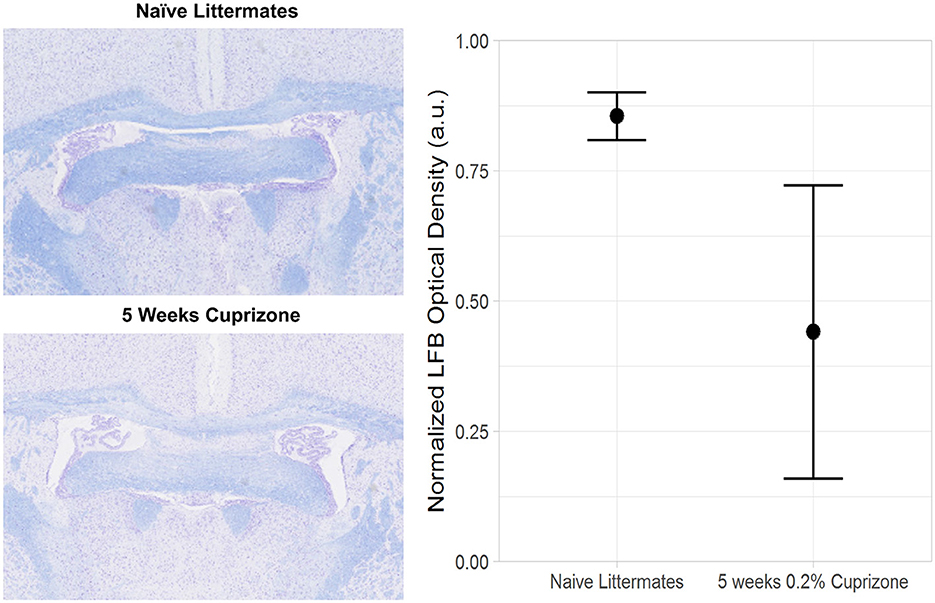
Figure 5. Decreased Luxol Fast Blue (LFB) staining in cuprizone treated mice compared with control mice. The plane of sectioning is analogous to Figure 2A, showing decreased myelin in both the genu of the corpus callosum and the ventral hippocampal commissure.
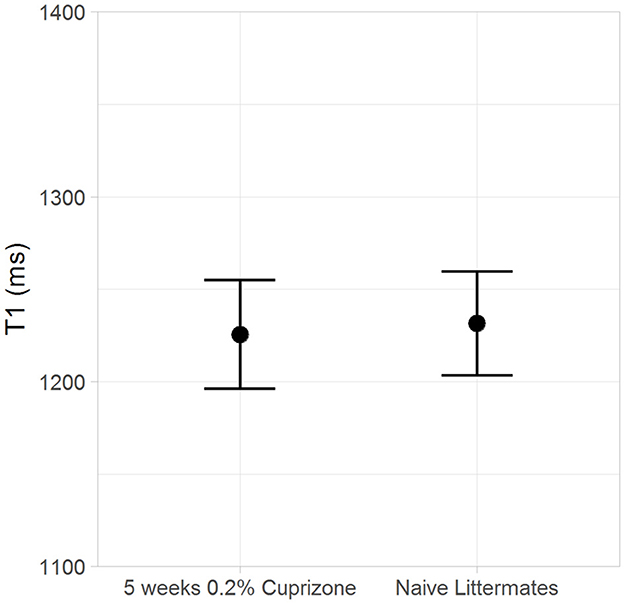
Figure 6. The T1 of myelin in the ventral hippocampal commissure is unchanged by cuprizone treatment.
4 Discussion
This study demonstrated that the 3D IR-UTE sequence is able to detect demyelination with decreased myelin signal in an animal model of acute demyelination. The ability of the IR-UTE sequence to detect the ultrashort T2 signal and suppress the long T2 signal was demonstrated in mouse brains, similar to prior work using in vitro phantoms and human volunteers (Du et al., 2014a; Sheth et al., 2017; Fan et al., 2018). The mice treated with cuprizone demonstrated loss of IR-UTE signal in white matter tracts known to be sensitive to cuprizone but no changes in white matter tracts that are known to be resistant, whereas the IR-UTE signal in white matter tracts of control mice was unchanged. The IR-UTE signal was also correlated with findings using DTI MRI. The 3D IR-UTE measurement of demyelination was further confirmed by LFB staining. These findings demonstrate that the IR-UTE signal was sensitive to myelin loss in the cuprizone mouse model.
Many of the existing methods for myelin imaging and quantification detect myelin indirectly through its interactions with myelin-associated water, and have been shown to detect demyelination in the cuprizone model and other animal models. These include magnetic transference (MT)-based imaging methods (Zaaraoui et al., 2008; Varma et al., 2015; Khodanovich et al., 2017), T2 relaxometry/myelin water fraction imaging (Thiessen et al., 2013; Wood et al., 2016), diffusion based imaging methods (Song et al., 2005; Sun et al., 2006; Wang et al., 2011), quantitative susceptibility mapping (Wang et al., 2019), and others. However, these methods may also be sensitive to other pathologic changes including microgliosis, edema, and mild axonal injury that accompany demyelination in this model (Wood et al., 2016). Directly imaging myelin protons using IR-UTE would be expected to improve specificity for myelin loss in the setting of heterogeneous pathological changes, or may complement these other methods. The indirect measures of myelin are sensitive to B1 and B0 inhomogeneities and may be complicated by edema and iron deposition. Unlike IR-UTE, conventional MRI techniques also cannot measure myelin relaxation times (e.g., T1 and T2* relaxation times), which may allow for a direct assessment of myelin quality.
Recently, another UTE-based method was found to correlate with histological markers of myelin in the cuprizone model better than the myelin water fraction and RD and similar to the MT-based macromolecular fraction (Soustelle et al., 2019). This Diff-UTE sequence uses diffusion gradients for suppression of long T2 water signals, which allows relative preservation of the ultrashort T2 signal at a short TR. In contrast, the IR-UTE sequence uses IR preparation for long T2 signal suppression, allowing for recovery of the ultrashort T2 signal using a longer TR and multispoke acquisition per IR preparation (Carl et al., 2016; Ma et al., 2020b). The IR-UTE sequence is more robust to B1 inhomogeneity and does not require assumptions about the T1 and T2 of myelin for gradient tuning, which is required in Diff-UTE imaging of myelin for appropriate signal nulling of diffusive long-T2 components of the white matter (Soustelle et al., 2019); however, inversion time needs to be carefully determined for IR-UTE imaging. We have recently designed a Double-Echo Sliding Inversion Recovery Ultrashort Echo Time (DESIRE-UTE) method which allows image reconstruction at a wide range of inversion times so that the optimal inversion time does not need to be chosen prospectively (Ma et al., 2020c). Another approach is a short-TR adiabatic inversion-recovery UTE (STAIR-UTE) method which allows robust long T2 signal suppression with optimized short TR/TI pairs (Ma et al., 2020a). In addition, the Diff-UTE study was performed on mouse brains that had been fixed, which may alter the MR properties of myelin. The specificity of the IR-UTE and Diff-UTE sequences have not yet been tested during remyelination or in other models of demyelination.
There are several limitations of this study. First, the sample size of both the treated and control mice was small, owing to the fact that this study was designed as a proof-of-concept for future studies. Additionally, complete demyelination was not achieved, which limited the ability to examine other contributors to the ultrashort T2 IR-UTE signal such as inflammation and gliosis. A possible reason for myelin not being as low as expected could be animals not eating enough, or variable amounts, of the cuprizone-containing diet. Future studies will be needed to test the specificity of the IR-UTE signal for myelin in the setting of both demyelination and remyelination using other models of demyelination, and to investigate the advantages and disadvantages over conventional MRI techniques for myelin quantification.
5 Conclusion
In conclusion, the 3D IR-UTE method was able to robustly detect the ultrashort T2 components in major white matter tracts of the mouse brain with decreased IR-UTE signal of myelin during cuprizone-induced demyelination as confirmed by LFB staining. Therefore, 3D IR-UTE is a promising non-invasive method for measuring brain myelin content in mouse models of demyelination.
Data availability statement
The raw data supporting the conclusions of this article will be made available by the authors, without undue reservation.
Ethics statement
The animal study was approved by IACUC at UCSD and at Novartis Institutes for BioMedical Research. The study was conducted in accordance with the local legislation and institutional requirements.
Author contributions
ACS: Conceptualization, Data curation, Formal analysis, Investigation, Methodology, Software, Writing—original draft, Writing—review & editing. YM: Conceptualization, Data curation, Formal analysis, Investigation, Methodology, Software, Writing—original draft, Writing—review & editing. SrihS: Resources, Supervision, Writing—review & editing. SrinS: Resources, Supervision, Writing—review & editing. RB: Data curation, Methodology, Resources, Software, Writing—review & editing. EC: Conceptualization, Funding acquisition, Methodology, Resources, Supervision, Writing—review & editing. LD: Investigation, Methodology, Resources, Writing—review & editing. AMS: Investigation, Methodology, Resources, Writing—review & editing. JD: Conceptualization, Funding acquisition, Methodology, Project administration, Resources, Supervision, Writing—original draft, Writing—review & editing.
Funding
The author(s) declare financial support was received for the research, authorship, and/or publication of this article. The authors acknowledge grant support from the National Institutes of Health (1R01 NS092650, RF1AG075717, R01AR075825, R01AR079484, R21AR075851, and T32EB005970), VA Research and Development Services (Merit Awards I01CX001388, 1I01BX005952, and I01CX002211), and GE Healthcare. The animal model and histology was provided by Novartis Institutes for BioMedical Research, which did not contribute to the analysis and interpretation of the results of this study. Novartis was not involved in the decision to publish this manuscript or its preparation, but did review the manuscript prior to submission with no requested alterations.
Conflict of interest
LD and AMS were employed by Novartis.
The remaining authors declare that the research was conducted in the absence of any commercial or financial relationships that could be construed as a potential conflict of interest.
The author(s) declared that they were an editorial board member of Frontiers, at the time of submission. This had no impact on the peer review process and the final decision.
Publisher's note
All claims expressed in this article are solely those of the authors and do not necessarily represent those of their affiliated organizations, or those of the publisher, the editors and the reviewers. Any product that may be evaluated in this article, or claim that may be made by its manufacturer, is not guaranteed or endorsed by the publisher.
Abbreviations
CC, Corpus callosum; DTI, Diffusion tensor imaging; ETL, Echo train length; FA, Fractional anisotropy; FSE, Fast spin echo; IR-UTE, Inversion-recovery ultrashort echo time (IR-UTE); LFB, Luxol Fast Blue; MT, Magnetic transference; NEX, Number of excitations; RD, Radial diffusivity; ROI, region of interest; TE, echo time; TI, Inversion time; TR, Repetition time; VHC, ventral hippocampal commissure.
References
Allen Institute for Brain Science (2004). Allen Mouse Brain Atlas [Dataset]. Washington, DC: Allen Institute for Brain Science.
Avants, B. B., Epstein, C. L., Grossman, M., and Gee, J. C. (2008). Symmetric diffeomorphic image registration with cross-correlation: evaluating automated labeling of elderly and neurodegenerative brain. Med. Image Anal. 12, 26–41. doi: 10.1016/j.media.2007.06.004
Beckmann, N., Giorgetti, E., Neuhaus, A., Zurbruegg, S., Accart, N., Smith, P., et al. (2018). Brain region-specific enhancement of remyelination and prevention of demyelination by the CSF1R kinase inhibitor BLZ945. Acta Neuropathol. Commun. 6:9. doi: 10.1186/s40478-018-0510-8
Carl, M., Bydder, G. M., and Du, J. (2016). UTE imaging with simultaneous water and fat signal suppression using a time-efficient multispoke inversion recovery pulse sequence. Magn. Reson. Med. 76, 577–582. doi: 10.1002/mrm.25823
Deshmukh, V. A., Tardif, V., Lyssiotis, C. A., Green, C. C., Kerman, B., Kim, H. J., et al. (2013). A regenerative approach to the treatment of multiple sclerosis. Nature 502, 327–332. doi: 10.1038/nature12647
Du, J., Ma, G., Li, S., Carl, M., Szeverenyi, N. M., VandenBerg, S., et al. (2014a). Ultrashort echo time (UTE) magnetic resonance imaging of the short T2 components in white matter of the brain using a clinical 3T scanner. NeuroImage 87(Suppl.C), 32–41. doi: 10.1016/j.neuroimage.2013.10.053
Du, J., Sheth, V., He, Q., Carl, M., Chen, J., Corey-Bloom, J., et al. (2014b). Measurement of T1 of the ultrashort T2* components in white matter of the brain at 3T. PLoS ONE 9:e103296. doi: 10.1371/journal.pone.0103296
Duncan, I. D., and Radcliff, A. B. (2016). Inherited and acquired disorders of myelin: the underlying myelin pathology. Exp. Neurol. 283, 452–475. doi: 10.1016/j.expneurol.2016.04.002
Fan, S. J., Ma, Y., Chang, E. Y., Bydder, G. M., and Du, J. (2017). Inversion recovery ultrashort echo time imaging of ultrashort T2 tissue components in ovine brain at 3 T: a sequential D2O exchange study. NMR Biomed. 30:3767. doi: 10.1002/nbm.3767
Fan, S-J., Ma, Y., Zhu, Y., Searleman, A., Szeverenyi, N. M., Bydder, G. M., et al. (2018). Yet more evidence that myelin protons can be directly imaged with UTE sequences on a clinical 3T scanner: bicomponent T2* analysis of native and deuterated ovine brain specimens. Magn. Reson. Med. 80, 538–547. doi: 10.1002/mrm.27052
Gudi, V., Moharregh-Khiabani, D., Skripuletz, T., Koutsoudaki, P. N., Kotsiari, A., Skuljec, J., et al. (2009). Regional differences between grey and white matter in cuprizone induced demyelination. Brain Res. 1283(Suppl.C), 127–138. doi: 10.1016/j.brainres.2009.06.005
Hiremath, M. M., Saito, Y., Knapp, G. W., Ting, J. P. Y., Suzuki, K., Matsushima, G. K., et al. (1998). Microglial/macrophage accumulation during cuprizone-induced demyelination in C57BL/6 mice. J. Neuroimmunol. 92, 38–49. doi: 10.1016/S0165-5728(98)00168-4
Horch, R. A., Gore, J. C., and Does, M. D. (2011). Origins of the ultrashort-T21H NMR signals in myelinated nerve: a direct measure of myelin content? Magn. Reson. Med. 66, 24–31. doi: 10.1002/mrm.22980
Jbabdi, S., Sotiropoulos, S. N., Savio, A. M., Graña, M., and Behrens, T. E. J. (2012). Model-based analysis of multishell diffusion MR data for tractography: how to get over fitting problems. Magn. Reson. Med. 68, 1846–1855. doi: 10.1002/mrm.24204
Khodanovich, M. Y., Sorokina, I. V., Glazacheva, V. Y., Akulov, A. E., Nemirovich-Danchenko, N. M., Romashchenko, A. V., et al. (2017). Histological validation of fast macromolecular proton fraction mapping as a quantitative myelin imaging method in the cuprizone demyelination model. Sci. Rep. 7:46686. doi: 10.1038/srep46686
Lubetzki, C., Zalc, B., Williams, A., Stadelmann, C., and Stankoff, B. (2020). Remyelination in multiple sclerosis: from basic science to clinical translation. Lancet Neurol. 19, 678–688. doi: 10.1016/S1474-4422(20)30140-X
Lucchinetti, C. F., Parisi, J., and Bruck, W. (2005). The pathology of multiple sclerosis. Neurol. Clin. 23, 77–105. doi: 10.1016/j.ncl.2004.09.002
Ma, Y. J., Jang, H., Wei, Z., Cai, Z., Xue, Y., Lee, R. R., et al. (2020a). Myelin imaging in human brain using a short repetition time adiabatic inversion recovery prepared ultrashort echo time (STAIR-UTE) MRI sequence in multiple sclerosis. Radiology 297, 392–404. doi: 10.1148/radiol.2020200425
Ma, Y. J., Searleman, A. C., Jang, H., Fan, S. J., Wong, J., Xue, Y., et al. (2020b). Volumetric imaging of myelin in vivo using 3D inversion recovery-prepared ultrashort echo time cones magnetic resonance imaging. NMR Biomed. 33:e4326. doi: 10.1002/nbm.4326
Ma, Y. J., Searleman, A. C., Jang, H., Wong, J., Chang, E. Y., Corey-Bloom, J., et al. (2020c). Whole-brain myelin imaging using 3D double-echo sliding inversion recovery ultrashort echo time (DESIRE UTE) MRI. Radiology 294, 362–374. doi: 10.1148/radiol.2019190911
Magalon, K., Zimmer, C., Cayre, M., Khaldi, J., Bourbon, C., Robles, I., et al. (2012). Olesoxime accelerates myelination and promotes repair in models of demyelination. Ann. Neurol. 71, 213–226. doi: 10.1002/ana.22593
Mason, J. L., Langaman, C., Morell, P., Suzuki, K., and Matsushima, G. K. (2001). Episodic demyelination and subsequent remyelination within the murine central nervous system: changes in axonal calibre. Neuropathol. Appl. Neurobiol. 27, 50–58. doi: 10.1046/j.0305-1846.2001.00301.x
Matsushima, G. K., and Morell, P. (2001). The neurotoxicant, cuprizone, as a model to study demyelination and remyelination in the central nervous system. Brain Pathol. 11, 107–116. doi: 10.1111/j.1750-3639.2001.tb00385.x
Morell, P., and Quarles, R. H. (1999a). “Characteristic composition of myelin,” in Basic Neurochemistry: Molecular, Cellular and Medical Aspects, 6th Edn, eds. G. J. Siegel, B. W. Agranoff, R. W. Albers, S. K. Fisher, and M. D. Uhler. Available online at: https://www.ncbi.nlm.nih.gov/books/NBK28221/ (accessed June 1, 2018).
Morell, P., and Quarles, R. H. (1999b). “The myelin sheath,” in Basic Neurochemistry: Molecular, Cellular and Medical Aspects, 6th Edn, eds. G. J. Siegel, B. W. Agranoff, R. W. Albers, S. K. Fisher, and M. D. Uhler. Available online at: https://www.ncbi.nlm.nih.gov/books/NBK28221/ (accessed June 1, 2018).
Plemel, J. R., Liu, W. Q., and Yong, V. W. (2017). Remyelination therapies: a new direction and challenge in multiple sclerosis. Nat. Rev. Drug Discov. 16, 617–634. doi: 10.1038/nrd.2017.115
Popescu, B., Pirko, I., and Lucchinetti, C. F. (2013). Pathology of multiple sclerosis: where do we stand? Contin. Lifelong Learn Neurol. 19, 901–921. doi: 10.1212/01.CON.0000433291.23091.65
Seifert, A. C., Li, C., Wilhelm, M. J., Wehrli, S. L., and Wehrli, F. W. (2017). Towards quantification of myelin by solid-state MRI of the lipid matrix protons. NeuroImage 163, 358–367. doi: 10.1016/j.neuroimage.2017.09.054
Sheth, V., Shao, H., Chen, J., Vandenberg, S., Corey-Bloom, J., Bydder, G. M., et al. (2016). Magnetic resonance imaging of myelin using ultrashort echo time (UTE) pulse sequences: phantom, specimen, volunteer and multiple sclerosis patient studies. NeuroImage 136, 37–44. doi: 10.1016/j.neuroimage.2016.05.012
Sheth, V. R., Fan, S., He, Q., Ma, Y., Annese, J., Switzer, R., et al. (2017). Inversion recovery ultrashort echo time magnetic resonance imaging: a method for simultaneous direct detection of myelin and high signal demonstration of iron deposition in the brain - a feasibility study. Magn. Reson. Imaging 38, 87–94. doi: 10.1016/j.mri.2016.12.025
Song, S. K., Yoshino, J., Le, T. Q., Lin, S. J., Sun, S. W., Cross, A. H., et al. (2005). Demyelination increases radial diffusivity in corpus callosum of mouse brain. NeuroImage 26, 132–140. doi: 10.1016/j.neuroimage.2005.01.028
Soustelle, L., Antal, M. C., Lamy, J., Rousseau, F., Armspach, J. P., de Loureiro, P., et al. (2019). Correlations of quantitative MRI metrics with myelin basic protein (MBP) staining in a murine model of demyelination. NMR Biomed. 2019:e4116. doi: 10.1002/nbm.4116
Sun, S. W., Liang, H. F., Trinkaus, K., Cross, A. H., Armstrong, R. C., Song, S. K., et al. (2006). Noninvasive detection of cuprizone induced axonal damage and demyelination in the mouse corpus callosum. Magn. Reson. Med. 55, 302–308. doi: 10.1002/mrm.20774
Taylor, L. C., Gilmore, W., Ting, J. P. Y., and Matsushima, G. K. (2010). Cuprizone induces similar demyelination in male and female C57BL/6 mice and results in disruption of the estrous cycle. J. Neurosci. Res. 88, 391–402. doi: 10.1002/jnr.22215
Thiessen, J. D., Zhang, Y., Zhang, H., Wang, L., Buist, R., Bigio, M. R. D., et al. (2013). Quantitative MRI and ultrastructural examination of the cuprizone mouse model of demyelination. NMR Biomed. 26, 1562–1581. doi: 10.1002/nbm.2992
Varma, G., Duhamel, G., de Bazelaire, C., and Alsop, D. C. (2015). Magnetization transfer from inhomogeneously broadened lines: a potential marker for myelin: magnetization transfer from inhomogeneously broadened lines. Magn. Reson. Med. 73, 614–622. doi: 10.1002/mrm.25174
Wang, N., Zhuang, J., Wei, H., Dibb, R., Qi, Y., Liu, C., et al. (2019). Probing demyelination and remyelination of the cuprizone mouse model using multimodality MRI. J. Magn. Reson. Imaging. 2019, 1852–1865. doi: 10.1002/jmri.26758
Wang, Y., Wang, Q., Haldar, J. P., Yeh, F. C., Xie, M., Sun, P., et al. (2011). Quantification of increased cellularity during inflammatory demyelination. Brain 134, 3590–3601. doi: 10.1093/brain/awr307
Wilhelm, M. J., Ong, H. H., Wehrli, S. L., Li, C., Tsai, P. H., Hackney, D. B., et al. (2012). Direct magnetic resonance detection of myelin and prospects for quantitative imaging of myelin density. Proc. Natl. Acad. Sci. U. S. A. 109, 9605–9610. doi: 10.1073/pnas.1115107109
Wood, T. C., Simmons, C., Hurley, S. A., Vernon, A. C., Torres, J., Dell'Acqua, F., et al. (2016). Whole-brain ex-vivo quantitative MRI of the cuprizone mouse model. PeerJ 4:2632. doi: 10.7717/peerj.2632
Xie, M., Tobin, J. E., Budde, M. D., Chen, C. I., Trinkaus, K., Cross, A. H., et al. (2010). Rostrocaudal analysis of corpus callosum demyelination and axon damage across disease stages refines diffusion tensor imaging correlations with pathological features. J. Neuropathol. Exp. Neurol. 69, 704–716. doi: 10.1097/NEN.0b013e3181e3de90
Yang, H. J., Wang, H., Zhang, Y., Xiao, L., Clough, R. W., Browning, R., et al. (2009). Region-specific susceptibilities to cuprizone-induced lesions in the mouse forebrain: Implications for the pathophysiology of schizophrenia. Brain Res. 1270(Suppl.C), 121–130. doi: 10.1016/j.brainres.2009.03.011
Young, K. M., Psachoulia, K., Tripathi, R. B., Dunn, S-J., Cossell, L., Attwell, D., et al. (2013). Oligodendrocyte dynamics in the healthy adult CNS: evidence for myelin remodeling. Neuron 77, 873–885. doi: 10.1016/j.neuron.2013.01.006
Keywords: MRI, IR-UTE, myelin imaging, mouse model, cuprizone
Citation: Searleman AC, Ma Y, Sampath S, Sampath S, Bussell R, Chang EY, Deaton L, Schumacher AM and Du J (2024) 3D inversion recovery ultrashort echo time MRI can detect demyelination in cuprizone-treated mice. Front. Neuroimaging 3:1356713. doi: 10.3389/fnimg.2024.1356713
Received: 16 December 2023; Accepted: 15 April 2024;
Published: 09 May 2024.
Edited by:
Xi-Nian Zuo, Beijing Normal University, ChinaReviewed by:
Nian Wang, Indiana University Bloomington, United StatesTsen-Hsuan Lin, GlaxoSmithKline, United States
Copyright © 2024 Searleman, Ma, Sampath, Sampath, Bussell, Chang, Deaton, Schumacher and Du. This is an open-access article distributed under the terms of the Creative Commons Attribution License (CC BY). The use, distribution or reproduction in other forums is permitted, provided the original author(s) and the copyright owner(s) are credited and that the original publication in this journal is cited, in accordance with accepted academic practice. No use, distribution or reproduction is permitted which does not comply with these terms.
*Correspondence: Jiang Du, jiangdu@ucsd.edu
†Present address: Robert Bussell, CorTechs AI, San Diego, CA, United States
‡These authors have contributed equally to this work