Functional Connectivity Changes Across the Spectrum of Subjective Cognitive Decline, Amnestic Mild Cognitive Impairment and Alzheimer’s Disease
 Ziqi Wang1,2†
  Kaini Qiao3,4,5†
  Guanqun Chen1 Danyang Sui3,4,5
  Hao-Ming Dong3,4,5
  Yin-Shan Wang5
  Hui-Jie Li3,4,5
  Jie Lu6,7,8
  Xi-Nian Zuo3,4,5
  Ying Han1,9,10,11*
- 1Department of Neurology, Xuanwu Hospital, Capital Medical University, Beijing, China
- 2Department of Neurology, Chengdu Fifth People’s Hospital, Chengdu, China
- 3CAS Key Laboratory of Behavioral Science, Institute of Psychology, Beijing, China
- 4Research Center for Lifespan Development of Mind and Brain (CLIMB), Institute of Psychology, Beijing, China
- 5Department of Psychology, University of Chinese Academy of Sciences (CAS), Beijing, China
- 6Department of Radiology, Xuanwu Hospital, Capital Medical University, Beijing, China
- 7Department of Nuclear Medicine, Xuanwu Hospital, Capital Medical University, Beijing, China
- 8Beijing Key Laboratory of Magnetic Resonance Imaging and Brain Informatics, Beijing, China
- 9Center of Alzheimer’s Disease, Beijing Institute for Brain Disorders, Beijing, China
- 10Beijing Institute of Geriatrics, Beijing, China
- 11National Clinical Research Center for Geriatric Disorders, Beijing, China
The abnormality occurs at molecular, cellular as well as network levels in patients with Alzheimer’s disease (AD) prior to diagnosis. Most previous connectivity studies were conducted at 1 out of 3 (local, meso and global) scales in subjects covering only part of the entire AD spectrum (subjective cognitive decline, SCD; amnestic mild cognitive impairment, aMCI; and then fully manifest AD). Data interpretation within the framework of disease progression is therefore difficult. The current study included 3 age- and sex-matched cohorts: SCD (n = 32), aMCI (n = 37) and fully-established AD (n = 30). A group of healthy elderly subjects (n = 40) were included as a normal control (NC). Network connectivity was examined at the local (degree centrality), meso [subgraph centrality (SC)], and global (eigenvector and page-rank centralities) levels. As compared to NC, SCD subjects had isolated decrease of SC in primary (somatomotor and visual) networks. aMCI subjects had decreased centralities at all three scales in associative (frontoparietal control, dorsal attention, limbic and default) networks. AD subjects had increased centrality at the global scale in all seven networks. There was a positive association between Montreal Cognitive Assessment (MoCA) scores and DC in the frontoparietal control network in SCD, a negative relationship between Mini-Mental State Examination (MMSE) scores and EC in the somatomotor network in AD. These findings suggest that the primary network is impaired as early as in SCD. Impairment in the associative network also starts at the local level at this stage and may contribute to the cognitive decline. As associative network impairment extends from local to meso and global scales in aMCI, compensatory mechanisms in the primary network are activated.
Introduction
Brain pathology of Alzheimer’s disease (AD) occurs decades before the manifestations of clinical AD (Dubois et al., 2016). With the pathological cascade, three different stages show the progression of AD: preclinical AD, mild cognitive impairment (MCI) and late stage of AD (Sperling et al., 2011). Subjective cognitive decline (SCD) in the setting of preclinical AD is defined by self-perception of worsening cognitive capacity but no impairment in cognition on standard neuropsychological assessments and no evidence for MCI or prodromal AD or dementia (Jessen et al., 2014). SCD can significantly predict MCI or dementia (Rabin et al., 2017). MCI, especially amnestic mild cognitive impairment (aMCI), progresses to AD or other forms of dementia more than people without MCI (Kantarci et al., 2009). Such a three-stage continuum of AD progression (SCD, aMCI, and AD) offers us a systematic perspective to study AD.
Resting-state functional magnetic resonance imaging (rfMRI) has been increasingly used as a reliable method (Zuo and Xing, 2014) to detect brain network abnormalities in aMCI (Agosta et al., 2012; Bharath et al., 2017; Wang et al., 2018b) or AD (Binnewijzend et al., 2014; Wang et al., 2018b). The rfMRI findings in AD and MCI are rather consistent across different studies in different networks, such as default mode network (Agosta et al., 2012), somatomotor network (Albers et al., 2015), dorsal attention network (Qian et al., 2015), limbic network (Nestor et al., 2003), and frontoparietal control network (Agosta et al., 2012; Brier et al., 2012; Munro et al., 2015). Nevertheless, relatively few studies have been systematically examined across the entire three-stage continuum of AD progression. Furthermore, rare quantitative conclusions of brain network changes have been drawn on the dynamical mechanism of the disease deterioration. Meanwhile, from a methodological view, most previous studies focused on a single scale of functional brain organization in AD, e.g., only at the global scale (Supekar et al., 2008; Binnewijzend et al., 2014) or only at the local scale (Grady et al., 2003; Klaassens et al., 2017). Thus, an examination of multi-scale network topology across SCD, aMCI, and AD would enhance the current understanding of neuroimaging pathology of AD progression.
Network analyses of human brain functional connectomes, based on graph theory, can advance our understanding of the multi-scale intrinsic architecture of the human brain connectome using different centralities (Zuo et al., 2012). Degree centrality (DC) is the number of direct connections to a brain network node and reflects local-scale connectivity. Subgraph centrality (SC) characterizes the odd-cyclic subgraph or closed walk of the network node, and represents a connectivity measure at meso-scale (Zuo et al., 2012). Both eigenvector centrality (EC) and page-rank centrality (PC) determine the nodal connectivity with their adjacency connectivity at global-scale (Zuo et al., 2012). More information about DC, SC, EC, and PC can also be seen in Supplementary Materials 1. Recently, a few studies have applied network centrality at a single scale, such as EC (Binnewijzend et al., 2014; Adriaanse et al., 2016; Lou et al., 2016; Qiu et al., 2016) or DC (Guo et al., 2016) in MCI or AD.
In this study, we aimed to draw a full picture of functional changes by using network centrality at multi-scale (DC, SC, EC, PC) in AD continuum (SCD, aMCI, and AD) and age- and sex-matched healthy elderly subjects as normal control (NC). Additionally, we evaluated the relationship between network centrality at multi-scale and cognitive performances. Given the three stages of AD continuum, we hypothesized that a progression-dependent pattern of network centrality changes was detectable at multiple scales.
Materials and Methods
Participants
All our subjects are from the database (NCT 02353884, 02353845, 02225964). A total of 188 patients, including 47 SCD, 93 aMCI and 48 AD, were recruited from the memory clinic of neurology department of Xuanwu Hospital, Capital Medical University. While 92 NC were recruited by advertisement from the local community. All the subjects had no history of stroke, head injury, or other major neuropsychiatric illness, such as Parkinson’s disease, encephalitis, epilepsy, psychosis or congenital mental growth retardation, alcohol or drug abuse, and other diseases or treatments that can affect cognitive functions (Morris, 1993). After being age- and sex-matched for each group, 139 subjects (40 NC, 32 SCD, 37 aMCI, 30 AD) were included for final analysis.
Demographic, Clinical, and Cognitive Variables
The diagnoses for SCD, aMCI, and AD were made in consensus by two consultant psychiatrists. The criteria for AD has been reported in detail in the previous study (Wang et al., 2014). Briefly, we diagnosed AD using the revised version of Diagnostic and Statistical Manual of Mental Disorders 4th Edition (DSM-IV) Criteria (American Psychiatric Association, 1994) for Dementia and the National Institute of Neurologic and Communicative Disorders and Stroke-Alzheimer’s Disease and Related Disorders Association (NINCDS-ADRDA) Criteria (McKhann et al., 1984) for possible or probable AD. In addition, patients with AD had the Clinical Dementia Rating scale (CDRs) score of 1 and were older than 50 years old (Morris, 1993). The criteria of aMCI was as follows: (1) memory complaint (if possible) confirmed by an informant; (2) preserved activities of daily living; (3) the scores for the Chinese version of the Mini-Mental State Examination (MMSE) ≥ 24; (4) CDRs score = 0.5 (Portet et al., 2006); (5) not demented according to the DSM-IV (Petersen et al., 1999, 2001; Petersen, 2003); and (6) age older than 50 years old. More information about the criteria of aMCI has been described in detail in a previous study (Zhang et al., 2017). The criteria of SCD (Shu et al., 2018) included: (1) self-reported persistent memory decline, which was confirmed by informants; (2) performing normally on the MMSE or the Beijing version of the Montreal Cognitive Assessment (MoCA; adjusted for age, sex, and education); (3) CDRs score = 0; and (4) age older than 50 years old. The criteria of NC were: (1) no self-reported persistent memory decline; (2) performing normally on the MMSE or MoCA (adjusted for age, sex, and education); (3) CDRs score = 0; and (4) age older than 50 years old.
We obtained information on age, sex and years of education via interview, and developed a standard clinical evaluation protocol as described above to collect scores for MMSE, Auditory Verbal Learning Test (AVLT), MoCA, and CDRs from all the participants.
MRI Acquisition and Processing
Magnetic resonance imaging (MRI) scans were acquired at a 3.0 T Siemens scanner (Erlangen, Germany) at Beijing Xuanwu Hospital, Capital Medical University. Participants were all instructed to lie quietly and close their eyes, and received a T1-weighted structural MRI scan (MP-RAGE sequence: TR = 1,900 ms, TE = 2.2 ms, TI = 900 ms, FA = 9°, matrix = 256 × 256, slice thickness = 1.0 mm; 176 sagittal slices, no gap) and a rfMRI scan (EPI sequence: TR = 2,000 ms, TE = 40 ms, FA = 90°, 28 axial slices, 4 mm isotropic voxel, matrix = 64 × 64) of 8 min.
Both structural and functional image preprocessing were completed in the Connectome Computation System (CCS1), which has been described previously (Xu et al., 2015). Briefly, CCS extended the network centrality analyses (Zuo et al., 2012) from 3D volumetric element (voxel) to 2D surface element (vertex) by projecting the 3D rfMRI images onto 2D cortical surfaces (Chen et al., 2014). Such an analytic strategy has been demonstrated to be more effective to mitigate partial volume effects and increase test-retest reliability of rfMRI analyses (Zuo et al., 2013; Zuo and Xing, 2014). First, T1 images were employed to reconstruct individual cortical surfaces (Ségonne et al., 2004, 2007). Second, rfMRI images were preprocessed in individual native spaces to equilibrate, de-spike, correct slice time and motion, normalize global mean intensity, regress out the white matter, cerebrospinal fluid and Friston-24 motion parameters, band-pass (0.01–0.1 Hz) filter and remove linear and quadratic trends of the timeseries signals. Finally, the rfMRI images were matched to their individual structural images using a boundary-based registration (BBR) algorithm (Greve and Fischl, 2009). They were then further projected onto the fsaverage5 cortical surfaces in the standard MNI space (10,242 vertices per hemisphere and 4 mm inter-vertex gap on average; Thomas Yeo et al., 2011).
Quality control procedure was carried out with CCS to high-quality preprocessed brain images for network centrality analysis. Specifically, screenshots were obtained for skull stripping, tissue segmentation, surface reconstruction, BBR image registration, and the head motion correction during rfMRI (Jiang et al., 2015). For those individuals with any of the first three showing bad quality, the brain extraction will be invented by manually editing. Meanwhile, head motion of each participant met following criterion: the mean frame-wise displacement (meanFD) < 0.2 mm, the maximum degree of rotational movement (maxRot) ≤ 2° and the maximum distance of translational movement (maxTran) ≤ 2 mm.
Network Centrality Mapping and Statistics
The procedure of mapping the centrality metrics for individual functional connectomes completely followed the methods described by Zuo et al. (2012), except that the connectomes were constructed on cortical surfaces. The fsaverage5 cortical surface meshes consisted of 17,064 vertices with the preprocessed rfMRI time series. Fisher-z transformed Pearson’s correlations were calculated between each paired vertices. The significance above the threshold (p = 0.0001, uncorrected) was used to determine an edge connecting. This generated individual binary adjacency matrices for subsequent network centrality computation. Specifically, given a node, its degree centrality (DC) was computed as the number of the edges connecting to the node, and commonly measured a nodal direct connectivity at a local network scale. SC measures the participation of a node in all subgraphs at a meso network scale and is calculated based on the first 20 eigenvalues and eigenvectors of the adjacency matrix. At a global network scale, eigenvector centrality (EC), which is the first eigenvector of the adjacency matrix, is the one that corresponds to the largest eigenvalue and can measure global features of the graph. PC is a variant EC and introduces a small probability of 0.15 for random damping to handle walking traps on a graph. All these four metrics of network centrality have been shown with moderate to high test-retest reliability in 3D volume space and should be more reliable for their versions of 2D surface space as computed in the present work, due to the previous observation on the reliability improvement of local functional connectivity with updates of computational space (Zuo et al., 2013).
For each of the four types of network centrality described above, its full cortical maps were first adjusted by individual intracranial volume and then fed the subsequent FreeSurfer group analysis to evaluate various group-level statistics. A FSGD (FreeSurfer Group Descriptor) file was constructed for the four groups of participants (NC, SCD, aMCI, and AD) to implement a set of ANCOVA using general linear models that considered diagnosis, sex, age, and years of education as covariates with three contrasts of group comparisons (SCD vs. NC, aMCI vs. NC, AD vs. NC). The vertex-wise significance values for each contrast of the group comparisons were corrected with false discovery rate (FDR) method (corrected p = 0.05, minimal surface cluster area = 25 mm2). The partial correlations between the mean centrality at cluster-level within most abnormal topology metrics (≥ 2 stages of SCD, aMCI, and AD) and behavioral measurements (MMSE, AVLT, MoCA) were also evaluated after controlling age, sex, and years of education. We used the Bonferroni corrections for multiple comparisons at P < 0.05 and for groups at all three scales.
For the purpose of locating the network at both network-level and area-level, we reported the results with brain regions showing significant changes across the groups using the cortical parcellation of both functional networks (see Figure 1A), derived by Yeo et al. (2011) and anatomical Destrieux Atlas derived by Fischl et al. (2004).
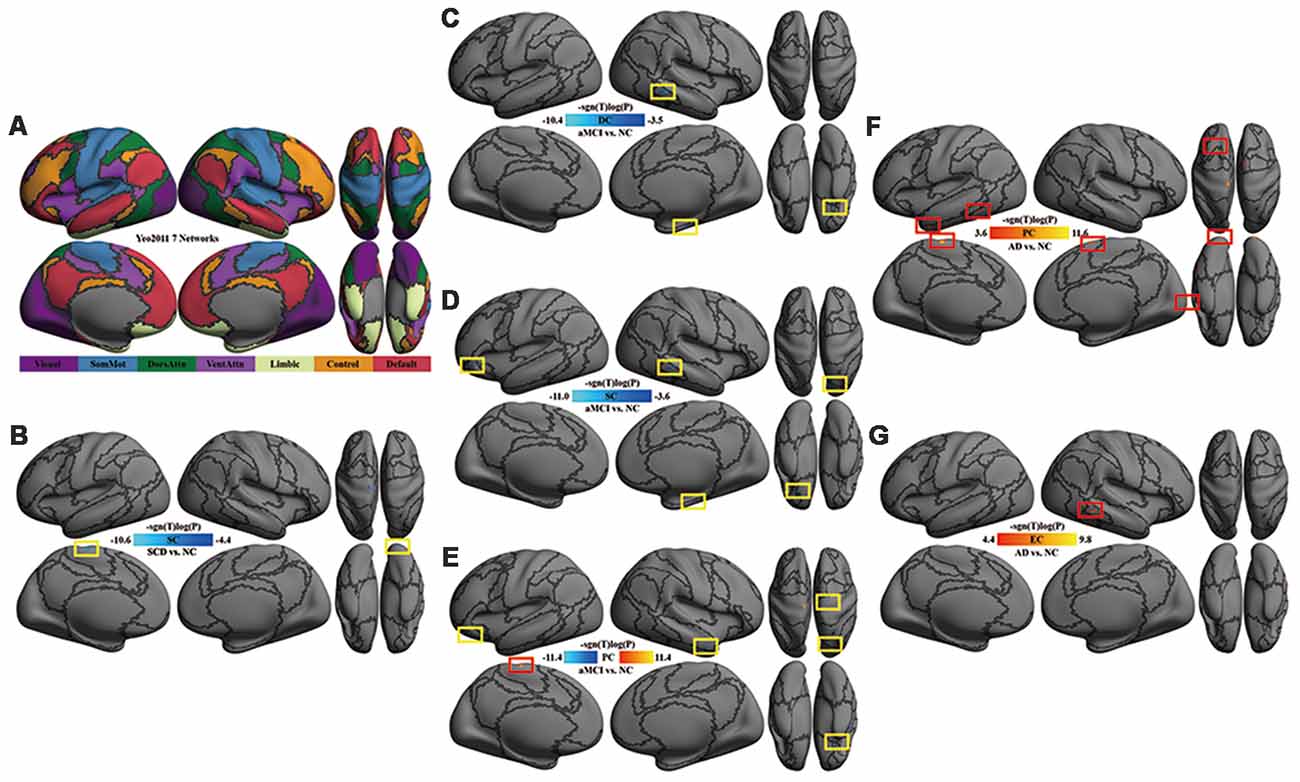
Figure 1. Multi-scale network centrality changes in AD progression. (A) The seven networks map in Yeo et al. (2011). (B) SC in SCD vs. NC. The reduced SC in SCD was located in the left somatomotor network (left paracentral cortex) and the right visual network (right occipital cortex). (C) DC in aMCI vs. NC. The reduced DC in aMCI were located in the right default network (orbital gyri), the right limbic network (parahippocampal areas) and the right frontoparietal control network (middle temporal area). (D) SC in aMCI vs. NC. Except for the default, limbic and frontoparietal control network, the reduced SC in aMCI extended to the left default network (orbital cortex) and the right dorsal attention network (superior parietal areas). (E) PC in aMCI vs. NC. Significant decreases of PC in aMCI were observed within the default network (right middle temporal and bilateral orbital gyrus), the right somatomotor network (precentral area), the right dorsal attention network (superior parietal area) and the left limbic network (orbital areas), whereas significant increases of PC in aMCI were detectable within the left somatomotor network (paracentral area). (F) PC in AD vs. NC. The increased PC in AD were located in the visual network (occipital areas), the left somatomotor network (paracentral area), the left limbic network (temporal pole), the left dorsal attention network (inferior temporal area), the left default network (superior frontal gyrus) and the right ventral attention network (superior frontal area). (G) EC in AD vs. NC. A significant increase of EC was found in the right frontoparietal control network (inferior temporal sulcus). All the above tests were thresholded at an false discovery rate (FDR) corrected significance level of p < 0.05. Gray curves indicate the boundaries according to the seven networks map in Yeo et al. (2011). Abbreviations: NC = normal control; SCD = subjective cognitive decline; aMCI = amnestic mild cognitive impairment; AD = Alzheimer’s disease; DC = degree centrality; SC = subgraph centrality; PC = page-rank centrality; EC = eigenvector centrality.
Results
Age, sex and years of education were well matched among groups. There were significant differences in MMSE, AVLT and MoCA scores among groups (p < 0.001). AD had significantly lower scores than the other three groups by subgroups analyzed (Table 1).
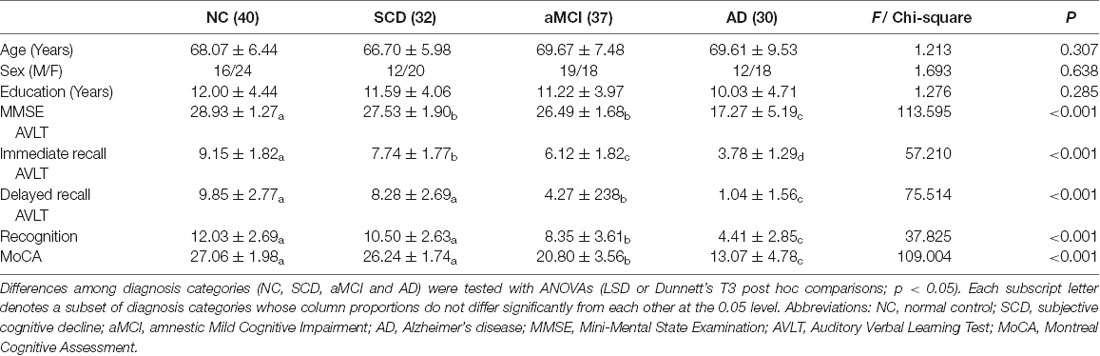
Table 1. Demographic information and behavioral measurements.
Meso-scale Network Centrality Reduced in SCD
Compared with NC, SC was decreased in the left somatomotor network (paracentral cortex) and the right visual network (occipital cortex) in SCD patients (Table 2, Figure 1B).
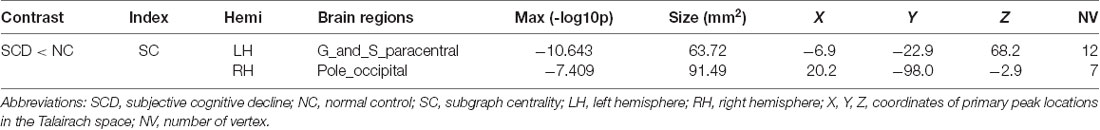
Table 2. Full list of brain regions with significant SC differences between SCD and NC.
Multi-scale Network Centrality Altered in aMCI
Compared with NC, DC was decreased in the right default network (orbital gyri), the limbic network (left orbital and right parahippocampal areas) and the right frontoparietal control network (middle temporal area) in aMCI (Figure 1C). In aMCI, SC was decreased in the limbic network (left orbital cortex and right parahippocampal area), the left default network (the orbital cortex), the right dorsal attention network (superior parietal areas) and the right frontoparietal control network (middle temporal area; Figure 1D). In aMCI, PC was decreased in the default network (bilateral orbital gyrus, right middle temporal and left frontal areas), the right somatomotor network (precentral area), the right dorsal attention network (superior parietal area) and the bilateral limbic network (orbital areas), whereas, it was increased in the left somatomotor network (paracentral area; Table 3, Figure 1E).
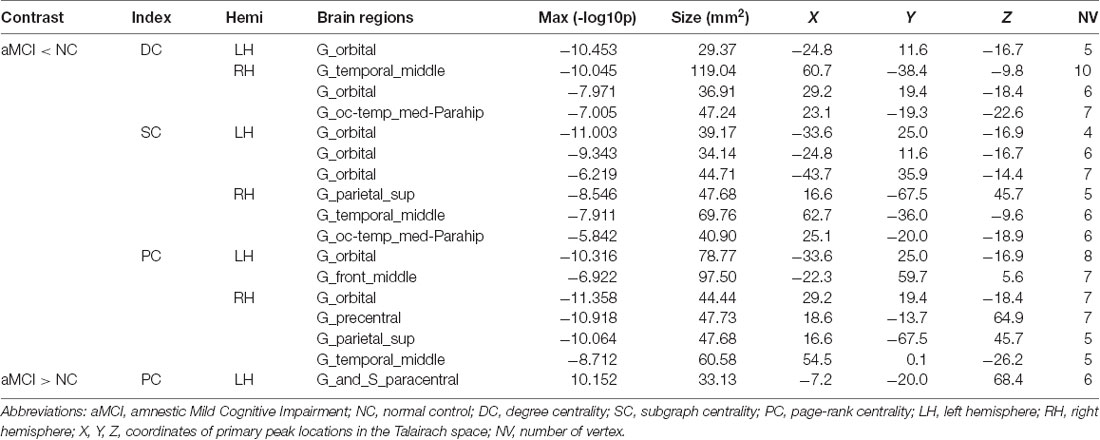
Table 3. Full list of brain regions with significant centralities differences between aMCI and NC.
Global-Scale Network Centrality Enhanced in AD
Compared with NC, AD had an increase of global network centrality but lacked any centrality changes at both local and meso scales (Table 4). PC was increased in the visual network (occipital areas), the left somatomotor network (paracentral area), the left limbic network (temporal pole), the left dorsal attention network (inferior temporal area), the left default network (superior frontal gyrus) and the right ventral attention network (superior frontal area; Figure 1F). EC was increased in the right frontoparietal control network (inferior temporal sulcus; Figure 1G).
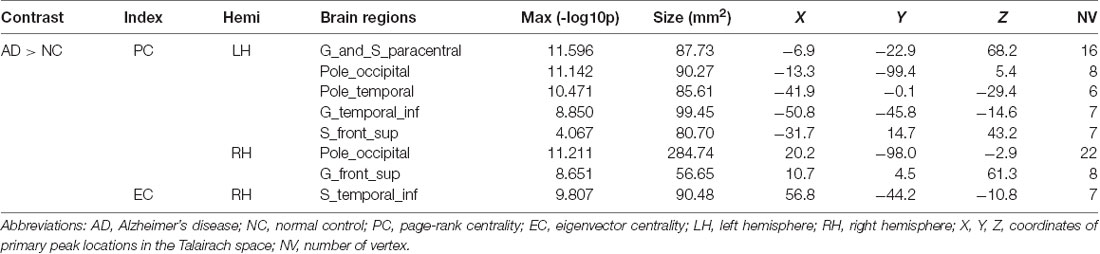
Table 4. Full list of brain regions with significant centralities differences between AD and NC.
Post hoc Cluster-Level Analyses
Compared with NC, the area of the left somatomotor network showed changes in centralities at local, meso and global scales in AD progression. DC, SC, PC and EC decreased in SCD but increased in aMCI and AD. When the relationship between the centralities and cognitive performance was deeply analyzed, negative associations between SC and AVLT-Recognition scores in NC (r = −0.4093, p < 0.05) and between EC and MMSE total scores in AD (r = −0.4908, p < 0.05) were found (Figure 2).
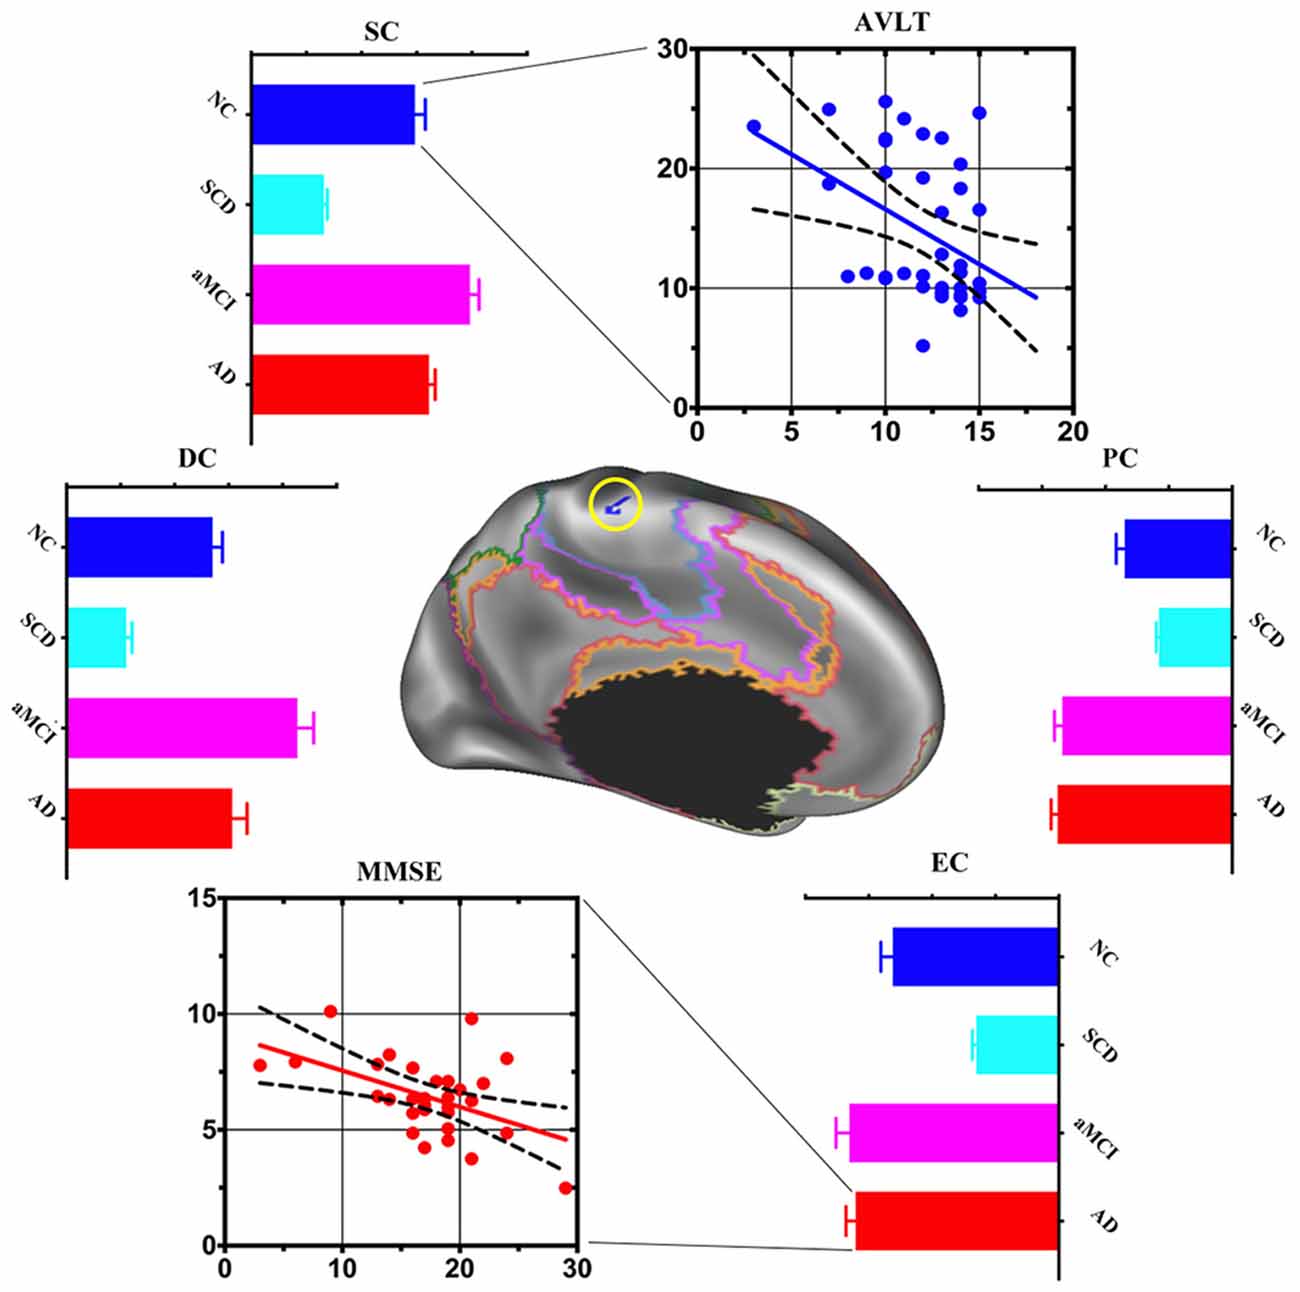
Figure 2. Post hoc cluster-level analyses in the left somatomotor network. Multi-scale centrality and behavioral performance in the left somatomotor network region among NC, SCD, aMCI and AD. Compared with NC, the area of the left somatomotor network showed centralities change at local, meso and global scales in AD progression. Mean DC, SC and EC values decreased in SCD, increased in aMCI and AD. The scatter plot exhibited negative association between: (1) mean SC values and auditory verbal learning test (AVLT)-Recognition scores in the NC (r = −0.4093, p < 0.05); and (2) mean EC values and Mini-Mental State Examination (MMSE) total scores in the AD (r = −0.4908, p < 0.05).
Compared with NC, the area of the right frontoparietal control network also exhibited multi-scale network centrality changes in AD progress. SCD had a decrease of DC and PC and an increase of SC and EC. DC, SC, PC, and EC decreased in aMCI but increased in AD. SCD group showed a significant positive association between DC and MoCA scores (Figure 3).
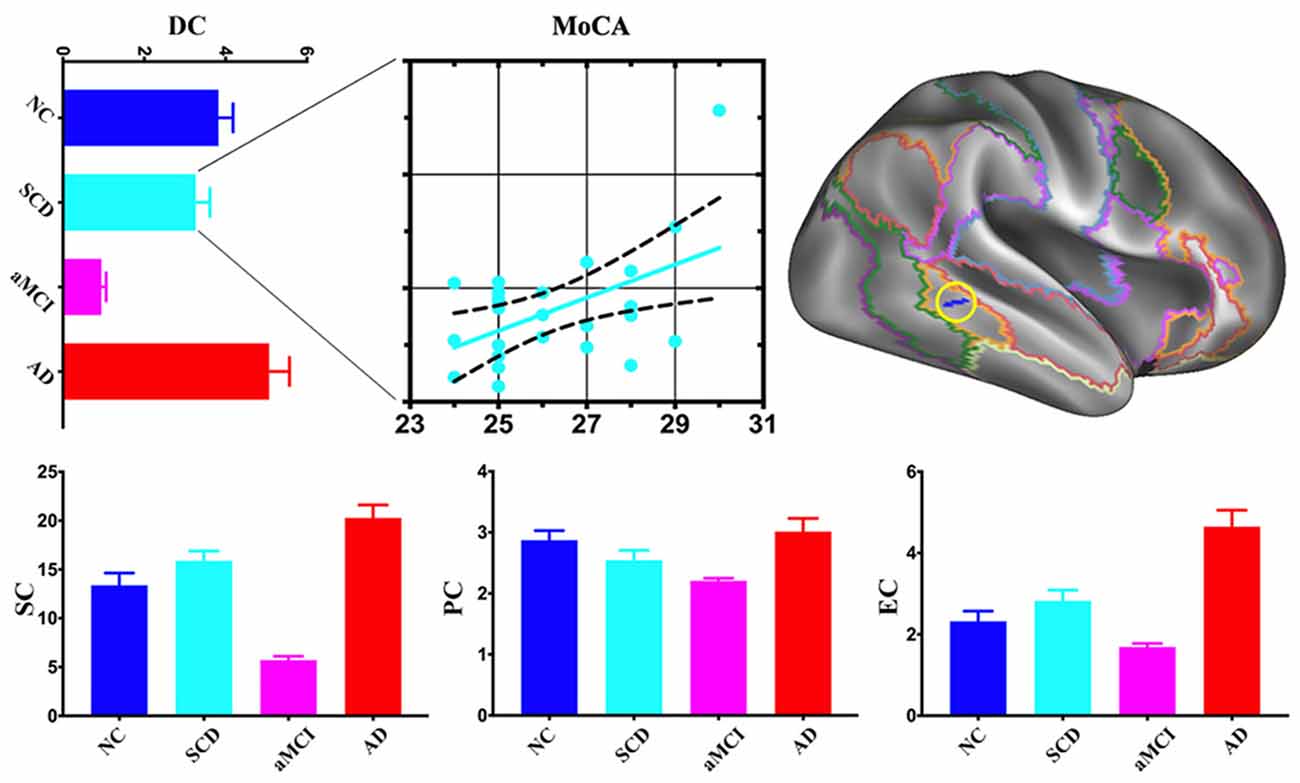
Figure 3. Post hoc cluster-level analyses in the right frontoparietal control network. aMCI showed the lowest centralities at local, meso and global scales in the area of the right frontoparietal control network. The scatter plot exhibited a positive association between mean DC values and Montreal Cognitive Assessment (MoCA) total scores in the SCD (r = 0.5076, p < 0.05).
Discussion
The main finding of the present study is that different functional network centralities changed at different scale levels across the spectrum of SCD, aMCI, and AD. aMCI exhibited multi-scale abnormal centralities, while SCD and AD exhibited single-scale abnormal centrality: (1) primary, meso-scale, and impairment in SCD; (2) both primary and associative, impairment and compensation coexisted in aMCI; and (3) both primary and associative, extended global compensation in widespread networks in AD.
Meso-scale Topological Impairment in Primary Network in SCD
In this study, we observed decreased meso centrality (SC) in the left somatomotor network and right visual network in individuals with SCD. It is worth noting that we found no enhanced centralities in SCD. Compensatory mechanisms, frequently proposed in aMCI (Qi et al., 2010) and AD (Agosta et al., 2012), seem to have not yet happened at this point since brain network impairments are not yet severe enough. The motor system receives sensory information for movement control (Rizzolatti et al., 1997). Many pyramidal and extrapyramidal motor impairments affect a substantial portion of AD patients and progressively worsen along with cognitive impairment (Albers et al., 2015). The onset of accelerated rates of motor decline can occur 12 years before the onset of MCI in initially cognitively healthy adults (Buracchio et al., 2010). In the present study, the decrement of multi-scale centrality in the somatomotor network may indicate motor dysfunction and further supports the theory that motor impairment could occur at an early stage of AD, or even precede the onset of the cognitive impairment for AD by a decade and longer (Albers et al., 2015). The previous study has detected an increased functional brain network efficiency during the audiovisual task in aging (Wang et al., 2018a), while there is a negative connection between within-network functional connectivity in the visual network and levels of SCD (Contreras et al., 2017). These results indicate visual network impairment beginning from SCD. Our result provides further evidence for topological impairment in the visual network, which may be associated with early indications of cognitive impairment. In summary, these findings might help us to better identify or understand early, multi-scale primary network (e.g., sensory and motor) impairments caused by the early AD.
Multi-scale Topological Impairment and Compensation Activated in aMCI
Global-scale centrality impairment and compensation in primary network coexist in aMCI. We found both increased and decreased PC in aMCI in the somatomotor network. Earlier studies have reported both increased and decreased brain connectivity in aMCI as well (Qi et al., 2010; Wang et al., 2015). In contrast to SCD with only decreased centrality at the meso scale and AD with only increased centrality at global-scale, aMCI exhibited bidirectional alterations of brain network centrality at the global-scale. Summarizing the content, we draw a conclusion that disconnection syndrome (Qiu et al., 2016) and compensation in primary network coexist in aMCI.
Multi-scale centrality impairment in associative networks occurs in aMCI. We found decreased DC, SC, and PC in the limbic and default mode network, reduced SC and PC in the dorsal attention network, as well as declined DC and SC in the frontoparietal control network in aMCI. In previous studies, atrophy (Callen et al., 2001) and hypometabolism (Nestor et al., 2003) in the limbic network in AD have been widely reported. Brain alterations in the default mode network in aMCI, such as amyloid deposition (Agosta et al., 2012), atrophy (Thompson et al., 2003), decreased activity (Sorg et al., 2007), and reduced connectivity (Qi et al., 2010) have also been reported. Our findings in the two networks (limbic and default) are consistent with previous studies and add the evidence for functional disconnection in aMCI. In the present study, significant meso- and global-scale topological impairments were found in the dorsal attention network but not in the ventral attention network. These findings suggest that functional connectivity appears to be preferentially affected in the dorsal attention network and preserved or less impaired in the ventral attention network in aMCI (Sorg et al., 2007; Qian et al., 2015). Dorsal attention network is involved in the endogenous attention orienting (top-down) process (Fox et al., 2006), while ventral attention network is responsible for reorienting attention in response to salient sensory stimuli (Fox et al., 2006; bottom-up process). In aMCI patients, deteriorations in goal-relevant processing such as divided attention and selective attention (Dannhauser et al., 2005; Redel et al., 2010) have occurred, while still retain the ability for bottom-up processing (Zhang et al., 2015). This asymmetric pattern of network topology impairments of attention networks might help us better understand attention deficits in patients with aMCI. As for the frontoparietal control network, previous studies are not quite consistent. One study reported decreased connectivity in aMCI (Munro et al., 2015), while another one reported increased connectivity (Agosta et al., 2012). The discrepancy between these studies may be attributed to differences in severity of cognitive impairment and diagnostic criteria for patients. Centrality alterations, at the local and meso rather than global scales in our study, may suggest relatively less impairment in the frontoparietal control network in the stage of aMCI.
Global Compensation in All Seven Networks in AD
An intriguing finding of this study is that we probe a unique pattern of compensation in AD patients: enhanced global centrality in large scale was observed in all seven networks (both primary and associative networks). This result is consistent with previous studies, which revealed increased activity and connectivity in AD (Zhou et al., 2010; Agosta et al., 2012). A possible reason for such augments in AD may be that additional neural resources are recruited to compensate for losses. And this hypothesis has been supported by earlier studies showing that patients with AD are able to succeed in episodic memory tasks due to compensatory neuronal activity (Buckner, 2004; Schwindt and Black, 2009). There is an alternate network, a compensation network, consisting of the left posterior temporal cortex, calcarine cortex, posterior cingulate, and the vermis (Stern et al., 2000). Our study showed that centrality enhanced at the global scale in AD, which suggests that compensation in this stage of the disease has extended from local to remote. Furthermore, compensation is also active in both primary and associative networks.
Progressed From Local to Global, Impairment to Compensation in AD Continuum
Our previous study showed that the rich club of the human connectome was disrupted from SCD to AD (Yan et al., 2018). In the current study, SCD exhibited only primary network (sensory and motor) impairments, while aMCI and AD progressed to associative network impairments, such as limbic, default, attention and frontoparietal control networks. In addition, SCD displayed meso impairment, aMCI demonstrated local, meso and global scale alterations (impairment and compensation coexist), but AD had only global compensation. These findings show a progressive pattern of functional brain network in AD continuum: impairment occurs as early as in SCD (decreased SC) and continues and becomes severe enough in aMCI, then compensation is warranted.
When focused on both time and spatial cluster-level analysis, two interesting areas were found. In the left somatomotor network, centrality at all three levels decreased in SCD but increased in aMCI and AD. In addition, augmented centrality at global-scale only in AD exhibited a significantly negative relationship with cognitive performance (Figure 2). These findings provide evidence that compensatory mechanisms followed with clinical mechanisms progressed. As to the right frontoparietal control network (Figure 3), centralities decreased at the local scale, increased at the meso scale and coexisted at the global scale in SCD, while they decreased in aMCI and increased in AD at all three levels. Furthermore, only decreased centrality at local-scale in SCD showed a significant positive association with cognitive performance. We proposed that local associative network impairment directly affected cognitive function at the very early stage of AD, but subtle compensatory function at the meso and global scale balanced further cognitive impairment.
Based on the results from the current study, we hypothesize that brain network impairment starts in the primary network in SCD. Impairment in the associative network also starts at the local level at this stage and may contribute to the cognitive decline. As associative network impairment extends from local to meso and global scales in aMCI, compensatory mechanisms in the primary network are activated. Such a progressive pattern across the spectrum of SCD, aMCI, and AD, may underlie increased network topological scale and gives a dynamical description of the pathology of AD progression.
Limitations
Several limitations should be mentioned here: first, our study was not a real cohort, a longitudinal design in the future would still be necessary to quantitatively elucidate its dynamic topological changes. Second, we only had resting state functional magnetic resonance imaging (fMRI) data for this study, adding biomarkers will be more persuasive. Third, the fMRI data sets in this study had limited spatial and temporal resolutions, better spatial-temporal resolutions would definitely strengthen our conclusion.
Conclusion
SCD had an isolated decrease of SC in the primary (somatomotor and visual) networks. aMCI had both a decrease and an increase of global centrality in the primary motor network, as well as decreases at all three levels in associative (frontoparietal control, attention, limbic and default) network areas. AD had increased centrality at the global scale in all seven networks. In the cluster level, brain network impairment starts in the primary network in SCD. Impairment in the associative network also starts at the local level at this stage and may contribute to the cognitive decline. As associative network impairment extends from local to meso and global scales in aMCI, compensatory mechanisms in the primary network are activated. Such a progressive pattern across the spectrum of SCD, aMCI, and AD, may underlie increased network topological scale and gives a dynamical description on the pathology of AD progression.
Ethics Statement
All our subjects are from our database (NCT 02353884, 02353845, 02225964). This study was approved by the medical research ethics committee and institutional review board of Xuanwu Hospital, Capital Medical University. Written informed consents were obtained from all the participants and/or at least one of their families prior to the data acquisition.
Author Contributions
All authors listed have made a substantial, direct and intellectual contribution to the work, and approved it for publication.
Funding
This article was supported by the National Key Research and Development Program of China (2016YFC1306300, 2016YFC0103000), National Natural Science Foundation of China (Grant 61633018, 81801052, 81522021, 81430037, 81471731), Beijing Nature Science Foundation (7161009), Beijing Municipal Commission of Health and Family Planning (PXM2019_026283_000002).
Conflict of Interest Statement
The authors declare that the research was conducted in the absence of any commercial or financial relationships that could be construed as a potential conflict of interest.
Footnotes
Supplementary Material
The Supplementary Material for this article can be found online at: https://www.frontiersin.org/articles/10.3389/fninf.2019.00026/full#supplementary-material
References
Adriaanse, S. M., Wink, A. M., Tijms, B. M., Ossenkoppele, R., Verfaillie, S. C., Lammertsma, A. A., et al. (2016). The association of glucose metabolism and eigenvector centrality in Alzheimer’s disease. Brain Connect. 6, 1–8. doi: 10.1089/brain.2014.0320
Agosta, F., Pievani, M., Geroldi, C., Copetti, M., Frisoni, G. B., and Filippi, M. (2012). Resting state fMRI in Alzheimer’s disease: beyond the default mode network. Neurobiol. Aging 33, 1564–1578. doi: 10.1016/j.neurobiolaging.2011.06.007
Albers, M. W., Gilmore, G. C., Kaye, J., Murphy, C., Wingfield, A., Bennett, D. A., et al. (2015). At the interface of sensory and motor dysfunctions and Alzheimer’s disease. Alzheimers Dement. 11, 70–98. doi: 10.1016/j.jalz.2014.04.514
American Psychiatric Association. (1994). DSM-IV: Diagnostic and Statistical Manual of Mental Disorders. 4th Edn. Washington, DC: American Psychiatric Association.
Bharath, S., Joshi, H., John, J. P., Balachandar, R., Sadanand, S., Saini, J., et al. (2017). A multimodal structural and functional neuroimaging study of amnestic mild cognitive impairment. Am. J. Geriatr. Psychiatry 25, 158–169. doi: 10.1016/j.jagp.2016.05.001
Binnewijzend, M. A. A., Adriaanse, S. M., Van der Flier, W. M., Teunissen, C. E., de Munck, J. C., Stam, C. J., et al. (2014). Brain network alterations in Alzheimer’s disease measured by Eigenvector centrality in fMRI are related to cognition and CSF biomarkers. Hum. Brain Mapp. 35, 2383–2393. doi: 10.1002/hbm.22335
Brier, M. R., Thomas, J. B., Snyder, A. Z., Benzinger, T. L., Zhang, D., Raichle, M. E., et al. (2012). Loss of intranetwork and internetwork resting state functional connections with Alzheimer’s disease progression. J. Neurosci. 32, 8890–8899. doi: 10.1523/JNEUROSCI.5698-11.2012
Buckner, R. L. (2004). Memory and executive function in aging and AD. Neuron 44, 195–208. doi: 10.1016/j.neuron.2004.09.006
Buracchio, T., Dodge, H. H., Howieson, D., Wasserman, D., and Kaye, J. (2010). The trajectory of gait speed preceding mild cognitive impairment. Arch. Neurol. 67, 980–986. doi: 10.1001/archneurol.2010.159
Callen, D. J., Black, S. E., Gao, F., Caldwell, C. B., and Szalai, J. P. (2001). Beyond the hippocampus: MRI volumetry confirms widespread limbic atrophy in AD. Neurology 57, 1669–1674. doi: 10.1212/wnl.57.9.1669
Chen, G., Ward, B. D., Chen, G., and Li, S.-J. (2014). Decreased effective connectivity from cortices to the right parahippocampal gyrus in Alzheimer’s disease subjects. Brain Connect. 4, 702–708. doi: 10.1089/brain.2014.0295
Contreras, J. A., Goñi, J., Risacher, S. L., Amico, E., Yoder, K., Dzemidzic, M., et al. (2017). Cognitive complaints in older adults at risk for Alzheimer’s disease are associated with altered resting-state networks. Alzheimers Dement. 6, 40–49. doi: 10.1016/j.dadm.2016.12.004
Dannhauser, T. M., Walker, Z., Stevens, T., Lee, L., Seal, M., and Shergill, S. S. (2005). The functional anatomy of divided attention in amnestic mild cognitive impairment. Brain 128, 1418–1427. doi: 10.1093/brain/awh413
Dubois, B., Hampel, H., Feldman, H. H., Scheltens, P., Aisen, P., Andrieu, S., et al. (2016). Preclinical Alzheimer’s disease: definition, natural history, and diagnostic criteria. Alzheimers Dement. 12, 292–323. doi: 10.1016/j.jalz.2016.02.002
Fischl, B., van der Kouwe, A., Destrieux, C., Halgren, E., Ségonne, F., Salat, D. H., et al. (2004). Automatically parcellating the human cerebral cortex. Cereb. Cortex 14, 11–22. doi: 10.1093/cercor/bhg087
Fox, M. D., Corbetta, M., Snyder, A. Z., Vincent, J. L., and Raichle, M. E. (2006). Spontaneous neuronal activity distinguishes human dorsal and ventral attention systems. Proc. Natl. Acad. Sci. U S A 103, 10046–10051. doi: 10.1073/pnas.0606682103
Grady, C. L., McIntosh, A. R., Beig, S., Keightley, M. L., Burian, H., and Black, S. E. (2003). Evidence from functional neuroimaging of a compensatory prefrontal network in Alzheimer’s disease. J. Neurosci. 23, 986–993. doi: 10.1523/JNEUROSCI.23-03-00986.2003
Greve, D. N., and Fischl, B. (2009). Accurate and robust brain image alignment using boundary-based registration. Neuroimage 48, 63–72. doi: 10.1016/j.neuroimage.2009.06.060
Guo, Z., Liu, X., Hou, H., Wei, F., Liu, J., and Chen, X. (2016). Abnormal degree centrality in Alzheimer’s disease patients with depression: a resting-state functional magnetic resonance imaging study. Exp. Gerontol. 79, 61–66. doi: 10.1016/j.exger.2016.03.017
Jessen, F., Amariglio, R. E., van Boxtel, M., Breteler, M., Ceccaldi, M., and Chetelat, G. (2014). A conceptual framework for research on subjective cognitive decline in preclinical Alzheimer’s disease. Alzheimers Dement. 10, 844–852. doi: 10.1016/j.jalz.2014.01.001
Jiang, L., Hou, X.-H., Yang, N., Yang, Z., and Zuo, X.-N. (2015). Examination of local functional homogeneity in autism. Biomed Res. Int. 2015:174371. doi: 10.1155/2015/174371
Kantarci, K., Weigand, S. D., Przybelski, S. A., Shiung, M. M., Whitwell, J. L., Negash, S., et al. (2009). Risk of dementia in MCI: combined effect of cerebrovascular disease, volumetric MRI, and 1H MRS. Neurology 72, 1519–1525. doi: 10.1212/wnl.0b013e3181a2e864
Klaassens, B. L., van Gerven, J. M. A., van der Grond, J., de Vos, F., Möller, C., and Rombouts, S. A. R. B. (2017). Diminished posterior precuneus connectivity with the default mode network differentiates normal aging from Alzheimer’s disease. Front. Aging Neurosci. 9:97. doi: 10.3389/fnagi.2017.00097
Lou, W., Shi, L., Wong, A., Chu, W. C., Mok, V. C., and Wang, D. (2016). Changes of cerebral perfusion and functional brain network organization in patients with mild cognitive impairment. J. Alzheimers Dis. 54, 397–409. doi: 10.3233/jad-160201
McKhann, G., Drachman, D., Folstein, M., Katzman, R., Price, D., and Stadlan, E. M. (1984). Clinical diagnosis of Alzheimer’s disease: report of the NINCDS-ADRDA work group under the auspices of department of health and human services task force on Alzheimer’s disease. Neurology 34, 939–944. doi: 10.1212/wnl.34.7.939
Morris, J. C. (1993). The clinical dementia rating (CDR): current version and scoring rules. Neurology 43, 2412–2414. doi: 10.1212/wnl.43.11.2412-a
Munro, C. E., Donovan, N. J., Guercio, B. J., Wigman, S. E., Schultz, A. P., Amariglio, R. E., et al. (2015). Neuropsychiatric symptoms and functional connectivity in mild cognitive impairment. J. Alzheimers Dis. 46, 727–735. doi: 10.3233/JAD-150017
Nestor, P. J., Fryer, T. D., Smielewski, P., and Hodges, J. R. (2003). Limbic hypometabolism in Alzheimer’s disease and mild cognitive impairment. Ann. Neurol. 54, 343–351. doi: 10.1002/ana.10669
Petersen, R. C. (2003). Mild cognitive impairment clinical trials. Nat. Rev. Drug Discov. 2, 646–653. doi: 10.1038/nrd1155
Petersen, R. C., Doody, R., Kurz, A., Mohs, R. C., Morris, J. C., Rabins, P. V., et al. (2001). Current concepts in mild cognitive impairment. Arch. Neurol. 58, 1985–1992. doi: 10.1001/archneur.58.12.1985
Petersen, R. C., Smith, G. E., Waring, S. C., Ivnik, R. J., Tangalos, E. G., and Kokmen, E. (1999). Mild cognitive impairment: clinical characterization and outcome. Arch. Neurol. 56, 303–308. doi: 10.1001/archneur.56.3.303
Portet, F., Ousset, P. J., Visser, P. J., Frisoni, G. B., Nobili, F., Scheltens, P., et al. (2006). Mild cognitive impairment (MCI) in medical practice: a critical review of the concept and new diagnostic procedure. Report of the MCI working group of the european consortium on Alzheimer’s disease. J. Neurol. Neurosurg. Psychiatry 77, 714–718. doi: 10.1136/jnnp.2005.085332
Qi, Z., Wu, X., Wang, Z., Zhang, N., Dong, H., Yao, L., et al. (2010). Impairment and compensation coexist in amnestic MCI default mode network. Neuroimage 50, 48–55. doi: 10.1016/j.neuroimage.2009.12.025
Qian, S., Zhang, Z., Li, B., and Sun, G. (2015). Functional-structural degeneration in dorsal and ventral attention systems for Alzheimer’s disease, amnestic mild cognitive impairment. Brain Imaging Behav. 9, 790–800. doi: 10.1007/s11682-014-9336-6
Qiu, T., Luo, X., Shen, Z., Huang, P., Xu, X., Zhou, J., et al. (2016). Disrupted brain network in progressive mild cognitive impairment measured by eigenvector centrality mapping is linked to cognition and cerebrospinal fluid biomarkers. J. Alzheimers Dis. 54, 1483–1493. doi: 10.3233/jad-160403
Rabin, L. A., Smart, C. M., and Amariglio, R. E. (2017). Subjective cognitive decline in preclinical Alzheimer’s disease. Annu. Rev. Clin. Psychol. 13, 369–396. doi: 10.1146/annurev-clinpsy-032816-045136
Redel, P., Bublak, P., Sorg, C., Kurz, A., Förstl, H., Müller, H. J., et al. (2010). PW01–87—deficits of spatial and task-related attentional selection in mild cognitive impairment and Alzheimer’s disease. Eur. Psychiatry 25:1503. doi: 10.1016/s0924-9338(10)71486-3
Rizzolatti, G., Fogassi, L., and Gallese, V. (1997). Parietal cortex: from sight to action. Curr. Opin. Neurobiol. 7, 562–567. doi: 10.1016/s0959-4388(97)80037-2
Ségonne, F., Dale, A. M., Busa, E., Glessner, M., Salat, D., Hahn, H. K., et al. (2004). A hybrid approach to the skull stripping problem in MRI. Neuroimage 22, 1060–1075. doi: 10.1016/j.neuroimage.2004.03.032
Ségonne, F., Pacheco, J., and Fischl, B. (2007). Geometrically accurate topology-correction of cortical surfaces using nonseparating loops. IEEE Trans. Med. Imaging 26, 518–529. doi: 10.1109/tmi.2006.887364
Schwindt, G. C., and Black, S. E. (2009). Functional imaging studies of episodic memory in Alzheimer’s disease: a quantitative meta-analysis. Neuroimage 45, 181–190. doi: 10.1016/j.neuroimage.2008.11.024
Shu, N., Wang, X., Bi, Q., Zhao, T., and Han, Y. (2018). Disrupted topologic efficiency of white matter structural connectome in individuals with subjective cognitive decline. Radiology 286, 229–238. doi: 10.1148/radiol.2017162696
Sorg, C., Riedl, V., Mühlau, M., Calhoun, V. D., Eichele, T., Läer, L., et al. (2007). Selective changes of resting-state networks in individuals at risk for Alzheimer’s disease. Proc. Natl. Acad. Sci. U S A 104, 18760–18765. doi: 10.1073/pnas.0708803104
Sperling, R. A., Aisen, P. S., Beckett, L. A., Bennett, D. A., Craft, S., Fagan, A. M., et al. (2011). Toward defining the preclinical stages of Alzheimer’s disease: recommendations from the National Institute on Aging-Alzheimer’s Association workgroups on diagnostic guidelines for Alzheimer’s disease. Alzheimers Dement. 7, 280–292. doi: 10.1016/j.jalz.2011.03.003
Stern, Y., Moeller, J. R., Anderson, K. E., Luber, B., Zubin, N. R., DiMauro, A. A., et al. (2000). Different brain networks mediate task performance in normal aging and AD: defining compensation. Neurology 55, 1291–1297. doi: 10.1212/wnl.55.9.1291
Supekar, K., Menon, V., Rubin, D., Musen, M., and Greicius, M. D. (2008). Network analysis of intrinsic functional brain connectivity in Alzheimer’s disease. PLoS Comput. Biol. 4:e1000100. doi: 10.1371/journal.pcbi.1000100
Thomas Yeo, B. T., Krienen, F. M., Sepulcre, J., Sabuncu, M. R., Lashkari, D., Hollinshead, M., et al. (2011). The organization of the human cerebral cortex estimated by intrinsic functional connectivity. J. Neurophysiol. 106, 1125–1165. doi: 10.1152/jn.00338.2011
Thompson, P. M., Hayashi, K. M., de Zubicaray, G., Janke, A. L., Rose, S. E., Semple, J., et al. (2003). Dynamics of gray matter loss in Alzheimer’s disease. J. Neurosci. 23, 994–1005. doi: 10.1523/JNEUROSCI.23-03-00994.2003
Wang, Z., Liang, P., Zhao, Z., Han, Y., Song, H., Xu, J., et al. (2014). Acupuncture modulates resting state hippocampal functional connectivity in Alzheimer disease. PLoS One 9:e91160. doi: 10.1371/journal.pone.0091160
Wang, B., Li, P., Li, D., Niu, Y., Yan, T., Li, T., et al. (2018a). Increased functional brain network efficiency during audiovisual temporal asynchrony integration task in aging. Front. Aging Neurosci. 10:316. doi: 10.3389/fnagi.2018.00316
Wang, B., Miao, L., Niu, Y., Cao, R., Li, D., Yan, P., et al. (2018b). Abnormal functional brain networks in mild cognitive impairment and Alzheimer’s disease: a minimum spanning tree analysis. J. Alzheimers Dis. 65, 1093–1107. doi: 10.3233/jad-180603
Wang, Y., Zhao, X., Xu, S., Yu, L., Wang, L., Song, M., et al. (2015). Using regional homogeneity to reveal altered spontaneous activity in patients with mild cognitive impairment. Biomed Res. Int. 2015:807093. doi: 10.1155/2015/807093
Xu, T., Yang, Z., Jiang, L. L., Xing, X. X., and Zuo, X. N. (2015). A connectome computation system for discovery science of brain. Sci. Bull. 60, 86–95. doi: 10.1007/s11434-014-0698-3
Yan, T., Wang, W., Yang, L., Chen, K., Chen, R., and Han, Y. (2018). Rich club disturbances of the human connectome from subjective cognitive decline to Alzheimer’s disease. Theranostics 8, 3237–3255. doi: 10.7150/thno.23772
Yeo, B. T., Krienen, F. M., Sepulcre, J., Sabuncu, M. R., Lashkari, D., Hollinshead, M., et al. (2011). The organization of the human cerebral cortex estimated by intrinsic functional connectivity. J. Neurophysiol. 106, 1125–1165. doi: 10.1152/jn.00338.2011
Zhang, Y. W., Zhao, Z. L., Qi, Z., Hu, Y., Wang, Y. S., Sheng, C., et al. (2017). Local-to-remote cortical connectivity in amnestic mild cognitive impairment. Neurobiol. Aging 56, 138–149. doi: 10.1016/j.neurobiolaging.2017.04.016
Zhang, Z., Zheng, H., Liang, K., Wang, H., Kong, S., Hu, J., et al. (2015). Functional degeneration in dorsal and ventral attention systems in amnestic mild cognitive impairment and Alzheimer’s disease: an fMRI study. Neurosci. Lett. 585, 160–165. doi: 10.1016/j.neulet.2014.11.050
Zhou, J., Greicius, M. D., Gennatas, E. D., Growdon, M. E., Jang, J. Y., Rabinovici, G. D., et al. (2010). Divergent network connectivity changes in behavioural variant frontotemporal dementia and Alzheimer’s disease. Brain 133, 1352–1367. doi: 10.1093/brain/awq075
Zuo, X.-N., Ehmke, R., Mennes, M., Imperati, D., Castellanos, F. X., Sporns, O., et al. (2012). Network centrality in the human functional connectome. Cereb. Cortex 22, 1862–1875. doi: 10.1093/cercor/bhr269
Zuo, X. N., and Xing, X.-X. (2014). Test-retest reliabilities of resting-state FMRI measurements in human brain functional connectomics: a systems neuroscience perspective. Neurosci. Biobehav. Rev. 45, 100–118. doi: 10.1016/j.neubiorev.2014.05.009
Keywords: network neuroscience, brain connectivity, centrality, Alzheimer’s disease, subjective cognitive decline, amnestic mild cognitive impairment
Citation: Wang Z, Qiao K, Chen G, Sui D, Dong H-M, Wang Y-S, Li H-J, Lu J, Zuo X-N and Han Y (2019) Functional Connectivity Changes Across the Spectrum of Subjective Cognitive Decline, Amnestic Mild Cognitive Impairment and Alzheimer’s Disease. Front. Neuroinform. 13:26. doi: 10.3389/fninf.2019.00026
Received: 31 January 2019; Accepted: 22 March 2019;
Published: 24 April 2019.
Edited by:
Tianyi Yan, Beijing Institute of Technology, ChinaReviewed by:
Bing Zhang, Nanjing Drum Tower Hospital, ChinaBin Wang, Taiyuan University of Technology, China
Copyright © 2019 Wang, Qiao, Chen, Sui, Dong, Wang, Li, Lu, Zuo and Han. This is an open-access article distributed under the terms of the Creative Commons Attribution License (CC BY). The use, distribution or reproduction in other forums is permitted, provided the original author(s) and the copyright owner(s) are credited and that the original publication in this journal is cited, in accordance with accepted academic practice. No use, distribution or reproduction is permitted which does not comply with these terms.
*Correspondence: Ying Han, hanying@xwh.ccmu.edu.cn
† These authors have contributed equally to this work and are co-first authors