DR-IIXRN : Detection Algorithm of Diabetic Retinopathy Based on Deep Ensemble Learning and Attention Mechanism
 Zhuang Ai
 Xuan Huang
 Yuan Fan
 Jing Feng
 Fanxin Zeng
 Yaping Lu1*
- 1Department of Research and Development, Sinopharm Genomics Technology Co., Ltd., Jiangsu, China
- 2Department of Ophthalmology, Beijing Chao-Yang Hospital, Capital Medical University, Beijing, China
- 3Medical Research Center, Beijing Chao-Yang Hospital, Capital Medical University, Beijing, China
- 4Department of Clinical Research Center, Dazhou Central Hospital, Sichuan, China
Diabetic retinopathy (DR) is one of the common chronic complications of diabetes and the most common blinding eye disease. If not treated in time, it might lead to visual impairment and even blindness in severe cases. Therefore, this article proposes an algorithm for detecting diabetic retinopathy based on deep ensemble learning and attention mechanism. First, image samples were preprocessed and enhanced to obtain high quality image data. Second, in order to improve the adaptability and accuracy of the detection algorithm, we constructed a holistic detection model DR-IIXRN, which consists of Inception V3, InceptionResNet V2, Xception, ResNeXt101, and NASNetLarge. For each base classifier, we modified the network model using transfer learning, fine-tuning, and attention mechanisms to improve its ability to detect DR. Finally, a weighted voting algorithm was used to determine which category (normal, mild, moderate, severe, or proliferative DR) the images belonged to. We also tuned the trained network model on the hospital data, and the real test samples in the hospital also confirmed the advantages of the algorithm in the detection of the diabetic retina. Experiments show that compared with the traditional single network model detection algorithm, the auc, accuracy, and recall rate of the proposed method are improved to 95, 92, and 92%, respectively, which proves the adaptability and correctness of the proposed method.
1. Introduction
The number of people suffering from diabetes in China is now the first in the world. Studies have found that (Li Y. et al., 2020), from 2007 to 2017, the prevalence of diabetes in China has gradually increased over 10 years and has reached 12.8% in 2017, while the estimated prevalence of prediabetes was up to 35.2%, which indicates that diabetes is an important health problem in China. Diabetic retinopathy (DR) is one of the common chronic complications of diabetes and is also the most common blinding eye disease. In the early stages of the disease, patients may not feel anything unusual, but as the disease progresses, diabetic retinopathy can lead to vision impairment and possibly blindness. DR can be broadly classified into five stages: normal, mild, moderate, severe, and proliferative DR. Typically, an experienced physician will review fundus images to determine the current stage of DR the patient is in. However, doctors in different regions differ greatly, so it is difficult to guarantee the diagnosis, correctness. In remote areas, there may be no relevant doctors, making it impossible to detect such cases. Therefore, we need to use medical image recognition machines to help diagnose this disease. In the real world, the data set of DR is often extremely unbalanced. How to train the medical image recognition machine from the unbalanced data set and find the real patient has always been a research hotspot (Lian et al., 2018; Maistry et al., 2020).
Transfer learning is to transfer the trained model parameters to the new model to help the new model training (Torrey and Shavlik, 2010; Guo et al., 2021). Transfer learning can significantly improve the performance of the model (Kermany et al., 2018). Lu S. et al. (2021) proposed a new end-to-end novel Coronavirus classification system, neighboring aware graph neural network (NAGNN). In order to obtain good image-level representation, it uses transfer learning in the backbone neural network to acquire features, thus accelerating the training efficiency of the network. Lu S. Y. et al. (2021) proposed a new computer-aided diagnostic method for the Cerebral Microbleed test. First, a 15-layer FeatureNet is trained to extract features from input samples. Second, the structures after the first fully connected layer in FeatureNet are replaced by three random neural networks for classification: Schmidt neural network, random vector functional-link net, and extreme learning machine. In the training process of these three classifiers, the weight and deviation of FeatureNet's early layers are frozen. Finally, the outputs of the three classifiers are integrated through a majority voting mechanism to obtain better classification performance. Narin et al. (2021) proposed to use five types of pre-trained convolutional neural network (CNN) models (ResNet50, ResNet101, ResNet152, InceptionV3, and Inception-ResNetV2) to detect patients infected with coronavirus pneumonia based on chest X-ray. The pre-trained ResNet50 model obtained the highest classification performance. Ardakani et al. (2020) compared 10 famous CNN: AlexNet, VGG-16, VGG-19, SqueezeNet, GoogleNet, Mobilenet-V2, ResNET-18, RESnet-50, Resnet-101, and Xception's classification performance in differentiating infections in COVID-19 and non-COVID-19 groups. Of all the networks, Resnet-101 and Xception performed the best.
Compared with a single algorithm, ensemble learning methods often combine the output of multiple classifiers to achieve better performance (Chen et al., 2019; Minetto et al., 2019; Zheng et al., 2019), and ensemble learning based on CNN has been extensively studied in the medical field (Lin et al., 2021). Fu et al. (2018) proposed a novel disc-aware ensemble network for automatic screening of glaucoma, which integrates the deep hierarchical context of the global fundus image and the local optic disc region. Considered as a global image stream, segmentation guidance network, local disc region stream and disc polar transformation stream as four branches. Finally, the output probability of different branches is fused as the final screening result. Xiao et al. (2019) preferentially selects six models, DenseNet121, ResNet101, SENet154, VGG16, DeepTEN, and InceptionV4, as base classifiers. Then, he takes the average of the predictions from all the models and uses them to make the final prediction. Das et al. (2021) proposed a chest X-ray image detection of COVID-19 patients based on deep CNN, using multiple state-of-the-art CNN models that can make independent predictions after individual training. The models are then combined to predict class values using a new method of weighted average integration techniques. The commonly used ensemble learning fusion method is to average the output probability value of multiple base classifiers to obtain the predicted probability value of the final model. Since the classification ability of each base classifier is inconsistent, the classification ability of each base classifier cannot be extracted by using simple averaging directly. Therefore, constructing a model for DR detection based on deep ensemble learning with attention mechanism encounters the following problems.
(1) How to handle unbalanced DR dataset and
(2) How to set base classifier weight parameters in ensemble learning.
2. Related Work
Generally, both dichotomy and multiclassification can be used to classify patients with DR (Pires et al., 2017; Araujo et al., 2020; Porwal et al., 2020; Quellec et al., 2021). The dichotomy method can only determine whether a patient suffers from DR, while the multiclassification method can detect the severity of the disease. Here, we introduce several studies of DR detection algorithms applied with these two classification methods.
Binary classification algorithms of DR are widely applied. Qomariah et al. (2019) proposed to use transfer learning in CNN to extract features, based on which the support vector machine (SVM) algorithm was used to classify DR. Chakrabarty (2018) published a deep learning method for the detection of DR. It first converts pictures into gray-scale, second resizes the pictures to 1000*1000, then scales the pixel values to between 0 and 1, and, finally, inputs the preprocessed picture into CNN to predict the category to which the pictures belong. Chakrabarty and Chatterjee reported an offbeat technique for diabetic retinopathy detection using computer vision (Chakrabarty and Chatterjee, 2019). It first preprocesses pictures, including grayscale conversion, threshold processing, size adjustment, and pixel scaling. Then, the processed images are input into a CNN to extract features, and finally, the features are input into the SVM algorithm for classification. Herliana et al. (2019) applied the particle swarm optimization (PSO) method to select the best DR features, and then the selected features were further classified using the classification method of neural network. Gautam et al. (2019) used MATLAB based image processing to diagnose DR. First, the image is converted to the specified size and then converted to a grayscale image. Then, adaptive histogram equalization is carried out, and the processed image is distinguished with a threshold value. When the pixel value is greater than the threshold value, this part will be changed to white, otherwise, it will be changed to black. Finally, the number of white pixels is counted. After processing several images, the threshold value of the number of white pixels is determined, which is eventually used for category prediction of images. For the classification of retinopathy and non-retinopathy, Roychowdhury et al. (2014) proposed a computer-aided screening system (DREAM) that combines four machine learning algorithms.
The second approach is to classify DR into multiple categories according to the severity of Kanth et al. (2013) proposed applying “gray scale conversion,” “histogram equalization,” “application of digital filters,” “gradient magnetics segmentation,” and “finally fuzzy c clustering” to extract three features including the sum, average, and sum of exudates of the white pixels with a value of “1” in the binary image, and then used the multi-layer perceptron to classify images. Zhang et al. (2021) developed an early fundus abnormality screening system (DeepUWF). Firstly, six image pre-processing techniques were used to enhance the image, and then the image was input into the CNN for image classification. Carrera et al. (2017) first extracted the information of blood vessel, microaneurysm, and hard exudate based on morphology, and then transformed the information into 8 features. Finally, the 8 features were input into the support vector machine for classification. Wu and Hu (2019) used flip, fold, and contrast adjustment to do upsampling; then the pictures are input to the VGG19, Resnet50, and Inception V3 networks which are trained in the ImageNet data set for transfer learning; and finally, the predicted category of the picture is obtained. Jayakumari et al. (2020) firstly normalized the Images and then divided the data set into two categories (normal class and disease class including mild, moderate, severe, and proliferative DR) for model training. Finally, according to the model output probability and the set threshold value, the category described in the picture is judged.
The advantages and disadvantages of the above two methods are summarized in the following Table 1.
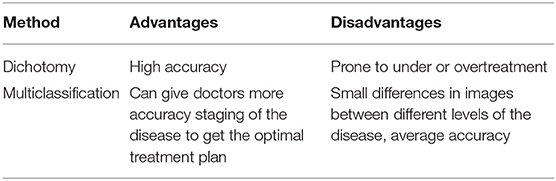
Table 1. Difference between dichotomy and multiclassification in diabetic retinopathy (DR).
In this study, we performed multiclassification for the DR dataset. The main contributions of this article are the following two aspects.
(1) To deal with the extremely unbalanced DR dataset, the total number of images to be upsampled is divided equally among each image, and upsampling is performed by three transformations, including left-right symmetric transformation, up-down symmetric transformation, and random-angle rotation, to achieve the equalization of the dataset. This way of processing can solve the large classification error of the model caused by the unbalance.
(2) The voting weight of each network model in the ensemble learning is set according to the F1 value validated by the base classifier to improve the detection effect.
3. Detection Algorithm of DR Based on Deep Ensemble Learning and Attention Mechanism
3.1. System Architecture
In this study, we constructed a deep ensemble learning algorithm called DR-IIXRN, whose structure is illustrated in Figure 1 and Algorithm 1. The programs of DR-IIXRN can be divided into three modules: image loading and preprocessing, image enhancement, and model building and prediction.

Figure 1. Flow chart of system architecture.
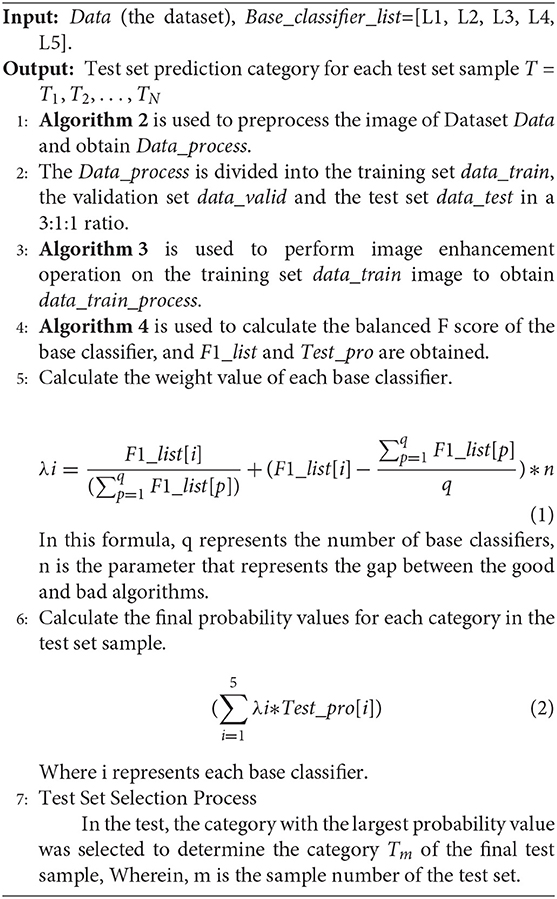
Algorithm 1: Experimental structure
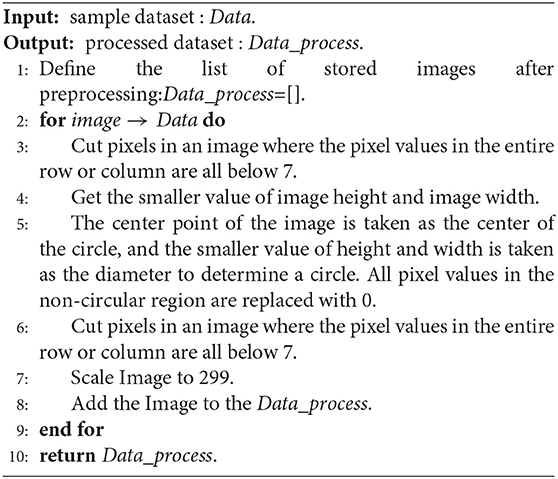
Algorithm 2: Image preprocessing

Algorithm 3: Image enhancement
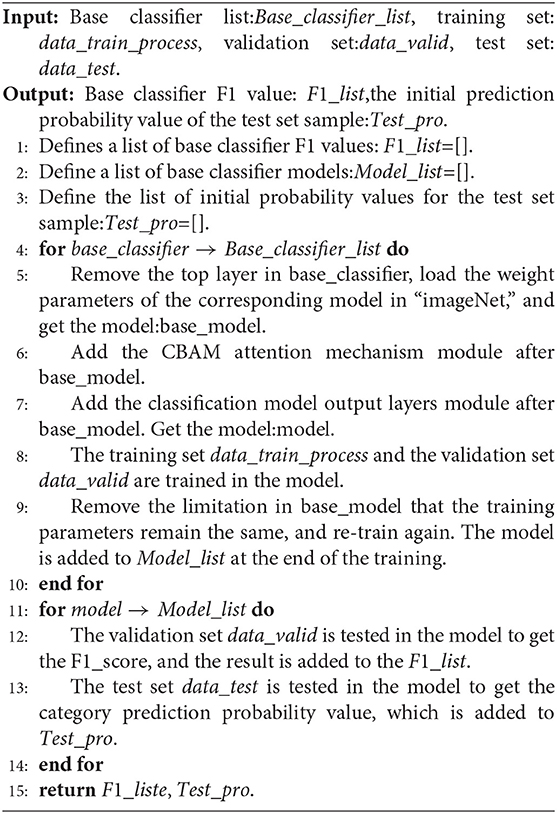
Algorithm 4: Calculate the base classifier F1 value
3.2. Dataset
The dataset used in this article is from the Diabetic Retinopathy Detection Competition in the Data Modeling and Data Analysis Competition Platform (Kaggle:https://www.kaggle.com/c/diabetic-retinopathy-detection/data). A total of 35,126 image samples were collected and classified into five categories: normal, mild, moderate, severe, and proliferative DR. The sample size of each category was 25,810, 2,443, 5,292, 873, and 708, respectively. The sample distribution is shown in Figure 2A. A typical example of each category is shown in Figure 2C. The data set is divided into a training set, validation set, and test set according to the ratio of 3:1:1, so the sample size of each set is 21,074, 7,026, and 7,026, respectively. The sample distribution is shown in Figure 2B below.
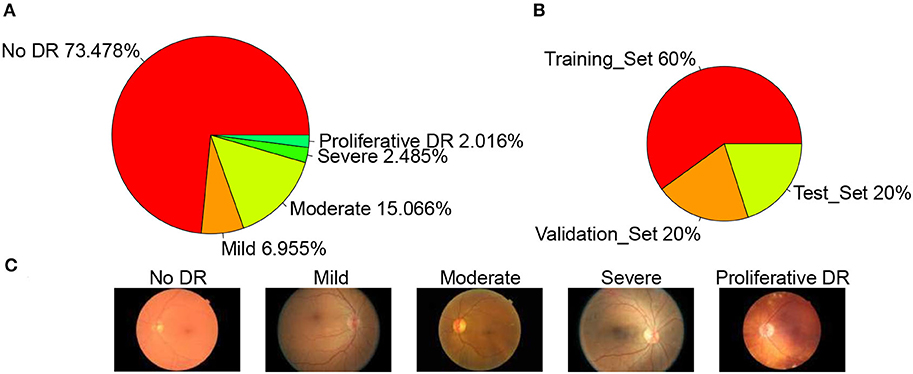
Figure 2. Datasets. (A) Datasets sample distribution, (B) Set sample distribution, and (C) Example of each category.
3.3. Image Preprocessing
The image preprocessing is demonstrated in Figure 3.
(1) Cut pixels in an image where the pixel values in the entire row or column are all below 7. Pixels with pixel values below 7 are all black, which does not help the subsequent data analysis. In general, removing pixels with lower pixel values in the image can reduce the time complexity of the network model. This step can remove the non-eye region as much as possible and increase the robustness of the algorithm. Therefore, as shown in Figure 3, we delete the pixel rows and columns in which pixel values are all lower than 7 in the picture (Figure 3A) to get the picture (Figure 3B).
(2) Determine a circle by taking the image center as the center and the smaller value between the image height and width as the diameter. Fill the area outside the circle with pixel values as 0 to obtain the image with the circular eye area retained. Based on the roughly circular nature of fundus images, we keep only the circular part of the image and remove redundant information that is not helpful for diabetic retinal classification, which can both improve the accuracy of the classification model (network model or base classifier) and reduce the time complexity. Referring to Figure 3, we take the center point of Figure 3B as the center of the circle, and the smaller value between the height and the width as the diameter to determine the circle and then fill the area outside the circle with pixel values as 0 and get the picture (Figure 3C).
(3) For the image with the circular eye area, delete the pixels in an image where the pixel values in an entire row or column is all below 7 again and scale the image to 299*299px. Since the radius of the circle is determined by the smaller value of the width and height of the image in step (2), there may be some “eyeball” pixels that are not included in the determined circle and are filled with a pixel value of 0. Therefore, in this step, it is necessary to cut the pixels where the pixel values in the entire row or column are all below 7 again. As shown in Figure 3, we delete the pixel rows and columns in which pixel values are all lower than 7 in the picture (Figure 3C) to get the picture (Figure 3D). Further, both the width and height of the image (Figure 3D) are scaled to 299 px to get the image (Figure 3E).
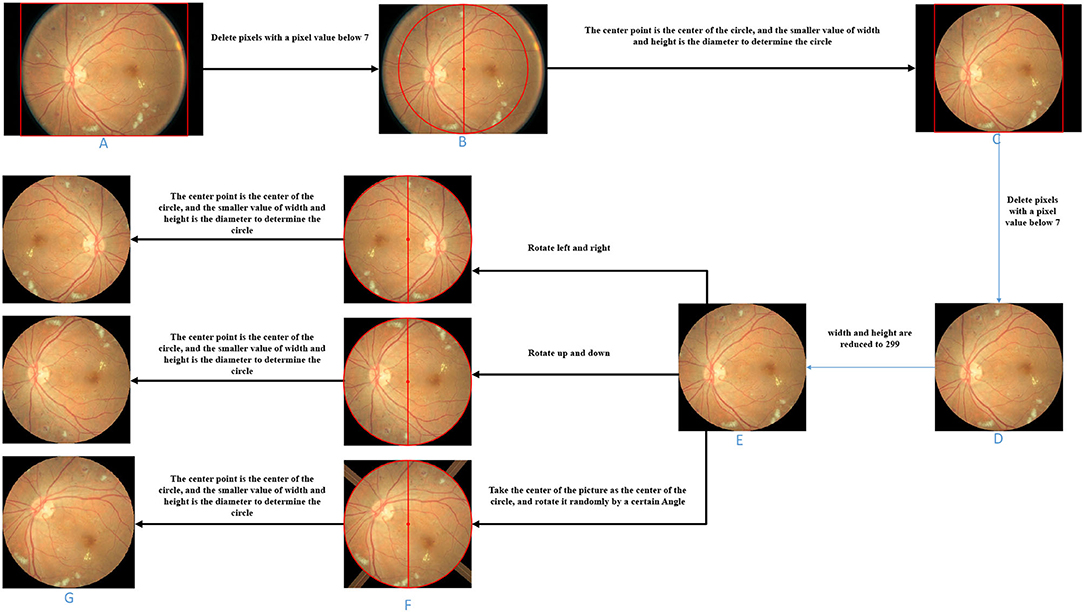
Figure 3. Image processing schematic diagram of each stage. (A) Original fundus image. (B) Image obtained by deleting entire rows and columns of pixels with a pixel value less than 7. (C) Take the center point of B as the center of the circle, and the smaller value between the height and the width as the diameter to determine the circle and then fill the area outside the circle with pixel values as 0. (D) On the basis of C, the image obtained after deleting entire rows and columns of pixels with a pixel value less than 7. (E) Zooms the image to the specified size. (F) Image obtained by three image transformations on the basis of E. (G) Take the center point of F as the center of the circle, and the smaller value between the height and the width as the diameter to determine the circle and then fill the area outside the circle with pixel values as 0.
3.4. Image Enhancement
3.4.1. Picture Sampling
First, the number of pictures that need to be upsampled for each picture in each diseased class (class 1, 2, 3, 4) was calculated according to the following formula.
Where Addi is the number of images to be added per image in class i, N0 is the number of pictures of class 0 in the training set, and Ni is the number of pictures of class i in the training set.
Second, random-upsampling was performed to increase the number of images in each class to obtain a balanced dataset. The upsampling numbers for each category are listed in Table 2 below.
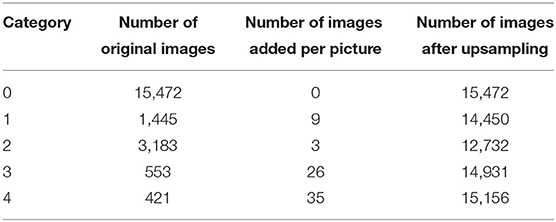
Table 2. Upsampling image number information.
The image transformation methods in upsampling include left-right symmetrical transformation, up-down symmetric transformation, and random-angle rotation transformation. The left-right symmetric transformation refers to the mirror image inversion with the vertical centerline of the image as the axis of symmetry. The up-down symmetric transformation refers to the image inversion with the horizontal centerline of the picture as the axis of symmetry. The random-angle rotation transformation means rotating an image with a random angle with the center of the picture as the center of the circle. As shown in Figure 3, three sampled pictures (Figure 3F) can be obtained from picture (Figure 3E) by the three transformation methods.
3.4.2. Deletion of Unnecessary Areas
During the random-angle rotation transformation, some pixels outside the “eyeball” area may be filled with pixel values higher than 7. As shown in the third picture in Figure 3F, bright bars near the four corners appear. Therefore, this step is to remove these bright pixels. For each upsampled image, determine a circle with the center of the image as the center of the circle and the half of the side length as the radius and then fill the area outside the circle with pixel values as 0. As shown in Figure 3, unnecessary areas of the three sampling images in Figure 3F were removed and three upsampling images (Figure 3G) with circular eye areas were obtained.
3.5. Introduction to Network Models
We used five top-ranked and widely used architectures trained on the ImageNet Large-scale Visual Recognition Challenge (ILSVRC): Inception V3, InceptionResNet V2, Xception, ResNext101, and NasnetLarge.
3.5.1. Inception V3 Network Model
Since Yann LeCun, the father of CNN, built LeNet5 (LeCun et al., 1998), which started the research boom of CNN, many scholars have been working hard in this field. In the 2014 ImageNet Competition, the GoogLeNet (Inception V1) (Szegedy et al., 2015) network proposed by Szegedy and Liu et al. and the VGGNet (Simonyan and Zisserman, 2015) network proposed by Simonyan and Zisserman won the first and second place, respectively. The GoogLeNet with a network depth of 22 layers is much smaller than VGGNet both in terms of network parameters and network size. Inception V2 (Ioffe and Szegedy, 2015) is a network model optimized on the basis of GoogLeNet, and Batch-Normalization (BN) is added to the network model, which accelerates the training speed of the model. Inception V3 (Szegedy et al., 2016) is similar to Inception V2, except that “factorization into small cons” is introduced on the basis of Inception V2, which means any n*n convolution kernel can be disassembled into a combination of size 1*n and n*1, and this operation allows the number of parameters to be greatly reduced. Since the introduction of the Inceptionv3 network, it has been used by a large number of researchers (Dongmei et al., 2020; Li W. et al., 2020). Dong et al. (2020) proposed a network framework. The network will effectively solve the complexity and individual differences of the cervical cell texture. Combined with the feature of Inception v3 and artificial cell classification algorithm, effectively improve the cervical cells recognition accuracy. Liu et al. (2020) proposed a classification algorithm based on improved InceptionV3 while Center loss CNN is proposed to improve the accuracy of obscured targets.
3.5.2. InceptionResNet V2 Network Model
InceptionResNet V2 (Szegedy et al., 2017) is a deep network model proposed by Szegedy et al. Based on Inception, ResNet (He et al., 2016) is introduced to add shallow features to higher-level features through another branch for the purpose of feature reuse and also to avoid the gradient disappearance problem of deep networks. Since the introduction of InceptionResNet V2 network, it has been used by a large number of researchers (Kamble et al., 2019; Peng et al., 2020). Ferreira et al. (2018) proposes a deep neural network method for classification of breast cancer histology images using InceptionResnet V2 transfer learning. First, the added top layer is trained and some of the previously frozen feature extraction layers are fine-tuned a second time. (Thomas et al., 2020) proposes the use of Inception- resnet-V2 as feature extraction and the extracted features are fed into two different classifier support vector machines and random forest to classify vehicle types.
3.5.3. Xception Network Model
Xception (Chollet, 2017), a deep network model proposed by Francois Chollet et al. in 2017, is an improved version of Inception V3. It mainly uses depth-wise separable convolution to replace the convolution operation in the original Inception V3, which can improve the performance of the network model to some extent. Since the introduction of the Xception network, it has been used by a large number of researchers (Rismiyati et al., 2020; Wu et al., 2020). Farag et al. (2021) proposed the use of residual network and Xception network for COVID-19 diagnosis, and the results show that the use of random search-optimized residual network and Xception network can achieve good classification results. Yao et al. (2021) propose an improved Xception network, in which L2 norm and mean regularization are added to the original Xception network, and the classification indicators of the tuned Xception network are greatly improved.
3.5.4. ResNeXt101 Network Model
ResNeXt101 is a deep network model put forward by Xie et al. (2017). The study suggests that increasing cardinality is more effective than increasing depth and width, which improves the accuracy of the model without obviously increasing the order of magnitude of parameters, and also allows it to have fewer hyperparameters, which facilitates model portability. Since the introduction of ResNeXt network, it has been used by a large number of researchers (Koné and Boulmane, 2018; Pant et al., 2020). Go et al. (2020) proposes a visualization-based malware analysis method. First, the properties of binary executable files of original malware are converted into grayscale images, and ResNeXt network is used to classify grayscale images to realize malware analysis. Cao et al. (2021) proposed ResNeXt as a backbone network with few parameters and high accuracy, and then used k-means++ clustering algorithm to get an anchor box that was closer to the real box, which helped the model to carry out regression detection. The accuracy of the improved model was significantly improved.
3.5.5. NASNetLarge Network Model
NASNetLarge is a deep network model proposed by Zoph et al. (2018). NASNetLarge can automatically generate network structures without the need to design the network model manually. This model can greatly reduce the number of parameters while ensuring accuracy. Since the introduction of NASNet network, it has been used by a large number of researchers (Ahmed et al., 2020a; Bharati et al., 2021). Bakkali et al. (2020) proposes a cross-mode deep network, which can capture text content and visual information contained in document images. Image features use NASNetLarge network, text feature extraction uses Bert network, and the cross-mode deep network greatly improves classification indicators. Ahmed et al. (2020b) proposed to use a framework combining three pre training networks (Xception, Inception-ResNet-V2, and NasNetLarge) and Error Correcting Output Codes (ECOC) to solve the classification of skin damage.
3.6. Attention Mechanism
Convolutional Block Attention Module (CBAM) (Woo et al., 2018) denotes the attention mechanism module of the convolutional module, which is an attention mechanism module that combines spatial and channel dimensions and can achieve better results compared to Squeeze-and-Excitation Networks (SENet) (Hu et al., 2020), an attention mechanism that focuses only on the channel dimension. The network structures of SENet and CBAM added into the block are shown in Figure 4A.
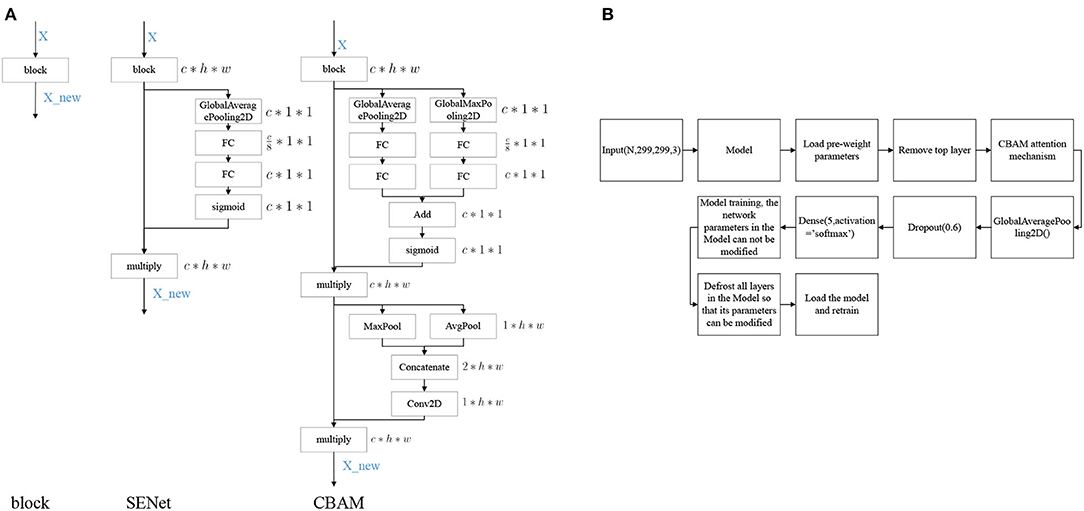
Figure 4. Model modification process. (A) Diagram of attention mechanism network structure, (B) Model training process.
3.7. Model Building
The modeling stages are descripted in Figure 4B. The models are mainly composed of Inception V3, InceptionResNet V2, Xception, ResNeXt101, and NASNetLarge. On the basis of these models, the top layer is removed, and the CBAM attention mechanism and model output layers are added. After the model is constructed, transfer learning is performed, keeping the parameters in the network model immutable and only modifying the parameters of the attention mechanism and the output layers module. Once the model is trained, the parameters of the network model are free to be modified, and the training is performed again to obtain a suitable network model for DR.
4. Experiment
4.1. Experimental Conditions
The experimental environment is Linux x86_64, NVIDIA Tesla V100, and 16GB memory. This experiment is based on Python version 3.7.9, TensorFlow version 2.3.0, and Keras version 2.4.3.
4.2. Evaluation Criteria
To evaluate the performance of the model, the accuracy, recall, precision, and F1-score were calculated.
The combinations of predicted outcomes of the classifier and true categories of samples were classified as True Positive (TP), True Negative (TN), False Positive (FP), and False Negative (FN). TP means that the classification model predicts positive samples as positive samples. TN means that the classification model predicts negative samples as negative samples. FP means that the classification model predicts negative samples as positive samples. FN means that the classification model predicts positive samples as negative samples.
“Accuracy” represents the proportion of all correct judgments of the classifier to the total number of observations. “Precision” is the proportion of subjects correctly predicted to be positive among all positive predictions. “Recall” is a ratio of correct positive predictions to the overall number of positive instances in the dataset. “Specificity” is the proportion of negative instances identified to all negative instances. “F1” is the harmonic mean of precision and recall. AUC is a performance measure for classification problems under various threshold Settings. F1 values range from 0 to 1, and the best value is 1.0, and the worst value is 0.0.
4.3. Selection of Experimental Settings
In order to investigate the potential of different experimental settings in the image processing module and the model building module in the proposed framework, we conducted experiments for the following different cases and compared the performance of the model under each case. All experiments applied Inception V3 network and CBAM attention mechanism to construct classification models. A different case of the experimental results is shown in Figure 6A and Table 3. According to the test results, the classification index using Case F reached the highest level, and this process was also identified as the data preprocessing scheme in this article.
1. Case A: No pre-processing steps (using raw data).
2. Case B: On the basis of A, weight parameters are added during model classification.
3. Case C: On the basis of A, the images in the training set are upsampled using horizontal translation, vertical translation, horizontal rotation, vertical rotation, and random angle rotation.
4. Case D: On the basis of A, the images in the training set are upsampled using horizontal rotation, vertical rotation, and random angle rotation.
5. Case E: On the basis of D, the Inception V3 containing network parameters from the competition of “ImageNet” is used as the network model. Here, the network parameters of Inception V3 are not modifiable, distinguishing from the random network parameters used in Case A, B, C, and D.
6. Case F: On the basis of E, the fine-tuning technique is applied.
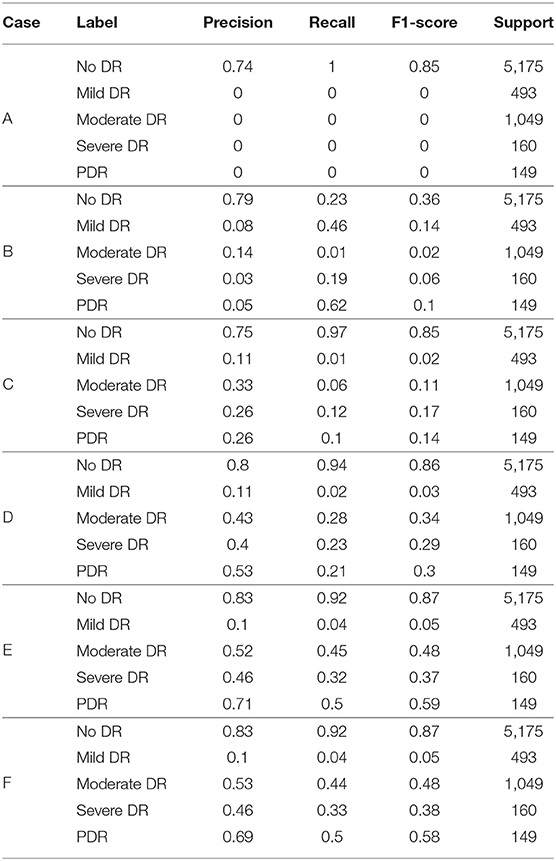
Table 3. The influence of different cases on evaluation indexes.
In Case A, the original dataset is unbalanced and there are far more normal samples than other types of samples in the dataset, so the model prediction results are completely biased to the side of normal samples and the model does not play any role in sample classification. To deal with the imbalanced data, we tested the following methods in Cases B, C, and D.
In Case B, a penalty for prediction errors in categories with small sample sizes is added to the model, and the weight parameters for each category are calculated as follows:
Where n_samples represent the total number of picture samples, n_classes represent the number of categories, and bincount(y) represents the sample size of each category in the training set. Weight is the weight corresponding to each category. The lower the sample size of the category, the higher its weight. Comparing the results to Case A, we can see that the detection ability for the categories with smaller sample sizes has been slightly improved.
In Case C, we performed horizontal translation, vertical translation, horizontal rotation, vertical rotation, and random angle rotation to carry out the upsampling of the images. The sample size was made approximately the same in each category by up-sampling. Compared with Case B, Case C showed a certain improvement in the detection of late-stage DR, but showed a certain decrease for category 1. However, compared with Case B, the improvement effect for other categories was significant. Therefore, Case C showed an overall improvement compared with Case B.
Since the two transformations, horizontal translation and vertical translation, produce images that differ too much from the images of the actual samples, as shown in Figure 5, and may affect the classification effect, we removed these two types of upsampling in Case D. The classification effect for categories with the small sample size is significantly improved in Case D.
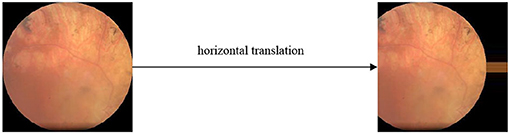
Figure 5. Horizontal translations.
However, in Case D, we started from scratch to solve the weight parameters of the model. Due to the small sample size, the training for the complex network model was not sufficient. Case E uses the network parameters in the “ImageNet” competition, which is calculated by a large amount of data. The network parameters are very suitable for the model. Therefore, the effect in Case E is improved to some extent compared with that in Case D.
In Case F, compared with Case E, the weighted parameters in Inception V3 were set to be modifiable in training. We fine-tuned parameters so that the model can be suitable for the detection of DR. Therefore, Case F achieved an improvement over Case E.
4.4. Weighted Voting Model
Ensemble learning combines diverse models (henceforth classifiers) to obtain better predictive performance.
This article uses the weighted voting method mainly through the following steps.
(1) First, get the F1_score of each base classifier on the validation set. Test the test set in the model, and get the prediction probability value Test_pro of the test set in each category.
(2) Calculate the weight value of each base classifier through the following formula. Wherein, F1_list is the F1 score of each base classifier in the verification set, q is the number of base classifiers, so represents the percentage of F1 score of each base classifier in the total score, and represents the mean of F1 of each base classifier. represents the difference between each base classifier and the mean, so the n value is to amplify the difference between the base classifiers.
(3) Calculate the probability of each sample in the test set.
(4) After obtaining the predicted probability value of each sample in each category, the category with the largest probability value is the predicted category value.
In step 2, the range of n that increases the difference between the base classifiers is generally small. If the data is too large, it will cause the predicted probability values to be exactly the same. We test n values from 10 to 100. Select the most appropriate n to increase the difference between the base classifiers. In the first step of the experiment, n is in the range from 10 to 100. The specific values are 10, 20, 30, 40, 50, 60, 70, 80, 90, and 100. The experimental results are shown in Figure 6E and Table 4.
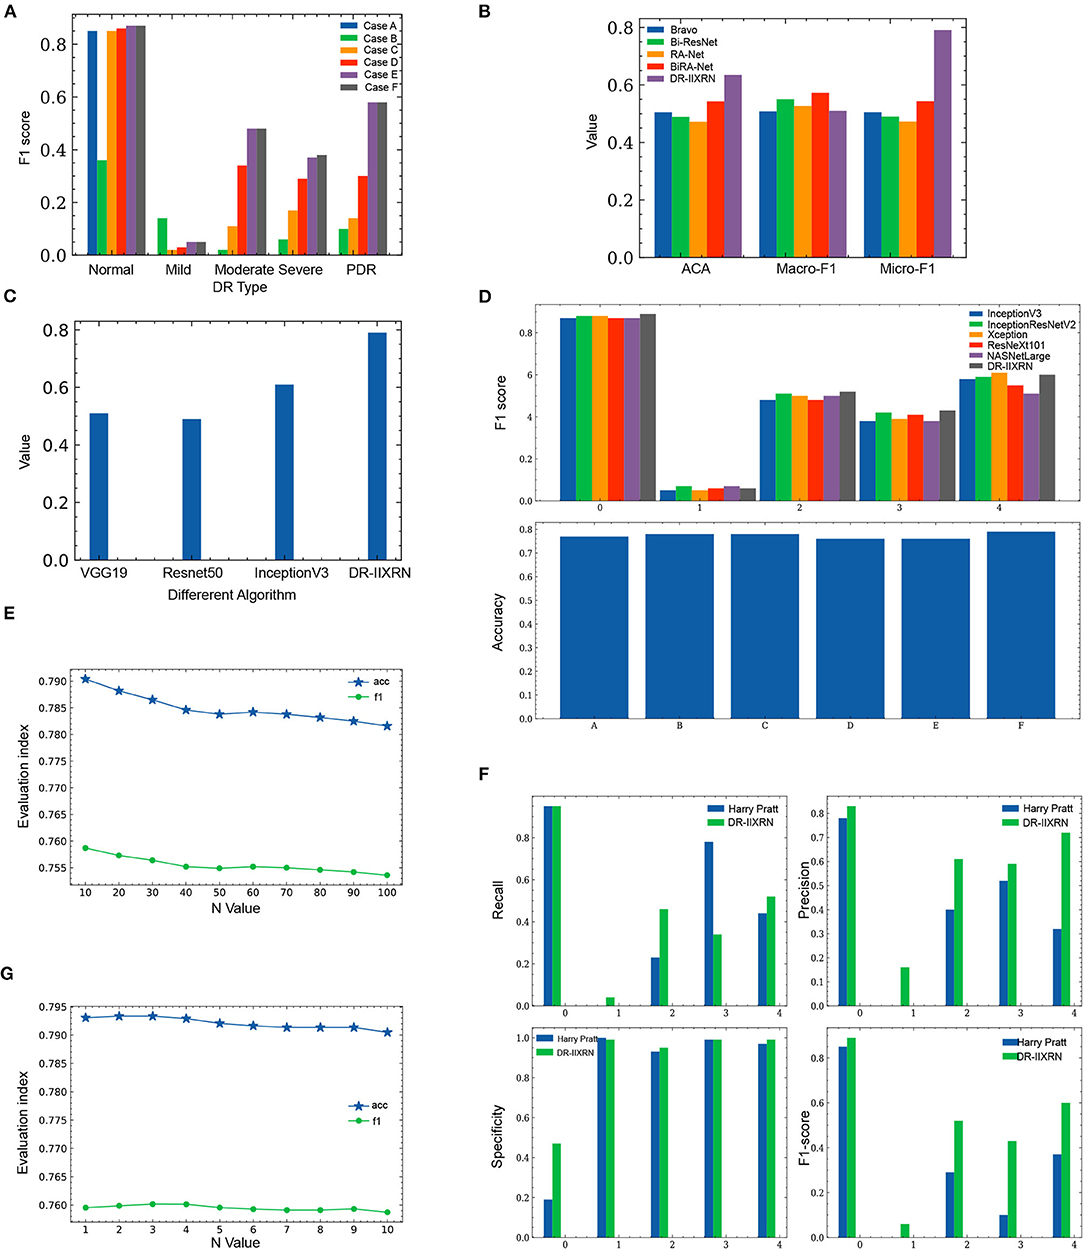
Figure 6. Comparison of experimental results. (A) Influence of different image preprocessing schemes on F1 value. (B) Comparison of the performance of DR-IIXRN with Zhao and Bravo proposed algorithms. (C) Compared the performance of DR-IIXRN with Wu proposed algorithms. (D) Comparison of the performance of DR-IIXRN with the five base classifiers. (E) Influence of n value in formula 10 between 10 and 100 on evaluation index. (F) Comparison of the performance of DR-IIXRN with Pratt proposed algorithms. (G) Influence of n value in formula 10 between 1 and 10 on evaluation index.
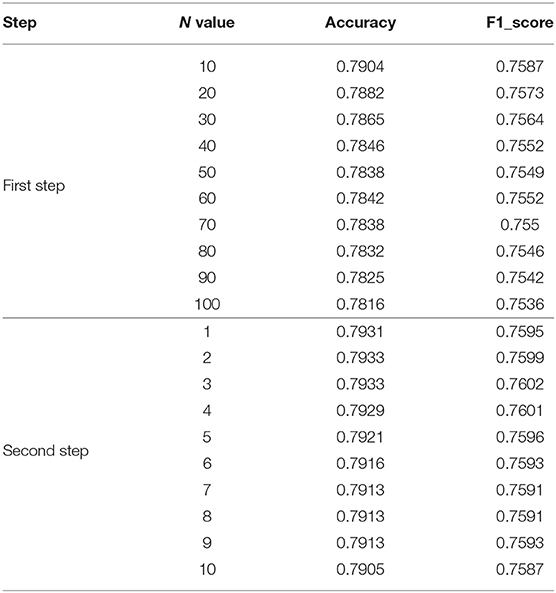
Table 4. The influence of different values of n on the evaluation indexes.
Figure 6E shows that the model evaluation indexes with n values between 10-100 show a downward trend, mainly because the large n value leads to the consistency of the prediction indexes of most samples when the model predicts samples. So the optimal n is between 1 and 10. In the second step of the experiment, n is in the range from 1 to 10. The specific values are 1, 2, 3, 4, 5, 6, 7, 8, 9, and 10. The experimental results are shown in Figure 6G and Table 4.
Figure 6G shows that when then value is between 1 and 3, the evaluation index of the model shows an overall upward trend. Increasing n value within a certain range can increase the difference between various base classifiers, thus improving the classification ability of the model. Between 3 and 10, the overall model evaluation index shows a downward trend. As can be seen from Formula 10, when n value is too large, the model will keep the predicted values of most samples consistent. Therefore, the optimal n value is 3, which can widen the gap between each base classifier and make the effect of deep ensemble learning reach the optimal level.
We compared the performance of the DR-IIXRN algorithm with the five base classifiers, as shown in Figure 6D and Table 5. In Figure 6D, the horizontal coordinates “0,” “1,” “2,” “3,” and “4” represent “No DR,” “Mild DR,” “Moderate DR,” “Severe DR,” and “PDR,” respectively; “A,” “B,” “C,” “D,” “E,” and “F” represent “Inception V3,” “InceptionResNet V2,” “Xception,” “ResNeXt101,” “NASNetLarge,” and “DR-IIXRN,” respectively. The results show that compared with the basic classifier, deep ensemble learning can effectively compensate for the errors of each base classifier and improve the overall accuracy and F1_score of the classifier.
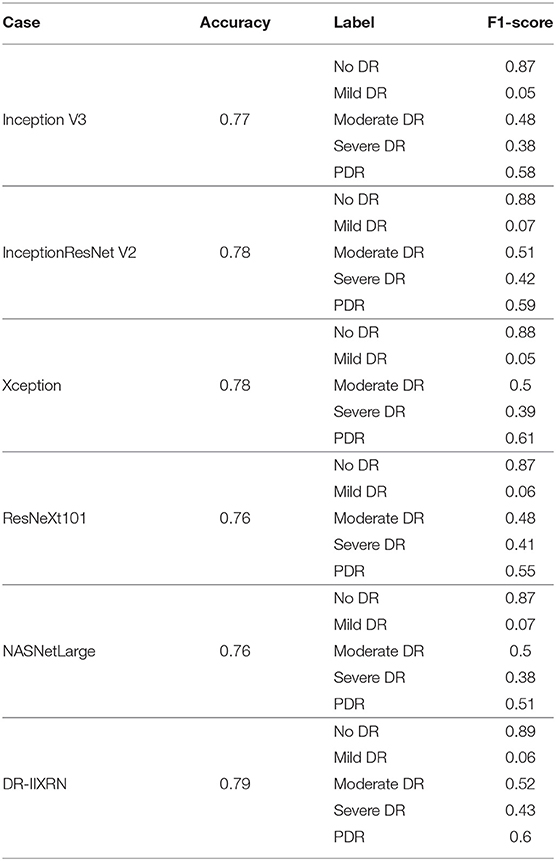
Table 5. Deep ensemble learning vs. base classifiers.
4.5. Comparison of the DR-IIXRN Algorithm and Other Classification Algorithms
In order to verify the performance of the DR-IIXRN algorithm, we collected and downloaded several DR detectors applied in the literature published in the last 5 years.
Firstly, the DR-IIXRN algorithm was compared with the algorithm proposed by Harry Pratt (Pratt et al., 2016). Due to the serious imbalance of the data set, the algorithm in this paper and Harry Pratt both perform poorly in the F1 value of the two categories Mild DR and Severe. However, compared with the algorithm proposed by Harry Pratt, in this article, the effect of data imbalance on category Mild DR and category Severe can be greatly reduced by the image up sampling module. By comparing the metrics of recall, precision, specificity, and F1 value, it can be seen from Table 6, Figure 6F that the detection capability of DR-IIXRN algorithm has obvious superiority. In Figure 6F, the horizontal coordinates “0,” “1,” “2,” “3,” and “4” stand for “No DR,” “Mild DR,” “Moderate DR,” “Severe DR,” and “PDR,” respectively.
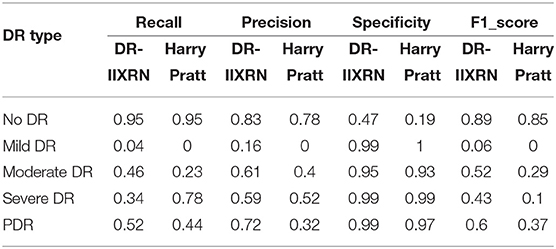
Table 6. DR-IIXRN vs. Harry Pratt proposed model.
Next, we conducted experiments with algorithms proposed by Bravo (Bravo and Arbelaez, 2017) and Ziyuan Zhao (Zhao et al., 2019) for the same test set as DR-IIXRN. We evaluated and compared these algorithms by three metrics: average of classification accuracy (ACA), macro-averaged F1 (Macro-F1), and Micro-averaged F1 (Micro-F1). The classification confusion matrix is normalized, and then the average value of the diagonal line is calculated to obtain the average value of the classification accuracy(ACA). Macro-F1 and Micro-F1 were used to evaluate the results of multiple classifications. Macro-F1 and Micro-F1 are computed as simple arithmetic means of per-class F1-scores. The Macro F1-score is defined as the mean of class-wise F1-scores, and Micro F1-score is defined as the harmonic mean of the precision and recall.
Compared with the network architecture proposed by Bi-ResNet and Bravo, this article uses network structures with excellent results from the “ImageNet” competition Inception V3, InceptionResNet V2, Xception, ResNext101, and NASNetLarge as part of the DR-IIXRN, and fine-tune each network structure. This fine-tuning operation can greatly reduce the model training time on the premise of ensuring the accuracy (Kermany et al., 2018). The experimental results are shown in Table 7 and Figure 6B. The DR-IIXRN algorithm showed good performance on ACA and Micro-F1.
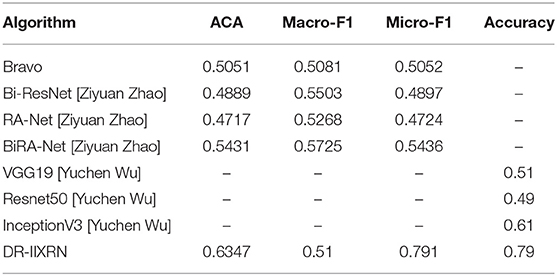
Table 7. The influence of different algorithms on the evaluation index.
Finally, we compared the DR-IIXRN algorithm with the algorithms proposed by Yuchen Wu (Wu and Hu, 2019) on accuracy. In this article, we use five commonly used network models at the stage of model building and integrate the output results of various models, which can effectively compensate for the error of each base classifier. Therefore, compared with the model proposed by Yuchen Wu, this article can improve the detection ability of DR to a certain extent. It can be seen from Figure 6C and Table 7 that the DR-IIXRN algorithm greatly improves the classification ability of DR samples.
4.6. Experimental Expansion
In this study, 945 fundus images were collected from Beijing Chaoyang Hospital, Capital Medical University. The categories of images are shown in the following Table 8. In this article, 133 images were randomly selected as the final test set, and the remaining 812 images were used to optimize network parameters. All image data were preprocessed in the same way as in the article. The evaluation indexes of each category in the test data set are shown in the following Table 8, and the comparison results of different base classifiers and DR-IIXRN in accuracy are shown in Figure 7. As can be seen from the data in the table and figure, the deep ensemble learning algorithm proposed in this article largely integrates the advantages of various base classifiers, the auc, accuracy, and recall rate of the proposed method are improved to 95, 92, and 92%, respectively, and the network model trained in public data sets can achieve better results after the optimization of actual data.
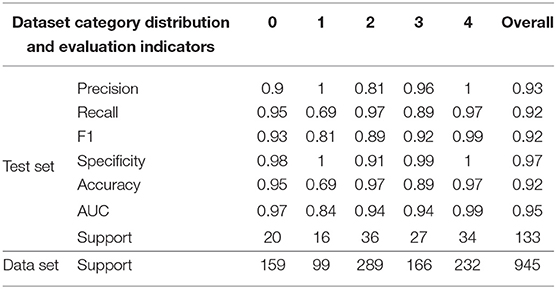
Table 8. Dataset category distribution and evaluation indicators.
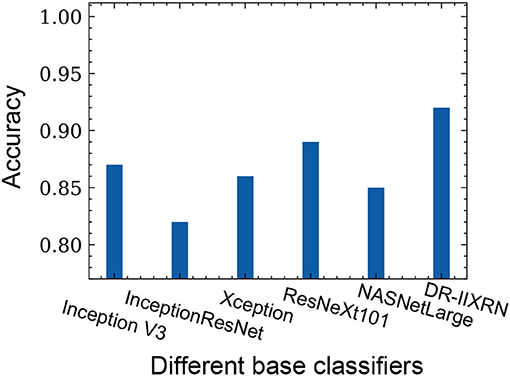
Figure 7. The influence of different base classifiers on accuracy.
5. Conclusion
In this article, we propose a DR detection algorithm DR-IIXRN based on deep ensemble learning and attention mechanism. The experimental results show that the image preprocessing and image enhancement module can solve the problem of low classification accuracy caused by the uneven distribution of the original data. DR-IIXRN deep ensemble learning algorithm can make the base classifier play better roles in the detection of DR in actual hospitals through weight calculation. The results of the comparison with other detectors confirm the accuracy and verify the performance of the algorithm. In the future, we plan to use more actual hospital samples to test the robustness of the algorithm.
Data Availability Statement
The datasets generated and/or analysed during the current study are available from the corresponding author on reasonable request. Correspondence and requests for data materials should be addressed to Yaping Lu (luyaping@sinopharm.com).
Author Contributions
ZA, YF, and YL: conceptualization and writing original draft preparation. ZA and XH: methodology. ZA and FZ: writing review and editing. YL and FZ: project administration. XH and JF: data collection. YL, XH, and FZ: funding acquisition. All authors read and agreed to the published version of the manuscript.
Funding
This work was supported in part by the National Natural Science Foundation of China to FZ (81902861) and XH (32000485) and in part by the Sinopharm Genomics Technology Co., Ltd. The funder Sinopharm Genomics Technology Co., Ltd. had the following involvement with the study: design, collection, analysis, interpretation of data, the writing of this article and the decision to submit it for publication.
Conflict of Interest
ZA, YF, and YL are employees of Sinopharm Genomics Technology Co., Ltd.
The remaining authors declare that the research was conducted in the absence of any commercial or financial relationships that could be construed as a potential conflict of interest.
Publisher's Note
All claims expressed in this article are solely those of the authors and do not necessarily represent those of their affiliated organizations, or those of the publisher, the editors and the reviewers. Any product that may be evaluated in this article, or claim that may be made by its manufacturer, is not guaranteed or endorsed by the publisher.
Acknowledgments
The numerical calculations in this study have been done on the supercomputing system in the Supercomputing Center of Wuhan University.
References
Ahmed, S. A. A., Yanikoglu, B., Goksu, O., and Aptoula, E (2020a). “Skin lesion classification with deep CNN ensembles,” in 2020 28th Signal Processing and Communications Applications Conference (SIU) (IEEE), 1–4. doi: 10.1109/SIU49456.2020.9302125
Ahmed, S. A. A., Yanikoglu, B., Zor, C., Awais, M., and Kittler, J (2020b). “Skin Lesion Diagnosis with Imbalanced ECOC Ensembles,” in International Conference on Machine Learning, Optimization, and Data Science (Springer), 292–303. doi: 10.1007/978-3-030-64580-9_25
Araujo, T., Aresta, G., Mendonsa, L., Penas, S., Maia, C., Carneiro, A., et al. (2020). DR|GRADUATE: uncertainty-aware deep learning-based diabetic retinopathy grading in eye fundus images. Med. Image Anal. 63:101715. doi: 10.1016/j.media.2020.101715
Ardakani, A. A., Kanafi, A. R., Acharya, U. R., Khadem, N., and Mohammadi, A (2020). Application of deep learning technique to manage COVID-19 in routine clinical practice using CT images: results of 10 convolutional neural networks. Comput. Biol. Med. 121:103795. doi: 10.1016/j.compbiomed.2020.103795
Bakkali, S., Ming, Z., Coustaty, M., and Rusinol, M (2020). “Cross-modal deep networks for document image classification,” in 2020 IEEE International Conference on Image Processing (ICIP) (IEEE), 2556–2560. doi: 10.1109/ICIP40778.2020.9191268
Bharati, S., Podder, P., Mondal, M. R. H., and Gandhi, N (2021). “Optimized NASNet for Diagnosis of COVID-19 from Lung CT Images,” in International Conference on Intelligent Systems Design and Applications (Springer), 647–656. doi: 10.1007/978-3-030-71187-0_59
Bravo, M. A., and Arbelaez, P. A (2017). “Automatic diabetic retinopathy classification,” in 13th International Conference on Medical Information Processing and Analysis (International Society for Optics and Photonics), p. 105721. doi: 10.1117/12.2285939
Cao, J., Zhang, H., and Ren, W (2021). “Improved YOLOv3 model based on ResNeXt for target detection,” in 2021 IEEE International Conference on Power, Intelligent Computing and Systems (ICPICS) (IEEE), 709–713. doi: 10.1109/ICPICS52425.2021.9524125
Carrera, E. V., Gonzalez, A., and Careera, R (2017). “Automated detection of diabetic retinopathy using SVM,” in 2017 IEEE XXIV international conference on electronics, electrical engineering and computing (INTERCON) (IEEE), 1–4. doi: 10.1109/INTERCON.2017.8079692
Chakrabarty, N. (2018). “A deep learning method for the detection of diabetic retinopathy,” in 2018 5th IEEE Uttar Pradesh Section International Conference on Electrical, Electronics and Computer Engineering (UPCON) (IEEE), 1–5. doi: 10.1109/UPCON.2018.8596839
Charabarty, N., and Chatterjee, S (2019). “An Offbeat Technique for Diabetic Retinopathy Detection using Computer Vision,” in 2019 10th International Conference on Computing, Communication and Networking Technologies (ICCCNT) (IEEE), 1–5. doi: 10.1109/ICCCNT45670.2019.8944633
Chen, Y., Wang, Y., Gu, Y., He, X., Ghamisi, P., and Jia, X (2019). Deep learning ensemble for hyperspe-ctral image classification. IEEE J. Select. Top. Appl. Earth Observat. Remote Sens. 12, 1882–1897. doi: 10.1109/JSTARS.2019.2915259
Chollet, F. (2017). “Xception: Deep learning with depthwise separable convolutions,” in Proceedings of the IEEE Conference on Computer Vision and Pattern Recognition, 1251–1258. doi: 10.1109/CVPR.2017.195
Das, A. K., Ghosh, S., Thunder, S., Dutta, R., Agarwal, S., and Chakrabarti, A (2021). Automatic COVID-19 detection from X-ray images using ensemble learning with convolutional neural network. Pattern Anal. Appl. 24, 1–4. doi: 10.1007/s10044-021-00970-4
Dong, N., Zhao, L., Wu, C., and Chang, J (2020). Inception v3 based cervical cell classification combined with artificially extracted features. Appl. Soft Comput. 93:106311. doi: 10.1016/j.asoc.2020.106311
Dongmei, Z., Ke, W., Hongbo, G., Peng, W., Chao, W., and Shaofeng, P (2020). “Classification and identification of citrus pests based on inceptionv3 convolutional neural network and migration learning,” in 2020 International Conference on Internet of Things and Intelligent Applications (ITIA) (IEEE), 1–7. doi: 10.1109/ITIA50152.2020.9312359
Farag, H. H., Said, L. A., Rizk, M. R., and Ahmed, M. A. E (2021). Hyperparameters optimization for resnet and xception in the purpose of diagnosing COVID-19. J. Intell. Fuzzy Syst. 41, 1–17. doi: 10.3233/JIFS-210925
Ferreira, C. A., Melo, T., Sousa, P., Meyer, M. I., Shakibapour, E., Costa, P., et al. (2018). Classification of breast cancer histology images through transfer learning using a pre-trained inception resnet v2. Lecture Notes Comput. Sci. 10882, 763–770. doi: 10.1007/978-3-319-93000-8_86
Fu, H., Cheng, J., Xu, Y., Zhang, C., Wong, D. W. K., Liu, J., et al. (2018). Disc-aware ensem-ble network for glaucoma screening from fundus image. IEEE Trans. Med. Imaging 37, 2493–2501. doi: 10.1109/TMI.2018.2837012
Gautam, A. S., Jana, S. K., and Dutta, M. P (2019). “Automated diagnosis of diabetic retinopathy using image processing for non-invasive biomedical application,” in 2019 International Conference on Intelligent Computing and Control Systems (ICCS) (IEEE), 809–812. doi: 10.1109/ICCS45141.2019.9065446
Go, J. H., Jan, T., Mohanty, M., Patel, O. P., Puthal, D., and Prasad, M (2020). “Visualization approach for malware classification with ResNeXt,” in 2020 IEEE Congress on Evolutionary Computation (CEC) (IEEE), 1–7. doi: 10.1109/CEC48606.2020.9185490
Guo, X., Zhang, Y.-D., Lu, S., and Lu, Z (2021). A survey on machine learning in COVID-19 diagnosis. Comput. Model. Eng. Sci. 129, 23–71. doi: 10.32604/cmes.2021.017679
He, K., Zhang, X., Ren, S., and Sun, R (2016). “Deep residual learning for image recognition,” in Proceedings of the IEEE Conference on Computer Vision and Pattern Recognition, 770–778. doi: 10.1109/CVPR.2016.90
Herliana, A., Arifin, T., Susanti, S., and Hitmah, A. B (2019). “Feature selection of diabetic retinopathy disease using particle swarm optimization and neural network,” in 2018 6th International Conference on Cyber and IT Service Management (CITSM) (IEEE), 1–4. doi: 10.1109/CITSM.2018.8674295
Hu, J., Shen, L., Albanie, S., Sun, G., and Wu, E (2020). “Squeeze-and-excitation networks,” in Proceedings of the IEEE Conference on Computer Vision and Pattern Recognition, Vol. 8 (IEEE), 7132–1741. doi: 10.1109/TPAMI.2019.2913372
Jayakumari, C., Lavanya, V., and Sumesh, E. P (2020). “Automated diabetic retinopathy detection and classification using imagenet convolution neural network using fundus images,” in 2020 International Conference on Smart Electronics and Communication (ICOSEC) (IEEE), 577–582. doi: 10.1109/ICOSEC49089.2020.9215270
Kamble, R. M., Kokare, M., Chan, G. C., Perdomo, O., Gonzalez, F. A., Muller, H., et al. (2019). “Automated diabetic macular edema (DME) analysis using fine tuning with inception-resnet-v2 on OCT images,” in 2018 IEEE-EMBS Conference on Biomedical Engineering and Sciences (IECBES) (IEEE), 442–446. doi: 10.1109/IECBES.2018.8626616
Kanth, S., Jaiswal, A., and Kakkar, M (2013). “Identification of different stages of Diabetic Retinopathy using artificial neural network,” in 2013 Sixth International Conference on Contemporary Computing (IC3) (IEEE), 479–484. doi: 10.1109/IC3.2013.6612243
Kermany, D. S., Goldbaum, M., Cai, W., Valentim, C. C. S., Liang, H., Baxter, S. L., et al. (2018). Identifying medical diagnoses and treatable diseases by image-based deep learning. Cell 172, 1122–1131. doi: 10.1016/j.cell.2018.02.010
Koné, I., and Boulmane, L (2018). “Hierarchical ResNeXt models for breast cancer histology image classification,” in International Conference Image Analysis and Recognition (Springer), 796–803. doi: 10.1007/978-3-319-93000-8_90
LeCun, Y., Bottou, L., Bengio, Y., and Haffner, P (1998). Gradient-based learning applied to document recognition. Proc. IEEE 86, 2278–2324. doi: 10.1109/5.726791
Li, W., Wang, Z., Wang, Y., Wu, J., Wang, J., Jia, Y., et al. (2020). Classification of high-spatial-resolution remote sensing scenes method using transfer learning and deep convolutional neural network. IEEE J. Select. Top. Appl. Earth Observ. Remote Sens. 13, 1986–1995. doi: 10.36227/techrxiv.11694966.v1
Li, Y., Teng, D., Shi, X., Qin, G., Qin, Y., Quan, H., et al. (2020). Prevalence of diabetes recorded in mainland china using 2018 diagnostic criteria from the american diabetes association: national cross sectional study. BMJ 369:m997. doi: 10.1136/bmj.m997
Lian, C., Liang, Y., Kang, R., and Xiang, Y (2018). “Deep convolutional neural networks for diabetic retinopathy classification,” in Proceedings of the 2nd International Conference on Advances in Image Processing, 68–72. doi: 10.1145/3239576.3239589
Lin, T. H., Jhang, J. Y., Huang, C. R., Tsai, Y. C., Cheng, H. C., and Sheu, B. S (2021). Deep ensemble feature network for gastric section classification. IEEE J. Biomed. Health Inform. 25, 77–87. doi: 10.1109/JBHI.2020.2999731
Liu, K., Yu, S., and Liu, S (2020). An improved inceptionv3 network for obscured ship classifica-tion in remote sensing images. IEEE J. Select. Top. Appl. Earth Observ. Remote Sens. 13, 4738–4747. doi: 10.1109/JSTARS.2020.3017676
Loffe, S., and Szegedy, C (2015). “Batch normalization: accelerating deep network training by reducing internal covariate shift,” in International Conference On Machine Learning (PMLR), 448–456.
Lu, S., Zhu, Z., Gorriz, J. M., Wang, S. H., and Zhang, Y. D (2021). NAGNN: classification of COVID-19 based on neighboring aware representation from deep graph neural network. Int. J. Intell. Syst. 1–27. doi: 10.1002/int.22686
Lu, S. Y., Nayak, D. R., Wang, S. H., and Zhang, Y. D (2021). A cerebral microbleed diagno-sis method via featurenet and ensembled randomized neural networks. Appl. Soft Comput. 109:107567. doi: 10.1016/j.asoc.2021.107567
Maistry, A., Pillay, A., and Jembere, E (2020). “Improving the accuracy of diabetes retinopathy image classification using augmentation,” in Conference of the South African Institute of Computer Scientists and Information Technologists 2020, 134–140. doi: 10.1145/3410886.3410914
Minetto, R., Segundo, M. P., and Sarkar, S (2019). Hydra: an ensemble of convolutional neu-ral networks for geospatial land classification. IEEE Trans. Geosci. Remote Sens. 57, 6530–6541. doi: 10.1109/TGRS.2019.2906883
Narin, A., Kaya, C., and Pamuk, Z (2021). Automatic detection of coronavirus disease (COVID-19) using X-ray images and deep convolutional neural networks. Pattern Anal. Appl. 24, 1–4. doi: 10.1007/s10044-021-00984-y
Pant, G., Yadav, D. P., and Gaur, A (2020). Resnext convolution neural network topology-based deep learning model for identification and classification of pediastrum. Algal Res. 48:101932. doi: 10.1016/j.algal.2020.101932
Peng, S., Huang, H., Chen, W., Zhang, L., and Fang, W (2020). More trainable inception-resnet for face recognition. Neurocomputing 411, 9–19. doi: 10.1016/j.neucom.2020.05.022
Pires, R., Avila, S., Jelinek, H. F., Wainer, J., Valle, E., and Rocha, A (2017). Beyond lesion-based diabetic retinopathy: a direct approach for referral. IEEE J. Biomed. Health Inform. 21, 193–200. doi: 10.1109/JBHI.2015.2498104
Porwal, P., Pachade, S., Kokare, M., Deshmukh, G., Son, J., Bae, W., et al. (2020). IDRiD: diabetic retinopathy-segmentation and grading challenge. Med. Image Anal. 59:101561. doi: 10.1016/j.media.2019.101561
Pratt, H., Coenen, F., Broadbent, D. M., Harding, S. P., and Zheng, Y (2016). Convolutional neural networks for diabetic retinopathy. Proc. Comput. Sci. 90, 200–205. doi: 10.1016/j.procs.2016.07.014
Qomariah, D. U. N., Tjandrasa, H., and Fatichah, C (2019). “Classification of diabetic retinopathy and normal retinal images using CNN and SVM,” in 2019 12th International Conference on Information & Communication Technology and System (ICTS) (IEEE), 152–157. doi: 10.1109/ICTS.2019.8850940
Quellec, G., Hajj, H. A., Lamard, M., Conze, P. H., Massin, P., and Cochener, B (2021). Explanatory artificial intelligence for diabetic retinopathy diagnosis. Med. Image Anal. 72, 102–118. doi: 10.1016/j.media.2021.102118
Rismiyati, E., Khadijah, S. N., and Shiddiq, I. N (2020). “Xception architecture transfer learning for garbage classification,” in 2020 4th International Conference on Informatics and Computational Sciences (ICICoS) (IEEE), 1–4. doi: 10.1109/ICICoS51170.2020.9299017
Roychowdhury, S., Koozehanani, D. D., and Parhi, K (2014). DREAM: Diabetic retinopathy analysis using machine learning. IEEE J. Biomed. Health Inform. 18, 1717–1728. doi: 10.1109/JBHI.2013.2294635
Simonyan, K., and Zisserman, A (2015). “Very deep convolutional networks for large-scale image recognition,” in 3rd International Conference on Learning Representations, ICLR 2015 - Conference Track Proceedings (ICLR), arXiv: 1409.1556.
Szegedy, C., Liu, W., Jia, Y., Sermanet, P., Reed, S., Anguelov, D., et al. (2015). “Going deeper with convolutions,” in Proceedings of the IEEE Conference on Computer Vision and Pattern Recognition (IEEE), 1–9.
Szegedy, C., Loffe, S., Vanhoucke, V., and Alemi, A. A (2017). “Inception-v4, inception-ResNet and the impact of residual connections on learning,” in Thirty-first AAAI Conference on Artificial Intelligence (San Francisco, SF: AAAI), 4278–4284.
Szegedy, C., Vanhoucke, V., Loffe, S., Shlens, J., and Wojna, Z (2016). “Rethinking the inception architecture for computer vision,” in Proceedings of the IEEE Conference on Computer Vision and Pattern Recognition (IEEE), 2818–2826. doi: 10.1109/CVPR.2016.308
Thomas, A., Harikrishnan, P. M., Palanisamy, P., and Gopi, V. P (2020). “Moving vehicle candidate recognition and classification using inception-resnet-v2,” in 2020 IEEE 44th Annual Computers, Software, and Applications Conference (COMPSAC) (IEEE), 467–472. doi: 10.1109/COMPSAC48688.2020.0-207
Torrey, L., and Shavlik, J (2010). “Transfer learning,” in Handbook of Research on Machine Lear-ning Applications and Trends: Algorithms, Methods, and Techniques, eds E. S. Olivas, J. D. M. Guerrero, M. Martinez-Sober, J. R. Magdalena-Benedito, and A. J. S. Lopez (Hershey, PA: IGI Global), 242–264. doi: 10.4018/978-1-60566-766-9.ch011
Woo, S., Park, J., Lee, J. Y., and Kweon, S (2018). “CBAM: Convolutional block attention module,” in Proceedings of the European Conference on Computer Vision (ECCV), 3–19. doi: 10.1007/978-3-030-01234-2_1
Wu, X., Liu, R., Yang, H., and Chen, Z (2020). “An xception based convolutional neural network for scene image classification with transfer learning,” in 2020 2nd International Conference on Information Technology and Computer Application (ITCA) (IEEE), 262–267. doi: 10.1109/ITCA52113.2020.00063
Wu, Y., and Hu, Z (2019). “Recognition of diabetic retinopathy basedon transfer learning,” in 2019 IEEE 4th International Conference on Cloud Computing and Big Data Analysis (ICCCBDA) (IEEE), 398–401. doi: 10.1109/ICCCBDA.2019.8725801
Xiao, F., Kuang, R., Ou, Z., and Xiong, B (2019). “DeepMen: multi-model ensemble network for b-lymphoblast cell classification,” in ISBI 2019 C-NMC Challenge: Classification in Cancer Cell Imaging (Springer), 83–93. doi: 10.1007/978-981-15-0798-4_9
Xie, S., Girshick, R., Dollar, P., Tu, Z., and He, K (2017). “Aggregated residual transformations for deep neural networks,” in Proceedings of the IEEE Conference on Computer Vision and Pattern Recognition, 1497–1500. doi: 10.1109/CVPR.2017.634
Yao, N., Ni, F., Wang, Z., Luo, J., Sung, W. K., Luo, C., et al. (2021). L2mxception: an improved xception network for classification of peach diseases. Plant Methods 17, 1–13. doi: 10.1186/s13007-021-00736-3
Zhang, W., Zhao, X., Chen, Y., Zhong, J., and Yi, Z (2021). DeepUWF: an automated ultra-wide-field fundus screening system via deep learning. IEEE J. Biomed. Health Inform. 25, 2988–2996. doi: 10.1109/JBHI.2020.3046771
Zhao, Z., Zhang, K., Hao, X., Tian, J., Chua, M. C. H., Chen, L., et al. (2019). “BiRA-net: bilinear attention net for diabetic retinopathy grading,” in 2019 IEEE International Conference on Image Processing (ICIP) (IEEE), 1385–1389. doi: 10.1109/ICIP.2019.8803074
Zheng, J., Cao, X., Zhang, B., Zhen, X., and Su, X (2019). Deep ensemble machine for video classification. IEEE Trans. Neural Netw. Learn. Syst. 30, 553–565. doi: 10.1109/TNNLS.2018.2844464
Keywords: diabetic retinopathy, image processing, ensemble learning, deep learning, attention mechanism
Citation: Ai Z, Huang X, Fan Y, Feng J, Zeng F and Lu Y (2021) DR-IIXRN : Detection Algorithm of Diabetic Retinopathy Based on Deep Ensemble Learning and Attention Mechanism. Front. Neuroinform. 15:778552. doi: 10.3389/fninf.2021.778552
Received: 17 September 2021; Accepted: 16 November 2021;
Published: 24 December 2021.
Edited by:
Yu-Dong Zhang, University of Leicester, United KingdomReviewed by:
Gauri Borkhade, Padmashree Dr. D.Y. Patil University, IndiaSiyuan Lu, University of Leicester, United Kingdom
Copyright © 2021 Ai, Huang, Fan, Feng, Zeng and Lu. This is an open-access article distributed under the terms of the Creative Commons Attribution License (CC BY). The use, distribution or reproduction in other forums is permitted, provided the original author(s) and the copyright owner(s) are credited and that the original publication in this journal is cited, in accordance with accepted academic practice. No use, distribution or reproduction is permitted which does not comply with these terms.
*Correspondence: Fanxin Zeng, fanxinly@163.com; Yaping Lu, luyaping@sinopharm.com
†These authors have contributed equally to this work and share first authorship