Corrigendum: Age-dependent microstructure alterations in 5xFAD mice by high-resolution diffusion tensor imaging
 Surendra Maharjan1
 Andy P. Tsai2
 Peter B. Lin2
 Cynthia Ingraham2Megan R. Jewett1
 Gary E. Landreth2,3
 Adrian L. Oblak1,2
 Nian Wang1,2*
- 1Department of Radiology and Imaging Sciences, Indiana University, Indianapolis, IN, United States
- 2Stark Neurosciences Research Institute, Indiana University, Indianapolis, IN, United States
- 3Department of Anatomy, Cell Biology and Physiology, Indiana University, Indianapolis, IN, United States
Purpose: To evaluate the age-dependent microstructure changes in 5xFAD mice using high-resolution diffusion tensor imaging (DTI).
Methods: The 5xFAD mice at 4, 7.5, and 12 months and the wild-type controls at 4 months were scanned at 9.4T using a 3D echo-planar imaging (EPI) pulse sequence with the isotropic spatial resolution of 100 μm. The b-value was 3000 s/mm2 for all the diffusion MRI scans. The samples were also acquired with a gradient echo pulse sequence at 50 μm isotropic resolution. The microstructure changes were quantified with DTI metrics, including fractional anisotropy (FA) and mean diffusivity (MD). The conventional histology was performed to validate with MRI findings.
Results: The FA values (p = 0.028) showed significant differences in the cortex between wild-type (WT) and 5xFAD mice at 4 months, while hippocampus, anterior commissure, corpus callosum, and fornix showed no significant differences for either FA and MD. FA values of 5xFAD mice gradually decreased in cortex (0.140 ± 0.007 at 4 months, 0.132 ± 0.008 at 7.5 months, 0.126 ± 0.013 at 12 months) and fornix (0.140 ± 0.007 at 4 months, 0.132 ± 0.008 at 7.5 months, 0.126 ± 0.013 at 12 months) with aging. Both FA (p = 0.029) and MD (p = 0.037) demonstrated significant differences in corpus callosum between 4 and 12 months age old. FA and MD were not significantly different in the hippocampus or anterior commissure. The age-dependent microstructure alterations were better captured by FA when compared to MD.
Conclusion: FA showed higher sensitivity to monitor amyloid deposition in 5xFAD mice. DTI may be utilized as a sensitive biomarker to monitor beta-amyloid progression for preclinical studies.
Introduction
Alzheimer’s disease (AD) is the most common cause of dementia with clinically characterized by age-dependent memory loss and cognitive dysfunction (Bush, 2003; Goedert and Spillantini, 2006). The primary characteristics of AD are the abnormal accumulation of extracellular β-amyloid (Aβ) and intracellular hyperphosphorylated tau proteins (Takahashi et al., 2010; Koss et al., 2016; Wang et al., 2016). Aβ plaque formation is considered as one of the earliest components, starting years, or even decades before clinical symptoms (Busciglio et al., 1995; Bloom, 2014). The capability to monitor the alterations in tissue microstructure caused by the accumulation of Aβ may provide an important biomarker to monitor disease progression or treatment response (Adlard et al., 2014; Thal et al., 2014).
Compared to the conventional volumetric MRI methods, diffusion MRI (dMRI) is more sensitive to the brain microstructural changes and has been widely used for the evaluation of white matter integrity (Bozzali et al., 2002; Mielke et al., 2009; Stebbins and Murphy, 2009; Wang et al., 2019b; Harrison et al., 2020; Veale et al., 2021). Patients with AD showed a significant reduction in the integrity of the associated white matter fiber tracts, including splenium of the corpus callosum, superior longitudinal fasciculus, and cingulum (Rose et al., 2000). Teipel et al. (2012) found a significant reduction of FA and a significant increase of MD in core areas of AD pathology including the corpus callosum, medial and temporal lobes, fornix, cingulate gyrus, precuneus, and prefrontal lobe white matter. The microstructure changes of patients with mild cognitive impairment have also been identified in the hippocampus using dMRI (Kantarci et al., 2005; Veale et al., 2021). More recently, dMRI studies have shown abnormalities in multiple neocortical areas at various stages of AD (Jacobs et al., 2013; Torso et al., 2021).
Despite the knowledge gained from human studies, transgenic animal models are an invaluable tool for studying pathogenic mechanisms and testing therapeutics of AD (Kitazawa et al., 2012; Jankowsky and Zheng, 2017; Sasaguri et al., 2017). The transgenic mouse model, 5xFAD, expresses human APP with three FAD mutations and human PSEN1 with two FAD mutations, and is commonly used to study the mechanisms of AD (Oakley et al., 2006; Forner et al., 2021). In 5xFAD mice, amyloid plaques are first observed between two and four months of age in the cortical layer V and in the subiculum of the hippocampal formation (Oblak et al., 2021). Different MRI techniques have been used to study the brain structure and function of 5xFAD mice (Mlynarik et al., 2012; Igarashi et al., 2020; Jullienne et al., 2022). Manganese-enhanced MRI (MEMRI) has been utilized as an activity-dependent contrast agent. Studies found that manganese could serve as a targeted contrast agent to visualize amyloid plaques in 5xFAD mice (Kim et al., 2021). The structural networks derived from dMRI exhibited higher path lengths in 6-month-old 5xFAD mice compared to controls (Kesler et al., 2018).
The 5xFAD transgenic mice have been acknowledged as a useful model for better understanding the pathogenesis of human AD (Girard et al., 2013). To the best of our knowledge, probing age-dependent tissue microstructure alterations in 5xFAD mice using high-resolution DTI has not been reported. In this study, we compared the microstructure alterations in cortex and hippocampus between wild-type (WT) and 5xFAD mice at 4 months of age. We further investigated the age-dependent microstructural variations in 5xFAD mice at three different ages (4, 7.5, and 12 months) throughout the whole brain (166 regions) (Wang et al., 2018a). The MRI findings were validated with Aβ plaque and NeuN staining.
Materials and methods
Animal preparation
Animal experiments were carried out in compliance with the Indiana University Institutional Animal Care and Use Committee. Six WT/six mice at the age of 4 months and eighteen 5xFAD (Jax #34848) mice at the ages of 4, 7.5, and 12 months (Jackson Laboratory, Bar Harbor, ME, United States) were sacrificed and perfused with the PBS solution. The mouse brains were immersed in buffered formalin for 24 h and then placed in a PBS solution of 0.5% Prohance (Bracco Diagnostics Inc., Princeton, NJ, United States) to shorten T1 and reduce scan time (Wang et al., 2019a).
MRI protocol
MR images of the specimens were acquired on a 30-cm bore 9.4T magnet (Bruker BioSpec 94/30, Billerica, MA, United States) with a maximum gradient strength of 660 mT/m on each axis. A high-sensitivity cryogenic RF surface receive-only coil was used for signal reception (Bruker CryoProbe). A multi-shot 3D EPI pulse sequence was used with the following parameters: matrix size = 180 × 128 × 76, FOV = 18.0 mm × 12.8 mm × 7.6 mm, 100 μm isotropic spatial resolution, TE = 22.3 ms, TR = 100 ms, 61 unique diffusion directions with b-value of 3000 s/mm2 and six non-diffusion-weighted (b0) measurements (Crater et al., 2022). The gradient separation time was 4.4 ms and the diffusion gradient duration time was 9.8 ms.
A 3D gradient echo (GRE) pulse sequence was performed at the spatial resolution of 50 × 50 × 50 μm3 with TE of 12 ms (Wang et al., 2018b). The parameters were as follows: matrix size = 360 × 256 × 152, FOV = 18.0 mm × 12.8 mm × 7.6 mm, flip angle = 45°, bandwidth (BW) = 125 kHz, and TR = 100 ms.
Data processing for diffusion tensor imaging
All the diffusion-weighted images (DWIs) were registered to the baseline images (b0) using linear affine registration. The scalar indices including FA, MD, axial diffusivity (AD), and
radial diffusivity (RD) were calculated based on the DTI model using DSI studio toolbox (Yeh et al., 2010). Each mouse brain was registered to the mouse brain atlas in Waxholm space using the Advanced Normalization Tools (ANTs) and then divided into 166 Region-of-interest (ROIs, Supplementary Figure 1; Wang et al., 2020a). The labels were mapped back to the individual brain space to calculate the values of DTI metrics in each ROI. A one-way analysis of variance (ANOVA) was performed to compare the statistically difference of DTI metrics between B6 and 5xFAD mice at the age of 4 months. To identify the age-dependent microstructure variations of 5xFAD mice, the DTI metrics were also compared at different ages: 4 months vs. 7.5 months, 4 months vs. 12 months. The statistical significance was determined at p < 0.05.
Histology
Histological examinations were performed on the mice brains as previous described (Oblak et al., 2021; Tsai et al., 2021). Thirty micron-thick sections were stained to visualize neuronal cell bodies and beta-amyloid plaques using antibodies directed against NeuN (Abcam #ab104225, 1:1000, Boston, MA) and 6E10 (BioLegend #803001, 1:1000). The slides were imaged using Leica DVM6 digital microscope.
Results
Figure 1 illustrates the T2*-weighted images of WT mice at 4 months and 5xFAD at different ages (4, 7.5, and 12 months, Figures 1B–D,F–H). As shown in the figure, numerous dark spots were evident in the cortex (red arrows) and hippocampus (white arrows) in 5xFAD mice. The hypointense signals were better observed under higher magnification, as displayed in the bottom row (Figures 1E–H). Such hypointense signals were not observed in the WT mouse (Figures 1A–E). The dark spot areas were gradually increased with age in the 5xFAD mice.
FIGURE 1
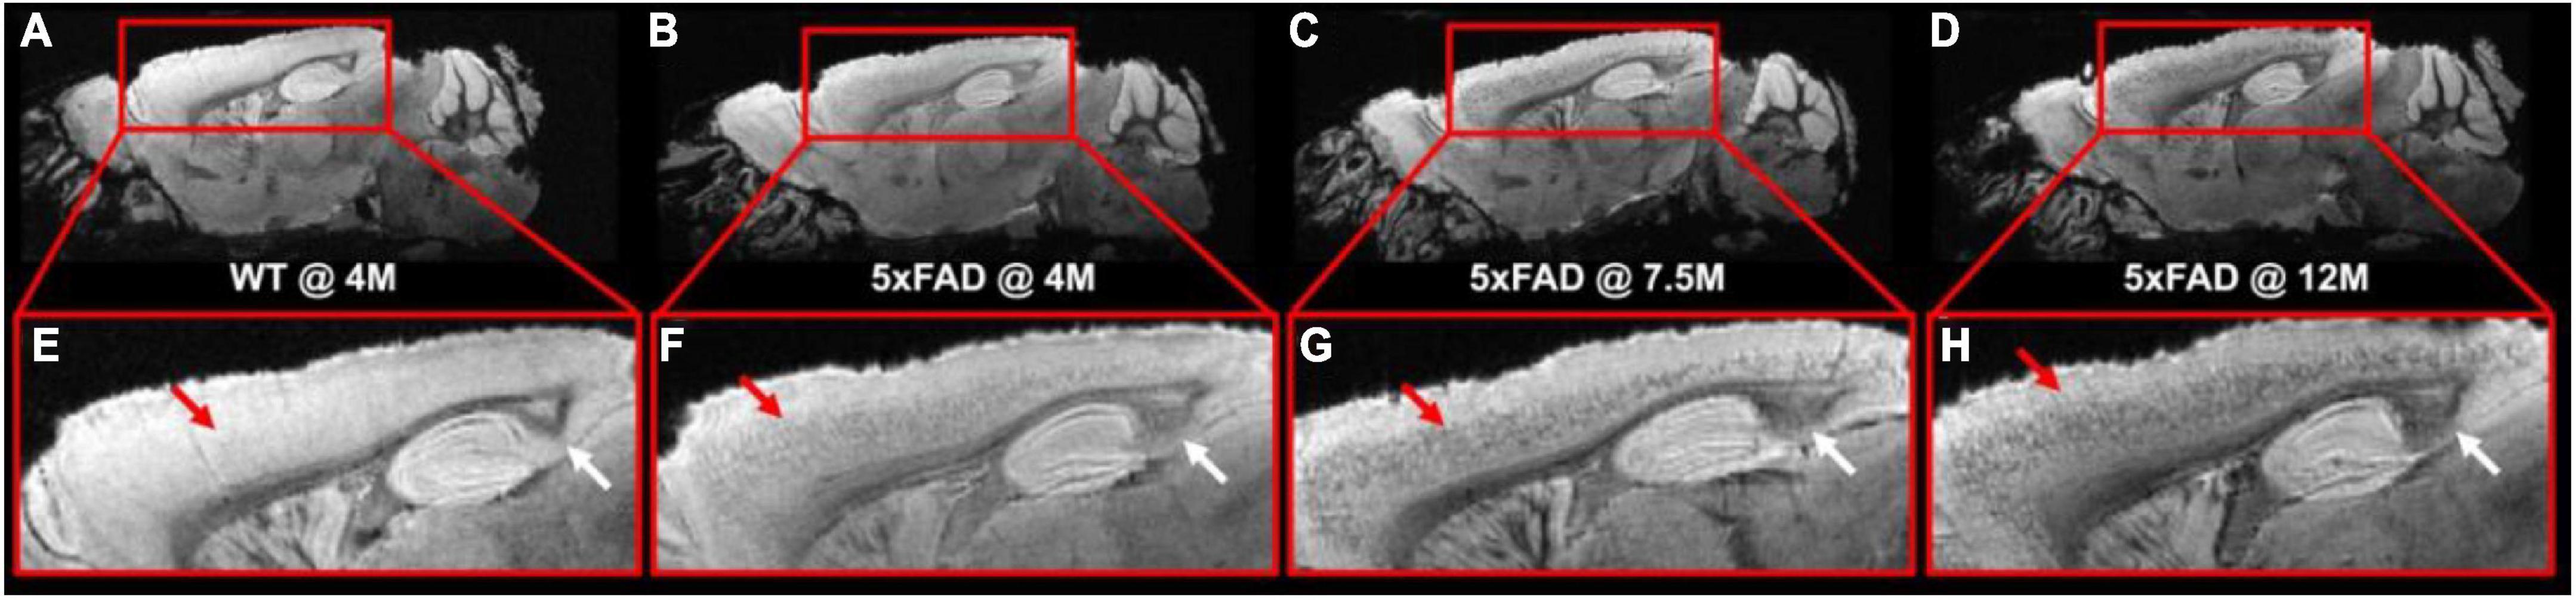
Figure 1. The T2*-weighted images of WT mice (A,E) at 4 months and 5xFAD at different ages (4, 7.5, and 12 months, B–D, F–H). Numerous dark spots were clearly evident in the cortex and hippocampus regions of the 5xFAD mice.
Figure 2 shows the representative FA (Figures 2A,B) and MD (Figures 2C,D) images of WT and 5xFAD mice at 4 months. Both WT and 5xFAD mice demonstrated very similar anatomy of the brain (Figure 2A). There are no apparent FA and MD differences in the corpus callosum (cc, yellow arrows) and hippocampus (Hc, blue arrows). The FA map showed darker (lower FA values) in the cortex (Cx) of 5xFAD compared to WT (red arrows). In contrast, the MD map depicted less variation between 5xFAD and WT mice.
FIGURE 2
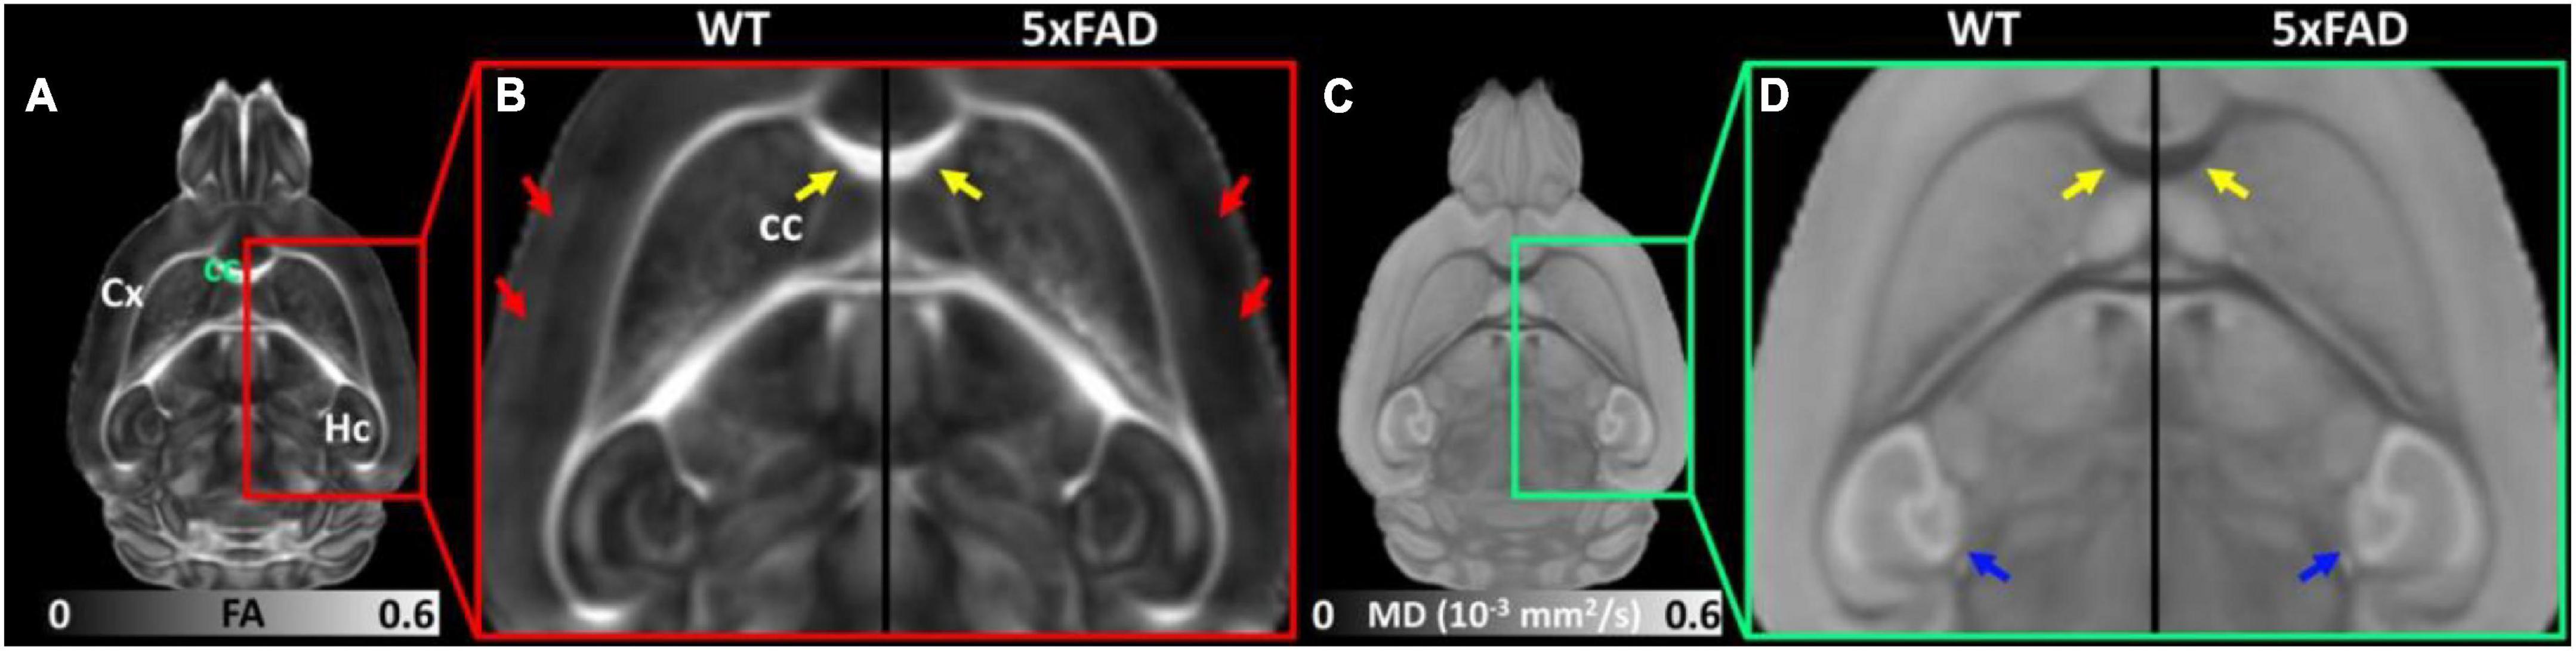
Figure 2. The representative FA (A,B) and MD (C,D) images of WT and 5xFAD mice at 4 months. There are no apparent FA and MD differences in the corpus callosum (cc, yellow arrows) and hippocampus (Hc, blue arrows) regions. The FA map showed darker (lower FA values) in the cortex (Cx) region of 5xFAD compared to WT (red arrows).
The FA (Figure 3b) and MD (Figure 3c) values of different regions (Figure 3a) for both WT and 5xFAD mice at 4 months are shown in Figure 3. The different regions including Cx, Hc, anterior commissure (ac), cc, and fornix (fx) were rendered with different colors (Figure 3a). There were no significant differences in most of the brain regions, including Hc (p = 0.269 for FA; p = 0.007 for MD), ac (p = 0.442 for FA; p = 0.126 for MD), cc (p = 0.168 for FA; p = 0.398 for MD), and fx (p = 0.366 for FA; p = 0.185 for MD). In the cortex region, the FA exhibited a significant decrease between WT and 5xFAD mice (p = 0.028). In contrast, no significant difference was found for MD in the cortex region (p = 0.052).
FIGURE 3
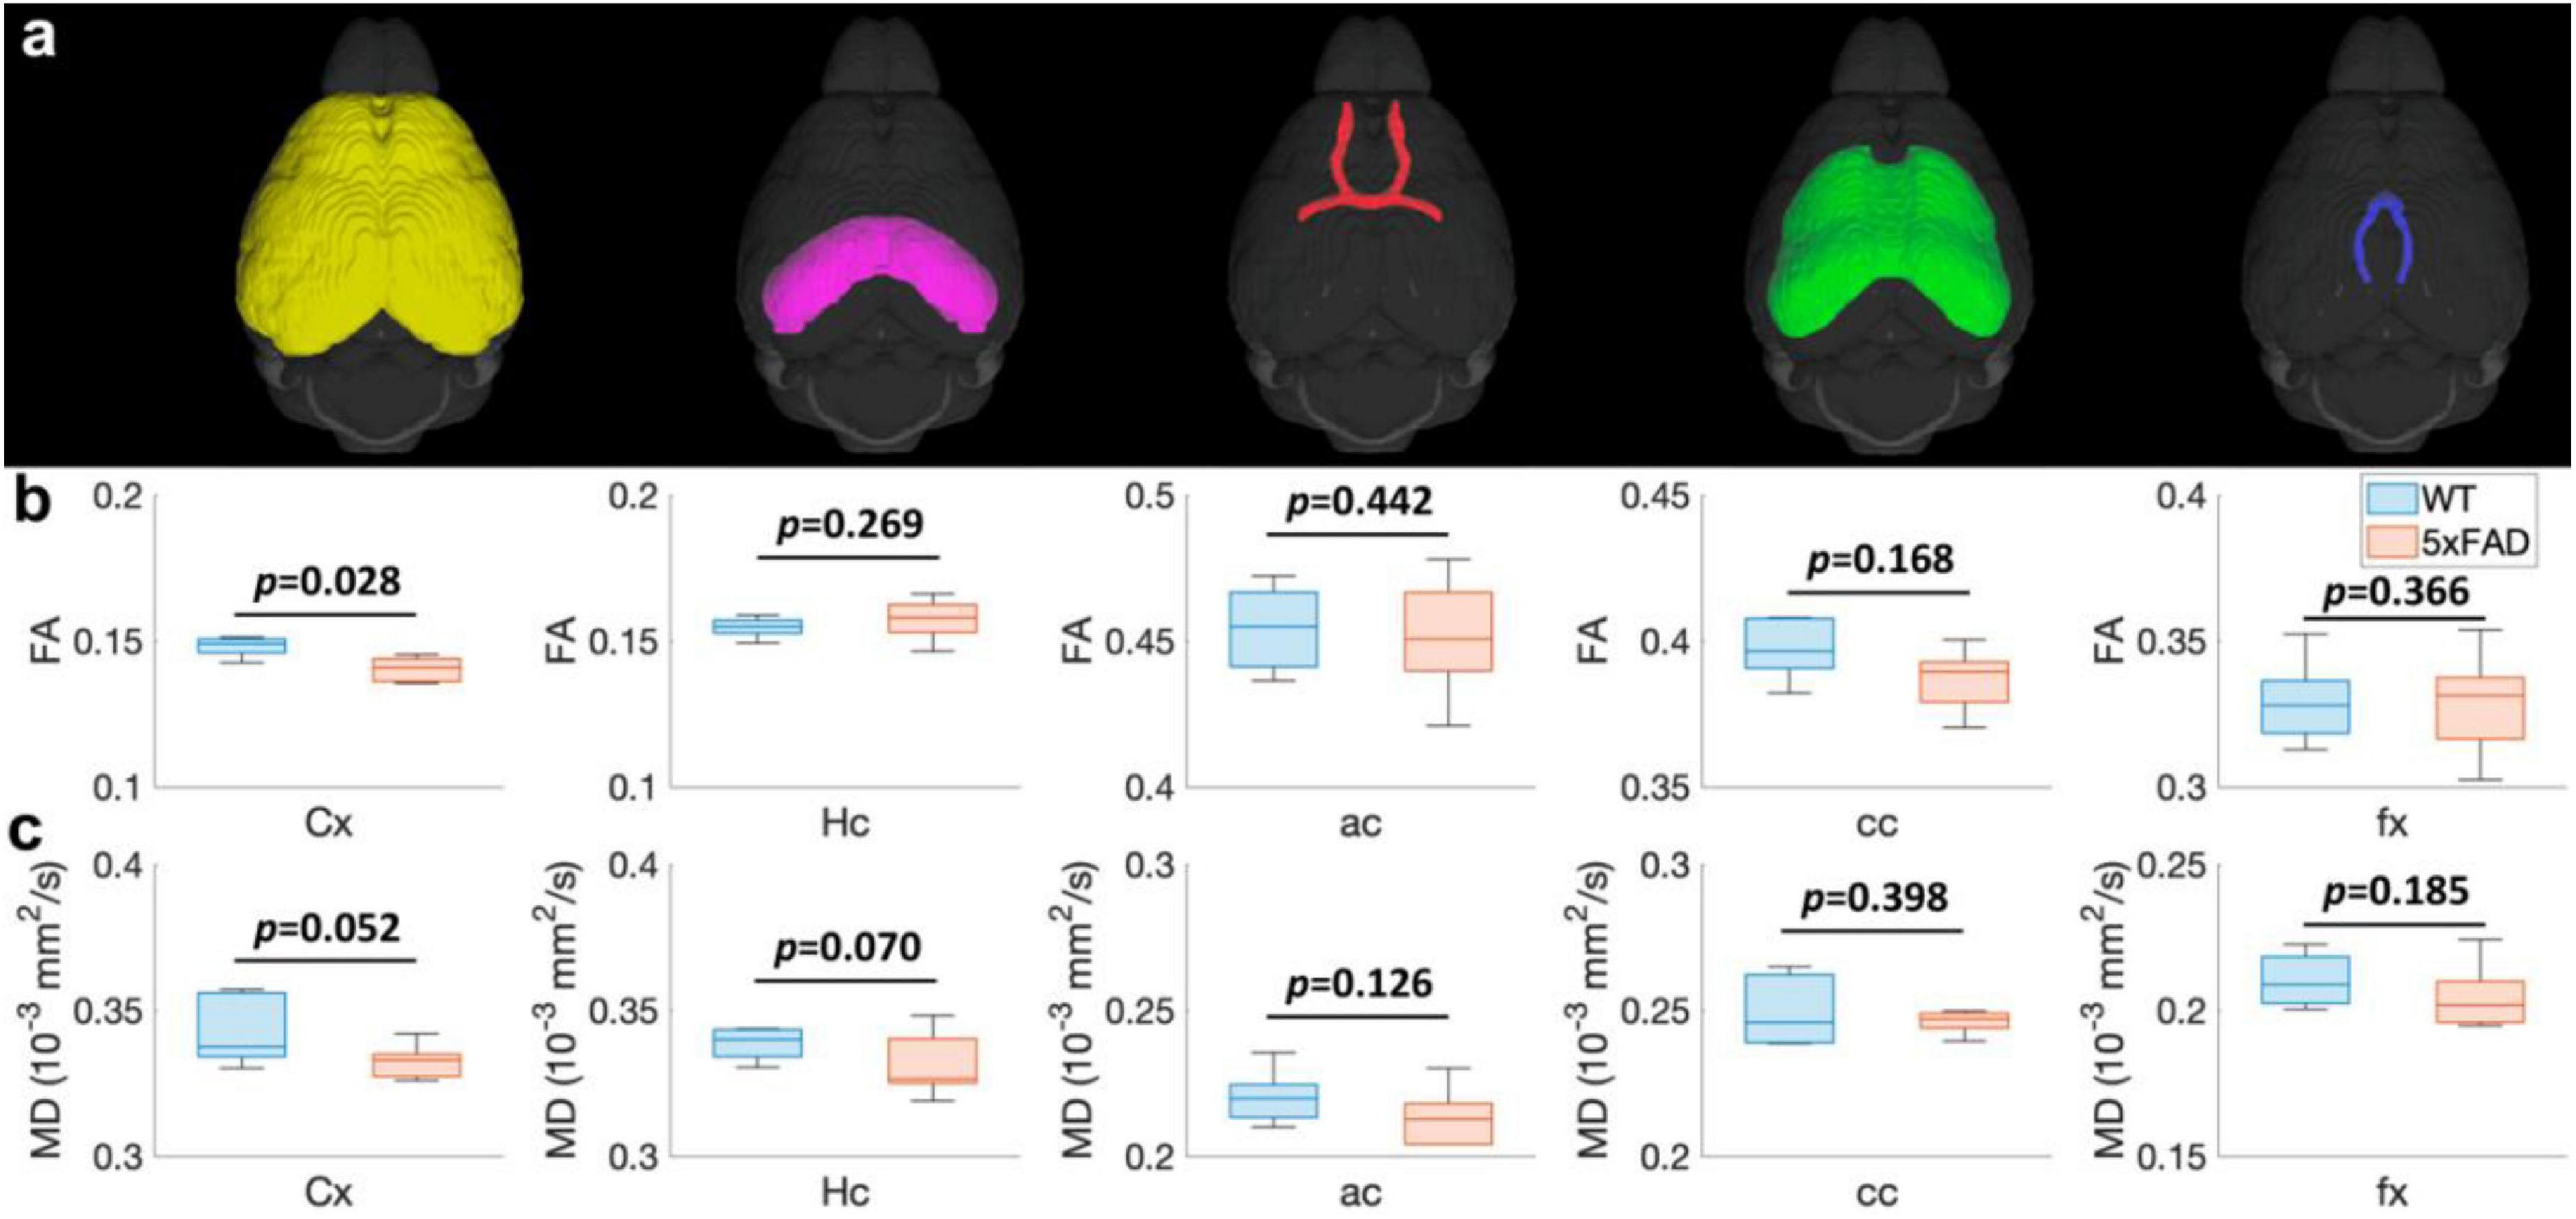
Figure 3. The FA (B) and MD (C) values at different regions (Cx, Hc, ac, cc, and fx, A) for both WT and 5xFAD mice at 4 months. Cx: cortex; Hc: hippocampus; ac: anterior commissure; cc: corpus callosum; fx: fornix.
To explore the age-dependent tissue microstructure change in different brain regions, the FA and MD values of 5xFAD mice at different ages (4, 7.5, and 12 months) were exhibited in Figure 4. The DTI metrics showed strong age-dependent variations in different areas of the brain (Figures 4A–J). The FA and MD revealed no significant differences between 4 and 7.5 months in Hc (p = 0.375 for FA, p = 0.455 for MD), ac (p = 0.254 for FA, p = 0.180 for MD), and cc (p = 0.134 for FA and p = 0.429 for MD) regions. In contrast, both FA and MD showed significant differences in fx (p = 0.002 for FA and p = 0.045 for MD). FA values had significant differences in Cx (p = 0.044); MD values showed no significant differences in Cx (p = 0.320). More regions showed significant differences between 4 and 12 months, including Cx (p = 0.025 for FA), cc (p = 0.029 for FA and p = 0.037 for MD), and fx (p < 0.001 for FA and p = 0.005 for MD).
FIGURE 4
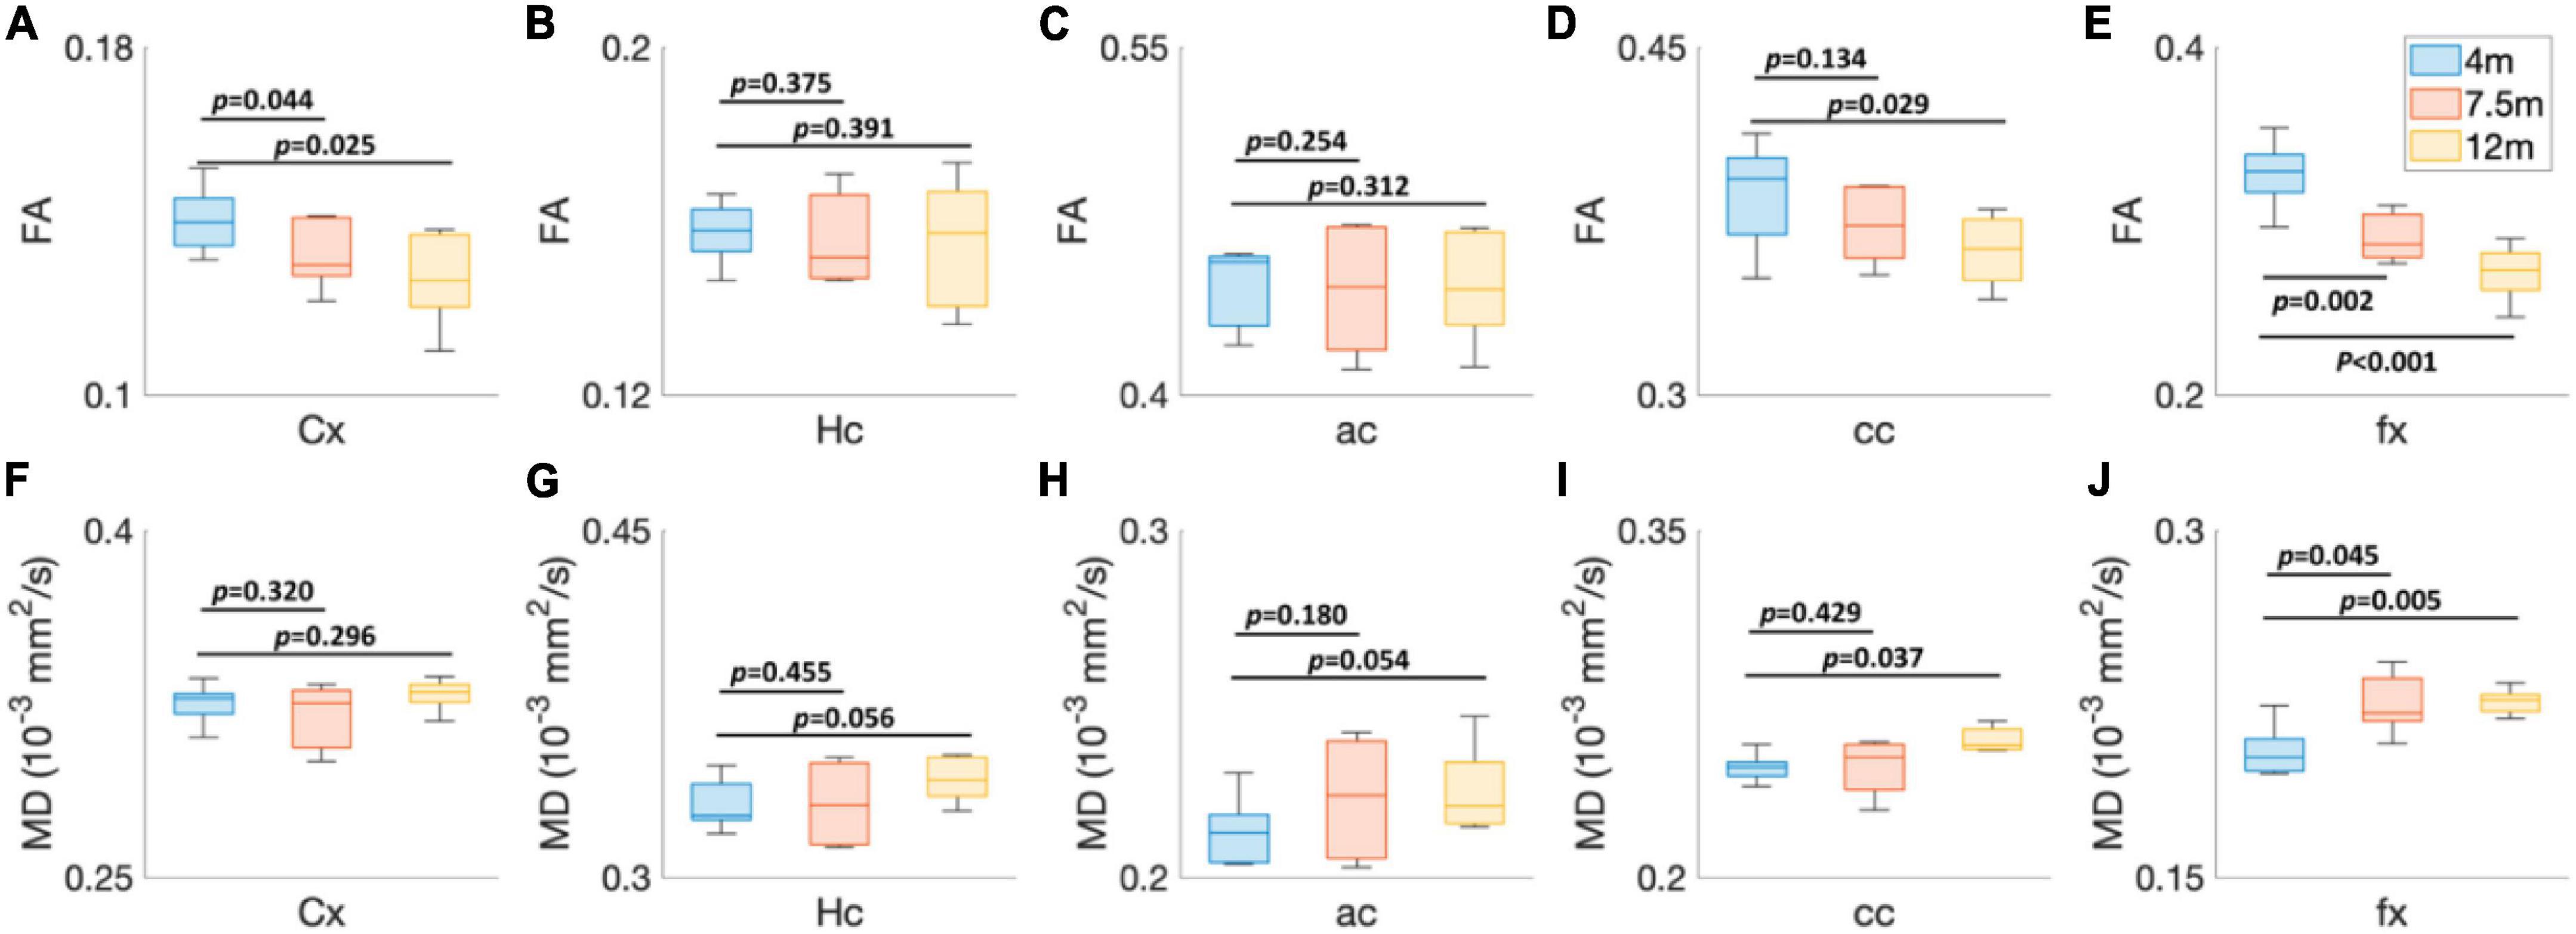
Figure 4. The age-dependent (4, 7.5, and 12 months) FA (A–E) and MD (F–J) values of 5xFAD mice at different brain regions. Cx, cortex; Hc, hippocampus; ac, anterior commissure; cc, corpus callosum; fx, fornix.
To validate the MRI findings with conventional histology, the age-dependent FA (Figures 5A,C) and beta-amyloid staining (Figures 5B,D) images of 5xFAD mice are shown in Figure 5. The FA was gradually decreased with age in both upper layers (blue arrows in Figure 5C) and lower layers (black arrows in Figure 5C) of the cortex. The beta-amyloid staining was overlayed on the NeuN staining (Figure 5D). There were more plaques in the lower layers of the cortex regardless of the age. The plaques gradually increased with age in both lower and upper layers of the cortex. The representative FA slices at different ages (4, 7.5, and 12 m) are shown in Supplementary Figure 2.
FIGURE 5
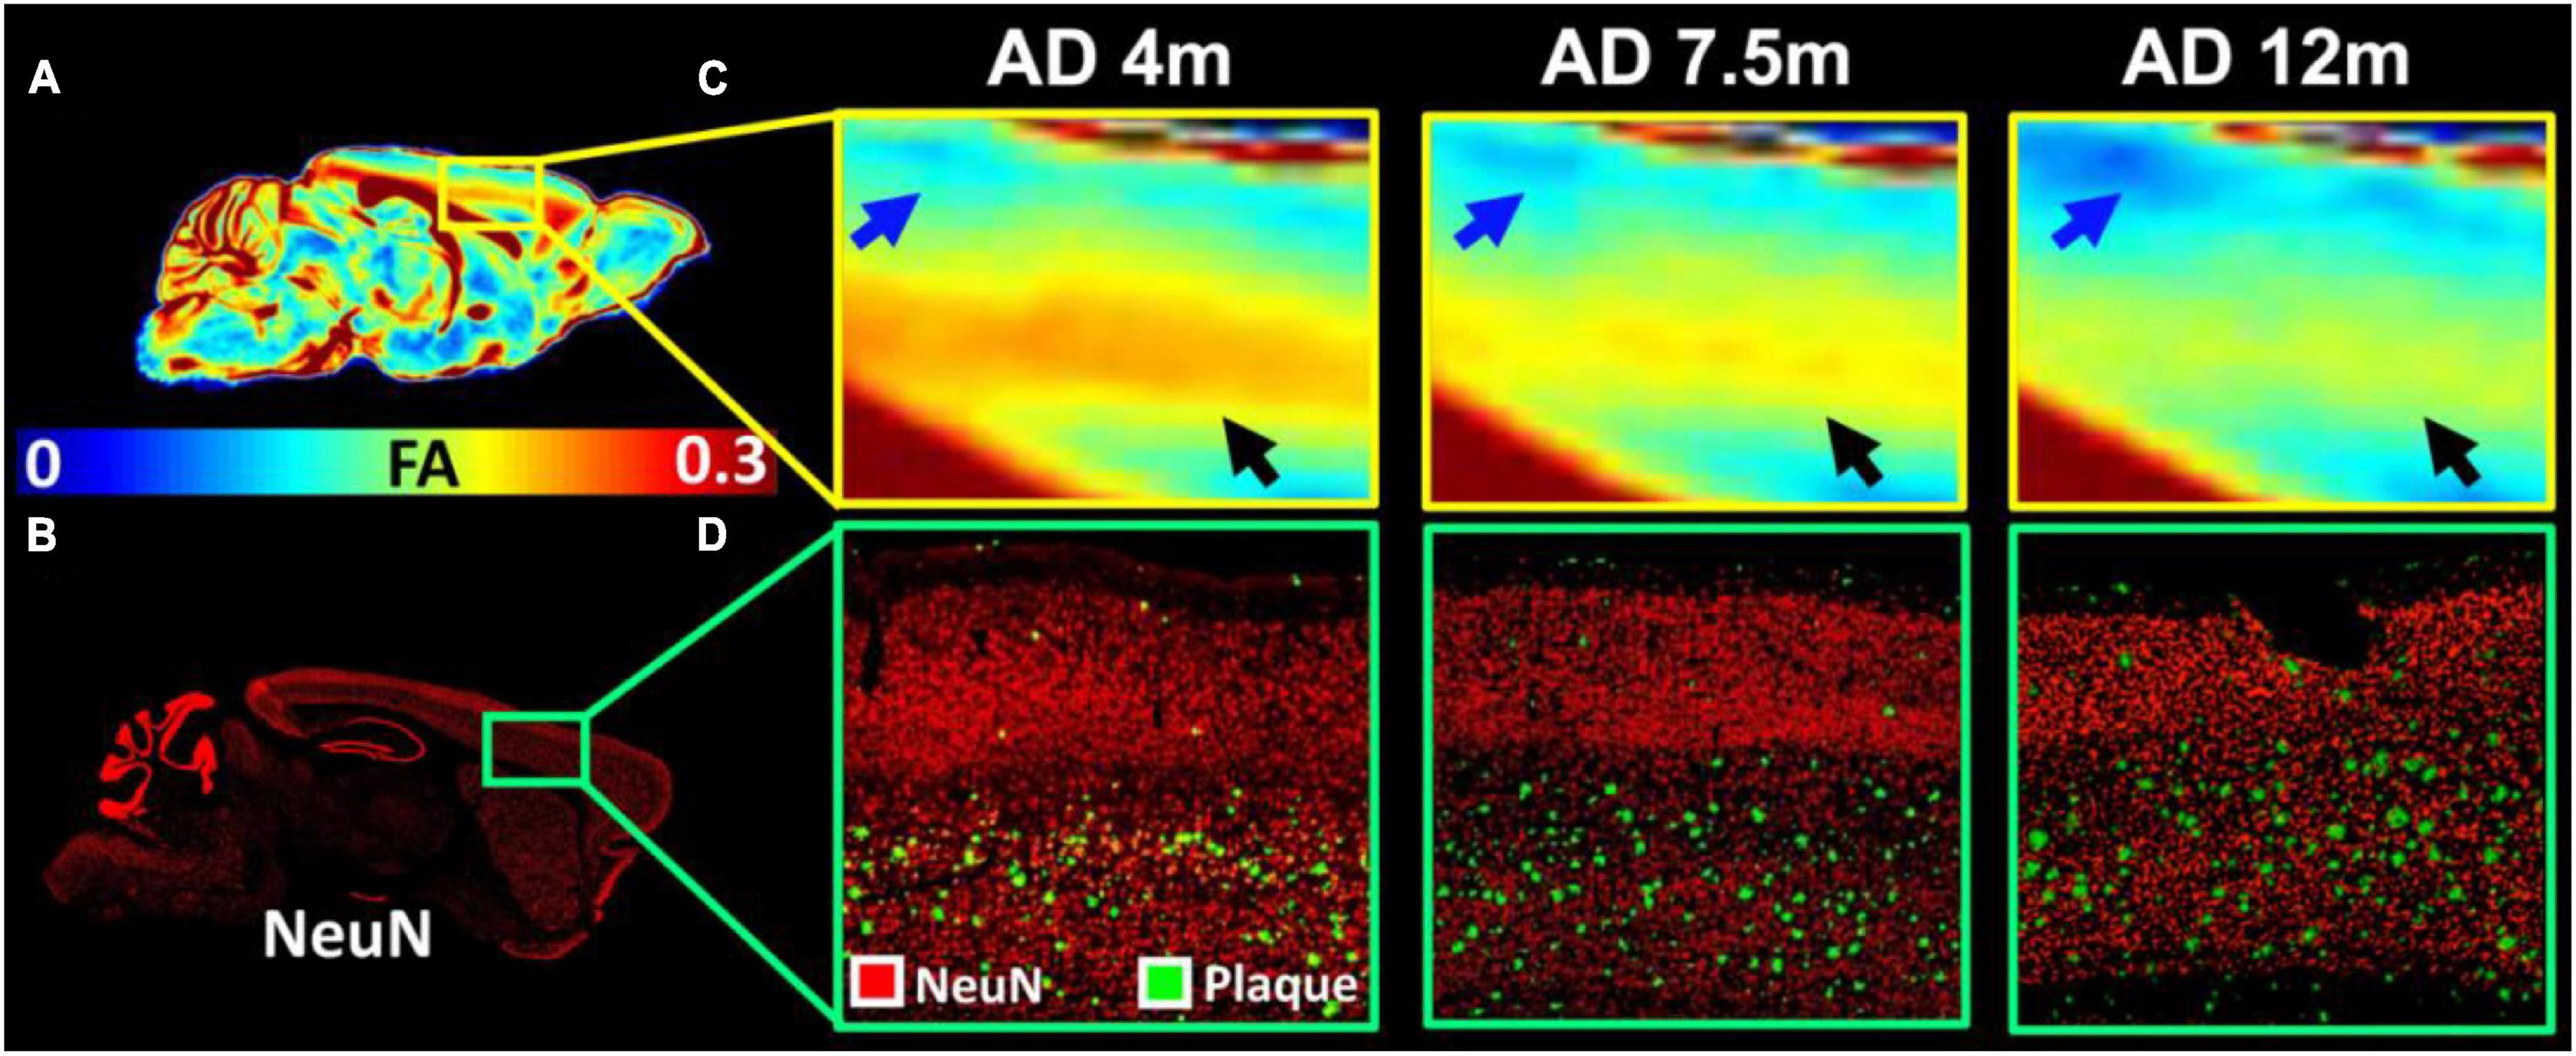
Figure 5. The age-dependent FA (A,C) and beta-amyloid staining images of 5xFAD mice (B,D). The FA was gradually decreased with age in both upper layers (blue arrows in C) and lower layers (black arrows in C) of the cortex. The beta-amyloid staining was overlayed on the NeuN staining (D).
The FA images (Figures 6A,B) and beta-amyloid staining (Figure 6C) at different ages of 5xFAD in the hippocampus are illustrated in Figure 6. The FA values showed strong age-dependent changes in the dentate gyrus (DG, blue arrows in Figure 6B), the dorsal subiculum (DS, purple arrows in Figure 6B), and the CA2 (white arrows). The plaques gradually increased with age in the hippocampus regions (Figure 6C). There were more plaques accumulated in the DG, DS, and CA2 regions, which was consistent with the reduction of FA.
FIGURE 6
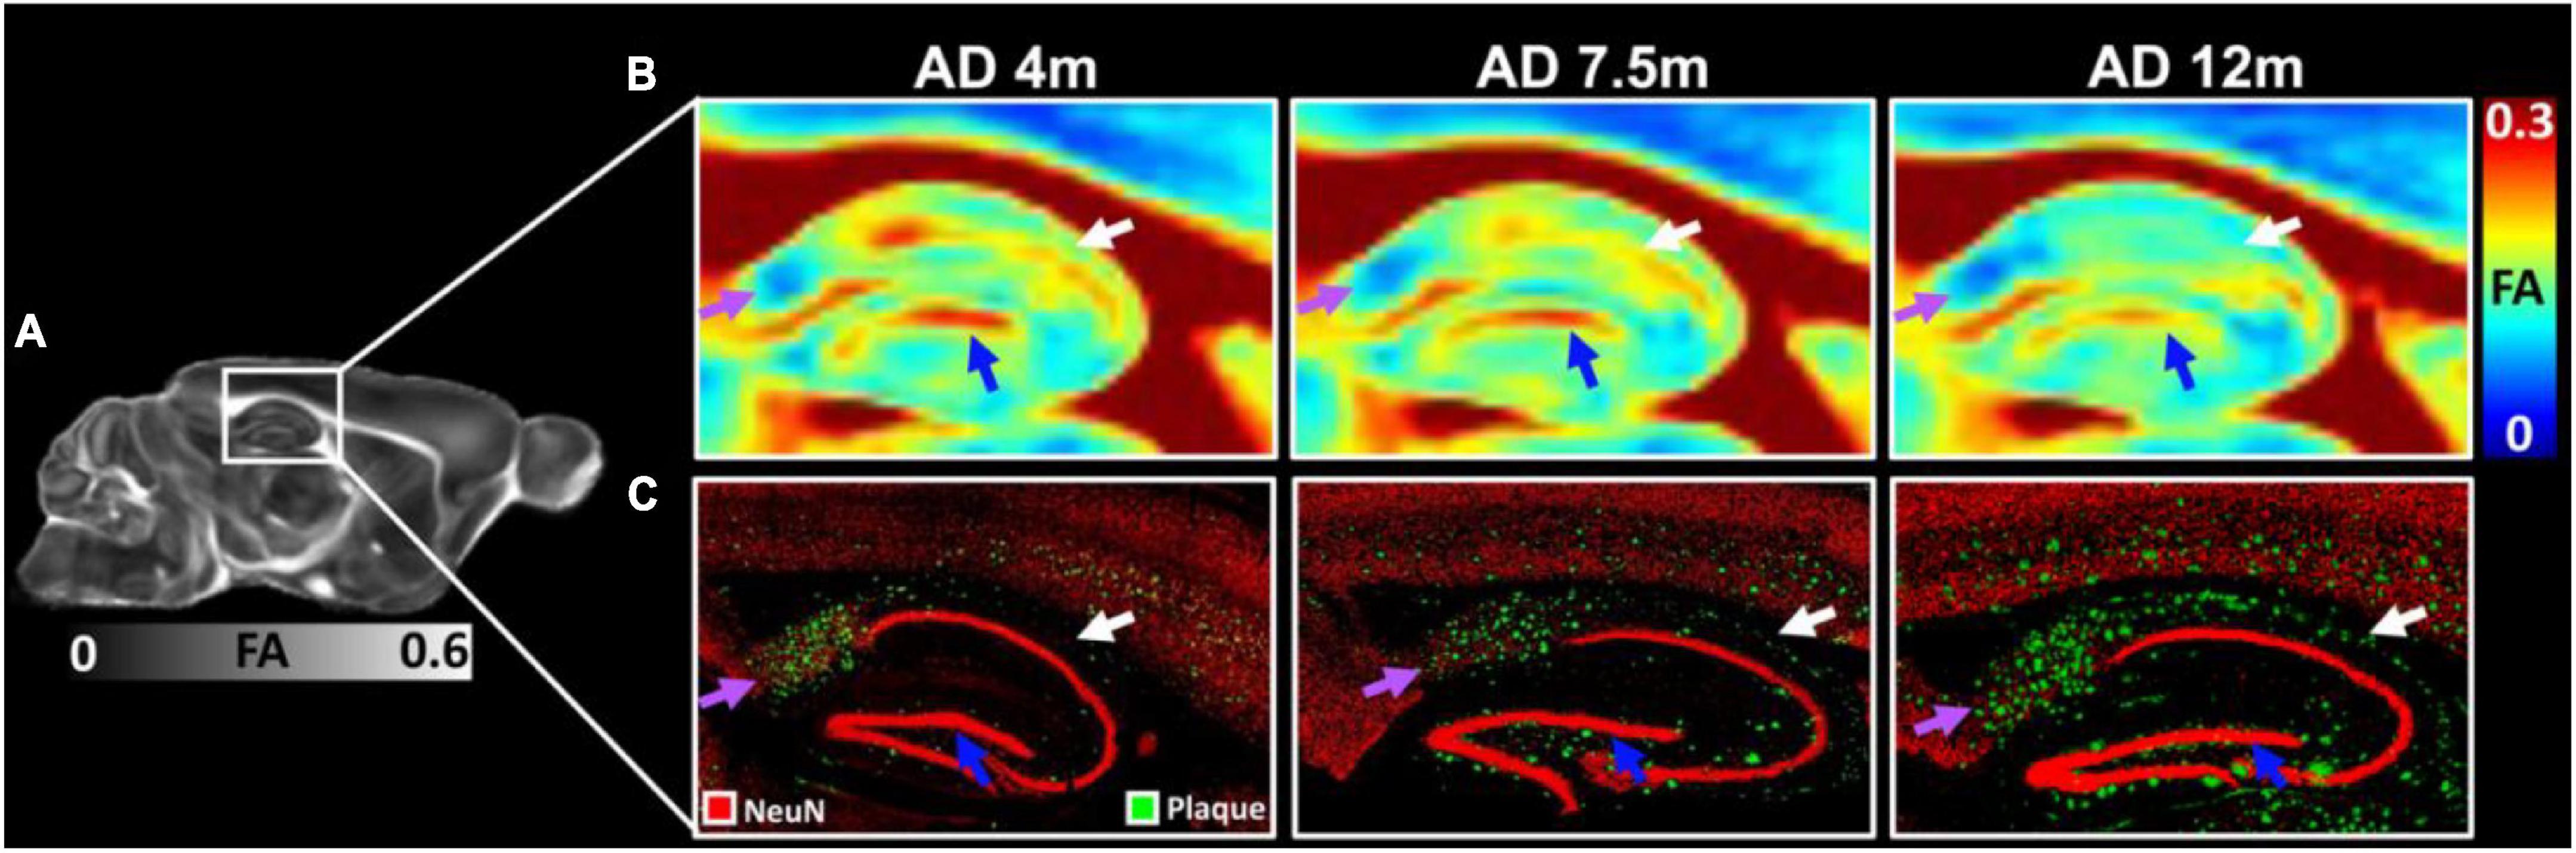
Figure 6. The FA images (A,B) and beta-amyloid staining (C) at different ages of 5xFAD in hippocampus region. The FA values showed strongly age-dependent in the dentate gyrus (DG, blue arrows), the dorsal subiculum (DS, purple arrows), and the CA2 (white arrows). The plaques gradually increased with age in the hippocampus regions (C).
The age-dependent whole-brain microstructure changes in 5xFAD mice were demonstrated in Figure 7. In general, FA exhibited higher sensitivity to the age effect than MD. The cortex regions including the insular cortex (Ins), primary visual cortex monocular area (V1M), secondary visual cortex lateral area (V2L), primary auditory cortex (Au1), and fornix showed significant differences in the FA statistical maps (4 vs. 7.5 months). There were more regions with significant differences between 4 and 12 months, including the primary motor cortex (M1), secondary motor cortex (M2), lateral orbital cortex (LO), secondary auditory cortex dorsal part (AuD), primary visual cortex binocular area (V1B), dorsal intermediate entorhinal cortex (DIEnt), corpus callosum (cc), and striatum (Cpu). Compared to the FA statistical maps, the MD statistical map showed fewer age-dependent alterations (4 vs. 7.5 months, 4 vs. 12 months). MD showed no significant differences in the cortex regions between 5xFAD at 4 and 7.5 months, MD showed significant differences in Cpu and cc between 5xFAD at 4 and 12 months. The fx showed significant differences in both comparisons (4 vs. 7.5 months, 4 vs. 12 months), while ac showed no significant differences among different ages.
FIGURE 7
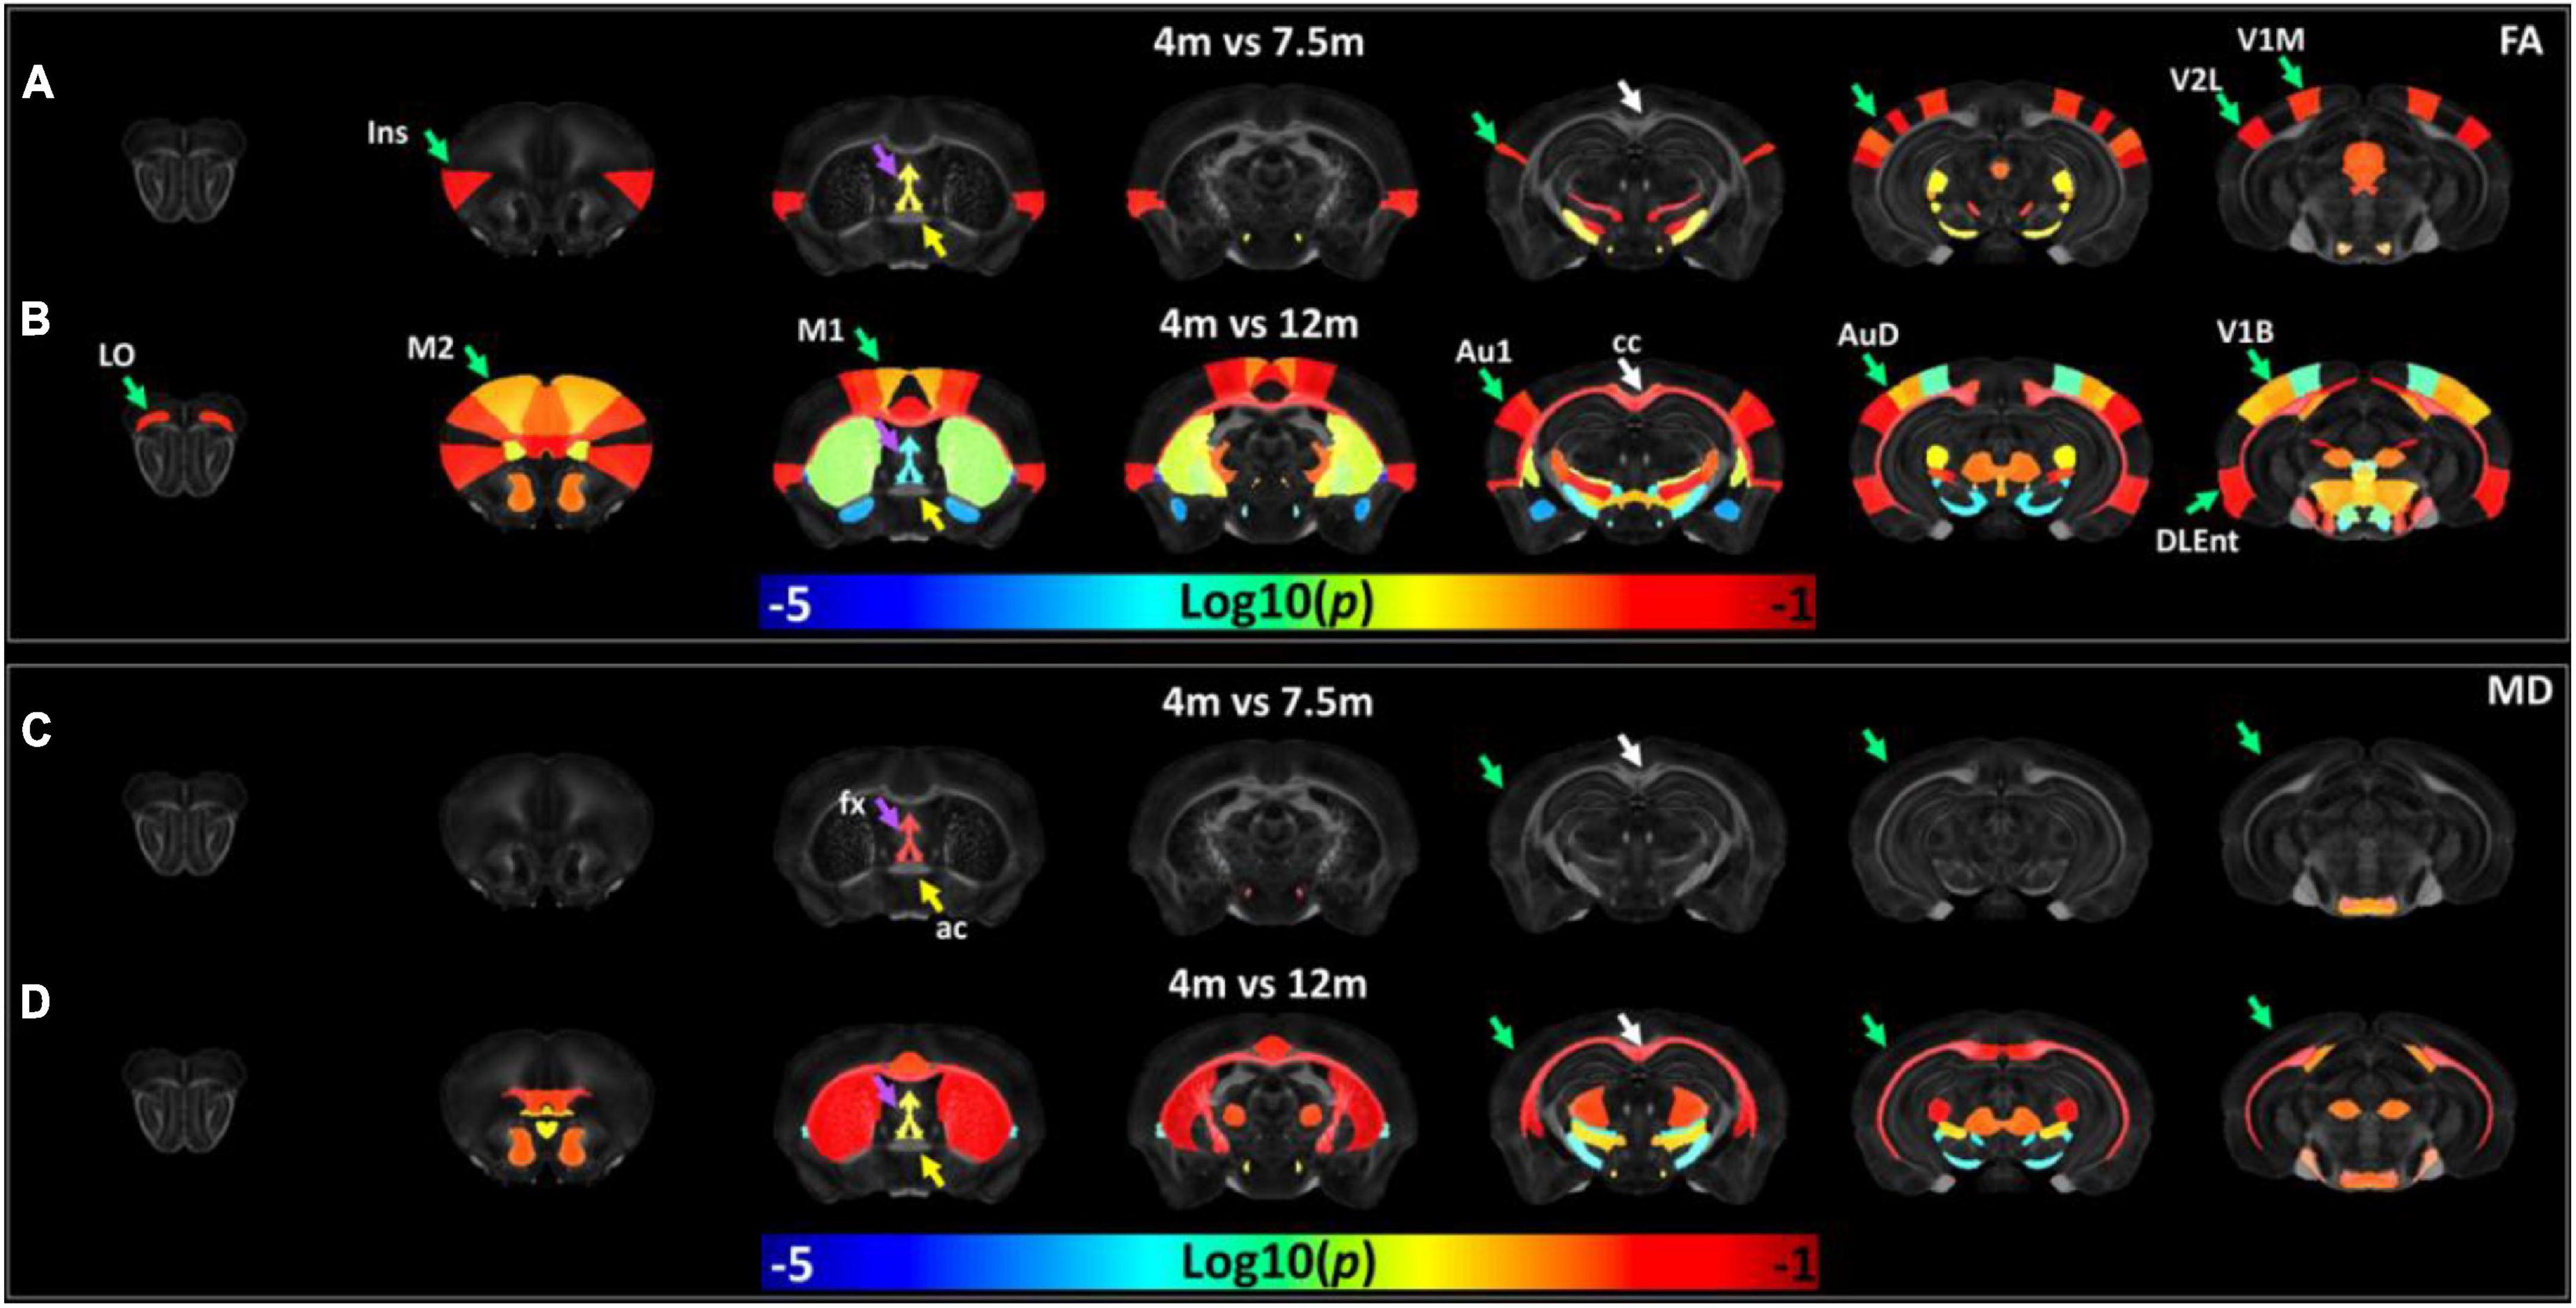
Figure 7. The age-dependent whole-brain microstructure changes in 5xFAD mice. The fractional anisotropy (FA) statistic maps (A,B) exhibited higher sensitivity to the age effect compared to mean diffusivity (MD) (C,D). Ins, insular cortex; V1M, primary visual cortex monocular area; V2L, secondary visual cortex lateral area; fx, fornix; M1, primary motor cortex; M2, secondary motor cortex; LO, lateral orbital cortex; Au1, primary auditory cortex; AuD, secondary auditory cortex dorsal part; V1B, primary visual cortex binocular area; DIEnt, dorsal intermediate entorhinal cortex; cc, corpus callosum; Cpu, striatum.
Discussion
Diffusion tensor imaging is the most widely used dMRI technique to access neurodegenerative and pathophysiology diseases (Kantarci et al., 2010; Teipel et al., 2012). TDTI metrics including fractional anisotropy (FA) and mean diffusivity (MD) have been used as potential imaging biomarkers for the diagnosis of AD (Teipel et al., 2011; Nir et al., 2013). The 5xFAD is one of the most common mouse models to study the beta-amyloid aspects of human AD, its microstructure change with age has not been investigated in detail (Oakley et al., 2006). In this study, we acquired whole-brain high-angular resolution dMRI at 100 μm3 and investigated the age-dependent (4, 7.5, and 12 months) DTI metrics variations in different regions of the brain (166 ROIs).
The beta-amyloid plaques are a hallmark of AD that develop in its early stage (Reger et al., 2008). Non-invasive detection of these plaques would be invaluable for diagnosis and monitoring the treatment. The MRI signal has been enhanced by the MEMRI to visualize the Aβ plaques in transgenic rodent models of AD (Kim et al., 2021). Dudeffant et al. (2017) demonstrated that Gadolinium (Gd)-stained MRI can be used to detect the amyloid plaques in both mouse AD models and human-AD brains. The Aβ plaques could also be detected in mouse AD models using a high-resolution T2-weighted spin-echo sequence (Jack et al., 2005). In this study, high-resolution GRE pulse sequence (50 μm isotropic) was applied to detect the AB plaques. The plaques showed hypointensity in MRI images and increased with age in both cortex and hippocampus regions, which is consistent with several previous findings (Higuchi et al., 2005; Meadowcroft et al., 2009). Distinguishing individual amyloid plaques by high-resolution MRI might provide a noninvasive estimate of plaque burden in transgenic AD mice that might be useful in assessing the efficacy of anti-amyloid therapies (Santin et al., 2016).
Several studies have demonstrated that DTI changes precede the anatomical changes on structural MRI for detecting the brain impairment in different mice models (Zhang et al., 2012; Muller et al., 2020). However, the observed DTI scalars are not consistent across studies, probably due to the dynamic microstructural change in different animal models. For instance, FA in the cortex was reported to increase in 3xTg AD mice (Snow et al., 2017; Manno et al., 2019), while the FA was showed reduced in APP transgenic mice (Muller et al., 2013; Qin et al., 2013). It’s also suggested that DTI studies of AD models with marked neuron loss indicate increased MD, whereas those of a mild neuropathological phenotype without neuron loss tend to report decreased MD (Snow et al., 2017). Compared to MD, we demonstrated the reduction of FA in the cortex region can be detected as early as 4 months between WT and 5xFAD. The cortex area exhibited lower FA values and higher plaque loading in 5xFAD mice with age, which suggests that FA could be a sensitive imaging biomarker to detect the beta-amyloid pathology in the AD mice.
In the current study, we divided the whole brain into 166 different regions, in which more than 40 ROIs belong to isocortex (Wang et al., 2020a). It allows us to investigate the spatial–temporal pattern of the microstructure with the beta-amyloid progression in a well-established AD mouse model. At 7.5 months age, primary visual cortex and secondary visual cortex have already reduced the FA values significantly. At 12 months age, more cortex regions exhibited microstructure alterations, including the primary visual cortex, secondary auditory cortex, primary auditory cortex, dorsolateral entorhinal cortex, and motor cortex. In contrast, fewer cortex regions showed significant MD changes compared to FA values, which suggests that FA could be used to detect the inhomogeneous progression of beta-amyloid deposition at different regions of the cortex area.
Similar to the cortex, amyloid plaque loading is known to be high in hippocampus (Lazarov et al., 2002; Vyas et al., 2020). Reduced FA and increased MD in hippocampus were reported in many of these human studies, probably attributed to increased extracellular space volume and neurodegeneration (Muller et al., 2007; Cherubini et al., 2010; Hong et al., 2013; Nowrangi et al., 2013). It has been reported that only FA showed a significant increase in the hippocampus of APP/PS1 mice, compared to other DTI metrics (Shu et al., 2013). In contrast, decreased FA was detected in the hippocampus in the 12-14-month-old 3xTG AD mice (Snow et al., 2017). In the current study, both FA and MD showed no significant differences for the ROI-based analysis (whole hippocampus). The inconsistency may cause by different mouse models and different ages of mice in different studies. The heterogeneous FA alterations were observed in the subregions of the hippocampus, which may be associated primarily with the plaque deposition and related inflammation (Praet et al., 2018). It has been noted that the hippocampus exhibits complex microstructure and has been demonstrated to show laminar features due to layer-dependent FA values (Wang et al., 2020b). The higher spatial resolution dMRI with sub-region analysis should be performed in future studies to investigate the inhomogeneous microstructure alterations at different layers of the hippocampus (Wu et al., 2020).
Alzheimer’s disease is classically considered a disease of gray matter; however, white matter abnormalities have been widely reported in the brains of incipient and mildly afflicted individuals (Sachdev et al., 2013). Advanced neuroimaging studies demonstrate that patients with preclinical AD have widespread white matter abnormalities at a stage similar to those reported in AD (Marquez and Yassa, 2019; Stone et al., 2021). White matter abnormalities, particularly axonal transport deficiencies, are also important components of AD (Klok et al., 2018). The fornix is a white matter bundle belonging to the medial diencephalon and serves a vital role in memory functions (Copenhaver et al., 2006; Nowrangi and Rosenberg, 2015). Fornix microstructural degradation, as measured by reduced FA, was prominent in both MCI and AD, and may provide evidence of degenerative white matter injury in AD (Lee et al., 2012). The age-dependent microstructural alterations of fx were demonstrated by both FA and MD in 5xFAD mice. In contrast, the ac showed no significant changes among different ages (4 m–12 m), which is consistent with a recent study using the P301L mouse model (Massalimova et al., 2021). Compared to other white matter bundles, fornix may play an important role in AD pathology and can be used as a disease biomarker for pharmacological therapeutics (Badea et al., 2016).
There are several limitations in our study. First, we only performed ROI-based analysis due to the limited sample size, the voxel-based analysis should be performed with larger sample size. Second, compared to in vivo studies, ex vivo MRI affords higher resolution and fewer motion artifacts, it may not accurately represent the tissue microstructures under normal physiological conditions due to the fixation. Third, only female 5xFAD mice were conducted in the study, the sex difference effect is warranted in future studies. In addition, transgenic models have been widely used to study AD risk factors and mechanisms, but the degree of characteristics displayed in comparison with AD in humans is still limited (Elder et al., 2010).
Conclusion
We demonstrated that microstructure alterations are age-dependent using a model of progressive brain amyloidosis. We were able to detect the inhomogeneous FA alterations in different parts of cortex and hippocampus. The spatial–temporal pattern of the microstructure changes in the cortex region with the beta-amyloid progression has been generated. DTI metrics could be used to monitor the progression of beta-amyloid deposition and the efficiency of the anti-AD drugs.
Data availability statement
The original contributions presented in this study are included in the article/Supplementary material, further inquiries can be directed to the corresponding author.
Ethics statement
The animal study was reviewed and approved by Indiana University Institutional Animal Care and Use Committee.
Author contributions
SM and NW: study conception and design and draft manuscript preparation. AT, PL, CI, MJ, and NW: data collection. SM, GL, AO, and NW: analysis and interpretation of results. All authors reviewed the manuscript and approved the submitted version.
Funding
This work was supported by NIH R01NS125020, RF1AG068400, U54AG054345, and K01AG054753.
Acknowledgments
The authors thank Yu-Chien Wu and Erin Jarvis from Roberts Translational Imaging Facility and STARK Neuroscience Research Institute for resource support.
Conflict of interest
The authors declare that the research was conducted in the absence of any commercial or financial relationships that could be construed as a potential conflict of interest.
Publisher’s note
All claims expressed in this article are solely those of the authors and do not necessarily represent those of their affiliated organizations, or those of the publisher, the editors and the reviewers. Any product that may be evaluated in this article, or claim that may be made by its manufacturer, is not guaranteed or endorsed by the publisher.
Supplementary material
The Supplementary Material for this article can be found online at: https://www.frontiersin.org/articles/10.3389/fnins.2022.964654/full#supplementary-material
References
Adlard, P. A., Tran, B. A., Finkelstein, D. I., Desmond, P. M., Johnston, L. A., Bush, A. I., et al. (2014). A review of beta-amyloid neuroimaging in Alzheimer’s disease. Front. Neurosci. 8:327. doi: 10.3389/fnins.2014.00327
Badea, A., Kane, L., Anderson, R. J., Qi, Y., Foster, M., Cofer, G. P., et al. (2016). The fornix provides multiple biomarkers to characterize circuit disruption in a mouse model of Alzheimer’s disease. Neuroimage 142, 498–511 doi: 10.1016/j.neuroimage.2016.08.014
Bloom, G. S. (2014). Amyloid-beta and tau the trigger and bullet in alzheimer disease pathogenesis. JAMA Neurol. 71, 505–508 doi: 10.1001/jamaneurol.2013.5847
Bozzali, M., Falini, A., Franceschi, M., Cercignani, M., Zuffi, M., Scotti, G., et al. (2002). White matter damage in Alzheimer’s disease assessed in vivo using diffusion tensor magnetic resonance imaging. J. Neurol. Neurosurg. Psychiatry 72, 742–746 doi: 10.1136/jnnp.72.6.742
Busciglio, J., Lorenzo, A., Yeh, J., and Yankner, B. A. (1995). Beta-amyloid fibrils induce tau-phosphorylation and loss of microtubule-binding. Neuron 14, 879–888 doi: 10.1016/0896-6273(95)90232-5
Bush, A. I. (2003). The metallobiology of Alzheimer’s disease. Trends Neurosci. 26, 207–214 doi: 10.1016/S0166-2236(03)00067-5
Cherubini, A., Peran, P., Spoletini, I., Di Paola, M., Di Iulio, F., Hagberg, G. E., et al. (2010). Combined volumetry and DTI in subcortical structures of mild cognitive impairment and Alzheimer’s disease patients. J. Alzheimers Dis. 19, 1273–1282 doi: 10.3233/JAD-2010-091186
Copenhaver, B. R., Rabin, L. A., Saykin, A. J., Roth, R. M., Wishart, H. A., Flashman, L. A., et al. (2006). The fornix and mammillary bodies in older adults with Alzheimer’s disease, mild cognitive impairment, and cognitive complaints: A volumetric MRI study. Psychiatry Res. Neuroimaging 147, 93–103 doi: 10.1016/j.pscychresns.2006.01.015
Crater, S., Maharjan, S., Qi, Y., Zhao, Q., Cofer, G., Cook, J. C., et al. (2022). Resolution and b value dependent structural connectome in ex vivo mouse brain. Neuroimage 255:119199 doi: 10.1016/j.neuroimage.2022.119199
Dudeffant, C., Vandesquille, M., Herbert, K., Garin, C. M., Alves, S., Blanchard, V., et al. (2017). Contrast-enhanced MR microscopy of amyloid plaques in five mouse models of amyloidosis and in human Alzheimer’s disease brains. Sci. Rep. 7:4955 doi: 10.1038/s41598-017-05285-1
Elder, G. A., Sosa, M. A. G., and De Gasperi, R. (2010). Transgenic mouse models of Alzheimer’s disease. Mount Sinai J. Med. 77, 69–81 doi: 10.1002/msj.20159
Forner, S., Kawauchi, S., Balderrama-Gutierrez, G., Kramar, E. A., Matheos, D. P., Phan, J., et al. (2021). Systematic phenotyping and characterization of the 5xFAD mouse model of Alzheimer’s disease. Sci. Data 8:270 doi: 10.1038/s41597-021-01054-y
Girard, S. D., Baranger, K., Gauthier, C., Jacquet, M., Bernard, A., Escoffier, G., et al. (2013). Evidence for early cognitive impairment related to frontal cortex in the 5xFAD mouse model of Alzheimer’s disease. J. Alzheimers Dis. 33, 781–796 doi: 10.3233/JAD-2012-120982
Goedert, M., and Spillantini, M. G. (2006). A century of Alzheimer’s disease. Science 314, 777–781 doi: 10.1126/science.1132814
Harrison, J. R., Bhatia, S., Tan, Z. X., Mirza-Davies, A., Benkert, H., Tax, C. M. W., et al. (2020). Imaging Alzheimer’s genetic risk using diffusion MRI: A systematic review. Neuroimage Clin. 27:102359 doi: 10.1016/j.nicl.2020.102359
Higuchi, M., Iwata, N., Matsuba, Y., Sato, K., Sasamoto, K., and Saido, T. C. (2005). 19F and 1H MRI detection of amyloid beta plaques in vivo. Nat. Neurosci. 8, 527–533 doi: 10.1038/nn1422
Hong, Y. J., Yoon, B., Lim, S. C., Shim, Y. S., Kim, J. Y., Ahn, K. J., et al. (2013). Microstructural changes in the hippocampus and posterior cingulate in mild cognitive impairment and Alzheimer’s disease: A diffusion tensor imaging study. Neurol. Sci. 34, 1215–1221 doi: 10.1007/s10072-012-1225-4
Igarashi, H., Ueki, S., Kitaura, H., Kera, T., Ohno, K., Ohkubo, M., et al. (2020). Longitudinal GluCEST MRI changes and cerebral blood flow in 5xFAD mice. Contrast Media Mol. Imaging 2020:8831936 doi: 10.1155/2020/8831936
Jack, C. R. Jr., Wengenack, T. M., Reyes, D. A., Garwood, M., Curran, G. L., et al. (2005). In vivo magnetic resonance microimaging of individual amyloid plaques in Alzheimer’s transgenic mice. J. Neurosci. 25, 10041–10048 doi: 10.1523/JNEUROSCI.2588-05.2005
Jacobs, H. I., Van Boxtel, M. P., Gronenschild, E. H., Uylings, H. B., Jolles, J., and Verhey, F. R. (2013). Decreased gray matter diffusivity: A potential early Alzheimer’s disease biomarker? Alzheimers Dement. 9, 93–97 doi: 10.1016/j.jalz.2011.11.004
Jankowsky, J. L., and Zheng, H. (2017). Practical considerations for choosing a mouse model of Alzheimer’s disease. Mol. Neurodegener. 12:89 doi: 10.1186/s13024-017-0231-7
Jullienne, A., Trinh, M. V., and Obenaus, A. (2022). Neuroimaging of Mouse Models of Alzheimer’s Disease. Biomedicines 10:305. doi: 10.3390/biomedicines10020305
Kantarci, K., Avula, R., Senjem, M. L., Samikoglu, A. R., Zhang, B., Weigand, S. D., et al. (2010). Dementia with lewy bodies and Alzheimer disease neurodegenerative patterns characterized by DTI. Neurology 74, 1814–1821 doi: 10.1212/WNL.0b013e3181e0f7cf
Kantarci, K., Petersen, R. C., Boeve, B. F., Knopman, D. S., Weigand, S. D., O’brien, P. C., et al. (2005). DWI predicts future progression to Alzheimer disease in amnestic mild cognitive impairment. Neurology 64, 902–904 doi: 10.1212/01.WNL.0000153076.46126.E9
Kesler, S. R., Acton, P., Rao, V., and Ray, W. J. (2018). Functional and structural connectome properties in the 5xFAD transgenic mouse model of Alzheimer’s disease. Netw. Neurosci. 2, 241–258 doi: 10.1162/netn_a_00048
Kim, E., Di Censo, D., Baraldo, M., Simmons, C., Rosa, I., Randall, K., et al. (2021). In vivo multi-parametric manganese-enhanced MRI for detecting amyloid plaques in rodent models of Alzheimer’s disease. Sci. Rep. 11:12419 doi: 10.1038/s41598-021-91899-5
Kitazawa, M., Medeiros, R., and Laferla, F. M. (2012). Transgenic mouse models of alzheimer disease: Developing a better model as a tool for therapeutic interventions. Curr. Pharm. Des. 18, 1131–1147 doi: 10.2174/138161212799315786
Klok, M. D., Bugiani, M., De Vries, S. I., Gerritsen, W., Breur, M., Van Der Sluis, S., et al. (2018). Axonal abnormalities in vanishing white matter. Ann. Clin. Transl. Neurol. 5, 429–444 doi: 10.1002/acn3.540
Koss, D. J., Jones, G., Cranston, A., Gardner, H., Kanaan, N. M., and Platt, B. (2016). Soluble pre-fibrillar tau and beta-amyloid species emerge in early human Alzheimer’s disease and track disease progression and cognitive decline. Acta Neuropathol. 132, 875–895 doi: 10.1007/s00401-016-1632-3
Lazarov, O., Lee, M., Peterson, D. A., and Sisodia, S. S. (2002). Evidence that synaptically released beta-amyloid accumulates as extracellular deposits in the hippocampus of transgenic mice. J. Neurosci. 22, 9785–9793 doi: 10.1523/JNEUROSCI.22-22-09785.2002
Lee, D. Y., Fletcher, E., Carmichael, O. T., Singh, B., Mungas, D., Reed, B., et al. (2012). Sub-regional hippocampal injury is associated with fornix degeneration in Alzheimer’s disease. Front. Aging Neurosci. 4:1 doi: 10.3389/fnagi.2012.00001
Manno, F. A. M., Isla, A. G., Manno, S. H. C., Ahmed, I., Cheng, S. H., Barrios, F. A., et al. (2019). Early stage alterations in white matter and decreased functional interhemispheric hippocampal connectivity in the 3xTg mouse model of Alzheimer’s disease. Front. Aging Neurosci. 11:39 doi: 10.3389/fnagi.2019.00039
Marquez, F., and Yassa, M. A. (2019). Neuroimaging biomarkers for Alzheimer’s disease. Mol. Neurodegener. 14:21 doi: 10.1186/s13024-019-0325-5
Massalimova, A., Ni, R. Q., Nitsch, R. M., Reisert, M., Von Elverfeldt, D., and Klohs, J. (2021). Diffusion tensor imaging reveals whole-brain microstructural changes in the P301L mouse model of tauopathy. Neurodegener. Dis. 20, 173–184 doi: 10.1159/000515754
Meadowcroft, M. D., Connor, J. R., Smith, M. B., and Yang, Q. X. (2009). MRI and histological analysis of beta-amyloid plaques in both human Alzheimer’s disease and APP/PS1 transgenic mice. J. Magnetic Resonance Imaging 29, 997–1007 doi: 10.1002/jmri.21731
Mielke, M. M., Kozauer, N. A., Chan, K. C. G., George, M., Toroney, J., Zerrate, M., et al. (2009). Regionally-specific diffusion tensor imaging in mild cognitive impairment and Alzheimer’s disease. Neuroimage 46, 47–55 doi: 10.1016/j.neuroimage.2009.01.054
Mlynarik, V., Cacquevel, M., Sun-Reimer, L., Janssens, S., Cudalbu, C., Lei, H. X., et al. (2012). Proton and phosphorus magnetic resonance spectroscopy of a mouse model of Alzheimer’s disease. J. Alzheimers Dis. 31, S87–S99 doi: 10.3233/JAD-2012-112072
Muller, H. P., Kassubek, J., Vernikouskaya, I., Ludolph, A. C., Stiller, D., and Rasche, V. (2013). Diffusion tensor magnetic resonance imaging of the brain in app transgenic mice: A cohort study. PLos One 8:e67630. doi: 10.1371/journal.pone.0067630
Muller, H. P., Roselli, F., Rasche, V., and Kassubek, J. (2020). Diffusion tensor imaging-based studies at the group-level applied to animal models of neurodegenerative diseases. Front. Neurosci. 14:734. doi: 10.3389/fnins.2020.00734
Muller, M. J., Greverus, D., Weibrich, C., Dellani, P. R., Scheurich, A., Stoeter, P., et al. (2007). Diagnostic utility of hippocampal size and mean diffusivity in amnestic MCI. Neurobiol. Aging 28, 398–403 doi: 10.1016/j.neurobiolaging.2006.01.009
Nir, T. M., Jahanshad, N., Villalon-Reina, J. E., Toga, A. W., Jack, C. R., Weiner, M. W., et al. (2013). Effectiveness of regional DTI measures in distinguishing Alzheimer’s disease, MCI, and normal aging. Neuroimage Clin. 3, 180–195 doi: 10.1016/j.nicl.2013.07.006
Nowrangi, M. A., Lyketsos, C. G., Leoutsakos, J. M. S., Oishi, K., Albert, M., Mori, S., et al. (2013). Longitudinal, region-specific course of diffusion tensor imaging measures in mild cognitive impairment and Alzheimer’s disease. Alzheimers Dement. 9, 519–528 doi: 10.1016/j.jalz.2012.05.2186
Nowrangi, M. A., and Rosenberg, P. B. (2015). The fornix in mild cognitive impairment and Alzheimer’s disease. Front. Aging Neurosci. 7:1. doi: 10.3389/fnagi.2015.00001
Oakley, H., Cole, S. L., Logan, S., Maus, E., Shao, P., Craft, J., et al. (2006). Intraneuronal beta-amyloid aggregates, neurodegeneration, and neuron loss in transgenic mice with five familial Alzheimer’s disease mutations: Potential factors in amyloid plaque formation. J. Neurosci. 26, 10129–10140 doi: 10.1523/JNEUROSCI.1202-06.2006
Oblak, A. L., Lin, P. B., Kotredes, K. P., Pandey, R. S., Garceau, D., Williams, H. M., et al. (2021). Comprehensive evaluation of the 5xFAD mouse model for preclinical testing applications: A MODEL-AD study. Front. Aging Neurosci. 13:713726. doi: 10.3389/fnagi.2021.713726
Praet, J., Manyakov, N. V., Muchene, L., Mai, Z. H., Terzopoulos, V., De Backer, S., et al. (2018). Diffusion kurtosis imaging allows the early detection and longitudinal follow-up of amyloid-beta-induced pathology. Alzheimers Res. Therapy 10:1 doi: 10.1186/s13195-017-0329-8
Qin, Y. Y., Li, M. W., Zhang, S., Zhang, Y., Zhao, L. Y., Lei, H., et al. (2013). In vivo quantitative whole-brain diffusion tensor imaging analysis of APP/PS1 transgenic mice using voxel-based and atlas-based methods. Neuroradiology 55, 1027–1038 doi: 10.1007/s00234-013-1195-0
Reger, M. A., Watson, G. S., Green, P. S., Wilkinson, C. W., Baker, L. D., Cholerton, B., et al. (2008). Intranasal insulin improves cognition and modulates beta-amyloid in early AD. Neurology 70, 440–448 doi: 10.1212/01.WNL.0000265401.62434.36
Rose, S. E., Chen, F., Chalk, J. B., Zelaya, F. O., Strugnell, W. E., Benson, M., et al. (2000). Loss of connectivity in Alzheimer’s disease: An evaluation of white matter tract integrity with colour coded MR diffusion tensor imaging. J. Neurol. Neurosurg. Psychiatry 69, 528–530 doi: 10.1136/jnnp.69.4.528
Sachdev, P. S., Zhuang, L., Braidy, N., and Wen, W. (2013). Is Alzheimer’s a disease of the white matter? Curr. Opin. Psychiatry 26, 244–251 doi: 10.1097/YCO.0b013e32835ed6e8
Santin, M. D., Vandenberghe, M. E., Herardi, A. S., Pradier, L., Cohen, C., Debeir, T., et al. (2016). In vivo detection of amyloid plaques by gadolinium-stained MRI can be used to demonstrate the efficacy of an anti-amyloid immunotherapy. Front. Aging Neurosci. 8:55. doi: 10.3389/fnagi.2016.00055
Sasaguri, H., Nilsson, P., Hashimoto, S., Nagata, K., Saito, T., De Strooper, B., et al. (2017). APP mouse models for Alzheimer’s disease preclinical studies. Embo J. 36, 2473–2487 doi: 10.15252/embj.201797397
Shu, X. G., Qin, Y. Y., Zhang, S., Jiang, J. J., Zhang, Y., Zhao, L. Y., et al. (2013). Voxel-based diffusion tensor imaging of an APP/PS1 mouse model of Alzheimer’s disease. Mol. Neurobiol. 48, 78–83 doi: 10.1007/s12035-013-8418-6
Snow, W. M., Dale, R., O’brien-Moran, Z., Buist, R., Peirson, D., Martin, M., et al. (2017). In vivo detection of gray matter neuropathology in the 3xTg mouse model of alzheimer’s disease with diffusion tensor imaging. J. Alzheimers Dis. 58, 841–853 doi: 10.3233/JAD-170136
Stebbins, G. T., and Murphy, C. M. (2009). Diffusion tensor imaging in Alzheimer’s disease and mild cognitive impairment. Behav. Neurol. 21, 39–49 doi: 10.1155/2009/915041
Stone, D. B., Ryman, S. G., Hartman, A. P., Wertz, C. J., Vakhtin, A. A., and Initi, A. S. D. N. (2021). Specific white matter tracts and diffusion properties predict conversion from mild cognitive impairment to Alzheimer’s disease. Front. Aging Neurosci. 13:711579. doi: 10.3389/fnagi.2021.711579
Takahashi, R. H., Capetillo-Zarate, E., Lin, M. T., Milner, T. A., and Gouras, G. K. (2010). Co-occurrence of Alzheimer’s disease beta-amyloid and tau pathologies at synapses. Neurobiol. Aging 31, 1145–1152 doi: 10.1016/j.neurobiolaging.2008.07.021
Teipel, S. J., Meindl, T., Grinberg, L., Grothe, M., Cantero, J. L., Reiser, M. F., et al. (2011). The cholinergic system in mild cognitive impairment and Alzheimer’s disease: An in vivo MRI and DTI study. Hum. Brain Mapp. 32, 1349–1362 doi: 10.1002/hbm.21111
Teipel, S. J., Wegrzyn, M., Meindl, T., Frisoni, G., Bokde, A. L. W., Fellgiebel, A., et al. (2012). Anatomical MRI and DTI in the diagnosis of Alzheimer’s disease: A european multicenter study. J. Alzheimers Dis. 31, S33–S47 doi: 10.3233/JAD-2012-112118
Thal, D. R., Attems, J., and Ewers, M. (2014). Spreading of amyloid, tau, and microvascular pathology in Alzheimer’s disease: Findings from neuropathological and neuroimaging studies. J. Alzheimers Dis. 42, S421–S429. doi: 10.3233/JAD-141461
Torso, M., Bozzali, M., Zamboni, G., Jenkinson, M., Chance, S. A., and Neuroimage, A. D. (2021). Detection of Alzheimer’s disease using cortical diffusion tensor imaging. Hum. Brain Mapp. 42, 967–977 doi: 10.1002/hbm.25271
Tsai, A. P., Lin, P. B.-C., Dong, C., Moutinho, M., Casali, B. T., Liu, Y., et al. (2021). INPP5D expression is associated with risk for Alzheimer’s disease and induced by plaque-associated microglia. Neurobiol. Dis. 153:105303 doi: 10.1016/j.nbd.2021.105303
Veale, T., Malone, I. B., Poole, T., Parker, T. D., Slattery, C. F., Paterson, R. W., et al. (2021). Loss and dispersion of superficial white matter in Alzheimer’s disease: A diffusion MRI study. Brain Commun. 3:fcab272 doi: 10.1093/braincomms/fcab272
Vyas, Y., Montgomery, J. M., and Cheyne, J. E. (2020). Hippocampal deficits in amyloid-beta-related rodent models of Alzheimer’s disease. Front. Neurosci. 14:266. doi: 10.3389/fnins.2020.00266
Wang, L., Benzinger, T. L., Su, Y., Christensen, J., Friedrichsen, K., Aldea, P., et al. (2016). Evaluation of tau imaging in staging Alzheimer disease and revealing interactions between beta-amyloid and tauopathy. JAMA Neurol. 73, 1070–1077. doi: 10.1001/jamaneurol.2016.2078
Wang, N., Anderson, R. J., Ashbrook, D. G., Gopalakrishnan, V., Park, Y., Priebe, C. E., et al. (2020a). Variability and heritability of mouse brain structure: Microscopic MRI atlases and connectomes for diverse strains. Neuroimage 222:117274 doi: 10.1016/j.neuroimage.2020.117274
Wang, N., White, L. E., Qi, Y., Cofer, G., and Johnson, G. A. (2020b). Cytoarchitecture of the mouse brain by high resolution diffusion magnetic resonance imaging. Neuroimage 216:116876 doi: 10.1016/j.neuroimage.2020.116876
Wang, N., Anderson, R. J., Badea, A., Cofer, G., Dibb, R., Qi, Y., et al. (2018a). Whole mouse brain structural connectomics using magnetic resonance histology. Brain Struct. Funct. 223, 4323–4335 doi: 10.1007/s00429-018-1750-x
Wang, N., Cofer, G., Anderson, R. J., Qi, Y., Liu, C. L., and Johnson, G. A. (2018b). Accelerating quantitative susceptibility imaging acquisition using compressed sensing. Phys. Med. Biol. 63:245002. doi: 10.1088/1361-6560/aaf15d
Wang, N., Zhuang, J., Wei, H. J., Dibb, R., Qi, Y., and Liu, C. L. (2019b). Probing demyelination and remyelination of the cuprizone mouse model using multimodality MRI. J. Magnetic Resonance Imaging 50, 1852–1865 doi: 10.1002/jmri.26758
Wang, N., Zhang, J. Y., Cofer, G., Qi, Y., Anderson, R. J., White, L. E., et al. (2019a). Neurite orientation dispersion and density imaging of mouse brain microstructure. Brain Struct. Funct. 224, 1797–1813 doi: 10.1007/s00429-019-01877-x
Wu, D., Lei, J., Xie, H., Dong, J., and Burd, I. (2020). Diffusion MRI revealed altered inter-hippocampal projections in the mouse brain after intrauterine inflammation. Brain Imaging Behav. 14, 383–395 doi: 10.1007/s11682-019-00246-w
Yeh, F. C., Wedeen, V. J., and Tseng, W. Y. I. (2010). Generalized q-Sampling imaging. Ieee Trans. Med. Imaging 29, 1626–1635 doi: 10.1109/TMI.2010.2045126
Keywords: Alzheimer’s disease, 5xFAD, MRI, DTI, diffusion MRI (dMRI)
Citation: Maharjan S, Tsai AP, Lin PB, Ingraham C, Jewett MR, Landreth GE, Oblak AL and Wang N (2022) Age-dependent microstructure alterations in 5xFAD mice by high-resolution diffusion tensor imaging. Front. Neurosci. 16:964654. doi: 10.3389/fnins.2022.964654
Received: 08 June 2022; Accepted: 18 July 2022;
Published: 17 August 2022.
Edited by:
Jie Wang, Wuhan Institute of Physics and Mathematics (CAS), ChinaCopyright © 2022 Maharjan, Tsai, Lin, Ingraham, Jewett, Landreth, Oblak and Wang. This is an open-access article distributed under the terms of the Creative Commons Attribution License (CC BY). The use, distribution or reproduction in other forums is permitted, provided the original author(s) and the copyright owner(s) are credited and that the original publication in this journal is cited, in accordance with accepted academic practice. No use, distribution or reproduction is permitted which does not comply with these terms.
*Correspondence: Nian Wang, nianwang@iu.edu