The cytochrome c gene proximal enhancer drives activity-dependent reporter gene expression in hippocampal neurons
- The Neurosciences Institute, 10640 John Jay Hopkins Drive, San Diego, CA, USA
The proximal enhancer of the cytochrome c gene (Cycs) contains binding sites for both cAMP response element binding proteins (CREB) and Nuclear Respiratory Factor 1 (NRF1). To investigate how neuronal activity regulates this enhancer region, a lentivirus was constructed in which a short-lived green fluorescent protein (GFP) was placed under the transcriptional control of the Cycs proximal enhancer linked to a synthetic core promoter. Primary hippocampal neurons were infected, and the synaptic strengths of individual neurons were measured by whole-cell patch clamping. On average the amplitude of miniature postsynaptic currents (mEPSCs) was higher in brighter GFP+ neurons, while the frequency of mEPSCs was not significantly different. Increasing neural activity by applying a GABAA receptor antagonist increased GFP expression in most neurons, which persisted after homeostatic synaptic scaling as evidenced by a decrease in the amplitude and frequency of mEPSCs. Removing the CREB binding sites revealed that calcium influx through L-type channels and NMDA receptors, and ERK1/2 activation played a role in NRF1-mediated transcription. CREB and NRF1, therefore, combine to regulate transcription of Cycs in response to changing neural activity.
Introduction
Transcriptional responses to strong activation of glutamatergic synapses are triggered by calcium influx through NMDA receptors and calcium channels (Bading et al., 1993). Calcium activates CAM kinases, and calcineurin, which ultimately leads to activation of cAMP response element (CRE) binding proteins via ERK and TORC pathways (Wu et al., 2001; Kovacs et al., 2007). Many immediate early genes that are thought to drive synaptic remodeling are regulated by CREB, highlighting the importance of this transcription factor in the nervous system (Flavell and Greenberg, 2008). Most of the energy used by neurons to maintain excitability and power synaptic transmission comes from oxidative phosphorylation taking place in mitochondria (Kann and Kovacs, 2007). The promoter regions of a number of nuclear-encoded mitochondrial genes have CREB binding sites (Zhang et al., 2005; van Waveren and Moraes, 2008) indicating that energy metabolism and neural activity may be coordinated via this transcription factor. A second important link between neuronal activity and mitochondrial function is forged by Nuclear Respiratory Factor 1 (NRF1), which has recently been shown to regulate the transcription of NMDA receptor subunit genes (Dhar and Wong-Riley, 2009). NRF1 was originally discovered from an analysis of the promoter of the Cycs gene, which encodes somatic cytochrome c the soluble electron donor to Complex IV (cytochrome c oxidase) (Evans and Scarpulla, 1989). Subsequent work has shown that NRF1 regulates all of the nuclear-encoded components of Complex IV (Dhar et al., 2008), and other genes critical for mitochondrial function (Scarpulla, 2008).
The NRF1 binding site and two CREs are located within 300 base pairs of the start site of transcription of the Cycs gene (Evans and Scarpulla, 1989). Activity of a reporter gene under the transcriptional control of the Cycs promoter increased following serum stimulation of starved NIH 3T3 cells, and both NRF1 and CREB binding sites were required for this response (Herzig et al., 2000). We investigated whether a sequence encompassing these transcription factor binding sites would report on the activity level of individual neurons using GFP as a reporter gene. Live neuron imaging revealed a connection between reporter gene expression and synaptic strength. A marked but variable increase in Cycs proximal enhancer-dependent reporter gene expression occurred in response to bicuculline-induced elevated synaptic activity, which persisted after homeostatic reduction in mean excitatory postsynaptic current (Turrigiano et al., 1998). Both the CRE and NRF1 binding sites were required for full activity, and like CREB-mediated responses to neural activity, NRF1-mediated activity involved calcium influx via both NMDA receptors and L type Ca channels, and ERK1/2 activity.
Methods
Reporter Constructs
A 235 bp fragment extending from −73 to −308 with respect to the transcription start site of the rat Cycs gene, and encompassing the NRF1 and CRE sites, was amplified from genomic DNA using Phusion® DNA polymerase (72°C anneal and extend) using the following primers: forward primer 5′ GGAATGCATGCTACTCGCTCCTCCTCCCCAACACGCAGG 3′, reverse primer 5′ GGAAGATCTGACGTGCGGCAGCGCCGGGCACTGCGCCG 3′. Constructs with mutated binding sites for CRE or NRF1 or both were kindly provided by Dr. Richard Scarpulla (Northwestern University Medical School). The enhancer sequence was inserted into FLX1.8GFPpd2HS4, a feline immunodeficiency virus (FIV)-based lentiviral vector in which the upstream U3 has been replaced with the CMV immediate early gene promoter, and the downstream U3 has been replaced with the core sequence of the chicken beta globin DNA hypersensitive site 4 (HS4) (Chung et al., 1997). The Cycs enhancer fragment was placed immediately upstream of a 51 base pair synthetic core promoter comprising an optimized TATA box, and initiator regulator element (Colgan and Manley, 1995). Fos (564 bp; Wang and Howells, 1994) and Arc (104 bp; Kawashima et al., 2009) enhancer sequences were amplified from rat genomic DNA using the following primers: Fos forward primer 5′ GATATGCATCAGAGACTTGGAGCCTTTAGGGCTGCGTGCCTG 3′, 3′, Fos reverse primer 5′ CGTAGATCTGAAGCGCTTGAATGGCTTACTACGTCATGAGCGG 3′; Arc forward primer 5′ GACGTCGACGAAGTCTTTCCGGCCATGTCTGGAAGGGGTACC 3′, Arc reverse primer 5′ GACCTCGAGAACCTTAAGGCTCCTGCAAGGTTCTGGCGGGGGCC 3′. Lentiviruses were generated as previously described (Edelman et al., 2011) by co-transfecting HEK293 cells with helper plasmids encoding the VSV-G glycoprotein and FIV gagpol genes. Virus-containing culture supernatant was concentrated approximately 50-fold by ultrafiltration (Vivaspin 20 polyethersulfone ultrafiltration units). Virus titer was estimated by infecting rat B104 cells, and measuring GFP expression by flow cytometry. The volume of concentrated supernatant added to primary neurons equaled the amount that resulted in 50 percent infection of B104 cells. The same amount of virus was added to each hippocampal neuron culture.
Cell Culture and Image Analysis
Animal procedures were approved by The Neurosciences Research Foundation's Institutional Animal Care and Use Committee, and were performed in strict accordance with the US Public Health Service (PHS) Policy for Humane Care and Use of Laboratory Animals (PHS Animal Welfare Assurance no. A4558–01).
Tissue culture reagents were purchased from Life Technologies and inhibitors were obtained from EMD Biosciences or Tocris Bioscience. Primary hippocampal neurons were prepared from E18 rat embryos by standard methods and grown on a poly-D-lysine/laminin substratum (Edelman et al., 2011). Cells were grown in 35 mm glass-bottomed dishes (MatTek Corporation) for fluorescence microscopy of live neurons, in 6-well dishes for western blot analysis or on 12 mm coverslips for electrophysiology. Plating densities on glass were 7 × 10⁴ cells per cm2, and on plastic 1.9 × 10⁴ cells per cm2. After seven days in vitro (div) cultures were treated with cytosine arabinoside (0.5 μM) for 48 h to suppress glial cell proliferation. Fluorescence images of live cells were acquired at 630× magnification using a Leica DMI6000B inverted fluorescence microscope connected to a CCD camera and Lambda DG-4 light source. Microscope functions were controlled by the SlideBook™ v5.0 software package (Intelligent Imaging Innovations). During live-cell imaging cultures were placed in a stage top micro-incubator as previously described (Edelman et al., 2011). In a given experiment all of the images at all time points were acquired at the same exposure time, and normalized to the same background. To quantify GFP fluorescence, the image analysis tools in the SlideBook™ v5.0 software package were used. Masks of individual neurons were generated manually and the mean fluorescence intensity of pixels within each mask was computed. Data were plotted as box and whisker plots and the paired sample Wilcoxon signed rank test was used to evaluate statistical significance (SOFA statistics package). Images and histograms were exported to Canvas v12 (ACD Systems).
Electrophysiology
Individual coverslips were transferred one at a time to a submerged chamber mounted on a fixed-stage upright microscope (Leica DMLFSA). They were continuously perfused with warmed (30.5°C), oxygenated artificial CSF flowing (ACSF) at a rate of 2–3 ml/min containing 126 mM NaCl, 3 mM KCl, 1 mM NaH2PO4, 25 mM NaHCO3, 1 mM MgCl2, 2.5 mM CaCl2, and 25 mM dextrose. Individual cells were identified at 400× magnification using infrared DIC optics and an infrared-sensitive camera (Dage-MTI). Pairs of GFP expressing cells were identified by fluorescence through a FITC filter. For a given pair of cells, cells were assigned as bright or dim based on their relative intensity in the field of view. Whole-cell somatic recordings were obtained with pulled glass micropipettes (somatic 4–5 MΩ). The standard intracellular solution contained 110 mM K-gluconate, 10 mM KCl, 1 mM HEPES, 10 mM (Na)phosphocreatine, 4 mM (Mg)ATP, 0.3 mM (Na)GTP, and 0.1% w/v biocytin, adjusted with KOH to pH 7.4 and with sucrose to 292 mOsm. Miniature excitatory postsynaptic potentials were isolated by adding 0.1 μM tetrodotoxin (TTX) and 20 μM bicuculline to the ACSF. Voltage clamp recordings were accepted if input resistances were >100 MΩ, series resistances were <20 MΩ, and membrane potentials were more negative than −60 mV. All electrophysiological recordings were made using a Multiclamp 700 A amplifier (Molecular Devices). Signals were filtered at 4 kHz and digitized at 10 kHz using a NIDAQ board controlled via custom made acquisition software in MatLab. All data analyses were performed using custom software written in MatLab. Plots were created using GraphPad Prism 4.0. Numerical averages are presented as mean ± SEM. Between group statistical significance was calculated using a One-Way ANOVA followed by Tukey's multiple comparison or using the Mann–Whitney test.
Immunocytochemistry and Western Blot Analysis
For immunostaining and visualizing filled cells, cultures were fixed for 20 min at room temperature in 4% paraformaldehyde in Tris-buffered saline (pH 7.4), and blocked for 2 h at room temperature with Tris-buffered saline (pH 7.4) containing 5% goat serum and 0.05% Tween®-20. Cells were incubated overnight at 4°C with anti-beta tubulin III mAb (1:500, Sigma), and antibody staining was visualized with an Alexa Fluor® 568 conjugated secondary antibody (Life Technologies). Filled cells were visualized with Alexa Fluor® 594 conjugated to streptavidin (Life Technologies). For western blotting, cells were harvested in RIPA buffer containing protease and phosphatase inhibitors (Sigma-Aldrich). Lysates were separated on NuPage® Bis-Tris 4–20% gradient gels (Life Technologies), and transferred to PVDF membrane (Biorad). Membranes were blocked in Tris-buffered saline (pH 7.4) containing 5% non-fat dried milk and 0.05% Tween®-20, and probed with either anti-GFP mAb (1:1000, Clontech Laboratories), or anti-phospho ERK1/2 mAb (Thr202/Tyr204 and Thr185/Tyr187, 1: 1000, Cell Signaling Technology). Proteins were visualized with a secondary antibody conjugated to horseradish peroxidase (1: 2500, Jackson ImmunoResearch Laboratories) using a chemiluminescent substrate (GE Healthcare Life Sciences). Signal was removed with stripping buffer (Thermo Scientific) and membranes were re-probed with antibodies directed against either glyceraldehyde 3-phosphate dehydrogenase (1: 1000, Enzo Life Sciences), or ERK1/2 (1: 1000, Cell Signaling Technology). X-ray films were scanned and processed (background subtraction and enhancement using default settings) in ImageJ, and exported to Canvas v12 (ACD Systems).
Results
Differential Expression of Cycs Reporter in Individual Neurons
The 235 bp Cycs proximal enhancer fragment was linked to a synthetic basal promoter and a green fluorescent protein (GFPpd2) gene, and inserted into a self-inactivating lentiviral vector containing a copy of the core sequence of the HS4 insulator element in place of U3 (Chung et al., 1997). The HS4 sequence has been shown to partially shield a gene from position effects arising from the site of provirus insertion (Hanawa et al., 2009). A short-lived GFP was used in order to capture any dynamic changes in Cycs enhancer-dependent reporter gene expression (Li et al., 1998). Hippocampal neurons, prepared from day 18 embryos, were grown for 14 div, and then infected with the reporter lentivirus. GFP expression was examined after a further 10 days by which time cultured hippocampal neurons are fully active (Valor et al., 2007). To confirm GFP expression in neurons, an infected culture was fixed and immunostained with anti-beta III tubulin antibodies. As shown in Figure 1A, the steady state level of GFP expression varied between morphological similar neurons indicating that differences in reporter gene activity likely reflect differences in transcription rather than neuron heterogeneity. In general cells appeared as relatively bright or dim. Pairs of bright and dim neurons were patch clamped in order to investigate whether there were differences in the strength of their excitatory synapses. We found that brighter neurons had statistically significant larger size miniature excitatory postsynaptic currents (mEPSCs) than dimly fluorescent neurons while there was no significant difference in the frequency of mEPSCs (Figures 1B–F). This indicates that stronger steady state reporter activity is a reasonably good indicator of the level of the synaptic drive that a neuron receives. Because the reporter virus does not contain any transcribed sequences from Cycs, it is likely that differences in GFP expression reflect changes in transcription; however, run-on transcription and chromatin IP experiments will be necessary to definitively prove that this is the case.
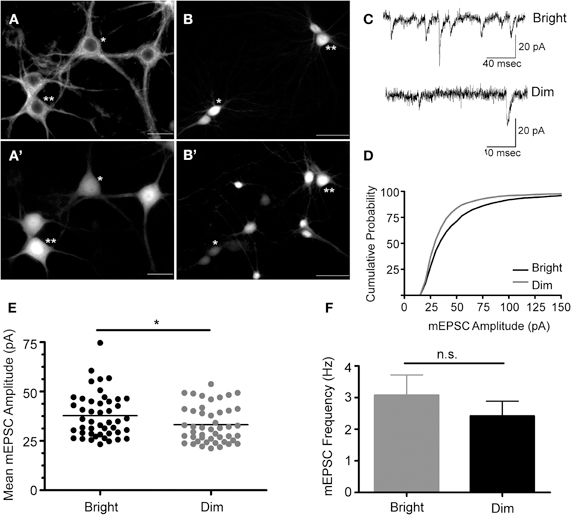
Figure 1. Cycs enhancer-driven GFP expression correlates with the state of excitatory transmission in cultured hippocampal neurons.(A) Beta tubulin III+ hippocampal neurons infected with the Cysc reporter virus express varying amounts of GFP designated *dim or **bright (A'). Scale bar corresponds to 20 microns. (B) Biocytin filled cells from which recording were made expressed relatively high (**) and low (*) levels of GFP (B'). Scale bar corresponds to 50 microns. (C) Recorded mEPSCs from bright and dim neurons. (D) Cumulative probability distribution for the amplitude of recorded mEPSCs in cells strongly expressing (bright) or weakly expressing (dim) GFP. (E) Vertical scatter plot showing the mean mEPSC size for a 5 min recording session for bright (n = 46) and dim cells (n = 46). (F) Average mEPSC frequency for the recordings shown in panel E. Between group statistical significance was determined using the Mann–Whitney test, *p < 0.05.
Blocking GABAA Receptors Enhances Cycs Reporter Gene Expression
To further analyze how well the activity-dependent reporter constructs can follow changes in network activity, we treated 24 day old cultured neurons with 20 μM bicuculline. This manipulation has been shown to increase synchronous bursting activity that can persist for up to 24 h (Arnold et al., 2005). Cultures treated with 1 μM TTX plus bicuculline, or vehicle served as controls. Images of 10 fields selected at random from each culture were recorded within minutes of adding the inhibitors using the same exposure time. Cultures were then returned to the incubator, and images were again acquired from the same cultures after 24 and 48 h. As shown in Figure 2, exposing cultures to bicuculline increased GFP expression in hippocampal neurons; while co-administering TTX partially suppressed this response (Figures 2A,B). Even though GFP levels in bicuculline-treated neurons was variable, the median value calculated from the mean fluorescence intensities clearly increased over time (Figure 2B). There was no statistically significant difference between the three cultures prior to adding the inhibitors, but after 24 and 48 h there was a significant difference between the control and bicuculline-treated neurons.
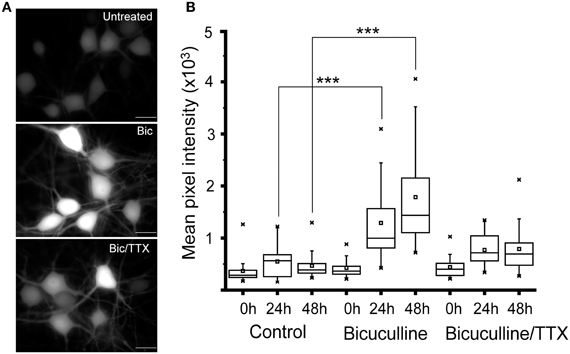
Figure 2. Suppressing inhibitory activity markedly increases Cycs enhancer-driven GFP expression.(A) Hippocampal neurons were exposed to bicuculline (20 μM) or bicuculline plus TTX (1 μM) for 48 h. Images of living neurons, normalized to the same intensity scale, show marked differences in GFP levels between treatments. Scale bar corresponds to 20 microns. (B) Box and whisker plots showing quantification of GFP expression in the same cultures over time following addition of bicuculline or bicuculline plus TTX. Images of a least 25 cells in 10 fields were analyzed. Mean pixel intensities are in arbitrary units. Between group statistical significance was determined using the paired sample Wilcoxon signed rank test, ***p < 0.001.
To confirm the imaging results, we carried out western blots using an anti-GFP antibody. As expected, cultures treated for 48 h with bicuculline showed an increase in GFP expression (Figure 3A). Similar to our results obtained by live imaging, co-applying bicuculline and TTX prevented the increase in GFP expression, however, the intensity of the GFP signal was higher than in cells treated with TTX alone. In addition, combining 6-Cyano-7-nitroquinoxaline-2,3-dione (CNQX, 20 μM) and D-(-)-2-Amino-5-phosphonopentanoic acid (APV, 50 μM) to simultaneously block AMPA and NMDA receptors, respectively, had a similar effect to TTX on the bicuculline-induced increase in GFP expression (Figure 3A). Even if bicuculline was added for only 8 h and then washed out, GFP expression remained elevated after 48 h (Figure 3B lane 3). Given that the half-life of the GFP variant used in our experiments is approximately 2 h (Li et al., 1998), this likely reflected ongoing transcriptional upregulation of the Cycs enhancer.
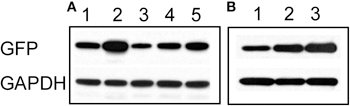
Figure 3. (A) Increase in Cycs enhancer-driven GFP expression by bicuculline is suppressed by blocking neural activity. Lane 1, 48 h untreated; lane 2, 48 h bicuculline; lane 3, 48 h TTX, lane 4, 48 h bicuculline plus TTX; lane 5, 48 h bicuculline plus APV (50 μM) and CNQX (20 μM). (B) Persistent effect of bicuculline on GFP expression. Lane 1, 8 h bicuculline; lane 2, 48 h bicuculline; lane 3, 8 h bicuculline plus 40 h after washout of bicuculline. Glyceraldehyde-3-phosphate dehydrogenase (GAPDH) was used as a loading control.
To determine whether the observed increase in Cycs enhancer-driven GFP was similar to known activity-dependent enhancers (Lam et al., 2009), two new reporter viruses were made in which GFPpd2 expression was driven either by a 564 bp Fos proximal enhancer fragment (Wang and Howells, 1994) or a 104 bp distal enhancer from the Arc gene (Kawashima et al., 2009). Both enhancers contain CRE sites as well as a serum response element (Sheng et al., 1988; Kawashima et al., 2009). As shown in Figure 4, the difference between GFP expression under control of the Fos proximal enhancer in neurons treated with either TTX or bicuculline for 48 h was similar to that of the Cycs enhancer. The Arc enhancer produced a big difference in GFP expression between bicuculline and TTX, and is in agreement with previous work (Shepherd et al., 2006; Kawashima et al., 2009). The relatively modest response of the Fos reporter to biccuculline is probably due to the absence of additional regulatory sequences located downstream in the Fos gene (Deschamps et al., 1985; Schilling et al., 1991).
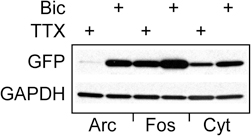
Figure 4. Comparing the Cycs enhancer to other activity-regulated enhancers.Arc enhancer (48 h TTX), Arc enhancer (48 h bicuculline), Fos enhancer (48 h TTX); Fos enhancer (48 h bicuculline), Cycs enhancer (48 h TTX), Cycs enhancer (48 h bicuculline). Glyceraldehyde-3-phosphate dehydrogenase (GAPDH) was used as a loading control.
It has been reported that short-term exposure of cultured neurons to bicuculline leads to transcription-dependent synaptic potentiation (Wiegert et al., 2009) whereas long-term exposure causes synaptic scaling (Turrigiano et al., 1998). To confirm that this latter process had occurred under our experimental conditions, patch clamp recordings were made of strongly positive GFP neurons that had been treated with bicuculline for 48 h. As shown in Figure 5, blocking inhibitory activity significantly decreased the frequency and the amplitude of mEPSCs showing that there had been a decrease in synaptic efficacy, a hallmark of homeostatic synaptic plasticity. Thus, up-regulation of the Cycs, Fos, and Arc enhancers persists in the presence of weakened excitatory drive.
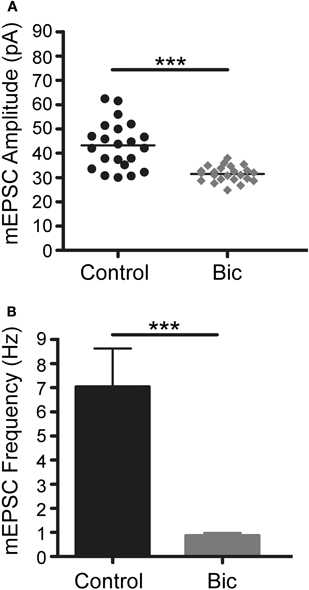
Figure 5. Bicuculline treatment for 48 h triggers homeostatic plasticity.(A) Vertical scatter plot showing the mean mEPSC size for a 5 min recording session in untreated (n = 22), bicuculline treated (n = 23) neurons. (B) Average mEPSC frequency for the recordings shown in panel A. Between group statistical significance was determined using a One-Way ANOVA with Tukey's multiple comparison test, ***p < 0.001.
CREB and NRF1 Binding Sites are Required for Activity-Dependent Expression in Neurons
To determine the relative contributions of the CREB and NRF1 binding sites to the bicuculline response, three new lentiviral constructs were made in which the CRE sites (CRE−), the NRF1 binding site (NRF1−), or both (CRE−/NRF1−) were mutated. Primary neurons were infected as before, and GFP expression was measured. As shown in Figure 6A, binding of CREB and NRF1 accounted for most of the steady-state transcriptional activity of the Cycs enhancer, although loss of NRF1 binding had a greater effect on GFP expression. To test the involvement of each binding site in regulating activity dependent GFP transcription, neurons were infected and treated with bicuculline or TTX for 48 h. Western blot analysis showed that neural activity regulates gene transcription in a NRF1 and CREB-dependent fashion with NRF1 playing a prominent role (Figure 6B).
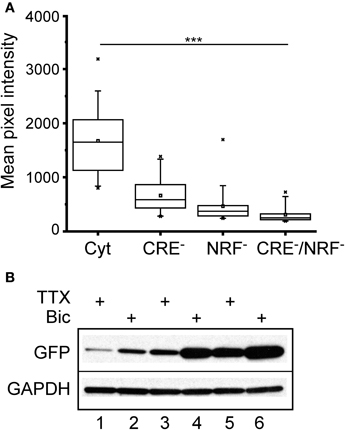
Figure 6. Cycs enhancer-driven GFP expression in hippocampal neurons requires intact CREB and NRF1 binding sites.(A) Box and whisker plots showing the relative levels of steady state GFP expression in neurons infected with reporter viruses containing mutations in the CREB or NRF1 binding sites or both. Images of a least 25 cells in 10 fields were analyzed. Mean pixel intensities are in arbitrary units. Between group statistical significance was determined using the paired sample Wilcoxon signed rank test, ***p < 0.001. (B) Western blot showing effect of bicuculline and TTX on mutated enhancers. NRF1− enhancer (48 h TTX), NRF1− enhancer (48 h bicuculline), CRE− enhancer (48 h TTX), CRE− enhancer (48 h bicuculline), intact enhancer (48 h TTX); intact enhancer (48 h bicuculline). Glyceraldehyde-3-phosphate dehydrogenase (GAPDH) was used as a loading control.
NRF1-Driven Gene Expression is Calcium-Dependent
It is well established that calcium entry through NMDA receptors and L-type calcium channels is the critical signal for enhanced transcription driven by neural activity involving CREB (Deisseroth et al., 1996; Hardingham et al., 1999). The effect of glutamate on gene expression has been linked to calcium influx through NMDA receptors, whereas transcription induced by direct membrane depolarization with potassium is sensitive to blockade of L-type calcium channels (Bading et al., 1993, 1995). To investigate the involvement of calcium in NRF1-dependent gene activity, neurons expressing the CRE−Cycs enhancer were treated with bicuculline for 48 h in the presence of APV (50 μM final concentration), or the L-type calcium channel blocker nimodopine (10 μM final concentration). As shown in Figure 7 both nimodipine and APV significantly reduced GFP expression indicating that NRF1-dependent promoter activity, at least in this context, is regulated by calcium arising from both NMDA receptors and from L-type calcium channels.
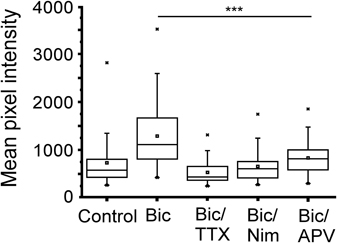
Figure 7. Increase in Cycs CRE− enhancer-driven GFP expression by bicuculline is dependent on NMDA and L-type calcium channel activation. Box and whisker plots showing the relative levels of GFP expression in neurons infected with the CRE− reporter virus after adding bicuculline, bicuculline/TTX, bicuculline/nimodipine (10 μM), or bicuculline/APV (50 μM) for 48 h. Images of at least 25 cells in 10 fields were analyzed. Mean pixel intensities are in arbitrary units. Between group statistical significance was determined using the paired sample Wilcoxon signed rank test, ***p < 0.001.
NRF1-Driven Gene Expression is Regulated By ERK1/2
Bicuculline-induced bursting activity is sensitive to inhibition of ERK1/2 (Arnold et al., 2005), and ERK1/2 is activated by calcium influx in response to neural activity (Wiegert and Bading, 2011). To investigate the involvement of the ERK1/2 kinase in the regulation of NRF1-dependent transcription, neurons expressing the Cycs CRE− reporter were pre-treated for 30 min with the MEK1/2 inhibitor SL327 (Z-& E-α-(Amino-[(4-aminophenyl)thio]methylene)-2-(trifluoromethyl)benzeneacetonitrile, 10 μM final concentration; Atkins et al., 1998), prior to adding bicuculline. The kinase inhibitor was added again after 24 h, and images of individual neurons were acquired 48 h from the start of the experiment. GFP expression was compared to cultures that had been treated with TTX or bicuculline alone. As shown in Figure 8A, inhibiting ERK1/2 activity in the presence of bicuculline reduced GFP expression to levels that were statistically indistinguishable from TTX-treated cells (p = 0.216). In a second set of experiments GFP expression and ERK1/2 activation was examined by western blot analysis. We noticed that, following 8 h of exposure to bicuculline GFP expression had not changed, although phosphorylated ERK1/2 levels had gone up reflecting an increase in ERK1/2 activation caused by bicuculline (Figure 8B). Likewise inhibiting ERK1/2 activity had no effect on GFP expression after 8 h. However, the increase in GFP expression seen after 48 h was partially suppressed by continuously blocking ERK1/2 (Figure 8B lane 6), indicating that the ERK1/2 pathway is involved either directly or indirectly in the up-regulation of NRF1-dependent transcription by bicuculline. Similarly, directly inhibiting ERK1/2 with 5-(2-Phenyl-pyrazol[1,5-a]pyridine-3-yl)-1H-pyrazolo[3,4-c]pyridazin-3-ylamine (Ohori et al., 2005) also reduced the bicuculline-induced increase in GFP expression (data not shown).
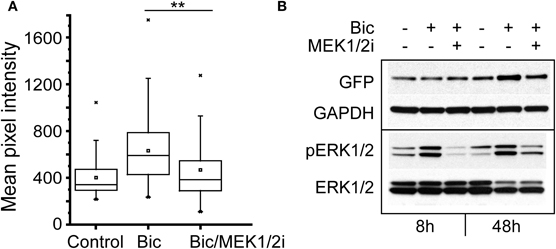
Figure 8. Increase in Cycs CRE− enhancer-driven GFP expression by bicuculline is dependent on ERK1/2 activation.(A) Box and whisker plots showing the relative levels of GFP expression in neurons infected with the CRE− reporter virus after adding TTX, bicuculline, or bicuculline plus MEK1/2 inhibitor SL327 for 48 h. Images of a least 50 cells in 20 fields were analyzed. Mean pixel intensities are in arbitrary units. Between group statistical significance was determined using the paired sample Wilcoxon signed rank test, **p < 0.006. (B) Representative western blot of neuronal cultures treated with bicuculline for 8 and 48 h in the presence or absence of the MEK1/2 inhibitor SL327. Glyceraldehyde-3-phosphate dehydrogenase (GAPDH) was used as a loading control.
Discussion
Histochemistical staining for cytochrome c oxidase activity (Complex IV) has been used extensively to define regions in the brain that are associated with high levels of neural activity (Wong-Riley, 1989). To try to relate synaptic activity to mitochondrial gene expression within individual living neurons, a recombinant lentivirus reporter was made that expresses a short-lived version of GFP under the transcriptional control of sequences from the gene encoding cytochrome c, the electron donor to Complex IV. We found that the Cycs proximal enhancer is responsive to changes in neural activity, primarily due to the presence of the NRF1 and two CREB binding sites, which define this enhancer (Evans and Scarpulla, 1989).
Steady state levels of GFP in morphologically similar neurons appeared to be related to synaptic strength in as much as higher amplitude mEPSCs were recorded in cells with more GFP expression compared to ones with less. Stronger unitary connections may be expected to drive higher firing rates, which would demand more energy. Since most ATP is generated by oxidative phosphorylation in mitochondria, more mitochondria or more mitochondria with extensive cristae may exist in neurons with higher firing rates (Perkins et al., 2003). This would likely require higher steady state transcription of nuclear-encoded mitochondrial genes including cytochrome c. In an in vivo study of hippocampus, fast spiking parvalbumin- positive interneurons strongly immunostained for cytochrome c and contained more mitochondria than principal cells and other interneurons (Gulyas et al., 2006). Thus, the reporter virus described here could be a useful in vivo tool to distinguish between different types of neurons with varying metabolic demands, and to differentiate between activity levels in populations of the same type of neuron (Barth, 2007).
When bicuculline was added to strongly enhance network activity, and drive up energy demand (Arnold et al., 2005), Cycs enhancer-dependent GFP expression increased over the 48 h period of the experiment. There was cell to cell variability between morphologically similar neurons, which may reflect the difference in neuronal connectivity between individual neurons or variability in L-type calcium channel or NMDA receptor expression (Figure 2A). Nevertheless, overall GFP expression increased as confirmed by western blot analysis, and elevated GFP expression persisted even if the bicuculline was removed after 8 h (Figure 3).
Prolonged exposure to bicuculline causes synaptic scaling, a phenomenon that maintains a neuron's intrinsic firing rate in the face of hyperexcitation (Turrigiano et al., 1998). Measurement of mEPSCs confirmed that neurons in our cultures exposed to bicuculline had exhibited synaptic scaling after 48 h. Under these conditions not only did Cycs enhancer driven GFP expression increase, but the same result was obtained with Fos and Arc reporter viruses. Homeostatic adjustment of synaptic strength, due to prolonged hyperexcitation, therefore, does not appear to down-regulate these activity-dependent enhancers. It has been previously shown that Arc levels go up under conditions of homeostatic synaptic plasticity (Shepherd et al., 2006). Arc promotes the removal of AMPA receptors from the postsynaptic membrane, accounting for the observed decrease in the amplitude of mEPSCs following prolonged suppression of GABAergic inhibition (Shepherd et al., 2006).
In the present work a significant decrease in mEPSC frequency as well as mEPSC amplitude was observed, which may be related to the age of the cultured neurons (26 div) (Wierenga et al., 2006). A decrease in mEPSC frequency is considered to reflect presynaptic changes, either a decrease in the probability of vesicle release or a decrease in the number of synapses or both (Pozo and Goda, 2011). In other work it has been shown that exposing day 18–19 hippocampal neurons to bicuculline led to a decrease in the number of synaptic spines (Piccoli et al., 2007). Persistent high GFP expression following bicuculline treatment may be the result of initially enhanced firing rates (Arnold et al., 2005) coupled with sustained amplification in gene transcription dependent on ERK1/2 activation. We found high levels of ERK1/2 activation at 8 h and 48 h after applying bicuculline (Figure 8B).
Removing the CRE sites rendered the Cycs enhancer primarily dependent upon the NRF1 binding site. Co-administering TTX, APV, or nimodipine antagonized the response of the CRE− enhancer to bicuculline, indicating that calcium influx through either NMDA or L-type calcium channels regulated the NRF1-dependent transcriptional response. In other studies blocking L-type calcium channels did not affect CREB-dependent transcription in response to bicuculline (Hardingham et al., 2002), although bicuculline-induced bursting can lead to calcium entry through L-type calcium channels (Arnold et al., 2005). Prolonged hyperactivity in dissociated cortical neurons (>18 div) triggered by adding the GABAA receptor inhibitor gabazine increased VGLUT2 expression over 48 h, an effect that was suppressed by a L-type calcium blocker, and by an ERK1/2 inhibitor (Doyle et al., 2010).
It has been reported that ERK1/2 activation in neurons is regulated by cyclin-dependent kinase 5 (CDK5), which phosphorylates and inhibits the upstream kinase MEK1 (Sharma et al., 2002). CDK5 has been implicated in homeostatic synaptic plasticity by acting as a priming kinase for Polo-like kinase 2, which has been shown to be necessary for synaptic scaling via its dendritic substrate RapGAP (Seeburg et al., 2008). Thus, CDK5 would be expected to be activated in neurons chronically exposed to bicuculline. On the other hand, because bicuculline-induced bursting leads to an increase in phosphorylated ERK1/2 in nuclei of hippocampal neurons (Wiegert et al., 2007), high levels of activated ERK1/2 in the nucleus may persist in the face of down regulation of ERK1/2 by CDK5 in the cytoplasm. Future experiments involving fractionation of neurons exposed to bicuculline will be designed to address this question.
Conflict of Interest Statement
The authors declare that the research was conducted in the absence of any commercial or financial relationships that could be construed as a potential conflict of interest.
Acknowledgments
We would like to thank Dr. Richard Scarpulla for plasmids, and Ayda Dashtaei for excellent technical assistance. Supported by the Neurosciences Research Foundation and The G. Harold & Leila Y. Mathers Foundation.
References
Arnold, F. J., Hofmann, F., Bengtson, C. P., Wittmann, M., Vanhoutte, P., and Bading, H. (2005). Microelectrode array recordings of cultured hippocampal networks reveal a simple model for transcription and protein synthesis-dependent plasticity. J. Physiol. 564, 3–19.
Atkins, C. M., Selcher, J. C., Petraitis, J. J., Trzaskos, J. M., and Sweatt, J. D. (1998). The MAPK cascade is required for mammalian associative learning. Nat. Neurosci. 1, 602–609.
Bading, H., Ginty, D. D., and Greenberg, M. E. (1993). Regulation of gene expression in hippocampal neurons by distinct calcium signaling pathways. Science 260, 181–186.
Bading, H., Segal, M. M., Sucher, N. J., Dudek, H., Lipton, S. A., and Greenberg, M. E. (1995). N-methyl-D-aspartate receptors are critical for mediating the effects of glutamate on intracellular calcium concentration and immediate early gene expression in cultured hippocampal neurons. Neuroscience 64, 653–664.
Barth, A. L. (2007). Visualizing circuits and systems using transgenic reporters of neural activity. Curr. Opin. Neurobiol. 17, 567–571.
Chung, J. H., Bell, A. C., and Felsenfeld, G. (1997). Characterization of the chicken beta-globin insulator. Proc. Natl. Acad. Sci. U.S.A. 94, 575–580.
Colgan, J., and Manley, J. L. (1995). Cooperation between core promoter elements influences transcriptonal activity in vivo. Proc. Natl. Acad. Sci. U.S.A. 92, 1955–1959.
Deisseroth, K., Bito, H., and Tsien, R. W. (1996). Signaling from synapse to nucleus: postsynaptic CREB phosphorylation during multiple forms of hippocampal synaptic plasticity. Neuron 16, 89–101.
Dhar, S. S., Ongwijitwat, S., and Wong-Riley, M. T. (2008). Nuclear respiratory factor 1 regulates all ten nuclear-encoded subunits of cytochrome c oxidase in neurons. J. Biol. Chem. 283, 3120–3129.
Dhar, S. S., and Wong-Riley, M. T. (2009). Coupling of energy metabolism and synaptic transmission at the transcriptional level: role of nuclear respiratory factor 1 in regulating both cytochrome c oxidase and NMDA glutamate receptor subunit genes. J. Neurosci. 29, 483–492.
Deschamps, J., Meijlink, F., and Verma, I. (1985). Identification of transcriptional enhancer element upstream of the proto-oncogene fos. Science 230, 1174–1177.
Doyle, S., Pyndiah, S., De Gois, S., and Erickson, J. D. (2010). Excitation-transcription coupling via calcium/calmodulin-dependent protein kinase/ERK1/2 signaling mediates the coordinate induction of VGLUT2 and Narp triggered by a prolonged increase in glutamatergic synaptic activity. J. Biol. Chem. 285, 14366–14376.
Edelman, D. B., Owens, G. C., and Chen, S. (2011). Neuromodulation and mitochondrial transport: live imaging in hippocampal neurons over long durations. J. Vis. Exp. 52, e2599.
Evans, M. J., and Scarpulla, R. C. (1989). Interaction of nuclear factors with multiple sites in the somatic cytochrome c promoter. Characterization of upstream NRF-1, ATF, and intron Sp1 recognition sequences. J. Biol. Chem. 264, 14361–14368.
Flavell, S. W., and Greenberg, M. E. (2008). Signaling mechanisms linking neuronal activity to gene expression and plasticity of the nervous system. Annu. Rev. Neurosci. 31, 563–590.
Gulyas, A. I., Buzsaki, G., Freund, T. F., and Hirase, H. (2006). Populations of hippocampal inhibitory neurons express different levels of cytochrome c. Eur. J. Neurosci. 23, 2581–2594.
Hanawa, H., Yamamoto, M., Zhao, H., Shimada, T., and Persons, D. A. (2009). Optimized lentiviral vector design improves titer and transgene expression of vectors containing the chicken beta-globin locus HS4 insulator element. Mol. Ther. 17, 667–674.
Hardingham, G. E., Chawla, S., Cruzalegui, F. H., and Bading, H. (1999). Control of recruitment and transcription-activating function of CBP determines gene regulation by NMDA receptors and L-type calcium channels. Neuron 22, 789–798.
Hardingham, G. E., Fukunaga, Y., and Bading, H. (2002). Extrasynaptic NMDARs oppose synaptic NMDARs by triggering CREB shut-off and cell death pathways. Nat. Neurosci. 5, 405–414.
Herzig, R. P., Scacco, S., and Scarpulla, R. C. (2000). Sequential serum-dependent activation of CREB and NRF-1 leads to enhanced mitochondrial respiration through the induction of cytochrome c. J. Biol. Chem. 275, 13134–13141.
Kann, O., and Kovacs, R. (2007). Mitochondria and neuronal activity. Am. J. Physiol. Cell Physiol. 292, C641–C657.
Kawashima, T., Okuno, H., Nonaka, M., Adachi-Morishima, A., Kyo, N., Okamura, M., Takemoto-Kimura, S., Worley, P. F., and Bito, H. (2009). Synaptic activity-responsive element in the Arc/Arg3.1 promoter essential for synapse-to-nucleus signaling in activated neurons. Proc. Natl. Acad. Sci. U.S.A. 106, 316–321.
Kovacs, K. A., Steullet, P., Steinmann, M., Do, K. Q., Magistretti, P. J., Halfon, O., and Cardinaux, J. R. (2007). TORC1 is a calcium- and cAMP-sensitive coincidence detector involved in hippocampal long-term synaptic plasticity. Proc. Natl. Acad. Sci. U.S.A. 104, 4700–4705.
Lam, B. Y., Zhang, W., Enticknap, N., Haggis, E., Cader, M. Z., and Chawla, S. (2009). Inverse regulation of plasticity-related immediate early genes by calcineurin in hippocampal neurons. J. Biol. Chem. 284, 12562–12571.
Li, X., Zhao, X., Fang, Y., Jiang, X., Duong, T., Fan, C., Huang, C. C., and Kain, S. R. (1998). Generation of destabilized green fluorescent protein as a transcription reporter. J. Biol. Chem. 273, 34970–34975.
Ohori, M., Kinoshita, T., Okubo, M., Sato, K., Yamazaki, A., Arakawa, H., Nishimura, S., Inamura, N., Nakajima, H., Neya, M., Miyake, H., and Fujii, T. (2005). Identification of a selective ERK inhibitor and structural determination of the inhibitor-ERK2 complex. Biochem. Biophys. Res. Commun. 336, 357–363.
Perkins, G. A., Ellisman, M. H., and Fox, D. A. (2003). Three-dimensional analysis of mouse rod and cone mitochondrial cristae architecture: bioenergetic and functional implications. Mol. Vis. 9, 60–73.
Piccoli, G., Verpelli, C., Tonna, N., Romorini, S., Alessio, M., Nairn, A. C., Bachi, A., and Sala, C. (2007). Proteomic analysis of activity-dependent synaptic plasticity in hippocampal neurons. J. Proteome Res. 6, 3203–3215.
Pozo, K., and Goda, Y. (2011). Unraveling mechanisms of homeostatic synaptic plasticity. Neuron 66, 337–351.
Scarpulla, R. C. (2008). Transcriptional paradigms in mammalian mitochondrial biogenesis and function. Physiol. Rev. 88, 611–638.
Schilling, K., Luk, D., Morgan, J. I., and Curran, T. (1991). Regulation of a fos:lacZ fusion gene: a paradigm for quantitative analysis of stimulus: transcription coupling. Proc. Natl. Acad. Sci. U.S.A. 88, 5665–5669.
Seeburg, D. P., Feliu-Mojer, M., Gaiottino, J., Pak, D. T., and Sheng, M. (2008). Critical role of CDK5 and Polo-like kinase 2 in homeostatic synaptic plasticity during elevated activity. Neuron 58, 571–583.
Sharma, P., Veeranna, Sharma, M., Amin, N. D., Sihag, R. K., Grant, P., Ahn, N., Kulkarni, A. B., and Pant, H. C. (2002). Phosphorylation of MEK1 by cdk5/p35 down-regulates the mitogen-activated protein kinase pathway. J. Biol. Chem. 277, 528–534.
Sheng, M., Dougan, S. T., Mcfadden, G., and Greenberg, M. E. (1988). Calcium and growth factor pathways of c-fos transcriptional activation require distinct upstream regulatory sequences. Mol. Cell. Biol. 8, 2787–2796.
Shepherd, J. D., Rumbaugh, G., Wu, J., Chowdhury, S., Plath, N., Kuhl, D., Huganir, R. L., and Worley, P. F. (2006). Arc/Arg3.1 mediates homeostatic synaptic scaling of AMPA receptors. Neuron 52, 475–484.
Turrigiano, G. G., Leslie, K. R., Desai, N. S., Rutherford, L. C., and Nelson, S. B. (1998). Activity-dependent scaling of quantal amplitude in neocortical neurons. Nature 391, 892–896.
Valor, L. M., Charlesworth, P., Humphreys, L., Anderson, C. N., and Grant, S. G. (2007). Network activity-independent coordinated gene expression program for synapse assembly. Proc. Natl. Acad. Sci. U.S.A. 104, 4658–4663.
van Waveren, C., and Moraes, C. T. (2008). Transcriptional co-expression and co-regulation of genes coding for components of the oxidative phosphorylation system. BMC Genomics 9, 18.
Wang, W. W., and Howells, R. D. (1994). Sequence of the 5′-flanking region of the rat c-fos proto-oncogene. Gene 143, 261–264.
Wiegert, J. S., and Bading, H. (2011). Activity-dependent calcium signaling and ERK-MAP kinases in neurons: a link to structural plasticity of the nucleus and gene transcription regulation. Cell Calcium 49, 296–305.
Wiegert, J. S., Bengtson, C. P., and Bading, H. (2007). Diffusion and not active transport underlies and limits ERK1/2 synapse-to-nucleus signaling in hippocampal neurons. J. Biol. Chem. 282, 29621–29633.
Wiegert, J. S., Hofmann, F., Bading, H., and Bengtson, C. P. (2009). A transcription-dependent increase in miniature EPSC frequency accompanies late-phase plasticity in cultured hippocampal neurons. BMC Neurosci. 10, 124.
Wierenga, C. J., Walsh, M. F., and Turrigiano, G. G. (2006). Temporal regulation of the expression locus of homeostatic plasticity. J. Neurophysiol. 96, 2127–2133.
Wong-Riley, M. T. (1989). Cytochrome oxidase: an endogenous metabolic marker for neuronal activity. Trends Neurosci. 12, 94–101.
Wu, G. Y., Deisseroth, K., and Tsien, R. W. (2001). Activity-dependent CREB phosphorylation: convergence of a fast, sensitive calmodulin kinase pathway and a slow, less sensitive mitogen-activated protein kinase pathway. Proc. Natl. Acad. Sci. U.S.A. 98, 2808–2813.
Zhang, X., Odom, D. T., Koo, S. H., Conkright, M. D., Canettieri, G., Best, J., Chen, H., Jenner, R., Herbolsheimer, E., Jacobsen, E., Kadam, S., Ecker, J. R., Emerson, B., Hogenesch, J. B., Unterman, T., Young, R. A., and Montminy, M. (2005). Genome-wide analysis of cAMP-response element binding protein occupancy, phosphorylation, and target gene activation in human tissues. Proc. Natl. Acad. Sci. U.S.A. 102, 4459–4464.
Keywords: cytochrome c promoter, lentivirus, hippocampal neurons, gene expression, bicuculline, green fluorescent protein, miniature postsynaptic currents
Citation: Delgado JY and Owens GC (2012) The cytochrome c gene proximal enhancer drives activity-dependent reporter gene expression in hippocampal neurons. Front. Mol. Neurosci. 5:31. doi: 10.3389/fnmol.2012.00031
Received: 20 October 2011; Accepted: 22 February 2012;
Published online: 07 March 2012.
Edited by:
Carmen Villmann, Julius-Maximilians-University Würzburg, GermanyCopyright: © 2012 Delgado and Owens. This is an open-access article distributed under the terms of the Creative Commons Attribution Non Commercial License, which permits non-commercial use, distribution, and reproduction in other forums, provided the original authors and source are credited.
*Correspondence: Geoffrey C. Owens, The Neurosciences Institute, 10640 John Jay, Hopkins Drive, San Diego, CA 92121, USA. e-mail: owens@nsi.edu
†Present address: Université de Bordeaux, 2 IINS: UMR 5297, CNRS- 2, Bordeaux Cedex 33077, France.