Differences in Gene Expression Profiles and Phenotypes of Differentiated SH-SY5Y Neurons Stably Overexpressing Mitochondrial Ferritin
 Anarmaa Mendsaikhan
 Shigeko Takeuchi
  Douglas G. Walker
 Ikuo Tooyama
- Molecular Neuroscience Research Center, Shiga University of Medical Science, Otsu, Japan
Mitochondrial ferritin (FtMt) is an iron-transport protein with ferroxidase properties localized to mitochondria. Levels are generally low in all tissues, while increasing the expression of FtMt in neuronal-like cells has been shown to be protective. To determine whether FtMt has potential as a therapeutic approach, there remains the question of how much FtMt is protective. To address this issue, we transfected SH-SY5Y neuroblastoma cells with a FtMt expression plasmid and isolated cell lines with stable expression of FtMt at high, medium and low levels. Using these cell lines, we examined effects of FtMt on neuronal phenotype, neuroprotective activity and gene expression profiles. The phenotypic properties of high, medium and low FtMt expressors were compared with native untransfected SH-SY5Y cells after differentiation with retinoic acid to a neuronal phenotype. Overexpression of FtMt, even in low expressing cells, showed significant protection from oxidative stress induced by hydrogen peroxide or cobalt chloride. Higher levels of FtMt expression did not appear to offer greater protection, and did not have toxic consequences to cells, even though there were significantly more aggregated mitochondria in the highest expressing clone. The phenotypes differed between cell clones when assessed by cell growth, neurite outgrowth, and expression of neuronal proteins including those associated with neurodegenerative diseases. Microarray analysis of high, medium and negative FtMt-expressing cells identified different patterns of expression of certain genes associated with oxidative stress and neuronal development, amongst others. Validation of microarray analyses was carried out by real time polymerase chain reaction. The results showed significant differences in expression of thioredoxin-interacting protein (TXNIP) and microsomal glutathione transfer-1 (MGST-1), which can have critical roles in the regulation of oxidative stress. Differences in expression of calcitonin-related polypeptide alpha (CALCA), growth differentiation factor-15 (GDF-15) and secretogranin II (SCG2) were also observed. Our findings indicate that even low levels of increased FtMt expression can be protective possibly by alterations of some oxidative stress-related and growth factor genes, while high levels of expression did not appear to offer greater protection from oxidative stress or induce significant toxicity in cells. These experiments provide supporting data that increasing FtMt might be a feasible strategy for therapeutics in certain neurodegenerative and neurological diseases.
Introduction
Age-associated neurodegenerative diseases, particularly Alzheimer's disease (AD) and Parkinson's disease (PD), have proven resistant to effective therapies as the pathological processes are complex and still incompletely understood. There have been multiple approaches aimed at slowing down the degenerative processes, but they have primarily focused on inhibiting the formation or promoting the removal of toxic forms of amyloid beta (Aβ) peptide or tau (for AD) or α-synuclein (for PD) (Brundin et al., 2017; Jan et al., 2017). Although these diseases have significant clinical and pathological differences, one common feature is increased oxidative stress through elevated levels of damaging reactive oxygen species (ROS) (Nesi et al., 2017; Lang and Espay, 2018). Effective regulation of intracellular iron plays a critical role in controlling generation of ROS. Ferritin-H is the major cellular regulator of iron in most cells, but a significant role has been identified for mitochondrial ferritin (FtMt), a ferritin-H-like molecule that is targeted to mitochondria (Arosio et al., 2009).
FtMt has roles that overlap with ferritin, but its expression in normal tissue is very low and restricted to testis, brain, heart, and erythroblasts (Levi and Arosio, 2004; Santambrogio et al., 2007). FtMt expression is highest in cells of tissues with high oxygen demand, including neurons in brain (Gao and Chang, 2014). FtMt has multiple properties, in particular ferroxidase activity to reduce reactive ferrous ions to less reactive ferric ions. Within the realm of biological processes, it participates in oxidation-reduction, iron transport across membranes and cellular iron homeostasis. FtMt is synthesized as a 30 kDa polypeptide that is cleaved once the protein is translocated to the mitochondria matrix and assembles into a “ferritin-shell” of 24 of 22 kDa polypeptide chains (Levi et al., 2001; Drysdale et al., 2002). FtMt binds iron with similar properties to ferritin, but has particularly important function of regulating reactive iron species in mitochondria (Yang et al., 2013; Wang Y. Q. et al., 2016). In contrast to ferritin, FtMt mRNA lacks an iron-response element indicating a different mechanism of regulation (Drysdale et al., 2002). Recently, the FtMt gene promoter was shown to contain positive regulatory sequences for cyclic-AMP response element-binding protein (CREB), YYI and SP1 transcription factors, and C/EBPβ, GATA2 and FOXA1 sequences as negative regulators (Guaraldo et al., 2016).
With reference to the involvement of FtMt in diseases, it has been associated with Friedreich's Ataxia, restless leg syndrome and macular degeneration (Huang et al., 2009; Snyder et al., 2009; Stenirri et al., 2012; Wang X. et al., 2016). Overexpression of FtMt significantly slowed the replication of FtMt transfected SH-SY5Y neuroblastoma cells, both in culture and after in vivo transplantation of overexpressing cells to immune-deficient mice (Gong et al., 2017). Increased expression of FtMt has been demonstrated in neurons in regions of human brains affected by AD and PD pathology (Wang et al., 2011; Yang et al., 2017).
A number of studies using overexpression or knockdown models employing neuronal-like cells, particularly SH-SY5Y cells, demonstrated that FtMt protected against oxidative stressors and Aβ neurotoxicity (Shi et al., 2015; Gao et al., 2017; Li X. et al., 2017; Wang et al., 2017), (Wu et al., 2013; Wang Y. Q. et al., 2016; Gao et al., 2017; Guan et al., 2017). The potential therapeutic benefits of FtMt have also been suggested from different animal models for AD or PD. Using a line of mice with deletion of FtMt gene, it was shown that intracerebroventricular administration of the toxic Aβ25-35 fragment exacerbated memory deficits, with enhanced caspase activation in the gene deletion mice compared to mice expressing FtMt (Wang et al., 2017). Such studies will be enhanced with a transgenic mouse line that overexpresses FtMt. In models of PD, increased expression of FtMt was shown in mice treated with the dopaminergic toxins 6-OHDA and MPTP, while similarly treated FtMt gene deletion mice had higher levels of dopaminergic cell loss (Shi et al., 2010; You et al., 2016).
To determine whether FtMt has potential as a therapeutic approach, possibly by gene delivery methods, there remains the question of how much FtMt is protective and if mitochondrial damage can occur if levels are too high. Our previous paper showed that overexpression of FtMt in the ARPE-13 line of retinol epithelium cells caused several effects on mitochondrial function including increased mitochondrial fission and mitophagy (Wang X. et al., 2016). In order to clarify these issues, we established neuronal cell lines with stable expression of high, medium and low FtMt levels. Using these cell lines, we examined effects of overexpression of FtMt on neuronal phenotype, neuroprotective activity, and gene expression profiles.
Materials and Methods
Cell Culture
The human neuroblastoma SH-SY5Y cell line was obtained from the American Type Culture Collection (Gaithersburg, MD, USA) (Ross et al., 1983). Cells were grown in Dulbecco's Modified Eagle's Medium (DMEM) with high glucose and supplemented with 5% fetal bovine serum (FBS) and 50 μg/ml gentamicin. All cell culture reagents were obtained from Nacalai-Tesque, Kyoto, Japan. Cells were routinely subcultured with 0.1% trypsin/1 mM EDTA in Hanks Balanced Salt Solution (HBSS) before reaching confluency, but in some circumstances during earlier stages of clone establishment, cells were subcultured with PBS without trypsin to separate the neuroblast from epithelial-type cells. After initial isolation of FtMt-expressing clones, all experiments were carried out with differentiated cells with the exception of studies on cell growth. To produce differentiated cells with neuronal features, untransfected and isolated clones were treated with retinoic acid (10 μM)(Sigma-Aldrich, St. Louis, MO, USA) for 7 days in DMEM with 0.5–1.0 % FBS. Media was refreshed after 3 days of culture.
Transfection
Cells were transfected with a pEGFP-FTMT plasmid whose construction and characterization has been described (Wang et al., 2011). All recombinant DNA experiments were carried out with appropriate institutional approvals. To isolate stably-expressing SH-SY5Y cells, cells were plated at 2 × 10⁵ cells/well in 12 well-plates in growth media. After 24 h, media was replaced with serum-free DMEM, and transfection was carried out in triplicate using 0.5–1 μg plasmid DNA mixed with Viofectin (Viogen, New Taipei City, Taiwan) according to the manufacturer's instructions. After 6 h, serum was added to media to 5% final concentration, and cells allowed to recover for 18 h. The cultures were then subcultured with cells from each well-being transferred to a 60 mm diameter petri dish. The following day, media was replaced with growth media (DMEM + 5% FBS) containing 500 μg/ml G418 (Selection Media) (Nacalai-Tesque, Kyoto, Japan). The progress of the cultures were followed with twice-weekly media changes until growing colonies could be identified on plates. Individual colonies were selected using trypsin-soaked cloning discs (approximately 0.5 cm diameter), and these were transferred to individual T25 flasks in selection media for expansion. A number of separate colonies of G418-resistant cells were grown until cell numbers were sufficient to permit screening for FtMt expression and freezing in liquid nitrogen. A total of 26 isolated clones were isolated, screened and stored (Supplemental Figure 1).
Western Blot Screening Colonies for FtMt Expression
Western blots were used to screen isolated clones for expression of FtMt protein in selected clones. Initial screening was carried out using undifferentiated cells. Cell pellets were briefly disrupted by sonication in RIPA buffer (50 mM Tris-HCl, pH 7.6, 1% sodium deoxycholate, 1% NP40, 0.1% sodium dodecyl sulfate (SDS) and a cocktail of protease inhibitors). Protein concentrations in samples were measured using a MicroBCA Protein assay kit (Thermo Scientific, USA). Samples were prepared for SDS-polyacrylamide gel electrophoresis by dissolving in SDS-sample buffer containing 0.1M dithiothreitol (DTT). Equal amounts of protein were loaded on precast 5–20% SDS gradient gels (Wako, Japan or Nacalai-Tesque, Japan). After separation, proteins were transferred to Immobilon P (Millipore, MA, USA) PVDF membrane using semi-dry electroblotting apparatus.
Western Blot Detection and Quantification
The following procedures were used for all western blot in the analyses in this report. PVDF membranes were blocked for 1 h with 5% skim milk dissolved in Tris-buffered saline (50 mM Tris-HCl, pH 7.5, 150 mM NaCl) containing 0.05% Tween 20 (TBST). Membranes were subsequently incubated at room temperature for 18 h in optimal antibody dilution in 2% skim milk in TBST containing 0.005% sodium azide. The production and characterization of the custom rabbit polyclonal antibody to FtMt has previously been described (Yang et al., 2015). The antibodies used in this report are listed in Table 1. After antibody incubation, membranes were sequentially washed 3 × 10 min in TBST, and incubated in the appropriate horseradish peroxidase (HRP)-conjugated anti-immunoglobulin for 2 h. Membranes were imaged using Chemi-Lumi-One HRP chemiluminescence substrate (Nacalai-Tesque) with a LAS4000 Imaging system (GE Biosciences, U.S.A.). Some membranes were reprobed with different antibodies after treatment with Stripping Agent-Strong (Nacalai-Tesque). For normalization and loading control, membranes were subsequently incubated with an HRP-conjugated antibody to β-actin (FujiFilm/Wako, Japan) at 1:15,000 for 1 h. All images were quantified using Image Studio Lite software (Licor, NE, USA). Results are calculated as relative expression after normalization for levels of β-actin.
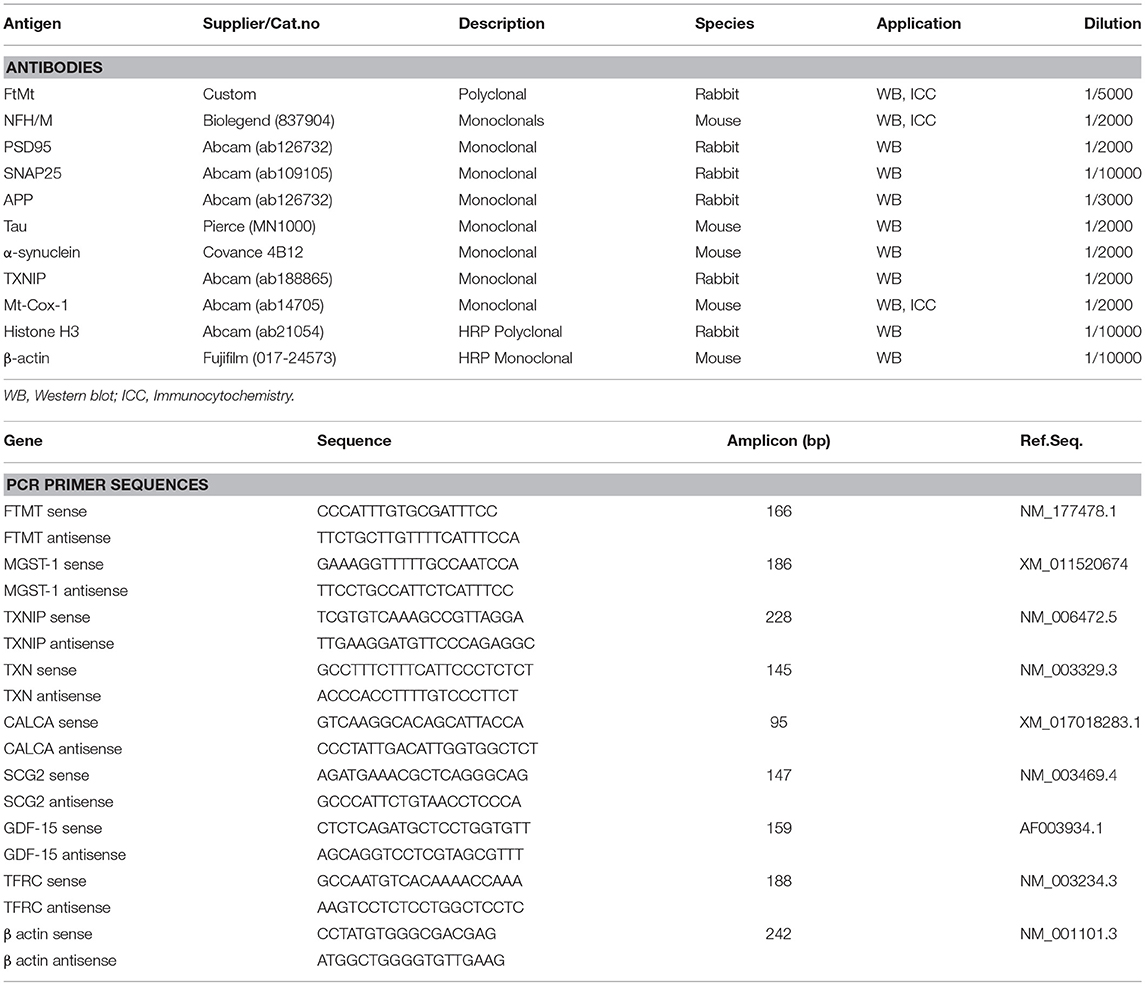
Table 1. Description of reagents used in study.
Immunocytochemistry
Immunocytochemistry was used to demonstrate expression and localization of FtMt, neurofilaments, and mitochondrial cyclooxygenase 1 (MtCox-1) in differentiated FtMt expressing clones. Different clones were plated onto chamber slides (Nunc) at 104 cells/well and differentiated for 7 days in RA-containing media. After that period, cells were rinsed with PBS, and fixed with 70% ethanol at −20°C for 30 min. The fixative solution was removed and cells dried to ensure attachment. Cells were incubated in optimal dilutions of antibody (Table 1) diluted in TBST overnight at room temperature. After washing three times with TBST, cells were incubated with optimal dilution of anti-species immunoglobulin conjugated with fluorophore (dyes used indicated in Figure legends). Cells were counterstained with DAPI to allow identification of nuclei and coverslipped with fluorescent mounting agent. Stained cells were examined using a FV1000 Olympus confocal microscope. Photos were taken from three randomly selected fields for each experiment of three independent experiments.
Cellular Fractionation and Mitochondria Isolation
To measure the subcellular localization of overexpressed FtMt, differentiated cells were fractionated using the Mitochondria Isolation kit for Mammalian Cells (Thermo Fisher, USA) to isolate a mitochondria-enriched fraction. FtMt expressors and untransfected cells were grown in T75 flasks and differentiated for 7 days with RA treatment. Mitochondria fractions were isolated from collected cells following a modification of the manufacturer's recommended protocol. In brief, cell pellets containing approximately 1.5 x 10⁷ cells were resuspended in Reagent A (with added protease inhibitors) (400 μl) and incubated on ice for 2 min. 5 μl of Reagent B was then added and pellets were gently sonicated for 5 s to ensure complete cell lysis without damaging nuclei. The lysates were centrifuged for 10 min at 700 g and the supernatants transferred to new tubes. This step was repeated to remove all nuclear material. The supernatants were then centrifuged at 12,000 g for 15 min. The pellets were resuspended in 500 μl of Reagent C and centrifuged for the same period as a wash step, while the supernatants were saved as cytosolic fractions. The protein concentration was determined for each fraction, and samples processed for western blot analysis.
Cell Replication and Neurite Elongation Measurements
Similar analysis methods were used to determine the rate of replication of undifferentiated FtMt clones compared to untransfected cells, and development of neurites of differentiated FtMt clones compared to untransfected cells. For measuring cell replication, 104 cells from different clones were plated into T25 flasks in growth media. Phase contrast images were recorded at Day 1, Day 3, Day 5, and Day 7 using an Olympus phase contrast microscope. Area occupied was used as the measure of cell numbers. The area of cells in 20x images were measured using image J software (NIH, USA). Five images taken at random were recorded at each time point for each clone. Each experiment was repeated three times. Results recorded show mean values ± standard error of mean (SEM).
For measuring neurite formation, 104 cells from each clone were plated into wells of 12-well plates in triplicate. The following day media was exchanged for differentiation media containing RA. Five images/well were recorded and analyzed for neurite elongation after 7 days using Image J software plugin NeuronJ (https://imagescience.org/meijering/). The area occupied by neurites in each field was measured and data analyzed as described above.
Cell Viability Measurements
For assessing responses to oxidative stress caused by hydrogen peroxide or cobalt chloride, a microtiter assay was used. Using 96-well-tissue culture microtiter plates, 1.5 × 10⁴ cells/well were plated in 100 μl of media. After attachment, media was exchanged for differentiation media and cells were treated for 7 days to develop a neuronal phenotype. For assessing treatments, media was exchanged for DMEM + 1% FBS to which different concentrations of hydrogen peroxide (0–250 μM) or cobalt chloride (0–200 μM) were added. Cells were incubated for 24 h and then 10 μl of cell viability reagent WST-1 (Cell Count Reagent, Nacalai-Tesque, Japan) was added to each well. Absorbance at 450 nm was recorded using a Tecan 2000 plate reader after 1, 2 and 4 h of further incubation. Changes in absorbance were calculated after subtraction of absorbance from cell-free wells. Degree of protection was calculated as percentage changes relative to untreated cells for each clone.
RNA Preparation
RNA was prepared from 7 day RA-differentiated neuronal-like cells (FtMt clones and untransfected cells) using the RNeasy plus Mini kit (Qiagen, Hilden, Germany) according to the manufacturer's instructions. RNA yield was assessed using a Nanodrop spectrophotometer (Thermo Scientific, USA), and integrity with an Agilent Bioanalyzer and RNA 6000 Nano kit (Agilent Inc, Palo Alto, USA). All RNA samples had RIN values >9 and were considered suitable for microarray analysis.
Microarray Analysis
Microarray analysis using the Applied Biosystems Human Genome U133 Plus 2.0 array (ThermoFisher Scientific, USA) was carried out as a contract analyses by Takara Bio Inc. (Kusatsu, Japan) using RNA isolated from the clone with the highest expression of FtMt, the medium expression FtMt clone, and untransfected control cells. Labeled cRNA probes from RNA were prepared using the 3' IVT Plus transcription kit (Thermo Fisher Scientific). The array contained 11 separate oligonucleotide probes to represent each of over 47,000 transcripts. Data was extracted and analyzed using Affymetrix Signal Console software. Signal intensity for each gene oligonucleotide probe was obtained based on the mean of oligonucleotide replicates after correction for normalization controls.
Microarray Data Analysis
Results of analysis of gene expression were prepared by pairwise comparison of untransfected (negative) to high FtMt expression; untransfected (negative) to medium FtMt expressor, and medium to high FtMt expressors. Intensity data for each clone for each gene probe was log2 transformed. Significant differences between gene expression values were highlighted when the difference in log2 values varied by +1 or −1 (reflecting 2.7 fold increase or decrease in expression). Adjusted p-values were provided that reflect significant differences in expression based on the 11 oligonucleotide/transcript technical replicates. Tables were prepared that highlighted significant differences in gene expression, but excluding low expressing genes marked as Absent (below background), and genes with no assigned identity. Different processes of data analysis were examined to demonstrate how altered levels of FtMt affect cellular phenotypes. Particular emphasis was placed on data mining for genes important for protection from oxidative stress, iron transport, and those involved in neuronal differentiation and phenotypes.
Real Time Reverse Transcription-Polymerase Chain Reaction
Quantification of FtMt gene expression and validation of identified genes with differential expression was carried out by real time RT-PCR with SYBR green detection using RNA from the high and medium FtMt overexpressing clones used for microarray analysis and untransfected cells, and also one additional high expressor and one low FtMt expressor clone. RNA was isolated as described above, and equal amount of RNA (0.75–1 μg total cellular RNA) from each sample was reverse transcribed using the PrimeScript RT kit with genomic DNA eraser (Takara Bio, Japan). Appropriate numbers of samples that were not reverse transcribed were analyzed to verify that amplification signal was not due to contaminating DNA.
Real time PCR was carried out using a relative standard curve method (Walker et al., 2009) for analysis using Thunderbird SYBR QPCR master mix supplemented with Rox reference dye (Toyobo, Inc, Japan). Primers (listed in Table 1) were used at 12.5 pmol/reaction, and each sample was analyzed in duplicate using triplicate biological replicates on the Roche Light Cycler 480 qPCR machine using the following program: 95°C 60 s denaturation/activation, followed by amplification program of 95°C for 15 s, 60°C for 20 s and 72°C for 30 s for 45 cycles. PCR experimental design followed most of the criteria for Minimum Information for Publication of Quantitative Real time PCR Experiments (MIQE) (Bustin et al., 2009). Primers were designed and analyzed to show absence of self-dimers or cross dimers, and this was verified by demonstration of melting curves that showed single bands.
Statistical Analysis
Statistical analyses were carried out using Graphpad Prism 7 software (La Jolla, CA). Analysis between groups and treatments were carried out by One-way or Two-Way Analysis of Variance (ANOVA) with Tukey's test of multiple comparisons to examine significance between groups. Significance was assessed if p < 0.05.
Results
Isolation of Mitochondrial Ferritin Overexpressing SH-SY5Y Cells
Using standard cell transfection methodology and a plasmid that expressed the human FtMt gene using the CMV immediate early gene promoter, we isolated by disc cloning 26 separate G418-resistant colonies and expanded them in separate cultures. These were screened for expression of FtMt protein by western blot (Supplemental Figure 1). As this image was obtained during the screening process, it used protein extracts from undifferentiated cells. As shown, there was a wide range of FtMt expression levels ranging from undetectable to high levels of expression. Isolated clones were expanded and then frozen, and for subsequent experiments, each clone was used for 6–8 passages before a new frozen vial was revived. Expression and growth of some of the highest expressors proved unstable, but final characterization was carried out on 4 separate clones as their growth and different FtMt expression levels were stable with passage.
Relative levels of FtMt mRNA and protein were measured by real time polymerase chain reaction (qPCR) and western blot. Two clones had high levels of expression of FtMt mRNA and protein (Figures 1A,B), while one had medium level of FtMt mRNA expression and low levels of detectable protein, and one had low level of FtMt mRNA expression but with no detectable protein (representative western blot: Figure 1C). The difference in mRNA expression between the low and high clones was 20-fold, and 4-fold between medium and high, but for protein levels, the difference in expression between medium and high was 22-fold. Considering the differences in mRNA expression, it might be expected that FtMt protein should be detectable in the low expressor clone. These differences between mRNA and protein would suggest that FtMt protein was being rapidly degraded. It should be noted that untransfected SH-SY5Y differentiated cells used in these experiments did not contain detectable levels of FtMt mRNA or protein.
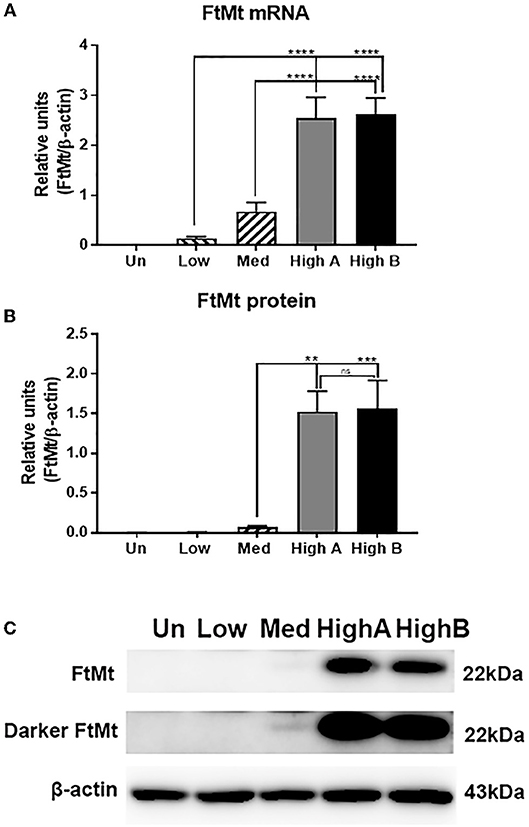
Figure 1. (A) FtMt mRNA expression in FtMt expressing clones and untransfected differentiated SH-SY5Y cells: Real time PCR results showing comparison of FtMt mRNA levels in indicated clones compared to untransfected cells normalized for levels of β-actin mRNA. Results show combination of triplicate independent experiments with 2 or 3 samples/experiment. Data analyzed by One-way ANOVA with Tukey's post-hoc comparison test. Bar charts illustrate mean ± standard error of mean (SEM). Results with p-values of significance are indicated. *p < 0.05; **p < 0.01, ***p < 0.001, ****p < 0.0001. (B) FtMt protein expression in FtMt expressing clones and untransfected differentiated SH-SY5Y cells: Western blot results showing comparison of FtMt protein levels in indicated clones compared to untransfected cells normalized for levels of β-actin protein. Results show combination of triplicate independent experiments with 2 or 3 samples/experiment. Data analyzed by One-way ANOVA with Tukey's post-hoc comparison test. Bar charts illustrate mean ± SEM. Results with p-values of significance are indicated. *p < 0.05; **p < 0.01, ***p < 0.001, ****p < 0.0001. (C) Representative Western blots of FtMt expressing clones and untransfected differentiated SH-SY5Y cells: Representative western blot image of data shown in (C). FtMt expression was highly expressed in clones High A and High B. A longer exposure was required to show FtMt protein in Medium (Med) expressing clone (Darker FtMt).
Phenotyping of FtMt Overexpressing Clones
Characterization of FtMt Expressing Clones
As elevated amounts of FtMt will increase the levels of potentially toxic iron in mitochondria, a series of experiments were carried out to determine how overexpression affected the phenotype and gene expression of clones differentiated to a neuronal phenotype. Staining of cells with antibody to FtMt showed expected clear differences in immunoreactivity intensity between medium and high expressor cells (Figures 2B,C), while the untransfected cells only showed some background staining (Figure 2A). Higher magnification images are shown in Figures 2D–E. All cells of the high expressor clone showed FtMt immunoreactivity (Figures 2C,F). The punctate immunoreactivities are consistent with mitochondrial localization. Staining of cells with pan-neurofilament antibody (SMI312) showed that all cells produced the characteristic processes of neurons (Figures 2G–I). Staining of cultures with an antibody to mitochondrial cytochrome oxidase1 (MtCox-1) showed an unexpected gradation of distribution and intensity of mitochondria in the untransfected, medium expressor and high expressor cells (Figures 2J–L). Many of the high FtMt expressing cells showed MtCox1 staining consistent with an aggregated morphology. This was confirmed by determining the percentage of cells with aggregated morphology of MtCox-1 immunoreactivity. This showed significant increase between the untransfected and high expressing clone (Figure 2M).
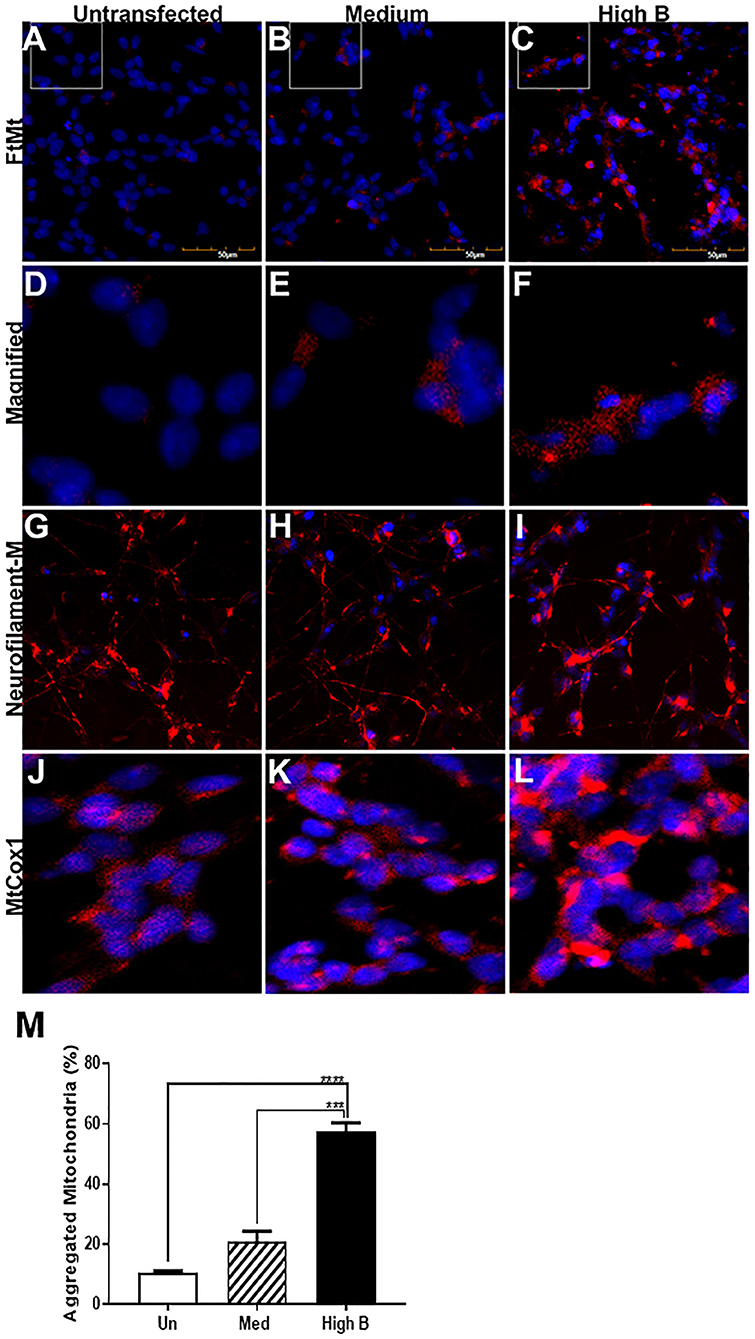
Figure 2. Immunocytochemistry of FtMt expressing clones. (A–C). Untransfected (A), Medium (B), and High B (C) clones differentiated for 7 days stained with antibody to FtMt to identify positive expressing cells. Positive staining is observed for Medium and High B clone, but not untransfected cells. Antibody reacted cells were identified by reaction with Alexa568 labeled-anti rabbit immunoglobulin G. All images were recorded using an Olympus FV1000 laser confocal microscope. (D-F). Higher magnification images of FtMt antibody reacted cells. Images from areas indicated with white lines on (A–C). (G–I) Untransfected (G), Medium (H), and High B (I) clones differentiated for 7 days stained with antibody SMI-312 that stains neurofilament proteins, but predominantly NF-M. All cells showed SMI-312 positive neuronal processes consistent with differentiated morphology. Undifferentiated cells show no staining for SMI312 (not shown). Antibody-reacted cells were identified by reaction with Alexa568 labeled-anti mouse immunoglobulin (G). (J–L). Untransfected (J), Medium (K), and High B (L) clones differentiated for 7 days stained with antibody MtCox1 that stains mitochondrial cytochrome oxidase-1. Morphology of MtCox1 immunoreactive mitochondria in FtMt expressing clones (K-Medium and L- High B) compared to untransfected cells (J). Antibody reacted cells were identified by reaction with Alexa568-labeled anti mouse immunoglobulin (G). (M) Quantitative estimation of aggregated/abnormal mitochondria. Estimation of percentage of aggregated mitochondria in untransfected (Un), Med, and High B expressing clones. The numbers were estimated by visual examination of 3 fields/image and 3 images for each clone at magnification shown in (A–C). Results show mean ± SEM, with standard significance levels indicated from data analyzed by one way ANOVA with Tukey post-hoc test. ***p < 0.001, ****p < 0.0001.
Subcellular Localization of Mitochondrial Ferritin
Quantification of MtCox-1 expression by western blots of total cell lysates detected the opposite pattern with significantly higher levels in untransfected neurons (Figures 3A,B). The reason for this discrepancy requires further investigation, but both data suggest abnormalities of mitochondria.
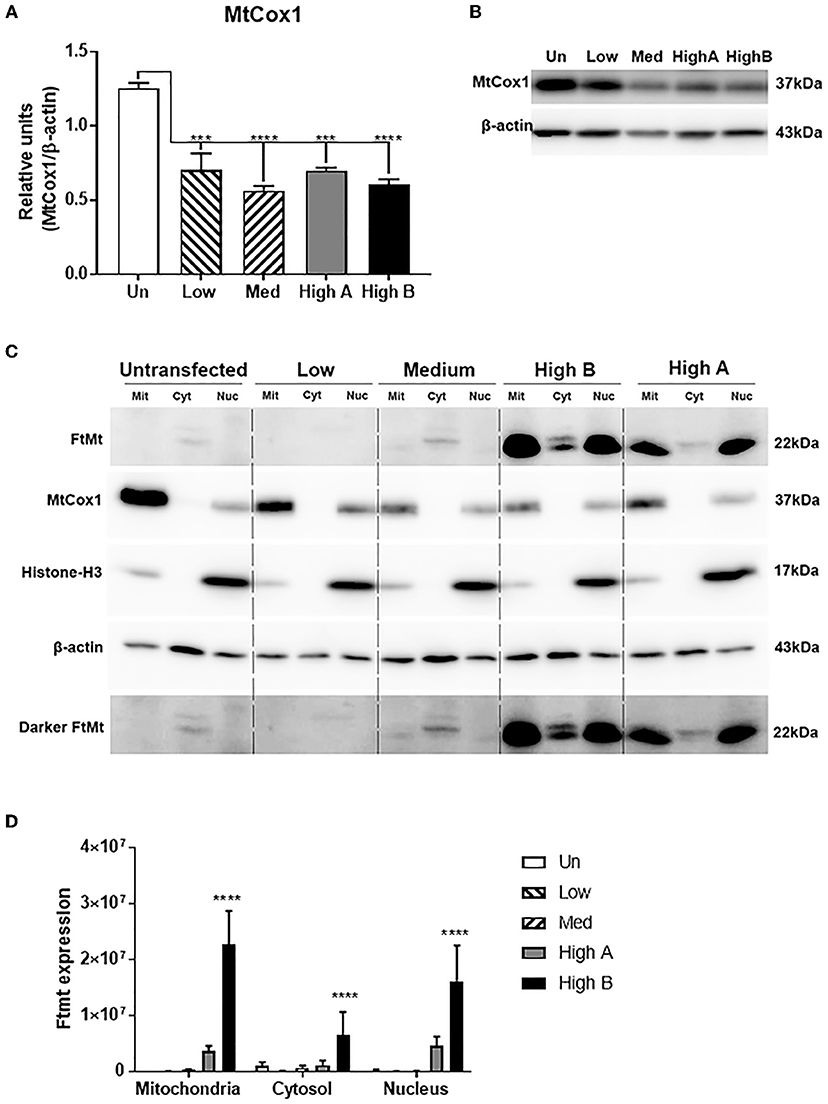
Figure 3. Characterization of mitochondria in FtMt expressing clones. (A,B) Western blot measurements of MtCox-1 in whole cell extracts. Measurement of Mt Cox-1 in total cell lysates by western blots gave the reverse result compared to immunocytochemistry. There were significantly reduced levels of MtCox-1 protein in FtMt expressing clones. Results based on triplicate determinations. The different patterns of expression are shown in representative western blot. (C) Composite western blot panel of subcellular fractions from FtMt expressing clones. Cell extracts from differentiated clones fractionated into mitochondria (Mit), cytosol (Cyt), and nucleus (Nuc) fractions were analyzed by western blot and probed with antibodies to FtMt, MtCox1, Histone -H3, and β-actin. The results for MtCox1 and Histone-H3 indicate that the mitochondria contain some contaminating nuclei, and the nuclei contain some contaminating mitochondria. The results show that the majority of overexpressed FtMt is present in mitochondria though the abundance in nucleus is higher than might be expected from mitochondria contamination. Enhanced exposure was needed to demonstrate FtMt in Med clone (Darker Ftmt). A non-specific band of higher molecular weight than FtMt. is detected in cytosol fraction. (D) Quantitative estimation of results in (A). Results show relative levels of FtMt protein in different fractions from FtMt expressing clones. Results are not normalized and represent signal intensities from triplicate experiments. Results show mean ± SEM, with standard significance levels indicated from data analyzed by one way ANOVA with Tukey's post-hoc test. ***p < 0.001, ****p < 0.0001.
The levels of FtMt protein in different cellular fractions, particularly mitochondria, were measured by western blot. The method used produced a mitochondria-enriched fraction, and also a nuclear and cytosolic fraction, from each cell extract. The question being asked was whether the considerably increased amounts of FtMt being produced by overexpressing cells accumulated predominantly in the mitochondria fraction. The western blots were representative of distinct experiments carried out in triplicate (Figure 3C). The results showed that FtMt was predominantly detected in the mitochondria fraction, but a certain amount could also be detected in the nuclear fraction of the highest expressing clone (Figure 3C - HighB). The levels of FtMt in the nuclear fraction of this clone were higher than might be expected from contamination of this fraction by mitochondria. In the cytosolic fraction, we detected two polypeptide bands of slightly higher molecular weight than processed FtMt. As these were also detected in the untransfected cells that lack FtMt RNA, these bands were considered as non-specific. Similar to Figure 3B, the western blots showing levels of MtCox1 in the different fractions showed larger amounts of this protein in the untransfected cells. The relative intensities of FtMt in the different fractions are illustrated in Figure 3D.
Alteration in Expression of Neuronal Proteins
To determine if FtMt overexpression affects neuronal phenotype upon differentiation, expression levels of key neuronal proteins-neurofilament M (NF-M); synapse-associated proteins, postsynaptic density protein 95 (PSD95) and synaptosomal-associated protein-25 (SNAP-25)- were measured by western blotting (Figure 4). To confirm the effect of retinoic acid differentiation on expression of proteins, differentiated, and undifferentiated cells from untransfected and High B FtMt clone were analyzed for NF-M, PSD-95, SNAP-25 and FtMt (Figure 4A), which shows that these neuronal proteins were upregulated by RA differentiation. Surprisingly, it was also observed that there was increased amounts of FtMt in the overexpressing clone following RA treatment. This was unexpected as FtMt in these clones was being expressed using the plasmid CMV IE promoter not the native FtMt promoter.
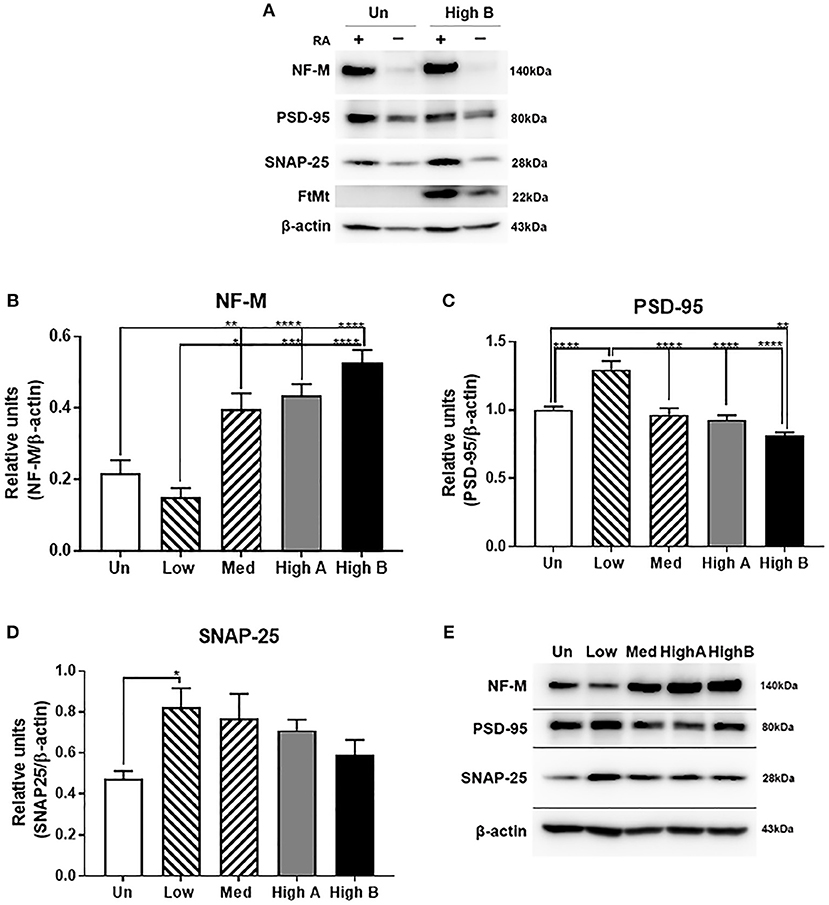
Figure 4. Expression of neuronal proteins in FtMt clones. (A) Composite picture of western blots showing the differences in levels of NF-M, PSD-95, SNAP-25, and FtMt between undifferentiated (-) and RA differentiated (+) of untransfected (Un) and FtMt high expressing clone (High B). It was noticed in all experiments that FtMt expression was increased with differentiation RA treatment, even though the expression vector was using the CMV immediate-early promoter, and not the native FtMt promoter. (B) Relative levels of NF-M (B) in different FtMt clones. Results shown in B represent mean ± SEM of triplicate experiments. Data analyzed by One way ANOVA with Tukey's post hoc test of significance. Results indicate level of significance. *p < 0.05; **p < 0.01, ***p < 0.001, ****p < 0.0001. (C) Relative levels of PSD-95 (C) in different FtMt clones. Results shown in C represent mean ± SEM of triplicate experiments. Data analyzed by One way ANOVA with Tukey's post-hoc test of significance. Results indicate level of significance. *p < 0.05; **p < 0.01, ***p < 0.001, ****p < 0.0001. (D) Relative levels of SNAP-25 (D) expression in different FtMt clones. Results shown in -D represent mean ± SEM of triplicate experiments. Data analyzed by One way ANOVA with Tukey's post-hoc test of significance. Results indicate level of significance. *p < 0.05. (E) Composite Western blot showing pattern of expression for NF-M, PSD-95, and SNAP-25. Representative western blots of one experiment showing patterns of expression in untransfected and different FtMt clones. Experiment represents the sequential probing of single membrane for NF-M, PSD-95, and SNAP-25 followed by normalization for β-actin.
There were significantly higher levels of NF-M in higher FtMt overexpressing clones compared to the untransfected and low expressor (Figure 4B). By comparison the low expressor had significantly higher levels of the synaptic proteins PSD-95 (Figure 4C) and SNAP25 (Figure 4D). The pattern of expression for both proteins between the different cell types analyzed was similar with decreasing expression from low to high. A composite western blot showing these three proteins along with β-actin normalization for one representative experiment is shown (Figure 4E). NF-M, PSD-95, SNAP-25, and β-actin were sequentially detected on the same membrane. Although we could not detect FtMt protein by western blot in the analyses made in the low FtMt expressing clone, we did show significant expression of FtMt mRNA in these cells compared to untransfected cells, and assume that small amounts of FtMt protein are functional in this clone, but the turnover of this protein makes it undetectable. Further investigations are needed to improve sensitivity of detection, but these results and subsequent data suggest this low FtMt expressing clone has significant differences from untransfected cells.
Alteration in Expression of Amyloid Precursor Protein, Tau, and α-synuclein
Similar analyses were carried out for expression of amyloid precursor protein (APP) and microtubule associated protein tau, proteins associated with AD pathology, and α-synuclein, which is associated with PD (Figure 5). Expression of APP was generally higher in FtMt-expressing clones with highest levels of expression in the lowest expressing clone (Figure 5A). By contrast, a different pattern was seen for tau, with significantly increased expression in the medium FtMt expressor (Figure 5B). Highest α-synuclein expression was also observed in this clone, but the magnitude of change was less than for tau (Figure 5C). A composite western blot showing these three proteins along with β-actin normalization for one representative experiment is shown (Figure 5D). APP, tau, α-synuclein and β-actin were sequentially detected on the same membrane. The pattern of expression for tau was also observed in the gene expression analyses of these clones (see Table 7—MAPT).
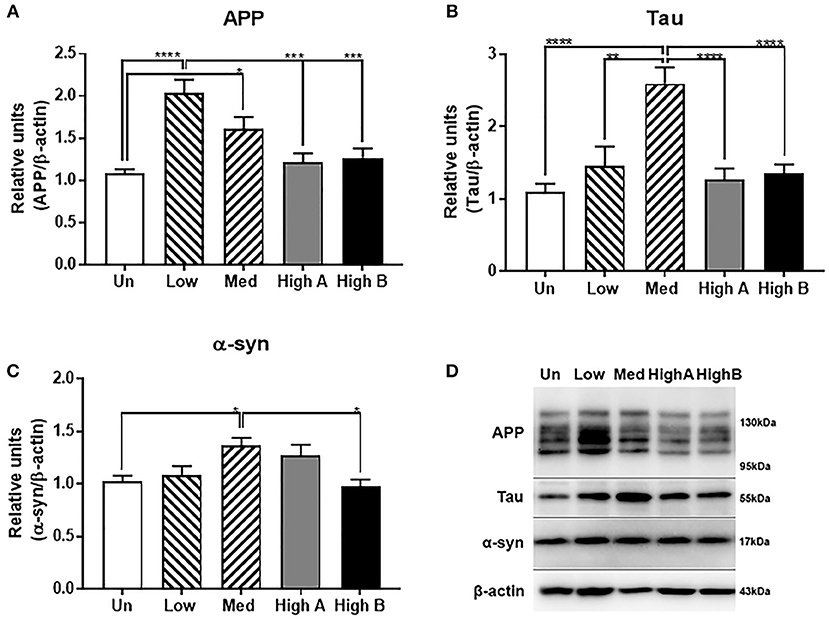
Figure 5. Expression of neuronal disease-associated proteins in FtMt clones. (A) Relative levels of amyloid precursor protein (APP) in different FtMt clones. Results shown represent mean ± SEM of triplicate experiments. Data analyzed by One way ANOVA with Tukey's post-hoc test of significance. Results indicate level of significance. *p < 0.05; **p < 0.01, ***p < 0.001, ****p < 0.0001. (B) Relative levels of Tau in different FtMt clones. Results shown represent mean ± SEM of triplicate experiments. Data analyzed by One way ANOVA with Tukey's post-hoc test of significance. Results indicate level of significance. *p < 0.05; **p < 0.01, ***p < 0.001, ****p < 0.0001. (C). Relative levels of α-synuclein (α-syn) in different FtMt clones. Results shown represent mean ± SEM of triplicate experiments. Data analyzed by One way ANOVA with Tukey's post-hoc test of significance. Results indicate level of significance. *p < 0.05. (D) Composite Western blot showing pattern of expression for APP, tau, and α-synuclein. Representative western blots of one experiment showing patterns of expression in untransfected and different FtMt clones. Experiment represents the sequential probing of single membrane for APP, tau, and α-synuclein followed by normalization for β-actin.
Effect of FtMt Overexpression on Neuronal Phenotypes
Cell Division and Neurite Formation
Comparison was made between undifferentiated clones of their rate of growth (Figure 6A) (Table 2A) and neurite formation (Figure 6C) (Table 2B). Representative photomicrographs for these experiments are shown in Figures 6B,D. These analyses showed that FtMt expressing clones replicated at a slightly faster rate over 7 days than the untransfected parent cells. By comparison, the medium expressor and high expressor clones produced significantly less density of neurites after retinoic acid differentiation for 7 days.
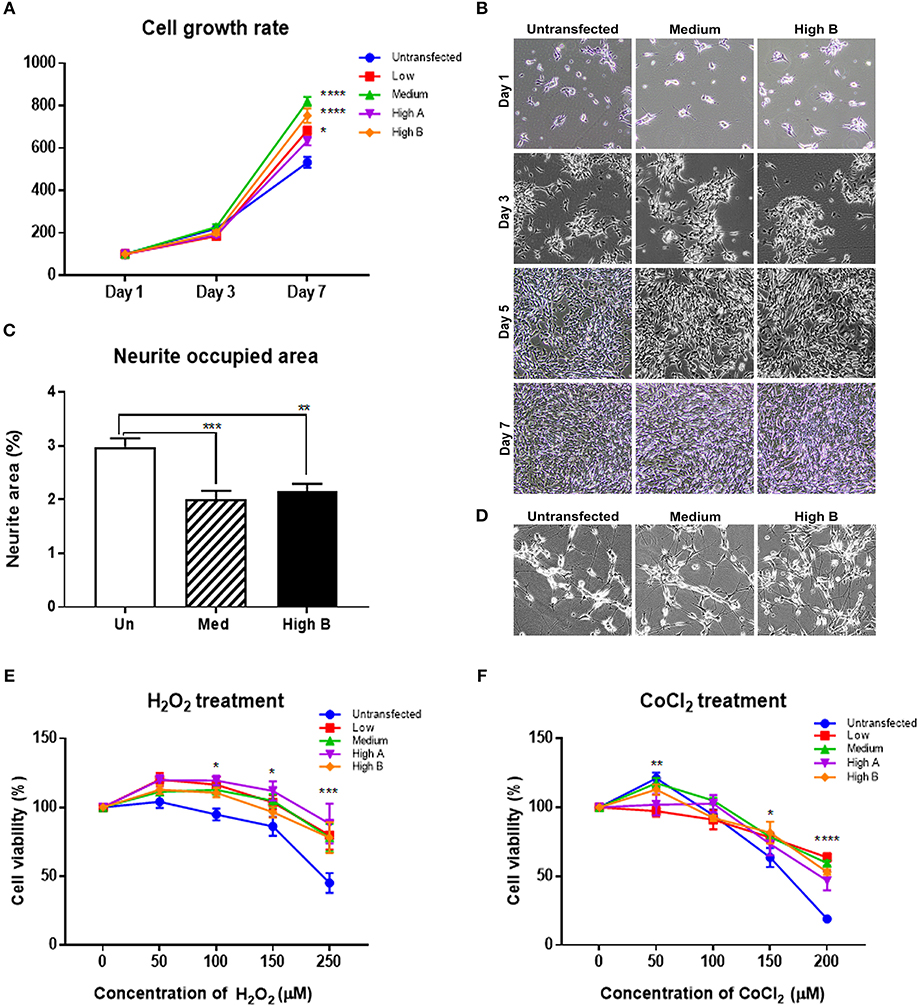
Figure 6. Phenotyping of FtMt expressing neuronal cells. (A,B) Measurements of Cell Growth Rates of Undifferentiated FtMt clones. (A) Results showing relative increase in cell area occupied as percentage of Day 1 of FtMt clones and untransfected cells. Results show analyses at Day 7. Measurements involved area occupied of growing cells identified using Image J image analysis software. Data analyzed by Two-way ANOVA. Relative statistical differences between clones and are listed in Table 2A. (B) Representative photomicrographs of proliferating clones untransfected, Medium FtMt expressor and High B FtMt expressor at Day 1, Day 3, Day 5, and Day 7. (C,D) Measurements of Neurite formation of Differentiated FtMt clones. (C) Results showing relative area occupied of neuritic processes at day 7 of untransfected (Un), Medium FtMt expressor (Med) and High Ft expressor (High B). Measurements involved measuring area occupied of neurites identified using NeuronJ plugin of Image J image analysis software. Results are representative of triplicate experiments. Relative statistical differences between clones listed in Table 2B. (D) Representative photomicrographs of differentiated, untransfected, Medium FtMt expressor and High B FtMt expressor at Day 7. (E,F) Responses of FtMt overexpressing clones to oxidative stress. (E) Changes in cell viability (as percentage of untreated cultures) with increasing doses of hydrogen peroxide (H2O2) (0–250 μM). Untransfected and FtMt expressing clones were differentiated in microtiter plate wells for 7 days. Treatments added to media lacking RA containing 1% FBS on day 7 for 24 h. Cell viability assessed by added WST-1 reagent after 24 h. Absorbance (450 nm) measured after 1, 2, and 4 h. Results presented (mean ± SEM) of six wells/treatment and combination of three independent experiments. Data analyzed by Two Way ANOVA. Relative statistical differences between clones and treatments are listed in Table 3A. (F) Changes in cell viability (as percentage of untreated cultures) with increasing doses of Cobalt Chloride (CoCl2) (0–200 μM). Untransfected and FtMt expressing clones were differentiated in microtiter plate wells for 7 days. Treatments added to media lacking RA containing 1% FBS on day 7 for 24 h. Cell viability assessed by added WST-1 reagent after 24 h. Absorbance (450 nm) measured after 1, 2, and 4 h. Results presented (mean ± SEM) of six wells/treatment and combination of three independent experiments. Data analyzed by Two-way ANOVA. Results indicate level of significance. *p < 0.05; **p < 0.01, ***p < 0.001, ****p < 0.0001. Relative statistical differences between clones and treatments are listed in Table 3B.
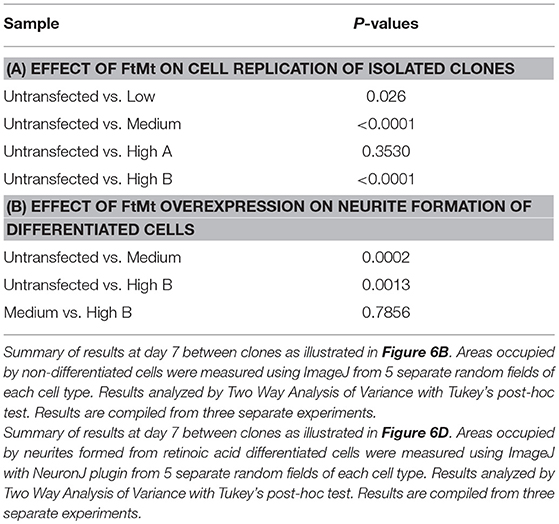
Table 2. Effect of FtMt overexpression on Cell division and differentiation.
Resistance to Oxidative Stress From Hydrogen Peroxide or Cobalt Chloride
Cytotoxicity assays were carried out using hydrogen peroxide and cobalt chloride as inducers of oxidative stress to determine if the FtMt expressing clones showed more resistance to these agents. These agents induce oxidative stress through different mechanisms, with hydrogen peroxide being a direct source of reactive oxygen species and cobalt chloride modeling oxidative stress caused by hypoxia (Yu and Gao, 2013). FtMt expressing clones appeared significantly more resistant to the toxic effects of hydrogen peroxide compared to untransfected cells (Figure 6E). Summary of statistical pairwise comparison for different doses of hydrogen peroxide is shown in Table 3A. These results confirm an earlier observation that differentiated cells are more resistant to different oxidative stress inducing factors (Cecchi et al., 2008; Cheung et al., 2009; Lee et al., 2015; Forster et al., 2016). A similar pattern of resistance was shown to cobalt chloride with significant protection in FtMt overexpressing clone (Figure 6F). Summary of statistical pairwise comparison for different doses of cobalt chloride is shown in Table 3B.
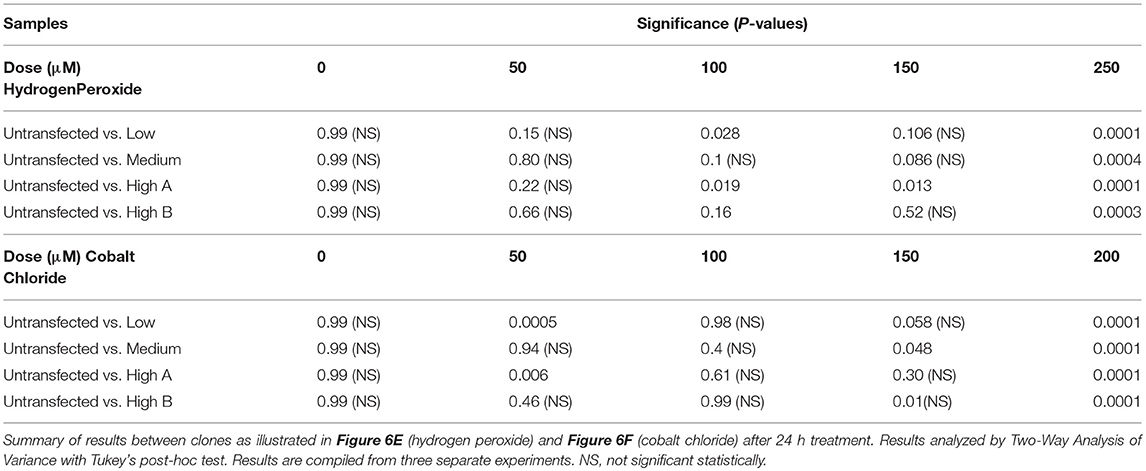
Table 3. Effect of FtMt overexpression on resistance to oxidative stress by hydrogen peroxide and cobalt chloride.
Gene Expression Profiling of FtMt Overexpressing Neuronal Cells
Gene expression profiling using microarrays was carried out with RNA derived from High (B) expressor, medium expressor and untransfected RA-differentiated neurons. Complete results are provided in a searchable Microsoft Excel file (Supplemental File 1) that shows all expression intensities of indicated genes for these clones. For analysis of differential gene expression, expression intensities were log2 transformed and differences of 1 log2 or greater (more than 2.7 fold) were considered of significance. The microarray platform used for these analyses did not include probes for FtMt, so we cannot directly compare gene expression values with levels of FtMt expression.
Initial inspection of this large dataset revealed that expression of many genes were marked as absent (below the level of detection). It was decided not to consider results from any genes where one or more of the values were tagged as absent. Another noticeable feature was that a number of genes had multiple results that were attributed to different Genbank accession numbers. This indicated different results depending on the gene sequence used to design the oligonucleotide probes on the microarray. Our analysis only considered the gene set with the highest expression values as low expression values tended to be highly variable and therefore less reliable. Finally, we excluded from analyses unassigned or uncharacterized genes even though some showed significant differential expression. Expression of commonly used housekeeping genes (ACTB, GAPDH, TUBB, PPIA, HPRT1, G6PD, B2M) showed no significant differences (<1 log2 difference) between the different analyzed cells.
Table 4 presents the top 20 upregulated and downregulated genes selected in order between the high FtMt expressor and untransfected neurons (left columns) and in adjacent columns, the differences between medium expressor and untransfected (middle columns) and between high and medium expressors (right columns). A complete list is presented in Supplemental Data that lists all genes with differential expression of >1 log2 (Supplemental File 2). Table 5 presents the top 20 upregulated and downregulated genes selected in order between the medium FtMt expressor and untransfected neurons (left columns) and in adjacent columns, the differences between high expressor and untransfected (middle columns) and between high and medium expressors. Table 6 presents the top 20 upregulated and downregulated genes selected in order between the high FtMt expressor and medium FtMt expressor (left columns), and in adjacent columns, the differences between high expressor and untransfected cells (middle columns) and between medium and untransfected cells (right column). Most of these genes followed the pattern of highest or lowest expression in high FtMt expressor, followed by moderate FtMt expressor, followed by untransfected cells (Complete gene lists for Table 5, 6 are included in Supplemental Files 3, 4).
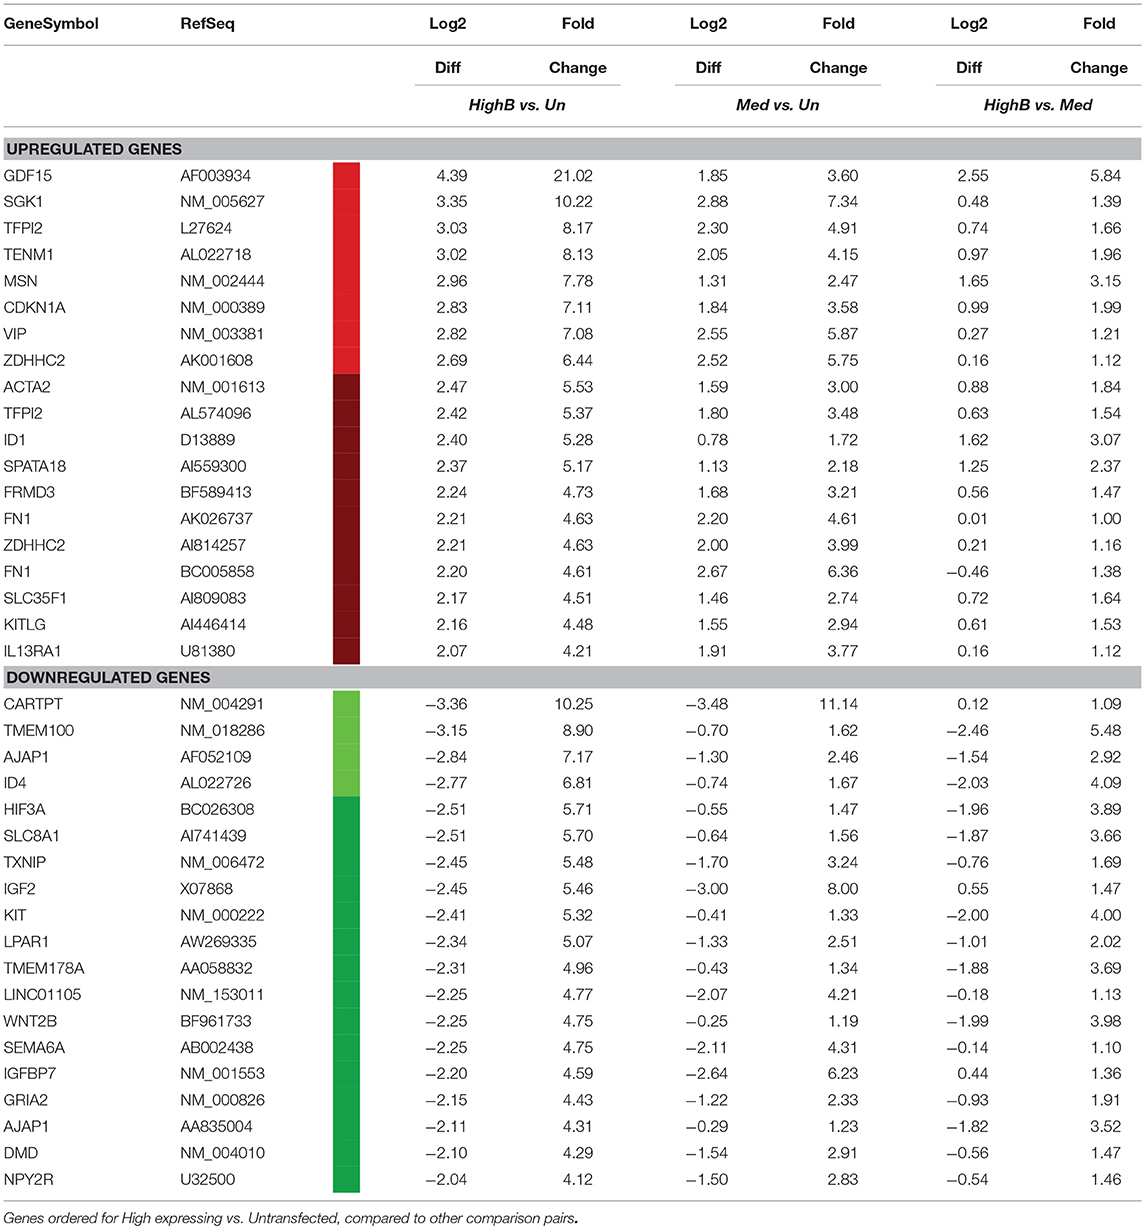
Table 4. Differential Genes expressed by FtMt overexpressing SH-SY5Y neuronal cells.
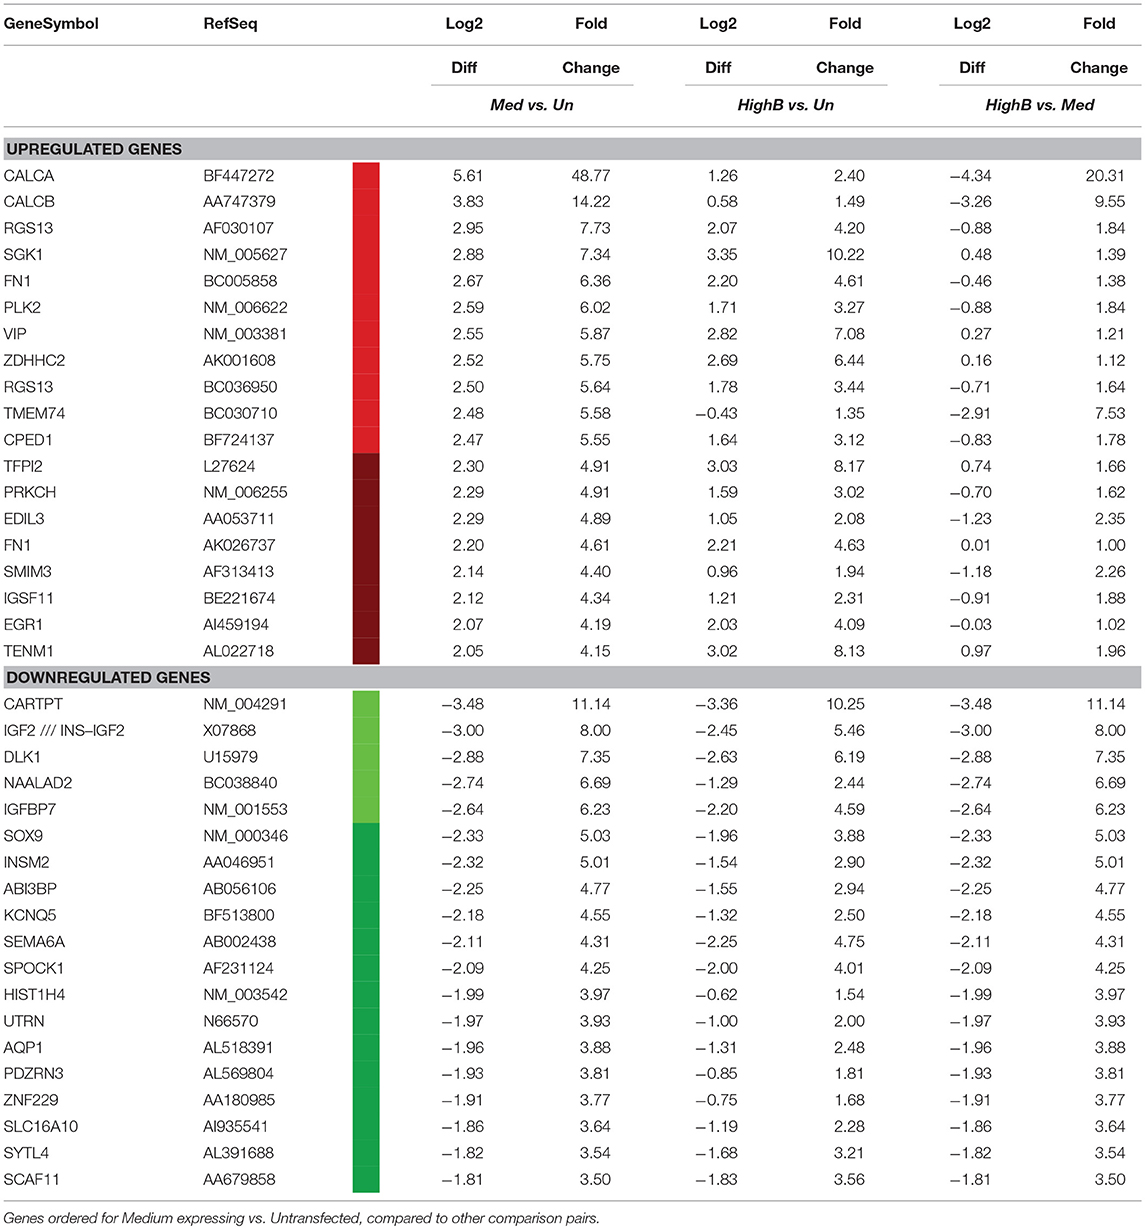
Table 5. Differential Genes expressed by FtMt overexpressing SH-SY5Y neuronal cells.
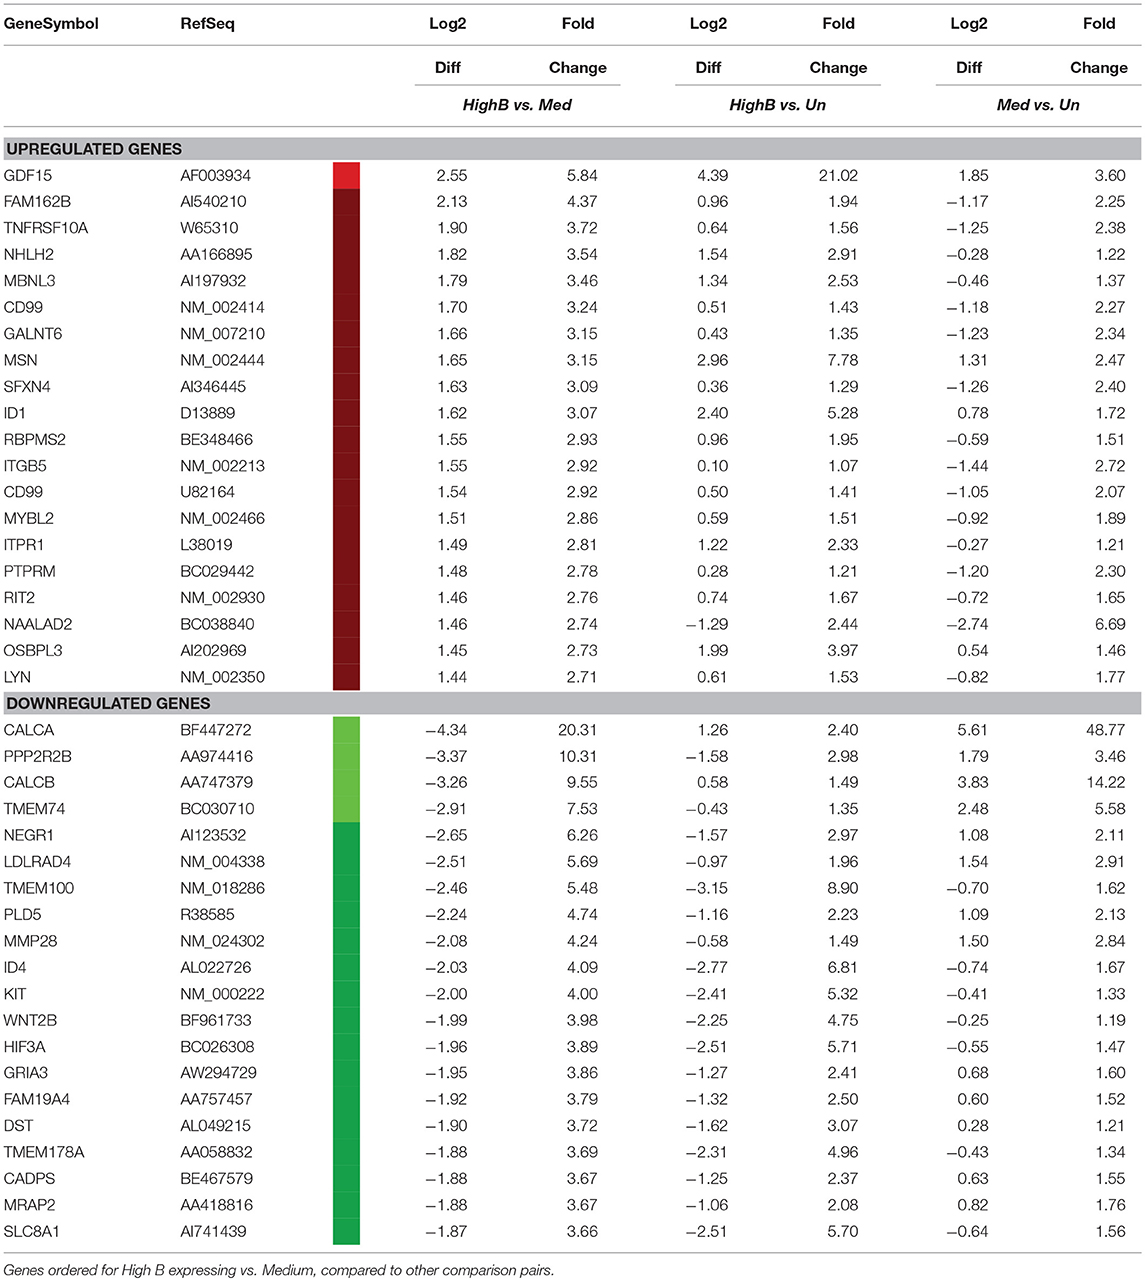
Table 6. Differential Genes expressed by FtMT overexpressing SH-SY5Y neuronal cells.
Genes Associated With Neuronal Structure and Differentiation
Further data mining of the gene expression profiling data had revealed changes in a class of differentiation genes designated Inhibitor of Differentiation or Inhibitor of DNA-binding (ID) 1-4. These genes have been shown to be downregulated with RA treatment of neuroblastomas (Lopez-Carballo et al., 2002; Peddada et al., 2006). The data show increased expression between high expressor FtMt and untransfected neurons for ID1, ID2, and ID3, but reduced expression for ID4 (Table 7). For all of these listed genes, there were intermediate levels of expression in medium expressor FtMt clone. Table 7 also shows the gene expression results for a number of neuronal structural genes that were measured by western blot. Two tables of genes of interest related to iron metabolism and oxidative stress are also presented as Supplemental File 5). The majority of these genes did not show significant changes, but are involved in many of the key processes associated with FtMt function.
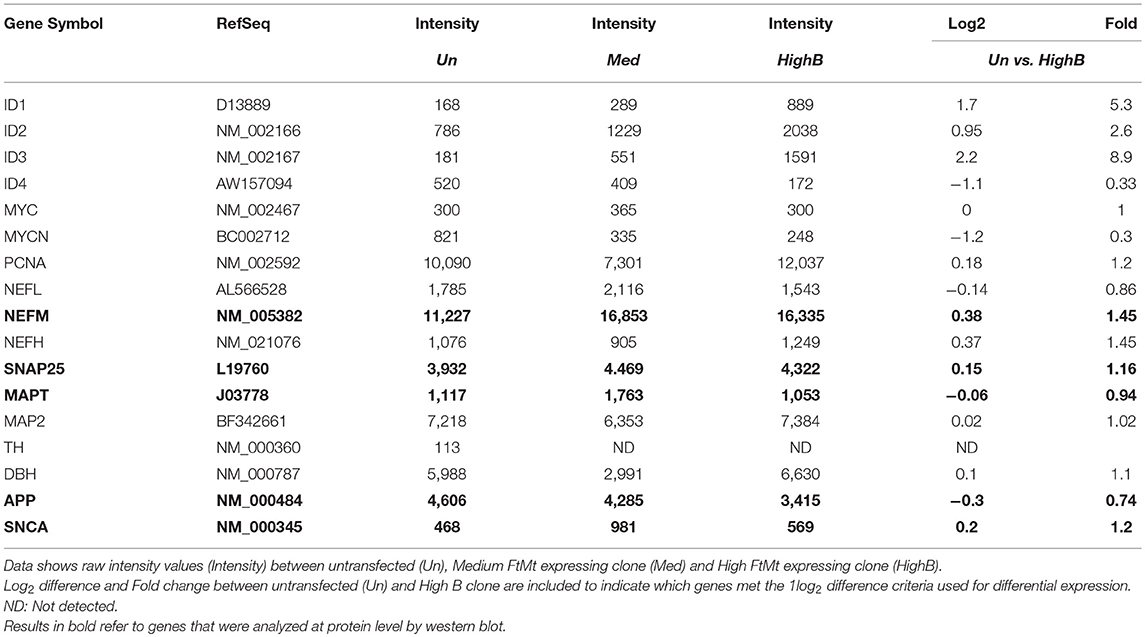
Table 7. Differential expression of genes associated with neuronal structure and differentiation.
Validation of Genes Associated With Oxidative Stress
Although there are multiple criteria available for selecting genes of interest to study further, one of the central goals of the experiments was to investigate novel mechanisms associated with FtMt protection from oxidative stress. With this in mind, examination of the expression data indicated significant changes in expression of thioredoxin-interacting protein (TXNIP). This protein has multiple functions, but one key role is binding and inactivating reduced thioredoxin, a major cellular anti-oxidant. Increased amounts of cellular TXNIP will reduce the protective effects of thioredoxin. Gene expression data indicated relatively high expression in untransfected SH-SY5Y neurons, and considerable reduction in FtMt expressing clones. The highest reduction in TXNIP mRNA was in the high FtMt expressor, with less reduced in medium FtMt expressor, compared to untransfected cells. Three separate analysis for TXNIP were carried out on the microarray using separate probe sequences, but all showed similar results with reduction ranging from 5.5 fold to 3.8 fold. To confirm these findings, qPCR validation was carried out for TXNIP and TXN1 (Figures 7A,C). It is noticeable the considerable difference in TXNIP expression between the two different high FtMt expression clones. Both confirmed considerable reduction compared to untransfected cells (Figure 7A). For TXN, consistent with the microarray data that indicated a small non-significant increase in TXN expression in the high expressor clone, PCR validation produced similar result (Figures 7B,C); confirming that TXN expression is relatively unchanged. This is consistent with a protective mechanism involving reduced TXNIP levels. We have observed these differences in expression patterns between the two high expressor clones for TXNIP as well as some other genes that have to be further investigated. A western blot for TXNIP protein in these cells confirmed highest levels in untransfected cells, and least in the high expressor clones (High A and High B) (Figure 7B).
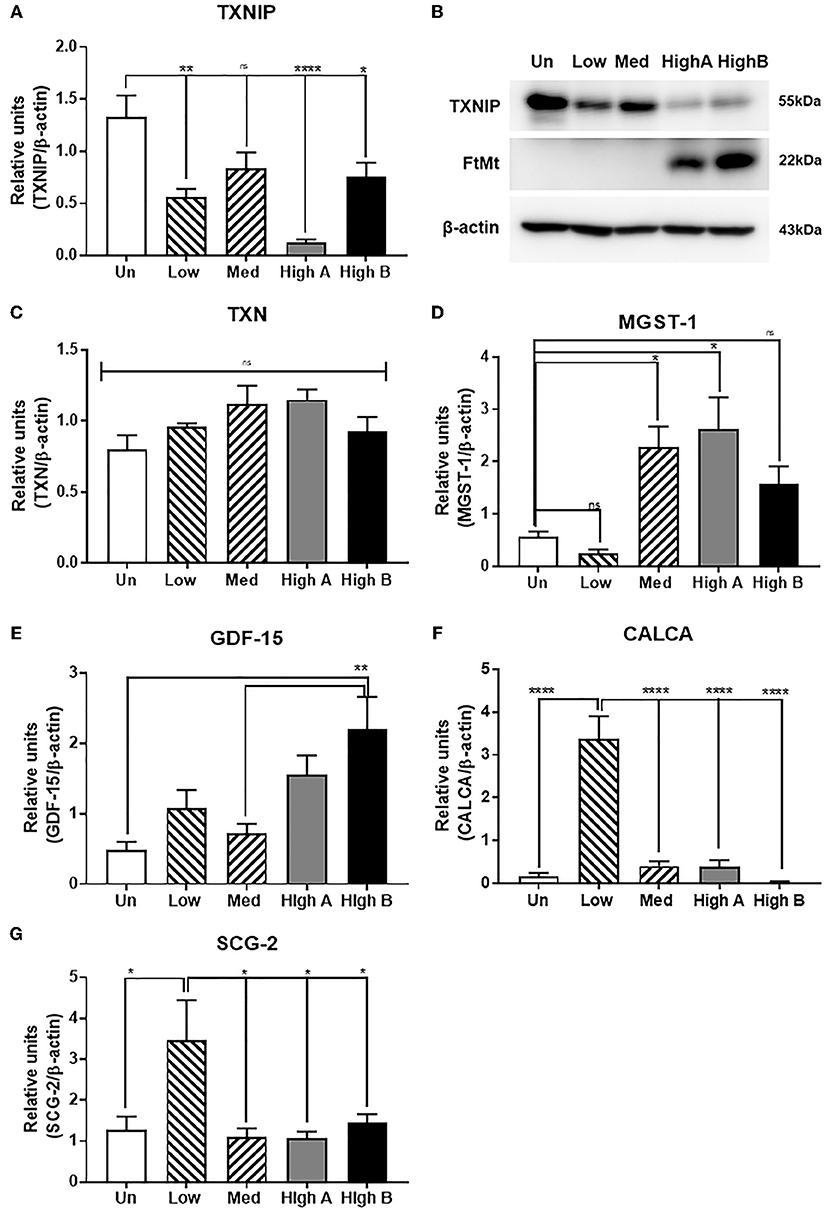
Figure 7. Validation of expression of key differentially expressed genes identified by microarray. (A) Real time PCR measurement of expression of thioredoxin-interacting protein (TXNIP) in different clones. Results are combined of three independent experiments. Data analyzed by one-way ANOVA with Tukey's post-hoc test of significance. Results indicate level of significance. *p < 0.05; **p < 0.01, ***p < 0.001, ****p < 0.0001. (B) Western blot showing relative levels of TXNIP protein in different clones compared to expression of FtMt and β-actin. ns: not significantly different (C) Real time PCR measurement of expression of thioredoxin (TXN) in different clones. Results are combined of three independent experiments. Data show no significant differences between expression levels of different clones. (D) Real time PCR measurement of expression of microsomal glutathione transferase (MGST)−1 in different clones. Results are combined of three independent experiments. Data analyzed by one-way ANOVA with Tukey's post-hoc test of significance. Results indicate level of significance. *p < 0.05; **p < 0.01. (E) Real time PCR measurement of expression of growth differentiation factor-15 (GDF-15) in different clones. Results are combined of three independent experiments. Data analyzed by one-way ANOVA with Tukey post-hoc test of significance. Results indicate level of significance. **p < 0.01. (F) Real time PCR measurement of expression of calcitonin gene related peptide alpha (CALCA) in different clones. Results are combined of three independent experiments. Data analyzed by one-way ANOVA with Tukey's post-hoc test of significance. Results indicate level of significance. **p < 0.01. (G) Real time PCR measurement of expression of secretogranin-2/chromogranin C (SCG-2) in different clones. Results are combined of three independent experiments. Data analyzed by one-way ANOVA with Tukey's post-hoc test of significance. Results indicate level of significance. *p < 0.05.
Another gene target of interest was microsomal glutathione transferase-1 (MGST1), which is localized to mitochondria, and is protective from oxidative stress (Figure 7D). Increased expression of MGST1 would also be protective from oxidative stress. Although the microarray data showed significant differences in expression of transferrin receptor (TFRC) between clones, this was not validated by qPCR analyses (data not shown).
Validation of Growth Factor Associated Genes
Three genes belonging to different classes of growth factor/neuroendocrine factors with the significant levels of differential expression (see Tables 4–6) were identified for validation. The genes GDF15 (growth differentiation factor 15), CALCA, SCG2, and CHGA share some common functions but were shown to have different expression profiles by microarray. Changes in expression of GDF15 (Figure 7E), CALCA (Figure 7F), and SCG2 (Figure 7G) for separate clones are shown with indicated significance between groups share common functions.
Discussion
A number of studies have demonstrated that increased levels of FtMt in cells have significant protective effect from a range of insults linked to production of ROS, including those associated with neurodegenerative disease mechanisms. These previous studies have shown that protection can be conferred even with small levels of increased FtMt (Shi et al., 2010; Wang Y. Q. et al., 2016; You et al., 2016; Gao et al., 2017; Li J. et al., 2017). Although expressed at low levels compared to ubiquitious iron binding proteins such as ferritin, the protective effect would appear to come from its specific localization to mitochondria, the major cellular source of ROS (Nesi et al., 2017).
The significant protective effects of FtMt from insults associated with AD and PD have indicated that this protein might be a therapeutic target for these diseases. Gene delivery methods are feasible for targeted delivery to involved tissues, but it does raise the question about the consequences of overexpression of a protein that could be toxic to mitochondria. Several studies have utilized the widely used SH-SY5Y neuroblastoma cell as a model to study effects of FtMt, but all of these studies used undifferentiated cells. Some studies employed the mouse FtMt gene for overexpression in SH-SY5Y cells (Shi et al., 2010). The cleaved FtMt proteins only show 88% homology at the amino acid level and within this sequence, the human FtMt only has 2 cysteines while the mouse FtMt protein has 4. This difference can not only affect the redox properties of the protein but also its secondary structure. Because of these features, some differences in function are possible. For this study, we attempted to advance the previous models by establishing stable overexpression of human FtMt in SH-SY5Y, and then study them in a differentiated state as a simplified model of human neurons. Earlier studies have shown increase in mature neuronal features if SH-SY5Y cells were differentiated with retinoic acid (Nicolini et al., 1998; Simpson et al., 2001; Lopez-Carballo et al., 2002), and that differentiated SH-SY5Y neurons are more resistant to oxidative stress inducing toxins (Cecchi et al., 2008; Cheung et al., 2009; Lee et al., 2015; Forster et al., 2016) than undifferentiated cells. Retinoic acid differentiated SH-SY5Y cells were shown to express a significantly larger panel of mature neuronal genes (Pezzini et al., 2017).
In this study, we isolated a number of FtMt-expressing SH-SY5Y clones. Some of the clones proved unstable, but several clones that had relatively stable levels of FtMt expression after 2-3 passages showed normal cell growth and replicated at a significantly higher rate than untransfected cells. This finding is in contrast to one study that concluded that FtMt overexpression slowed the rate of neuroblastoma cell division (Shi et al., 2015). The overexpressing clones produced neurites at a lower density than untransfected cells. High FtMt expression did not affect the viability of cultures, but immunocytochemical staining for FtMt and the mitochondrial marker MtCox1 showed a higher number of aggregated mitochondria, a possible sign of mitochondrial damage. Analysis of nuclear, mitochondrial, and cytosolic fractions from the highest expressor FtMt clones showed that the majority of overexpressed FtMt was localized to mitochondria, though some could be detected in the nuclear fraction.
The value of the clones isolated for future studies is their expression of different levels of FtMt mRNA. The difference in expression ranged was 20-fold from lowest to highest. The lowest FtMt expressor expressed readily detectable mRNA by qPCR, but we were unable to detect protein in these cells. This is unexpected as the difference in mRNA expression levels would indicate that protein should be detectable. It is possible that some mechanism is involved in the rapid degradation of the low level of protein. This is being investigated, but to date the mechanisms of FtMt processing and degradation have not been identified. This hypothesis is strengthened if you consider the medium expressor clone, which expressed 3.9-fold less RNA than the highest expressor, but 22.1-fold less protein. Future experiments will include the use of inhibitors of proteosomal degradation and autophagy to determine if these affect cellular FtMt levels. Unlike in some other studies, the untransfected isolate of SH-SY5Y cells used to produce the transfected clones expressed no detectable FtMt RNA or protein. These experiments used a different SH-SY5Y isolate compared to experiments which we previously reported (Guan et al., 2017).
The characterization of FtMt overexpressing cells showed differences in expression of mature neuronal proteins. The differences in levels of NF-M, PSD-95, and SNAP-25, along with the disease-associated proteins APP, tau, and α-synuclein suggest changes in neuronal properties. Further studies will determine if FtMt overexpression affects cellular production of the Aβ peptide from APP, or the levels of phosphorylated tau or α-synuclein, which are associated with AD or PD pathology. The use of these experimental models of stable FtMt overexpression for studying changes in aggregation or phosphorylation of tau and α-synuclein would be feasible.
A potentially significant new finding from the gene array data has been linking overexpression of FtMt to downregulation of TXNIP expression. TXNIP is a member of the alpha arrestin protein family that regulates and binds to reduced thioredoxin (TXN) and can be induced in response to oxidative stress, calcium influx and hyperglycemia (Kim et al., 2012). TXNIP has many identified functions, but is an important regulator of thioredoxin activity. Thioredoxin, a thiol-oxidoreductase, is a major regulator of cellular redox signaling which protects cells from oxidative stress (Mahmood et al., 2013). Binding of thioredoxin and TXNIP inhibits the anti-oxidative function resulting in the greater accumulation of reactive oxygen species and cellular stress. Increased levels of TXNIP has been associated with many diseases of oxidative stress including ischemic heart disease, diabetes, cancer, AD, and PD (Zhou et al., 2010; Li J. et al., 2017; Duan et al., 2018; Melone et al., 2018). Thioredoxin-TXNIP is a major regulator of mitochondrial-mediated oxidative stress in many pathologies including cerebrovascular and neurodegenerative diseases (Nasoohi et al., 2018). Areas with the highest level of thioredoxin activity in brain are those with the highest level of metabolic and oxidative burden (Aon-Bertolino et al., 2011), similar to FtMt. One recent study that linked TXNIP to AD pathology showed that inhibiting TXNIP expression in SH-SY5Y cells and AD model mice using a pharmaceutical agent directly inhibited the phosphorylation of the microtubule associated protein tau (Melone et al., 2018). Increased phosphorylation of tau is a key pathological event in AD, and its inhibition due to reduced TXNIP expression that can be caused by FtMt overexpression could provide further rationale forthis therapeutic approach for AD.
TXNIP expression is induced in neurons after oxidative or glucose stress in either ischemic or hyperglycemic-ischemic condition (Kim et al., 2012). Induction of TXNIP can be pro-apoptotic under these conditions. The changes in TXNIP protein levels in these overexpressing clones followed the same pattern as TXNIP mRNA expression. Downregulation of TXNIP while maintaining levels of thioredoxin-1 and –2 will provide protection from oxidative stress. Another factor shown to be protective is microsomal glutathione transferase-1 (MGST1), which accumulates in mitochondria and is protective from oxidative stress (Siritantikorn et al., 2007). It has been observed that MGST1 expression was very low in neuroblastomas and neuroblastoma cell line (Bjorkhem-Bergman et al., 2014). These authors hypothesized that this could explain the extreme sensitivity of neuroblastomas to oxidative stress. Increasing MGST1 expression resulted in significant protection of MCF-2 cells from lipid peroxidation (Siritantikorn et al., 2007), while downregulating expression increased PC12 cells susceptibility to toxic stress (Sobczak et al., 2014).
Three other groups of genes that coded for growth factor and cytokine molecules were investigated as they had shown significant differences between FtMt expressing clones by microarray analysis. Growth differentiation factor-15 (GDF-15), also called macrophage inhibitory cytokine-1 (MIC-1), was strongly upregulated in FtMt expressing clones. It was initially identified as a powerful protective factor for cultured dopaminergic neurons exposed to toxic doses of iron and other toxins (Strelau et al., 2000, 2003). Deficiency of GDF-15 has been shown to increase the vulnerability of dopaminergic neurons to 6-OHDA administration in mice (Machado et al., 2016). GDF-15 was shown to have a role in normal erythropoiesis, and its expression was increased in erythroblasts from patients with refractory anemia, which is associated with large increase in iron in mitochondria (Ramirez et al., 2009). GDF-15 can regulate energy homeostasis in mitochondria in muscle through elevation of oxidative metabolism (Cheung et al., 2009). Expression of calcitonin gene related polypeptide alpha (CALCA) and beta (CALCB) genes were significantly altered. These genes produce pro-peptides that are cleaved to neuroactive peptide hormones calcitonin and calcitonin gene related polypeptide (CGRP), which are involved in calcium homeostasis, including vasodilation. CGRP expression is high in the CNS suggesting neurotransmitter activity. CGRP was shown to provide significant protective properties in different experimental systems, including heat injury and ischemia/reperfusion in rats and overexpression in Schwann cells subject to oxidative stress (Russell et al., 2014; Wu et al., 2015; Yang et al., 2016; Lu et al., 2017). Secretogranin II (SCG2)(Chromagranin C) is also a neuroendrocrine secretory protein that is cleaved to form the peptide secretoneurin. Expression of SCG2 is modulated by extracellular calcium (Zhan et al., 2008), and it can induce expression of the anti-apoptotic protein Bcl2 through activation of JAK2/STAT3 signaling, providing protection in a murine stroke model (Shyu et al., 2008). This gene is involved in neuronal differentiation and resistance to apoptosis. Due to the large amount of data generated by the microarray profiling of different FtMt clones, there are a number of other genes of potential interest to neuronal phenotype and differentiation that can be explored.
In conclusion, our data have identified that FtMt overexpression has significant effects on neuronal-like cells. The results indicate that the protective effect is not dependent on amount of FtMt expression. High levels of expression did not appear to harm the viability of cells in terms of growth and differentiation, but some mitochondria abnormalities were observed in the highest expressing clone. There was a clear difference in expression of many genes between low and high expressing clones that suggest a dose effect. cells. The data provides a framework for investigating novel mechanisms concerning FtMt expression in diseases such as AD, and whether FtMt could be considered as a candidate for use in gene therapy for diseases involving mitochondrial oxidative stress.
Author Contributions
AM performed all experiments, analyzed data and assisted in manuscript preparation. ST assisted in experiments and data acquisition. DGW planned experiments, supervised experiments, assisted in data analyses and wrote manuscript. IT initiated experiments, provided funding and intellectual input to data interpretation and manuscript. All authors read and approved all versions of manuscript.
Funding
This study was supported by JSPS KAKENHI Grant Numbers JP17H03560 and JP26290022 (IT) from Japan Society for the Promotion of Science.
Conflict of Interest Statement
The authors declare that the research was conducted in the absence of any commercial or financial relationships that could be construed as a potential conflict of interest.
Supplementary Material
The Supplementary Material for this article can be found online at: https://www.frontiersin.org/articles/10.3389/fnmol.2018.00470/full#supplementary-material
Supplemental Figure 1. Western blot panel showing FtMt expression in all isolated clones of SH-SY5Y cells transfected with FtMt expression plasmid. Results are shown for FtMt expression in undifferentiated cells.
Supplemental File 1. Zipped Microsoft Excel File showing complete results of all expression intensities for analyzed clones. File is searchable.
Supplemental File 2. Microsoft Excel File complete results of expression intensities with changes up or down by more than 1 log2 comparing between highest expressing clone (HighB) and untransfected cells.
Supplemental File 3. Microsoft Excel File complete results of expression intensities with changes up or down by more than 1 log2 comparing between medium expressing clone and untransfected cells.
Supplemental File 4. Microsoft Excel File complete results of expression intensities with changes up or down by more than 1 log2 comparing between highest expressing (high B) and medium FtMt expressing clones.
Supplemental File 5. Microsoft word table listing expression differences of key genes related to Iron Metabolism and to Oxidative Stress.
References
Aon-Bertolino, M. L., Romero, J. I., Galeano, P., Holubiec, M., Badorrey, M. S., Saraceno, G. E., et al. (2011). Thioredoxin and glutaredoxin system proteins-immunolocalization in the rat central nervous system. Biochim. Biophys. Acta 1810, 93–110. doi: 10.1016/j.bbagen.2010.06.011
Arosio, P., Ingrassia, R., and Cavadini, P. (2009). Ferritins: a family of molecules for iron storage, antioxidation and more. Biochim. Biophys. Acta 1790, 589–599. doi: 10.1016/j.bbagen.2008.09.004
Bjorkhem-Bergman, L., Johansson, M., Morgenstern, R., Rane, A., and Ekstrom, L. (2014). Prenatal expression of thioredoxin reductase 1 (TRXR1) and microsomal glutathione transferase 1 (MGST1) in humans. FEBS Open Bio 4, 886–891. doi: 10.1016/j.fob.2014.10.005
Brundin, P., Dave, K. D., and Kordower, J. H. (2017). Therapeutic approaches to target alpha-synuclein pathology. Exp. Neurol. 298, 225–235. doi: 10.1016/j.expneurol.2017.10.003
Bustin, S. A., Benes, V., Garson, J. A., Hellemans, J., Huggett, J., Kubista, M., et al. (2009). The MIQE guidelines: minimum information for publication of quantitative real-time PCR experiments. Clin. Chem. 55, 611–622. doi: 10.1373/clinchem.2008.112797
Cecchi, C., Pensalfini, A., Liguri, G., Baglioni, S., Fiorillo, C., Guadagna, S., et al. (2008). Differentiation increases the resistance of neuronal cells to amyloid toxicity. Neurochem. Res. 33, 2516–2531. doi: 10.1007/s11064-008-9627-7
Cheung, Y.-T., Lau, W. K.-W., Yu, M.-S., Lai, C. S.-W., Yeung, S.-C., So, K.-F., et al. (2009). Effects of all-trans-retinoic acid on human SH-SY5Y neuroblastoma as in vitro model in neurotoxicity research. Neurotoxicology 30, 127–135. doi: 10.1016/j.neuro.2008.11.001
Drysdale, J., Arosio, P., Invernizzi, R., Cazzola, M., Volz, A., Corsi, B., et al. (2002). Mitochondrial ferritin: a new player in iron metabolism. Blood Cells. Mol. Dis. 29, 376–383. doi: 10.1006/bcmd.2002.0577
Duan, J., Du, C., Shi, Y., Liu, D., and Ma, J. (2018). Thioredoxin-interacting protein deficiency ameliorates diabetic retinal angiogenesis. Int. J. Biochem. Cell Biol. 94, 61–70. doi: 10.1016/j.biocel.2017.11.013
Forster, J. I., Koglsberger, S., Trefois, C., Boyd, O., Baumuratov, A. S., Buck, L, et al. (2016). Characterization of differentiated SH-SY5Y as neuronal screening model reveals increased oxidative vulnerability. J. Biomol. Screen. 21, 496–509. doi: 10.1177/1087057115625190
Gao, G., and Chang, Y.-Z. (2014). Mitochondrial ferritin in the regulation of brain iron homeostasis and neurodegenerative diseases. Front. Pharmacol. 5:19. doi: 10.3389/fphar.2014.00019
Gao, G., Zhang, N., Wang, Y.-Q., Wu, Q., Yu, P., Shi, Z.-H., et al. (2017). Mitochondrial ferritin protects hydrogen peroxide-induced neuronal cell damage. Aging Dis. 8, 458–470. doi: 10.14336/AD.2016.1108
Gong, S., Chen, Y., Meng, F., Zhang, Y., Wu, H., and Wu, F. (2017). Roflumilast restores cAMP/PKA/CREB signaling axis for FtMt-mediated tumor inhibition of ovarian cancer. Oncotarget 8, 112341–112353. doi: 10.18632/oncotarget.22866
Guan, H., Yang, H., Yang, M., Yanagisawa, D., Bellier, J.-P., Mori, M., et al. (2017). Mitochondrial ferritin protects SH-SY5Y cells against H2O2-induced oxidative stress and modulates alpha-synuclein expression. Exp. Neurol. 291, 51–61. doi: 10.1016/j.expneurol.2017.02.001
Guaraldo, M., Santambrogio, P., Rovelli, E., Di Savino, A., Saglio, G., Cittaro, D., et al. (2016). Characterization of human mitochondrial ferritin promoter: identification of transcription factors and evidences of epigenetic control. Sci. Rep. 6:33432. doi: 10.1038/srep33432
Huang, M. L.-H., Becker, E. M., Whitnall, M., Suryo Rahmanto, Y., Ponka, P., and Richardson, D. R. (2009). Elucidation of the mechanism of mitochondrial iron loading in Friedreich's ataxia by analysis of a mouse mutant. Proc. Natl. Acad. Sci. U.S.A. 106, 16381–16386. doi: 10.1073/pnas.0906784106
Jan, A. T., Azam, M., Rahman, S., Almigeiti, A. M. S., Choi, D. H., Lee, E. J., et al. (2017). Perspective insights into disease progression, diagnostics, and therapeutic approaches in alzheimer's disease: a judicious update. Front. Aging Neurosci. 9:356. doi: 10.3389/fnagi.2017.00356
Kim, G. S., Jung, J. E., Narasimhan, P., Sakata, H., and Chan, P. H. (2012). Induction of thioredoxin-interacting protein is mediated by oxidative stress, calcium, and glucose after brain injury in mice. Neurobiol. Dis. 46, 440–449. doi: 10.1016/j.nbd.2012.02.008
Lang, A. E., and Espay, A. J. (2018). Disease modification in Parkinson's disease: current approaches, challenges, and future considerations. Mov. Disord. 33, 660–677. doi: 10.1002/mds.27360
Lee, C.-I., Perng, J.-H., Chen, H.-Y., Hong, Y.-R., and Wang, J.-J., (2015). Undifferentiated neuroblastoma cells are more sensitive to photogenerated oxidative stress than differentiated cells. J. Cell. Biochem. 116, 2074–2085. doi: 10.1002/jcb.25165
Levi, S., and Arosio, P. (2004). Mitochondrial ferritin. Int. J. Biochem. Cell Biol. 36, 1887–1889. doi: 10.1016/j.biocel.2003.10.020
Levi, S., Corsi, B., Bosisio, M., Invernizzi, R., Volz, A., Sanford, D., et al. (2001). A human mitochondrial ferritin encoded by an intronless gene. J. Biol. Chem. 276, 24437–24440. doi: 10.1074/jbc.C100141200
Li, J., Yue, Z., Xiong, W., Sun, P., You, K., and Wang, J. (2017). TXNIP overexpression suppresses proliferation and induces apoptosis in SMMC7221 cells through ROS generation and MAPK pathway activation. Oncol. Rep. 37, 3369–3376. doi: 10.3892/or.2017.5577
Li, X., Wang, P., Wu, Q., Xie, L., Cui, Y., Li, H., et al. (2017). The construction and characterization of mitochondrial ferritin overexpressing mice. Int. J. Mol. Sci. 18:1518. doi: 10.3390/ijms18071518
Lopez-Carballo, G., Moreno, L., Masia, S., Perez, P., and Barettino, D. (2002). Activation of the phosphatidylinositol 3-kinase/Akt signaling pathway by retinoic acid is required for neural differentiation of SH-SY5Y human neuroblastoma cells. J. Biol. Chem. 277, 25297–25304. doi: 10.1074/jbc.M201869200
Lu, C.-X., Qiu, T., Liu, Z.-F., Su, L., and Cheng, B. (2017). Calcitonin gene-related peptide has protective effect on brain injury induced by heat stroke in rats. Exp. Ther. Med. 14, 4935–4941. doi: 10.3892/etm.2017.5126
Machado, V., Haas, S. J.-P., von Bohlen Und Halbach, O., Wree, A., Krieglstein, K., Unsicker, K., et al. (2016). Growth/differentiation factor-15 deficiency compromises dopaminergic neuron survival and microglial response in the 6-hydroxydopamine mouse model of Parkinson's disease. Neurobiol. Dis. 88, 1–15. doi: 10.1016/j.nbd.2015.12.016
Mahmood, D. F. D., Abderrazak, A., El Hadri, K., Simmet, T., and Rouis, M. (2013). The thioredoxin system as a therapeutic target in human health and disease. Antioxid. Redox Signal. 19, 1266–1303. doi: 10.1089/ars.2012.4757
Melone, M. A. B., Dato, C., Paladino, S., Coppola, C., Trebini, C., Giordana, M. T., et al. (2018). Verapamil Inhibits Ser202/Thr205 phosphorylation of tau by blocking TXNIP/ROS/p38 MAPK pathway. Pharm. Res. 35:44. doi: 10.1007/s11095-017-2276-2
Nasoohi, S., Ismael, S., and Ishrat, T. (2018). Thioredoxin-Interacting Protein (TXNIP) in cerebrovascular and neurodegenerative diseases: regulation and implication. Mol. Neurobiol. 55, 7900–7920. doi: 10.1007/s12035-018-0917-z
Nesi, G., Sestito, S., Digiacomo, M., and Rapposelli, S. (2017). Oxidative stress, mitochondrial abnormalities and proteins deposition: multitarget approaches in Alzheimer's disease. Curr. Top. Med. Chem. 17, 3062–3079. doi: 10.2174/1568026617666170607114232
Nicolini, G., Miloso, M., Zoia, C., Di Silvestro, A., Cavaletti, G., and Tredici, G. (1998). Retinoic acid differentiated SH-SY5Y human neuroblastoma cells: an in vitro model to assess drug neurotoxicity. Anticancer Res. 18, 2477–2481.
Peddada, S., Yasui, D. H., and LaSalle, J. M., (2006). Inhibitors of differentiation (ID1, ID2, ID3 and ID4) genes are neuronal targets of MeCP2 that are elevated in Rett syndrome. Hum. Mol. Genet. 15, 2003–2014. doi: 10.1093/hmg/ddl124
Pezzini, F., Bettinetti, L., Di Leva, F., Bianchi, M., Zoratti, E., Carrozzo, R., et al. (2017). Transcriptomic profiling discloses molecular and cellular events related to neuronal differentiation in SH-SY5Y neuroblastoma cells. Cell. Mol. Neurobiol. 37, 665–682. doi: 10.1007/s10571-016-0403-y
Ramirez, J.-M., Schaad, O., Durual, S., Cossali, D., Docquier, M., Beris, P., et al. (2009). Growth differentiation factor 15 production is necessary for normal erythroid differentiation and is increased in refractory anaemia with ring-sideroblasts. Br. J. Haematol. 144, 251–262. doi: 10.1111/j.1365-2141.2008.07441.x
Ross, R. A., Spengler, B. A., and Biedler, J. L. (1983). Coordinate morphological and biochemical interconversion of human neuroblastoma cells. J. Natl. Cancer Inst. 71, 741–747.
Russell, F. A., King, R., Smillie, S.-J., Kodji, X., and Brain, S. D. (2014). Calcitonin gene-related peptide: physiology and pathophysiology. Physiol. Rev. 94, 1099–1142. doi: 10.1152/physrev.00034.2013
Santambrogio, P., Biasiotto, G., Sanvito, F., Olivieri, S., Arosio, P., and Levi, S. (2007). Mitochondrial ferritin expression in adult mouse tissues. J. Histochem. Cytochem. 55, 1129–1137. doi: 10.1369/jhc.7A7273.2007
Shi, Z.-H., Nie, G., Duan, X.-L., Rouault, T., Wu, W.-S., Ning, B., Zhang, N., Chang, Y.-Z., and Zhao, B.-L (2010). Neuroprotective mechanism of mitochondrial ferritin on 6-hydroxydopamine-induced dopaminergic cell damage: implication for neuroprotection in Parkinson's disease. Antioxid. Redox Signal. 13, 783–796. doi: 10.1089/ars.2009.3018
Shi, Z.-H., Shi, F.-F., Wang, Y.-Q., Sheftel, A. D., Nie, G., Zhao, Y.-S., et al. (2015). Mitochondrial ferritin, a new target for inhibiting neuronal tumor cell proliferation. Cell. Mol. Life Sci. 72, 983–997. doi: 10.1007/s00018-014-1730-0
Shyu, W.-C., Lin, S.-Z., Chiang, M.-F., Chen, D.-C., Su, C.-Y., Wang, H.-J., et al. (2008). Secretoneurin promotes neuroprotection and neuronal plasticity via the Jak2/Stat3 pathway in murine models of stroke. J. Clin. Invest. 118, 133–148. doi: 10.1172/JCI32723
Simpson, P. B., Bacha, J. I., Palfreyman, E. L., Woollacott, A. J., McKernan, R. M., and Kerby, J. (2001). Retinoic acid evoked-differentiation of neuroblastoma cells predominates over growth factor stimulation: an automated image capture and quantitation approach to neuritogenesis. Anal. Biochem. 298, 163–169. doi: 10.1006/abio.2001.5346
Siritantikorn, A., Johansson, K., Ahlen, K., Rinaldi, R., Suthiphongchai, T., Wilairat, P., et al. (2007). Protection of cells from oxidative stress by microsomal glutathione transferase 1. Biochem. Biophys. Res. Commun. 355, 592–596. doi: 10.1016/j.bbrc.2007.02.018
Snyder, A. M., Wang, X., Patton, S. M., Arosio, P., Levi, S., Earley, C. J., et al. (2009). Mitochondrial ferritin in the substantia nigra in restless legs syndrome. J. Neuropathol. Exp. Neurol. 68, 1193–1199. doi: 10.1097/NEN.0b013e3181bdc44f
Sobczak, M., Boczek, T., Kowalski, A., Wiktorska, M., Niewiarowska, J., and Zylinska, L. (2014). Downregulation of microsomal glutathione-S-transferase 1 modulates protective mechanisms in differentiated PC12 cells. J. Physiol. Biochem. 70, 375–383. doi: 10.1007/s13105-014-0312-9
Stenirri, S., Santambrogio, P., Setaccioli, M., Erba, B. G., Pia Manitto, M., Rovida, E., et al. (2012). Study of FTMT and ABCA4 genes in a patient affected by age-related macular degeneration: identification and analysis of new mutations. Clin. Chem. Lab. Med. 50, 1021–1029. doi: 10.1515/cclm-2011-0854
Strelau, J., Bottner, M., Lingor, P., Suter-Crazzolara, C., Galter, D., Jaszai, J., et al. (2000). GDF-15/MIC-1 a novel member of the TGF-beta superfamily. J. Neural Transm. 60, 273–276.
Strelau, J., Schober, A., Sullivan, A., Schilling, L., and Unsicker, K. (2003). Growth/differentiation factor-15 (GDF-15), a novel member of the TGF-beta superfamily, promotes survival of lesioned mesencephalic dopaminergic neurons in vitro and in vivo and is induced in neurons following cortical lesioning. J. Neural Transm. 65, 197–203.
Walker, D. G., Dalsing-Hernandez, J. E., Campbell, N. A., and Lue, L.-F. (2009). Decreased expression of CD200 and CD200 receptor in Alzheimer's disease: a potential mechanism leading to chronic inflammation. Exp. Neurol. 215, 5–19. doi: 10.1016/j.expneurol.2008.09.003
Wang, L., Yang, H., Zhao, S., Sato, H., Konishi, Y., Beach, T. G., et al. (2011). Expression and localization of mitochondrial ferritin mRNA in Alzheimer's disease cerebral cortex. PLoS ONE 6:e22325. doi: 10.1371/journal.pone.0022325
Wang, P., Wu, Q., Wu, W., Li, H., Guo, Y., Yu, P., et al. (2017). Mitochondrial ferritin deletion exacerbates beta-amyloid-induced neurotoxicity in mice. Oxid. Med. Cell. Longev. 2017:1020357. doi: 10.1155/2017/1020357
Wang, X., Yang, H., Yanagisawa, D., Bellier, J.-P., Morino, K., Zhao, S., et al. (2016). Mitochondrial ferritin affects mitochondria by stabilizing HIF-1alpha in retinal pigment epithelium: implications for the pathophysiology of age-related macular degeneration. Neurobiol. Aging 47, 168–179. doi: 10.1016/j.neurobiolaging.2016.07.025
Wang, Y.-Q., Chang, S.-Y., Wu, Q., Gou, Y.-J., Jia, L., Cui, Y.-M., et al. (2016). The protective role of mitochondrial ferritin on erastin-induced ferroptosis. Front. Aging Neurosci. 8:308. doi: 10.3389/fnagi.2016.00308
Wu, W.-S., Zhao, Y.-S., Shi, Z.-H., Chang, S.-Y., Nie, G.-J., Duan, X.-L., et al. (2013). Mitochondrial ferritin attenuates beta-amyloid-induced neurotoxicity: reduction in oxidative damage through the Erk/P38 mitogen-activated protein kinase pathways. Antioxid. Redox Signal. 18, 158–169. doi: 10.1089/ars.2011.4285
Wu, Y., Hao, G.-M., He, J., Lv, T.-T., Wang, H.-L., Mao, Y.-Q., et al. (2015). Lentivirus mediated over expression of CGRP inhibited oxidative stress in Schwann cell line. Neurosci. Lett. 598, 52–58. doi: 10.1016/j.neulet.2015.05.009
Yang, H., Guan, H., Yang, M., Liu, Z., Takeuchi, S., Yanagisawa, D., et al. (2015). Upregulation of mitochondrial ferritin by proinflammatory cytokines: implications for a role in Alzheimer's disease. J. Alzheimers. Dis. 45, 797–811. doi: 10.3233/JAD-142595
Yang, H., Yang, M., Guan, H., Liu, Z., Zhao, S., Takeuchi, S., et al. (2013). Mitochondrial ferritin in neurodegenerative diseases. Neurosci. Res. 77, 1–7. doi: 10.1016/j.neures.2013.07.005
Yang, M., Yang, H., Guan, H., Kato, T., Mukaisho, K., Sugihara, H., et al. (2017). Characterization of a novel monoclonal antibody against human mitochondrial ferritin and its immunohistochemical application in human and monkey Substantia Nigra. Acta Histochem. Cytochem. 50, 49–55. doi: 10.1267/ahc.16034
Yang, S. I., Yuan, Y., Jiao, S., Luo, Q. I., and Yu, J. (2016). Calcitonin gene-related peptide protects rats from cerebral ischemia/reperfusion injury via a mechanism of action in the MAPK pathway. Biomed. Rep. 4, 699–703. doi: 10.3892/br.2016.658
You, L.-H., Li, Z., Duan, X.-L., Zhao, B.-L., Chang, Y.-Z., and Shi, Z.-H. (2016). Mitochondrial ferritin suppresses MPTP-induced cell damage by regulating iron metabolism and attenuating oxidative stress. Brain Res. 1642, 33–42. doi: 10.1016/j.brainres.2016.03.023
Yu, X., and Gao, D. (2013). Overexpression of cytoglobin gene inhibits hypoxic injury to SH-SY5Y neuroblastoma cells. Neural Regen. Res. 8, 2198–2203. doi: 10.3969/j.issn.1673-5374.2013.23.010
Zhan, X., Li, F., Chu, Q., Pang, H., Kim, H. J., Denli, A. M., et al. (2008). Cellular expression and subcellular localization of secretogranin II in the mouse hippocampus and cerebellum. Exp. Gerontol. 497, 53–63. doi: 10.1016/j.bbrc.2018.02.130
Keywords: neuroprotection, free radical, mitochondria, iron, neurodegeneration, cell culture
Citation: Mendsaikhan A, Takeuchi S, Walker DG and Tooyama I (2019) Differences in Gene Expression Profiles and Phenotypes of Differentiated SH-SY5Y Neurons Stably Overexpressing Mitochondrial Ferritin. Front. Mol. Neurosci. 11:470. doi: 10.3389/fnmol.2018.00470
Received: 19 June 2018; Accepted: 04 December 2018;
Published: 08 January 2019.
Edited by:
Christian Gonzalez-Billault, Universidad de Chile, ChileReviewed by:
Patrizia Longone, Fondazione Santa Lucia (IRCCS), ItalyMariapaola Nitti, Università di Genova, Italy
Copyright © 2019 Mendsaikhan, Takeuchi, Walker and Tooyama. This is an open-access article distributed under the terms of the Creative Commons Attribution License (CC BY). The use, distribution or reproduction in other forums is permitted, provided the original author(s) and the copyright owner(s) are credited and that the original publication in this journal is cited, in accordance with accepted academic practice. No use, distribution or reproduction is permitted which does not comply with these terms.
*Correspondence: Douglas G. Walker, walker@belle.shiga-med.ac.jp
Ikuo Tooyama, kinchan@belle.shiga-med.ac.jp