Parkin Promotes Mitophagic Cell Death in Adult Hippocampal Neural Stem Cells Following Insulin Withdrawal
 Hyunhee Park1
  Kyung Min Chung1 Hyun-Kyu An1 Ji-Eun Gim1
  Jihyun Hong1 Hanwoong Woo1
  Bongki Cho1 Cheil Moon1
  Seong-Woon Yu1,2*
- 1Department of Brain and Cognitive Sciences, Daegu Gyeongbuk Institute of Science and Technology, Daegu, South Korea
- 2Neurometabolomics Research Center, Daegu Gyeongbuk Institute of Science and Technology, Daegu, South Korea
Regulated cell death (RCD) plays a fundamental role in human health and disease. Apoptosis is the best-studied mode of RCD, but the importance of other modes has recently been gaining attention. We have previously demonstrated that adult rat hippocampal neural stem (HCN) cells undergo autophagy-dependent cell death (ADCD) following insulin withdrawal. Here, we show that Parkin mediates mitophagy and ADCD in insulin-deprived HCN cells. Insulin withdrawal increased the amount of depolarized mitochondria and their colocalization with autophagosomes. Insulin withdrawal also upregulated both mRNA and protein levels of Parkin, gene knockout of which prevented mitophagy and ADCD. c-Jun is a transcriptional repressor of Parkin and is degraded by the proteasome following insulin withdrawal. In insulin-deprived HCN cells, Parkin is required for Ca2+ accumulation and depolarization of mitochondria at the early stages of mitophagy as well as for recognition and removal of depolarized mitochondria at later stages. In contrast to the pro-death role of Parkin during mitophagy, Parkin deletion rendered HCN cells susceptible to apoptosis, revealing distinct roles of Parkin depending on different modes of RCD. Taken together, these results indicate that Parkin is required for the induction of ADCD accompanying mitochondrial dysfunction in HCN cells following insulin withdrawal. Since impaired insulin signaling is implicated in hippocampal deficits in various neurodegenerative diseases and psychological disorders, these findings may help to understand the mechanisms underlying death of neural stem cells and develop novel therapeutic strategies aiming to improve neurogenesis and survival of neural stem cells.
Introduction
Regulated cell death (RCD) is an evolutionarily conserved process and is tightly controlled by various intracellular signals and extracellular cues (Danial and Korsmeyer, 2004; Galluzzi et al., 2018). RCD is essential for normal development and maintenance of tissue homeostasis (Ellis et al., 1991; Coucouvanis and Martin, 1995). Therefore, dysregulation of RCD underlies a variety of human diseases, such as cancer, neurodegeneration, and autoimmunity RCD is currently categorized into 12 distinct cell death subroutines, with intrinsic and extrinsic apoptosis, necroptosis, and autophagy-dependent cell death (ADCD) as main subroutines based on morphological and biochemical criteria (Galluzzi et al., 2018). Cell shrinkage, membrane blebbing, nuclear DNA fragmentation, chromatin condensation, and activation of caspases are hallmarks of apoptosis (Galluzzi et al., 2007). Morphologically, necrosis is characterized by a rapid collapse of the plasma membrane and uncontrolled release of cytoplasmic components (Rello et al., 2005). Recent progress in the understanding of the regulatory mechanisms of necrosis suggests its regulatable nature, and has led to the coining of the term “necroptosis” (Galluzzi and Kroemer, 2008; Moriwaki et al., 2016).
Autophagy (“self-eating” in Greek) is a lysosome-dependent catabolic process characterized morphologically by an increased formation of autophagic vesicles (autophagosomes and autolysosomes) (Yang and Klionsky, 2010). Autophagy is essential for turnover and removal of dysfunctional or toxic intracellular components (Shintani and Klionsky, 2004). Autophagy can also recycle obsolete cellular constituents (Mizushima and Komatsu, 2011). Thereby, autophagy generally has protective and adaptive functions in response to cellular stress. Autophagy is mediated by the autophagy-related (Atg) genes (Klionsky et al., 2011). It begins by phagophore formation and elongation to generate double-membraned autophagosomes. For this process, microtubule-associated proteins 1A/1B light chain 3B (LC3, the mammalian homologue of the yeast Atg8 protein) is cleaved by Atg4 to produce LC3-I, which is a cytosolic form of LC3 (Satoo et al., 2009). When autophagosome formation is triggered, LC3-I is conjugated to phosphatidylethanolamine to form LC3-II, which is then recruited to the expanding phagophore membranes to facilitate autophagosome formation (Ichimura et al., 2000). Autophagosomes then mature into autolysosomes through fusion with the lysosomes for degradation and recycling of the autophagy cargos. An increase in the amount of LC3-II or in the number of LC3 puncta in autophagic vesicles can serve as an indicator of increased autophagy flux (Klionsky et al., 2016). p62 (sequestosome 1/SQSTM1) is a ubiquitin-binding autophagy adaptor protein, which becomes incorporated into the autophagosomes together with the delivered cargos for autophagic degradation (Pankiv et al., 2007). Thus, the degradation of p62 is regarded as another index of autophagy flux (Ichimura et al., 2008).
Contrary to the general notion of autophagy as a survival mechanism, there are reports that excessive or prolonged autophagy can induce cell death (Tsujimoto and Shimizu, 2005). Together with frequent observation of autophagy in cells undergoing RCD, these findings led to the concept of ADCD. ADCD, previously also known as autophagic cell death, was first proposed based on widespread morphological association of autophagy with cell death, but without implication of the causative role of autophagy in cell death (Tsujimoto and Shimizu, 2005). Therefore, it is still contentious whether autophagy plays a causative role in cell death, especially in mammals. Taking this controversy into account, ADCD is suggested as a type of RCD that requires autophagic machinery without participation of other cell death pathways (Galluzzi et al., 2018).
Insulin/insulin-like growth factor (IGF) family proteins are vital extracellular cues for the differentiation and survival of neural stem cells (NSCs) in the hippocampus (Åberg et al., 2000; Lichtenwalner et al., 2001). As such, adult hippocampal NSCs, abbreviated as HCN cells following the original description of their isolation, depend on insulin/IGF for survival in in vitro culture (Palmer et al., 1997). Interestingly, we found that insulin-deprived HCN cells undergo ADCD rather than apoptosis despite their intact apoptotic capability (Yu et al., 2008; Baek et al., 2009). Further study revealed that glycogen synthase kinase-3β (GSK3-3β) mediates ADCD in HCN cells (Yu et al., 2008; Baek et al., 2009; Ha et al., 2015). Pharmacological or genetic inactivation of GSK-3β decreased ADCD, while over-expression of the wild-type (WT) or constitutively active form of GSK-3β facilitated ADCD without apoptosis induction (Ha et al., 2015). Because a rise in the intracellular Ca2+ level is known to trigger autophagy (Høyer-Hansen et al., 2007), we next focused on the regulation of ADCD by Ca2+. In insulin-deprived HCN cells, intracellular Ca2+ level increases, mainly owing to its release from the endoplasmic reticulum (ER) mediated by the type 3 ryanodine receptor (RyR3) (Chung et al., 2016). RyR3-mediated increase in cytosolic Ca2+ activates AMP-activated protein kinase (AMPK), which leads to a novel phosphorylation of p62 and promotes mitophagy (Ha et al., 2017). Further study is needed to understand how mitophagy is regulated in insulin-deprived HCN cells.
Parkin is an E3 ubiquitin ligase, and more than 100 mutations in the Parkin-encoding PARK2 gene are known to cause an autosomal recessive form of Parkinson’s disease (PD) (Dawson and Dawson, 2010). PD is characterized mainly by an array of motor impairments associated with progressive death of dopaminergic neurons in the substantia nigra pars compacta (Dauer and Przedborski, 2003). PD also affects a number of neuronal systems and causes various non-motor symptoms including neuropsychiatric manifestations and cognitive deficits such as early premotor dysfunction (Meissner et al., 2011). The relevance of Parkin in these cognitive symptoms is not well understood. An emerging role of Parkin is regulation of mitophagy (Narendra et al., 2008). Mitophagy is a particular mode of autophagy that removes damaged or dysfunctional mitochondria and thereby helps maintain mitochondrial quality and homeostasis (Lemasters, 2005). Since mitochondrial dysfunction is implicated in the pathogenesis of PD, the role of Parkin-mediated mitophagy in the regulation of mitochondrial function and dynamics has gained great attention.
Hippocampus is one of the neurogenic regions where new neurons are continuously generated throughout adulthood (Gould et al., 1997; Alvarez-Buylla and Lim, 2004). Adult hippocampal neurogenesis is implicated in hippocampal learning and memory, and is impaired in the aged or injured brain (Shors et al., 2001; Rodríguez et al., 2008). Given their highly dynamic nature and differentiation potential, NSCs residing in the neurogenic niches must be under tight control in terms of metabolism, mitochondrial homeostasis, and autophagy level. Of relevance to this notion, a recent report on the characteristics of mt-Keima mice, an in vivo model of mitophagy, suggested high basal level of mitophagy in the dentate gyrus (DG) areas of the adult hippocampus (Sun et al., 2015). However, it has not been studied whether adult NSCs require Parkin activity for mitophagy.
In the present study, we investigated the role of Parkin in mitophagy in HCN cells; this investigation was prompted by its roles in other cell types and the high rate of on-going mitophagy in the DG. We demonstrate that Parkin is upregulated through degradation of its transcriptional repressor, c-Jun, following insulin withdrawal. Parkin is required for mitophagy and plays a pro-death role during ADCD of HCN cells. On the other hand, Parkin plays an anti-apoptotic role in response to well-known apoptotic stimuli. Our findings suggest distinct functions of Parkin in the regulation of RCD of HCN cells depending on the cellular context.
Materials and Methods
Reagents and Antibodies
Antibodies against Parkin (4211), cleaved caspase 3 (9664), poly(ADP-ribose) polymerase (PARP) (9542), c-Jun (9165), and voltage-dependent anion channel (VDAC) (4866), phospho-SAPK/JNK (Thr183/Tyr185) (9251), horseradish peroxidase (HRP)-linked anti-mouse IgG (7076) were purchased from Cell Signaling Technology (Danvers, MA, United States). Antibodies against p62 (P0067, Sigma-Aldrich, Saint Louis, MO, United States), LC3B (100-2220, Novus Biologicals, City of Centennial, CO, United States), HRP-conjugated β-actin (47778, Santa Cruz Biotechnology, Dallas, TX, United States) and goat anti-rabbit IgG (H+L) secondary antibody (31460, Thermo Fisher Scientific, Carlsbad, CA, United States), PTEN-induced putative kinase 1 (PINK1) (BC100-494, Novus Biologicals) and ubiquitin phosphorylated at S65 residue (p-Ub-S65) (ABS1513-I, EMD Millipore, Burlington, MA, United States) were purchased at the indicated companies. Bafilomycin A1 (Baf.A1, Sigma-Aldrich), carbonyl cyanide 3-chlorophenylhydrazone (CCCP, Sigma-Aldrich), staurosporine (STS, Cell Signaling Technology), and necrostatin-1 (Invitrogen, Carlsbad, CA, United States) were purchased from the indicated companies.
Cell Culture
HCN cells were cultured as we previously reported (Chung et al., 2015, 2016). In brief, cells were grown in chemically composed serum free medium containing Dulbecco’s modified Eagle’s medium/F-12 (12400-024, Thermo Fisher Scientific) supplemented with our own-made N2 components, which we made by mixing individual components including 5 mg/l insulin (Sigma-Aldrich), 16 mg/l putrescine dihydrochloride (Sigma-Aldrich), 100 mg/l transferrin (Sigma-Aldrich), 30 nM sodium selenite (Sigma-Aldrich), and 20 nM progesterone (Sigma-Aldrich). Medium was adjusted to pH 7.2 after adding 1.27 g/l sodium biocarbonate (Sigma-Aldrich). Insulin was omitted to prepare I(−) medium. In this paper, I(+) and I(−) denote insulin-containing and insulin-deprived media, respectively.
Cell Death Assay
HCN cells were seeded in a 96-well plate at a density of 1.0 × 10⁵ cells/ml. To assess cell death, cells were stained with Hoechst 33342 (Invitrogen) and propidium iodide (PI) (Sigma-Aldrich), and were imaged under a fluorescence microscope (Axiovert 40 CFL, Carl Zeiss, Oberkochen, Germany). We used DAPI filter for Hoechst stained cells, and Cy3 filter for PI positive cells. Images were obtained by AxioVision 4 module Multichannel software (Carl Zeiss) and were analyzed by Pixcavator student edition analysis software (Intelligent Perception Co.). The contrast value of the software was adjusted according to the brightness of the image, and total 7,000–8,000 cells were counted per condition and more than 3 experiments were performed. The cell death rates were calculated as follows: Cell death (%) = (PI positive cell number/Hoechst positive cell number) × 100.
Caspase 3 Activity Assay
HCN cells were seeded onto 96-well white plates and caspase 3 activity was measured using a Caspase 3 activity assay kit (Promega, Madison, WI, United States) according to the manufacturer’s instructions. A freshly prepared Caspase 3 Glo reagent solution was added to cultured HCN cells, and luminescence was measured in a luminometer (SpectraMax L, Molecular Devices, San Jose, CA, United States) and were analyzed by SoftMax Pro Software (Molecular Devices). Luminescence values were normalized to protein concentration. We calculated the average value by analyzing duplets samples per condition, and performed a total 3 repeat experiment.
Terminal Deoxynucleotidyl Transferase dUTP Nick End Labeling (TUNEL) Assay
Cells were fixed in 4% paraformaldehyde for 25 min at 4°C, washed twice in phosphate-buffered saline (PBS), 5 min each time. After permeabilization with 0.2% Triton X-100 in PBS for 5 min, the assay was performed using TUNEL System kit (G3250, Promega) according to the manufacture’s instruction. In brief, 100 μl of equilibration buffer was added to the cells for 5–10 min at room temperature. After that, 50 μl TdT reaction mix was added for 60 min at 37°C. Cells were immersed in 2 × SSC buffer to stop reaction. Hoechst was added to stain nucleus, and the cells were mounted and analyzed by under a confocal microscope (LSM 700, Carl Zeiss).
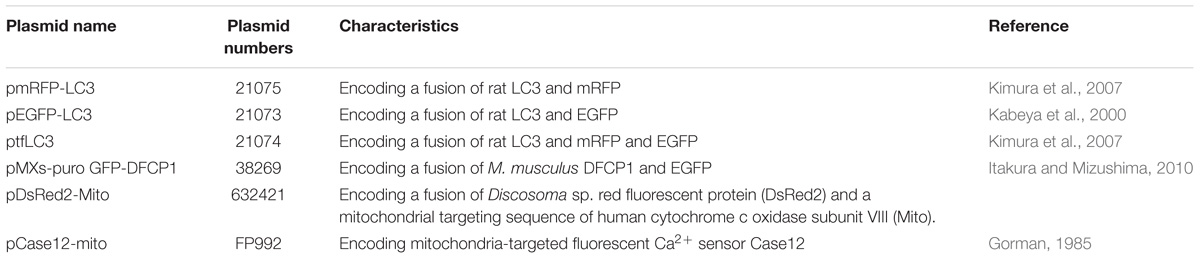
Table 1. Information of plasmids.
Western Blotting
HCN cells were harvested and lysed on ice in radioimmunoprecipitation assay (RIPA) buffer (Thermo Fisher Scientific) with 1 × Halt Protease and Phosphatase inhibitor cocktail (Thermo Fisher Scientific), 1 mM phenylmethanesulfonylfluoride, 1 mM dithiothreitol. Lysates were centrifuged 12,000 ×g for 10 min and protein concentration was measured using a Pierce BCA protein assay kit (Thermo Fisher Scientific). Usually, 10–20 μg total protein was loaded per well. After electrophoresis, proteins were transferred to polyvinylidene fluoride membranes in a semidry electrophoretic transfer cell (Bio-Rad, Richmond, CA, United States). The membranes were blocked in blocking buffer consisting of 5% non-fat dry milk in Tris-buffered saline with 0.1% Tween 20 (TBST) for 1 h at room temperature and incubated overnight with diluted primary antibodies. Each primary antibody was diluted in 5% bovine serum Albumin (Thermo Fisher Scientific) or 5% skim milk in TBST. After 3 washes with TBST, membranes were incubated with suitable HRP-conjugated secondary antibodies (10,000 dilution) diluted in blocking buffer for 1 h. After 3 washes with TBST, proteins were detected using Super Signal West Pico PLUS Chemiluminescent Substrate (34580, Thermo Fisher Scientific). SRX 201A (Konica Minolta Medical Imaging, Wayne, NJ, United States) was used to develop films. Obtained images were analyzed using Image J software and each protein level was finally quantified after normalization via β-actin.
Mitochondrial and Cytosolic Fractionation
Subcellular fractionation was performed according to the published protocol (Dimauro et al., 2012) with a slight modification. HCN cells were homogenized by vortexing for 15 min in lysis buffer (250 mM sucrose, 50 mM Tris-HCl, pH 7.4, 5 mM MgCl2, 1 × Halt protease and phosphatase inhibitor cocktail) and kept on ice for 30 min. The homogenate was centrifuged at 600 ×g for 15 min and the supernatant (S0) was further centrifuged at 11,000 ×g for 10 min to separate the supernatant (S1) and pellet (P1). An equal volume of cold 100% acetone was added to S1 and the samples were incubated overnight at –20°C to precipitate the proteins. After centrifugation at 12,000 ×g for 5 min, the pellet was resuspended in lysis buffer and used as the cytosolic fraction. P1, which contained the mitochondrial fraction, was resuspended in lysis buffer and centrifuged at 11,000 ×g for 10 min; the pellet (P2) was resuspended in extraction buffer (50 mM Tris-HCl pH 6.8, 1 mM EDTA, 0.5% Triton-X 100, and protease and phosphatase inhibitor cocktails) and sonicated with a Bioruptor KRB-01 (CosmoBio, Japan) on ice 3 times for 10 s with 30 s intervals. We used this fraction as the mitochondrial fraction.
Plasmids and Transfection
Plasmids encoding RFP-LC3, EGFP-LC3, monomeric RFP-GFP tandem fluorescent LC3 (mRFP-GFP-LC3), and GFP-double FYVE domain–containing protein 1 (DFCP1) were purchased from Addgene (Cambridge, MA, United States). DsRed2-Mito was purchased from Takara Bio United States (Mountain View, CA, United States) and Case12-mito from Evrogen (Moscow, Russia). Cells were seeded in a 6-well plate 24 h prior to transfection. Transfection was conducted using Lipofectamine 2000 (Invitrogen) according to the manufacturer’s instructions. The Plasmids list is shown in Table 1.
Park2 and Pink1 Knockout
Rat Park2 single guide RNA (sgRNA), rat Pink1 sgRNA, and Cas9 were designed by and purchased from Toolgen (Republic of Korea). The target sequence for Park2 was 5′-ATCACTCGCAGCTGGTCAGCTGG-3′ and the target sequence for Pink1 was 5′-CCTGACACCGGGCCCGGCTTGGG-3′. HCN cells were transfected with Park2 sgRNA or Pink1 sgRNA and Cas9 for 24 h and selected by hygromycin B (InvivoGen, San Diego, CA, United States).
Quantitative Real-Time Reverse Transcription Polymerase Chain Reaction (qRT-PCR)
RNA was isolated from HCN cells using QIAzol lysis reagent (Qiagen, Germantown, MD, United States) and used to synthesize cDNA with an ImProm-II Reverse Transcriptase kit (Promega). A CFX96 Real-Time PCR detection system (Bio-Rad) and TOPreal qPCR 2X premix (Enzynomics, Republic of Korea) were used for real-time PCR with the following primers: rat Park2 forward (5′-ATG ATA GTG TTT GTC AGG TT-3′) and reverse (5′-AGA CAA AAA AGC TGT GGT AG-3′); rat ring finger protein 19A (Rnf19a/Dofrin) forward (5′-ATC TCC AAT CGT CTG CTT CGT CTG-3′) and reverse (5′-CGT TCA GTG CATTCT GGA CAA CTG-3′); rat heme-oxidized IRP2 ubiquitin ligase-1 (HOIL-1/Rbck1) forward (5′-ATG GAC GAG AAGACC AAG AAA GCA-3′) and reverse (5′-GTT GAG TGA TGT GTT GCG GGC T-3′); β-actin (Actb) forward (5′-AGC CAT GTA CGT AGC CAT CC-3′) and reverse (5′-CTC TCA GCT GTG GTG GTG AA-3′).
Flow Cytometry Analysis
Before harvesting, HCN cells were incubated with 100 nM MitoTracker Deep Red and 50 nM MitoTracker Green (Thermo Fisher Scientific) for 15 min. Harvested cells were washed in cold PBS twice and analyzed using a BD Accuri C6 flow cytometer (BD Biosciences, San Jose, CA, United States). MitoTracker Green- and MitoTracker Deep Red-stained cells were detected by FL1 and FL3 channel, respectively. Total 30,000 cells were counted in each condition. For negative control, non-stained cells and single stained cells were counted. Data were analyzed by BD Accuri C6 software.
Immunocytochemistry and Quantification of Relative Fluorescence Intensity or Colocalization Coefficient
Cells were fixed in 4% paraformaldehyde or methanol for 5–10 min, washed in PBS twice, and mounted on a glass slide with mount solution (Dako, Carpinteria, CA, United States). Samples were examined under a confocal microscope (LSM 700, Carl Zeiss). Relative fluorescence intensities of TMRE, Case12-mito, p-Ub-S65 were analyzed using Image J software. The cytosol region excluding nucleus area was drawn with drawing tools and integrated density of this region was measured. The relative fluorescence intensity in each experimental condition was quantified based on the mean value of the I(+) condition.
Colocalization coefficient of mitochondria with LC3 or DFCP1 was analyzed using “colocalization” tool from Zen software (Carl Zeiss) and then quantified using colocalization coefficient following the guideline of the software.
Promoter Activity Assay
pGL3 and pRL-TK vectors (Promega) contain modified coding regions for firefly luciferase and Renilla luciferase, respectively. We used firefly luciferase as a reporter for transcriptional activity of Park2 promoter. Renilla luciferase, which was expressed constitutively, served as a control for normalization. Cells were seeded in a 12-well plate 24 h prior to transfection, and pGL3-basic vectors carrying a series of truncated forms of the rat Park2 promoter region were co-transfected with pRL-TK using Lipofectamine 2000. After transfection for 12 h, the cells were collected in I(-) medium and re-seeded in a 24-well plate. Luciferase assay was conducted by using a Dual-Glo Luciferase Assay System (Promega) according to the manufacturer’s instructions. Freshly prepared Dual-Glo luciferase reagent solution was added to the cells and luciferase activity was measured in a white 96-well plate in a SpectraMax L luminometer. We measured and analyzed the data using “photon counting mode” of SoftMax Pro Software. We calculated the relative values of each result based on I(+).
Statistics
Data from at least three independent experiments were expressed as the mean ± standard error (SEM). “n = ” represents a number of cells, unless otherwise stated. Statistical significance was determined using the paired t-test for two-group experiments. For experiments with three or more groups, comparisons were made using one-way analysis of variance and Tukey’s test. GraphPad Prism 5 (GraphPad Software, San Diego, CA, United States) was used to analyze the data. Differences were considered statistically significant for p-values < 0.05.
Results
Insulin Withdrawal Induces ADCD With Mitochondrial Alterations in HCN Cells
HCN cells depend on insulin for their survival and proliferation (Palmer et al., 1997). Insulin withdrawal significantly increased cell death (Figure 1A). Consistent with our previous reports (Yu et al., 2008; Baek et al., 2009) on the non-apoptotic nature of insulin withdrawal-induced death of HCN cells, caspase 3 activity (Figure 1B) and the number of activated, cleaved caspase 3 (C.Casp3)-positive cells remained very low despite an increase in cell death, indicating no involvement of apoptosis (Figures 1C,D). On the other hand, a robust induction of caspase 3 activation by the well-known prototypical apoptosis inducer STS demonstrates normal apoptotic capability of HCN cells (Figures 1B–D). We also confirmed that DNA fragmentation, a marker of apoptosis, did not occur in insulin-deprived HCN cells (Figure 1E). 63% of total cells were TUNEL-positive by STS-treatments, but TUNEL-positive cells were not observed in either I(+) or I(-) condition. Also, ineffectiveness of pan caspase inhibitor Z-VAD against insulin withdrawal-induced death of HCN cells have been reported in our previous studies (Chung et al., 2015; Ha et al., 2015). These results support non-apoptotic nature of insulin withdrawal-induced HCN cell death. In addition, insulin-deprived HCN cells did not undergo necrosis. Necrostatin-1, an inhibitor of necroptosis, blocked cell death induced by H2O2 but did not prevent cell death induced by insulin withdrawal (Figure 1F). We also reported that suppression of autophagy by knockdown of Atg7 prevented HCN cell death following insulin withdrawal, indicating the causative role of autophagy in cell death (Yu et al., 2008). Characterization of cell death mode excluded apoptosis and necroptosis. Therefore, we presumed that PI/Hoechst-based cell death assay approximately measures total cell death under insulin withdrawal condition.
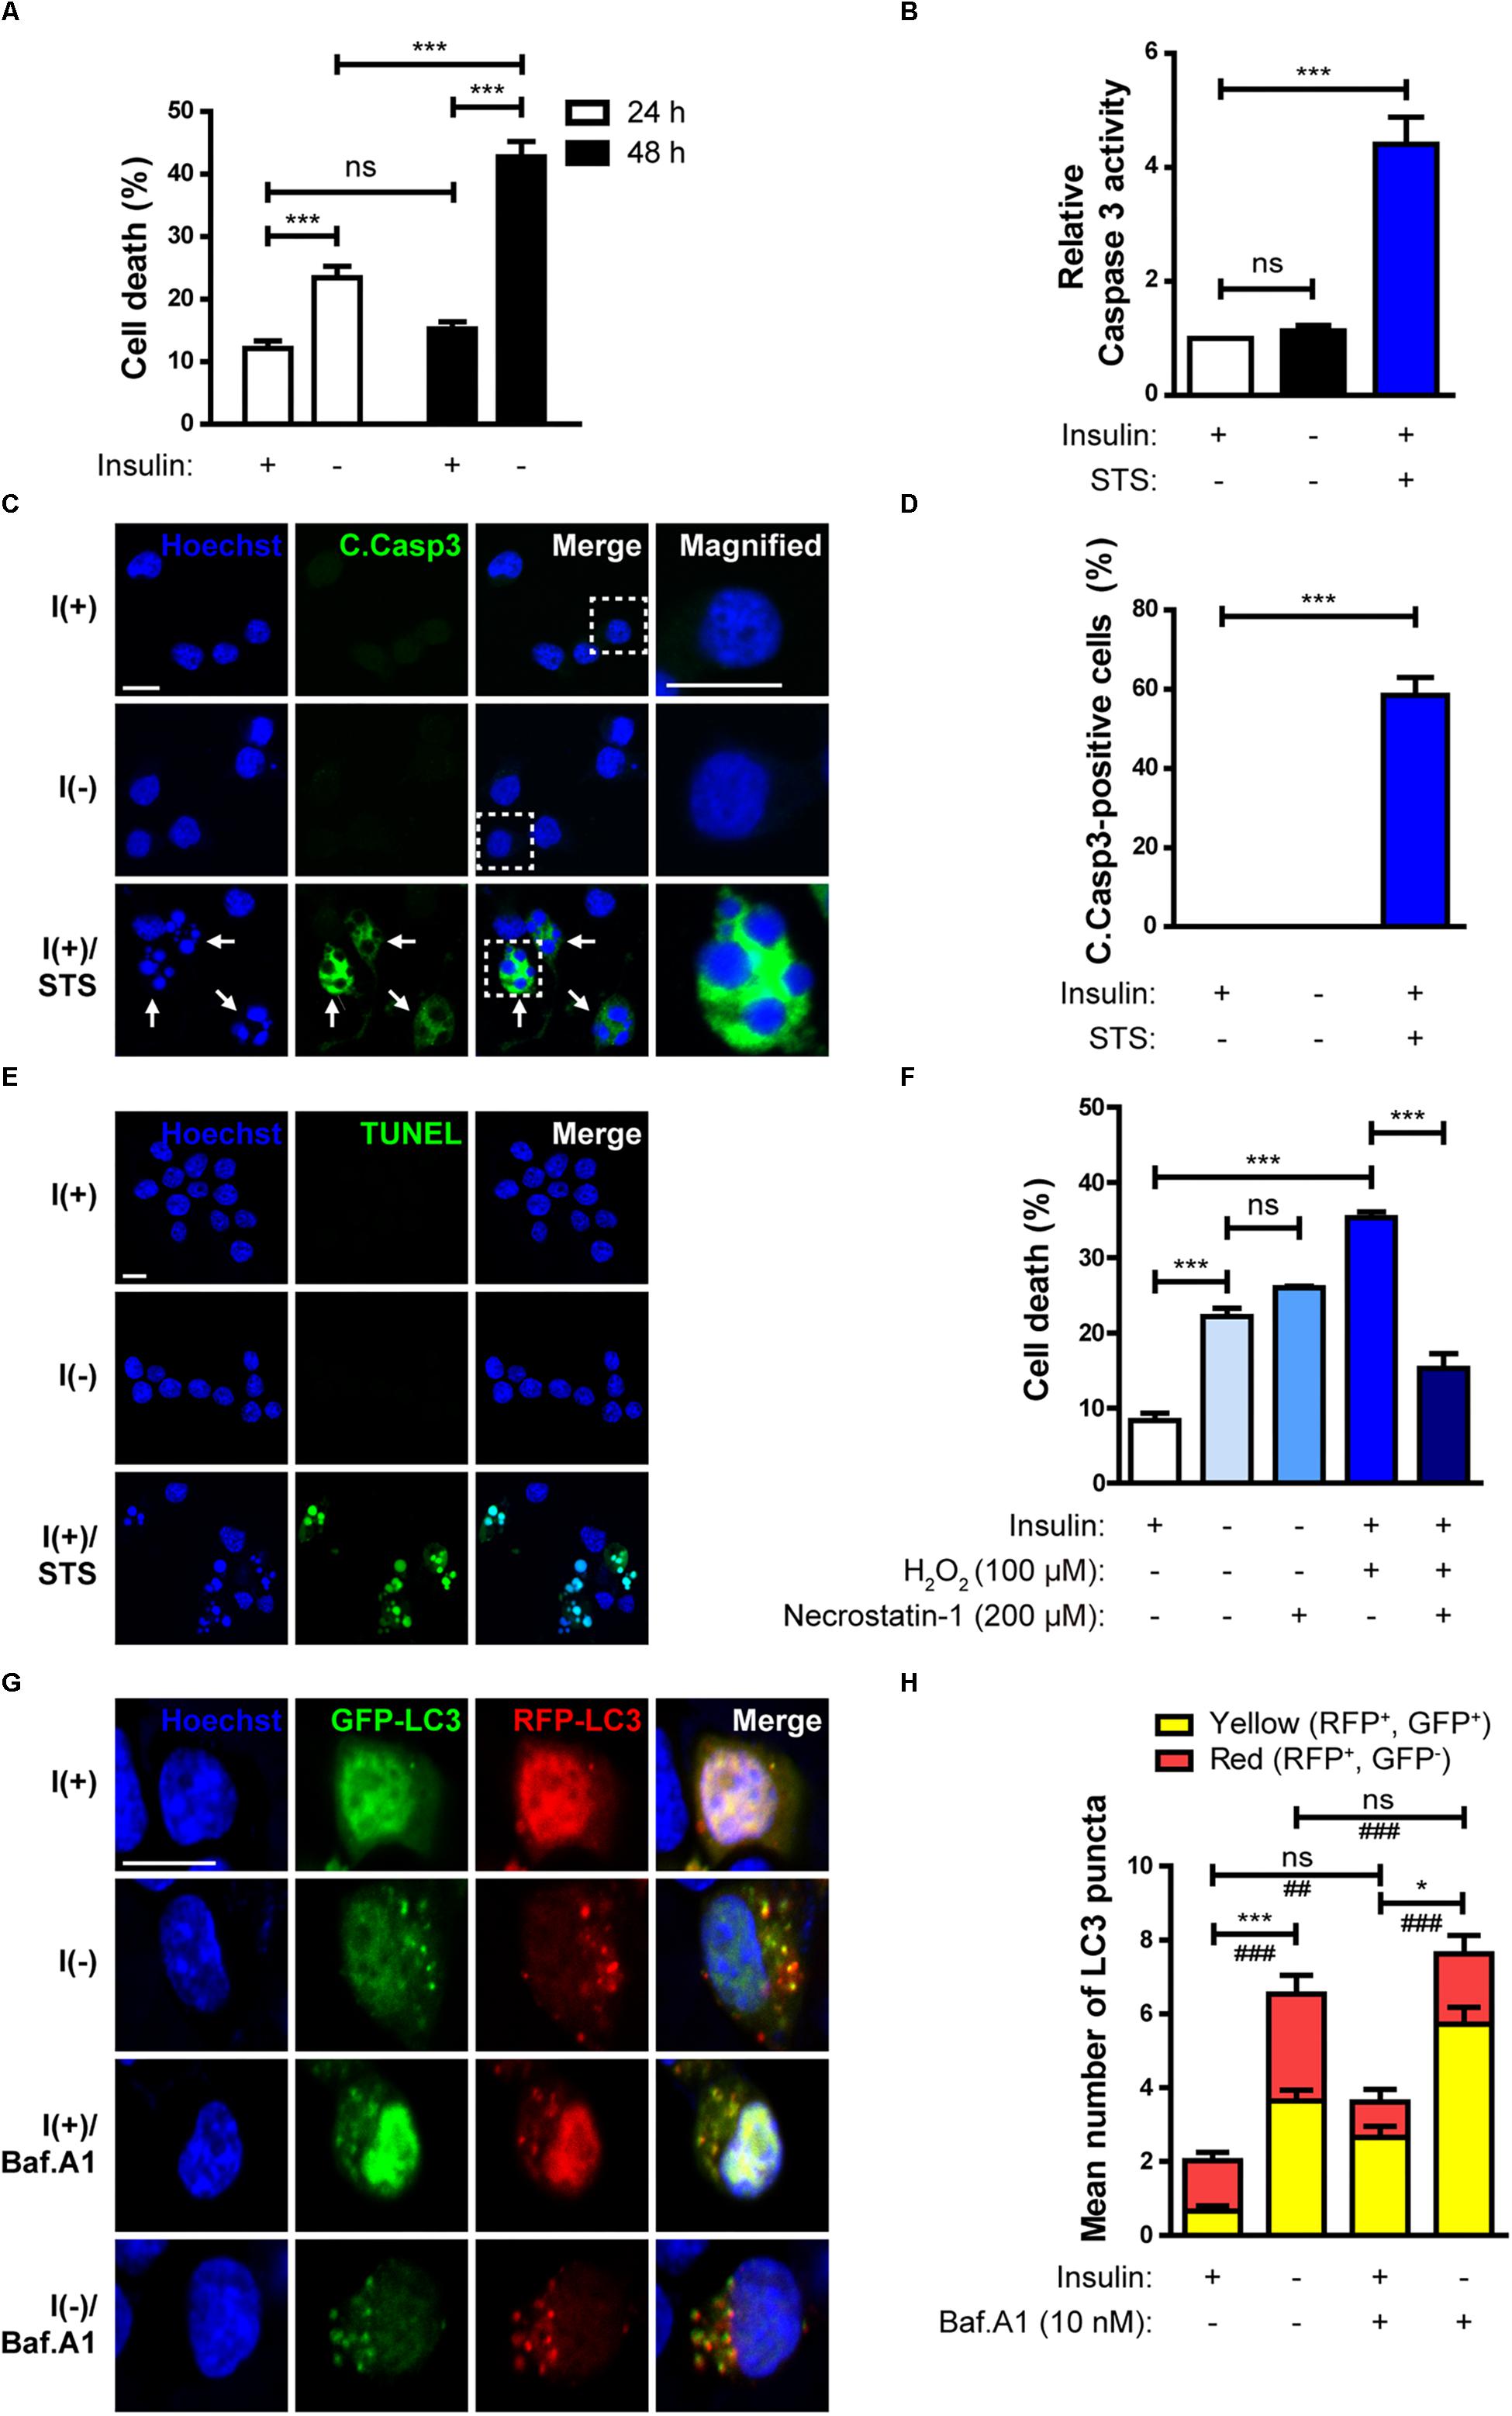
Figure 1. Insulin withdrawal induces autophagy-dependent cell death (ADCD) in adult hippocampal neural stem (HCN) cells. (A) Cell death rates in insulin-deprived HCN cells after insulin withdrawal for 24 and 48 h (n = 3). (B) Caspase 3 activity after insulin withdrawal for 24 h. HCN cells were treated with staurosporine (STS; 0.5 μM) for 3 h as a positive control of apoptosis (n = 4). (C) Immunocytochemical detection of cleaved caspase 3 (C.Casp3) in HCN cells after insulin withdrawal for 24 h. Cells were treated with STS (0.5 μM, 8 h) (n = 47 cells for I(+), 50 cells for I(-), 56 cells for I(+)/STS from 3 independent experiments). Arrows indicate fragmented nuclei in C.Casp3-positive cells. Scale bars, 10 μm. (D) Quantification of C.Casp3-positive cells from (C) (n = 47 cells for I(+), 50 cells for I(-), 56 cells for I(+)/STS from 3 independent experiments). (E) TUNEL assay in HCN cells after insulin withdrawal for 24 h. Cells were treated with STS (0.5 μM, 8 h) (n = 258 cells for I(+), n = 310 cells for I(-), n = 340 cells for I(+)/STS from 3 independent experiments). Scale bar, 10 μm. (F) Cell death rates in insulin-deprived HCN cells treated with necrostatin-1 after insulin withdrawal for 24 h (n = 3). (G) Assessment of autophagy flux by mRFP-GFP-LC3 puncta assay after insulin withdrawal for 24 h. Cells were treated with Baf.A1 (10 nM) for 1 h before harvesting. Scale bar, 10 μm. (H) Quantification of red and yellow LC3 puncta from (G) (n = 47 cells for I(+), 40 cells for I(+)/Baf.A1, 52 cells for I(-), 50 for I(-)/Baf.A1 from 3 independent experiments). ∗p < 0.05, ∗∗∗p < 0.001 for the red puncta; ##p < 0.01, ###p < 0.001 for the yellow puncta; ns, not significant.
To measure autophagic flux, immunofluorescence assay using mRFP-GFP-LC3 was performed. The GFP, but not RFP signal is readily quenched in acidic conditions, such as within the autolysosomes (Kimura et al., 2007). As a result, autophagosomes and autolysosomes are observed as yellow (RFP+GFP+) and red (RFP+GFP−) puncta, respectively (Kimura et al., 2007). In insulin-deprived HCN cells, the number of both the yellow and red LC3 puncta increased, indicating an increase in autophagy flux in comparison with I(+) HCN cells (Figures 1G,H). In addition, when autophagosome maturation was blocked by treatment with Baf.A1, which inhibits fusion between autophagosomes and lysosomes, accumulation of yellow LC3 puncta in I(-) HCN cells was much higher than without Baf.A1 treatment, confirming a robust biogenesis of autophagic vesicles in I(-) HCN cells (Figures 1G,H).
Taken together, insulin withdrawal-induced cell death meets the following criteria: (i) increased autophagic flux is observed (this study; Yu et al., 2008; Baek et al., 2009); (ii) suppression of autophagy prevents cell death (Yu et al., 2008); and (iii) alternative cell death pathways such as apoptosis and necrosis are not involved (this study; Yu et al., 2008; Chung et al., 2015; Ha et al., 2015). Thus, from the current and our previous data we concluded that insulin-deprived HCN cells undergo ADCD.
Our previous observation suggests that insulin withdrawal induces an increase in cytosolic Ca2+ that originates from the ER (Chung et al., 2016). We hypothesized that this increase may induce mitochondrial Ca2+ accumulation. To measure mitochondrial Ca2+ level, we co-transfected HCN cells with RFP-LC3 and Case12-mito, which is an indicator of mitochondrial Ca2+ level (Takeuchi et al., 2013). Co-transfection with RFP-LC3 and Case12-mito showed an increase in mitochondrial Ca2+ levels in autophagy-induced cells following insulin withdrawal (Figures 2A,B). Since elevated mitochondrial Ca2+ could cause mitochondrial depolarization (Baumgartner et al., 2009), we next examined mitochondrial depolarization by staining HCN cells with MitoTracker Deep Red or TMRE, which are sequestered in healthy, polarized mitochondria, but are excluded from depolarized mitochondria (Scaduto, R. C. Jr. and Grotyohann, 1999). Fluorescence-activated cell sorting (FACS) analysis of HCN cells co-stained with MitoTracker Green (to ensure the equal number of total mitochondria) and MitoTracker Deep Red (for measurement of mitochondria membrane potential) revealed a reduced number of MitoTracker Deep Red–positive cells, indicating an increase in mitochondrial depolarization following insulin withdrawal (Figure 2C). This result was confirmed by fluorescence microscopy, which showed lower staining intensity of TMRE in I(−) HCN cells than in I(+) HCN cells (Figures 2D,E).
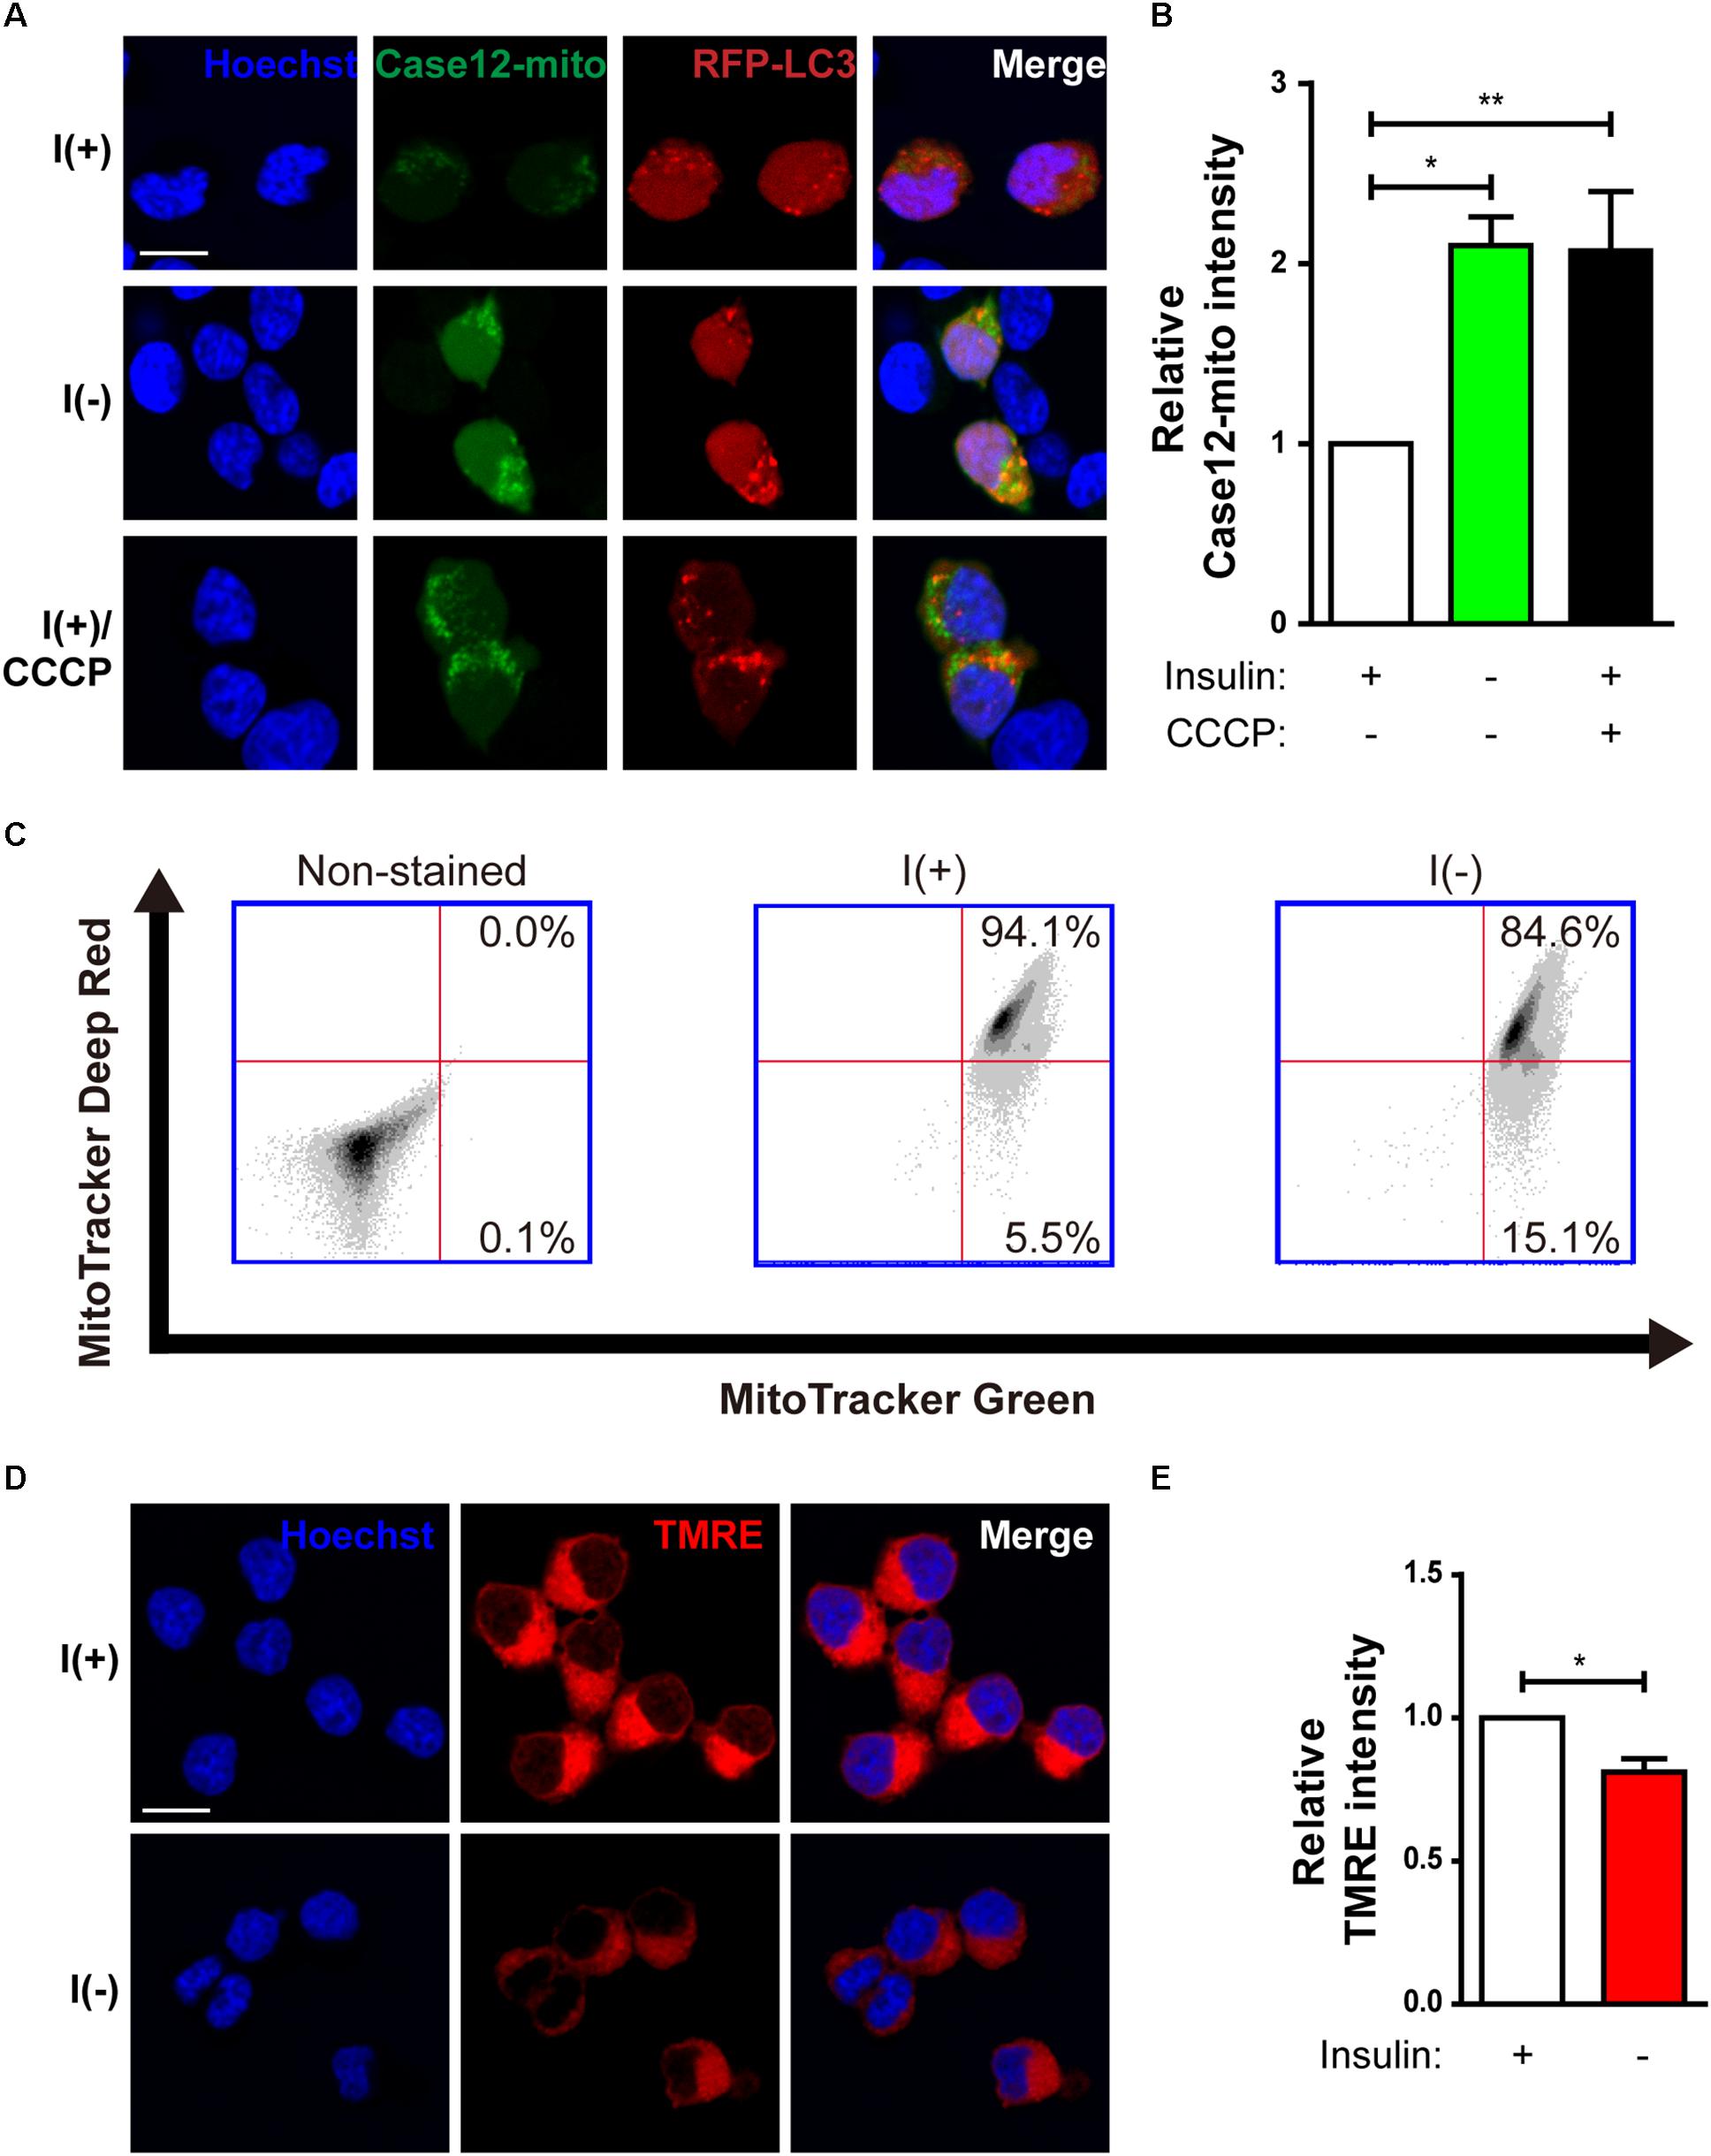
Figure 2. Changes in mitochondria of HCN cells after insulin withdrawal. (A) Assessment of mitochondrial Ca2+ levels using Case12-mito after insulin withdrawal for 24 h. Scale bar, 10 μm. (B) Quantification of fluorescence intensity of Case12-mito in HCN cells (n = 33 cells for I(+), 25 cells for I(-), 36 cells for I(+)/CCCP from 3 independent experiments). (C) FACS analysis of HCN cells stained with MitoTracker Green to determine the total number of mitochondria and MitoTracker Deep Red to determine the number of depolarized mitochondria after insulin withdrawal for 24 h. 30,000 cells were analyzed in each experiment. (D) Fluorescence imaging analysis of TMRE-stained HCN cells. Scale bar, 10 μm. (E) Quantification of fluorescence intensity of TMRE in HCN cells (n = 12 cells from 2 independent experiments). Relative TMRE intensity of fluorescence microscope image was measured by image J. ∗p < 0.05, ∗∗p < 0.01.
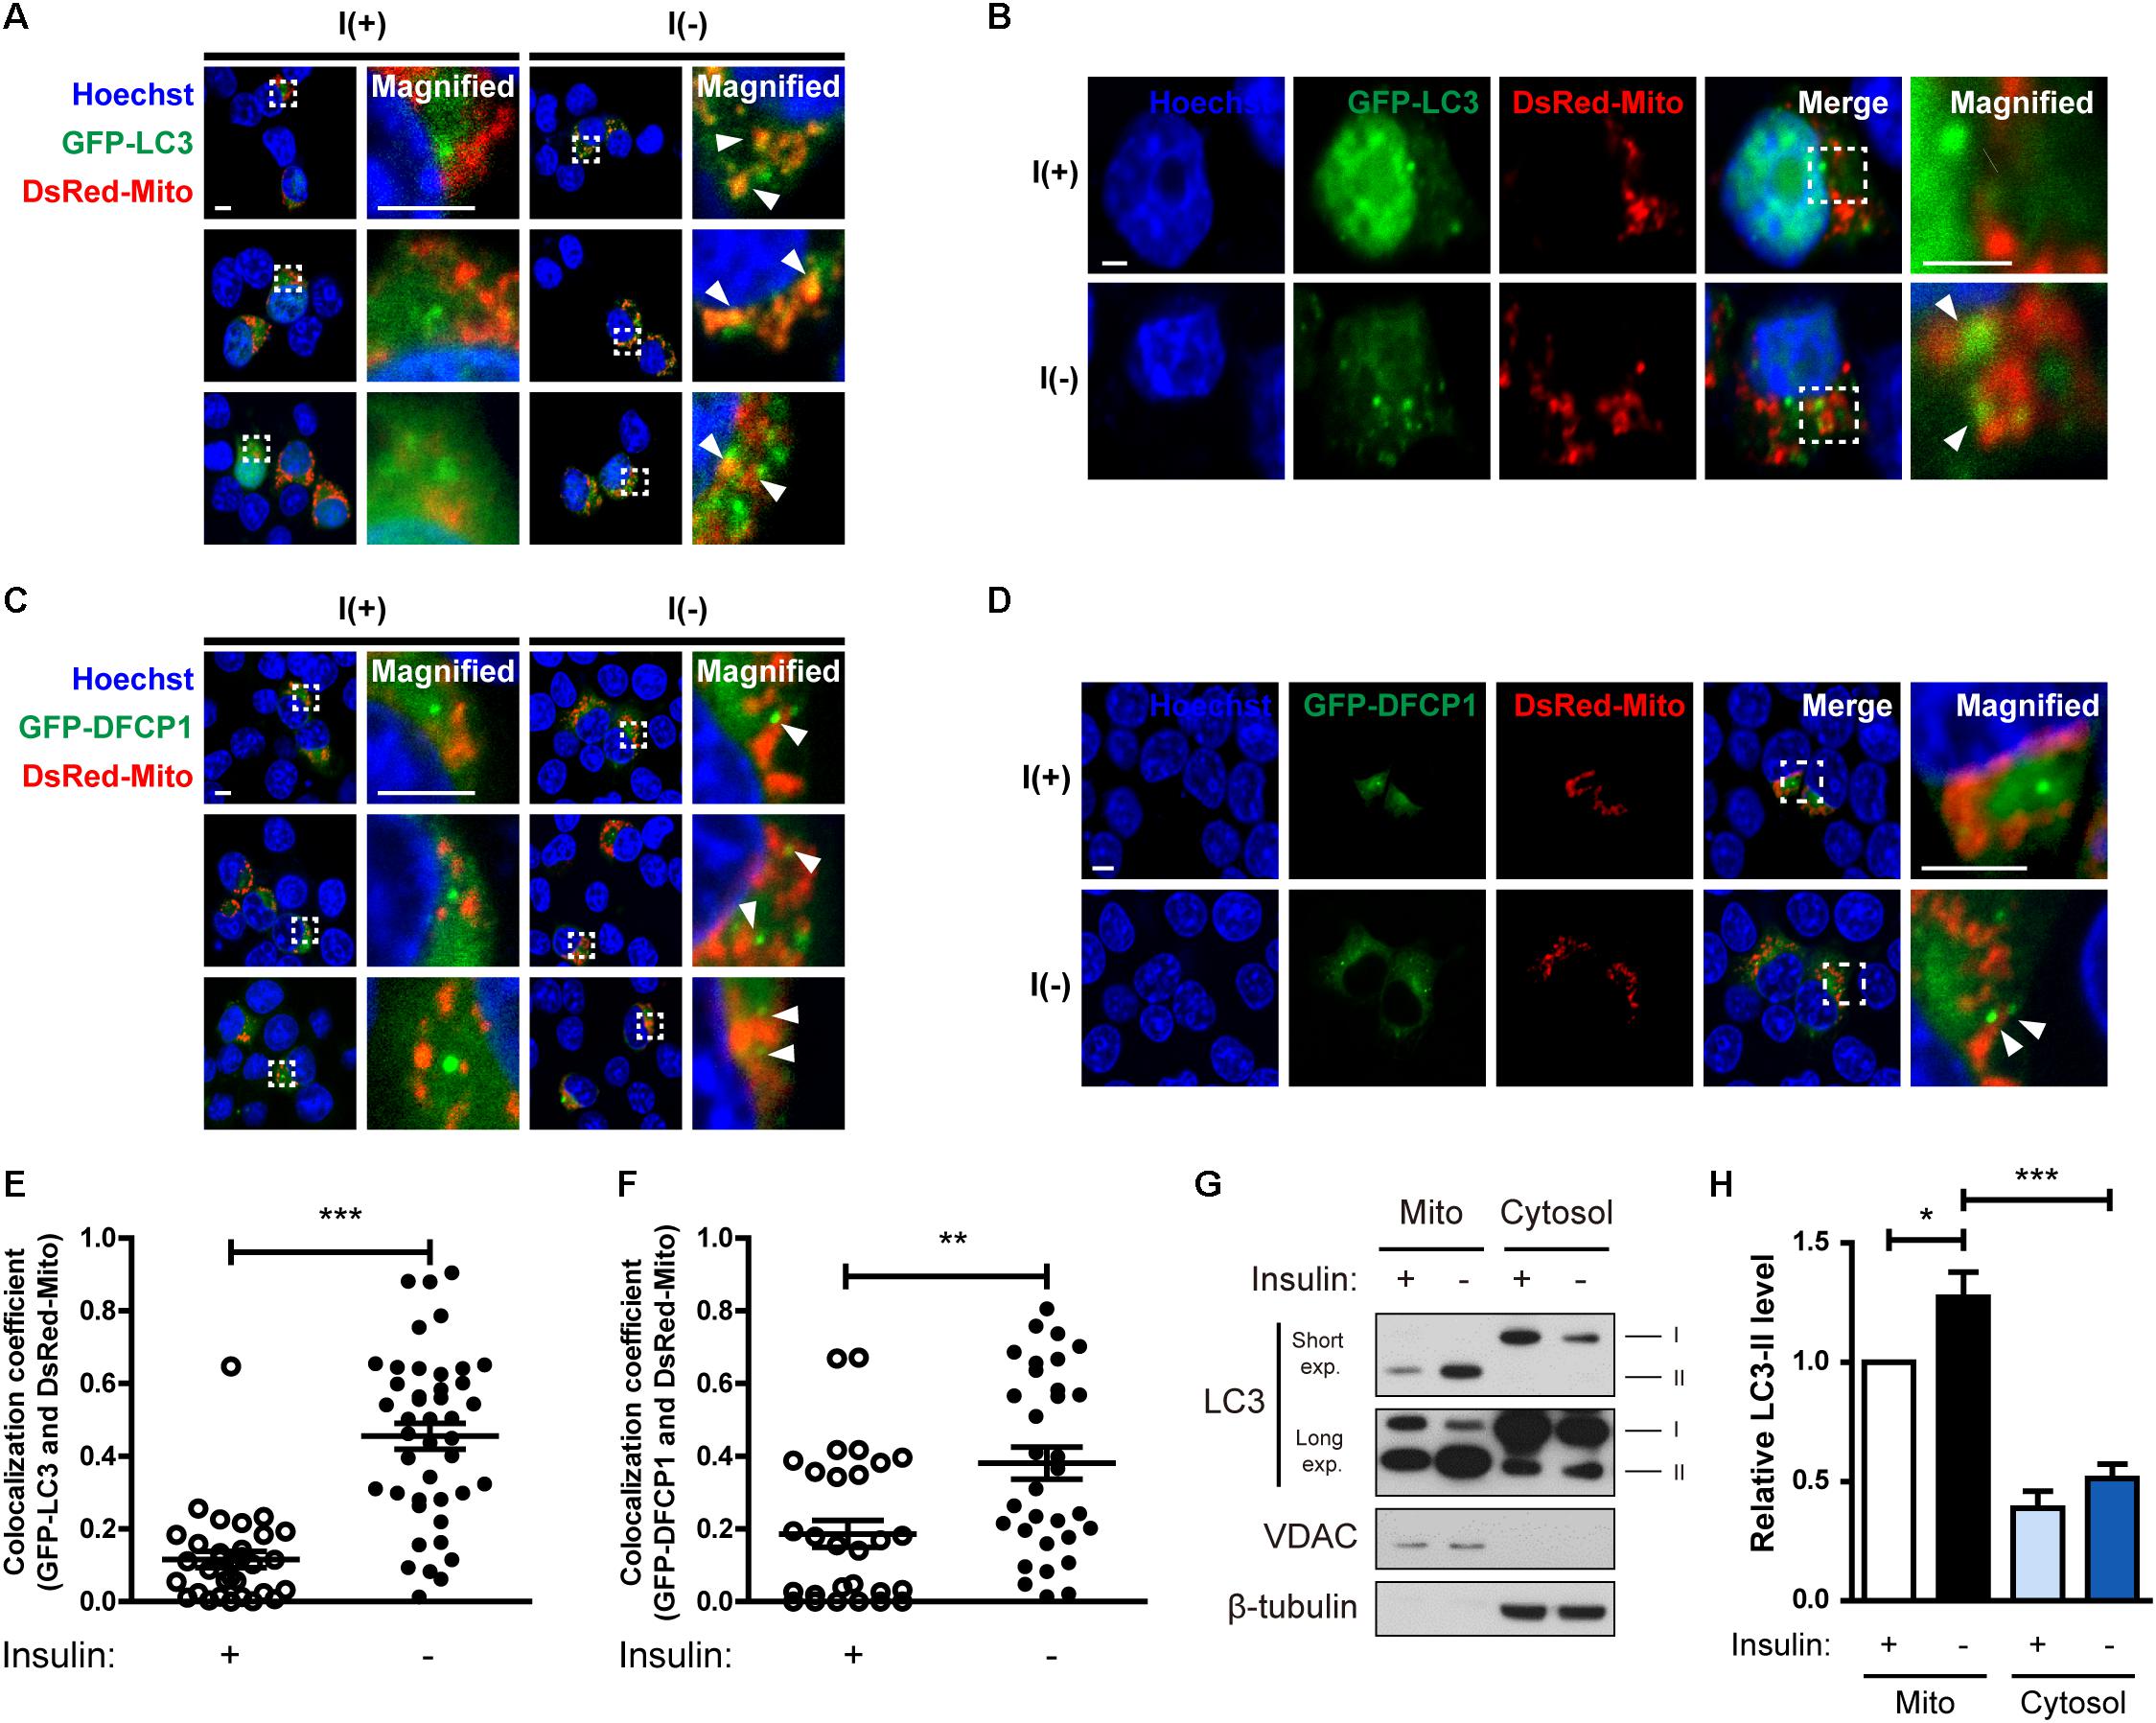
Figure 3. Insulin-deprived HCN cells undergo excessive mitophagy. (A,B) Colocalization of GFP-LC3 and DsRed-Mito (arrowheads) after insulin withdrawal for 24 h. Scale bars, 5 μm for (A), 2 μm for (B). (C,D) Immunofluorescence of GFP-DFCP1 and DsRed-Mito after insulin withdrawal for 24 h. Arrowheads indicate colocalization of GFP-DFCP1 and DsRed-Mito. Scale bars, 5 μm for (C), 2 μm for (D). (E) Quantification of colocalization of LC3 and mitochondria (n = 31 cells for I(+), 42 cells for I(-) from 3 independent experiments). (F) Quantification of colocalization of DFCP1 and mitochondria (n = 30 cells for I(+), 33 cells for I(-) from 3 independent experiments). (G) Western blotting analysis of mitochondrial translocation of LC3 after insulin withdrawal for 24 h. Mito, mitochondrial fraction; cytosol, cytosolic fraction. The blots shown are representative of four experiments with similar results. (H) Quantification of LC3-II levels (n = 4) from (G). ∗p < 0.05, ∗∗p < 0.01, ∗∗∗p < 0.001.
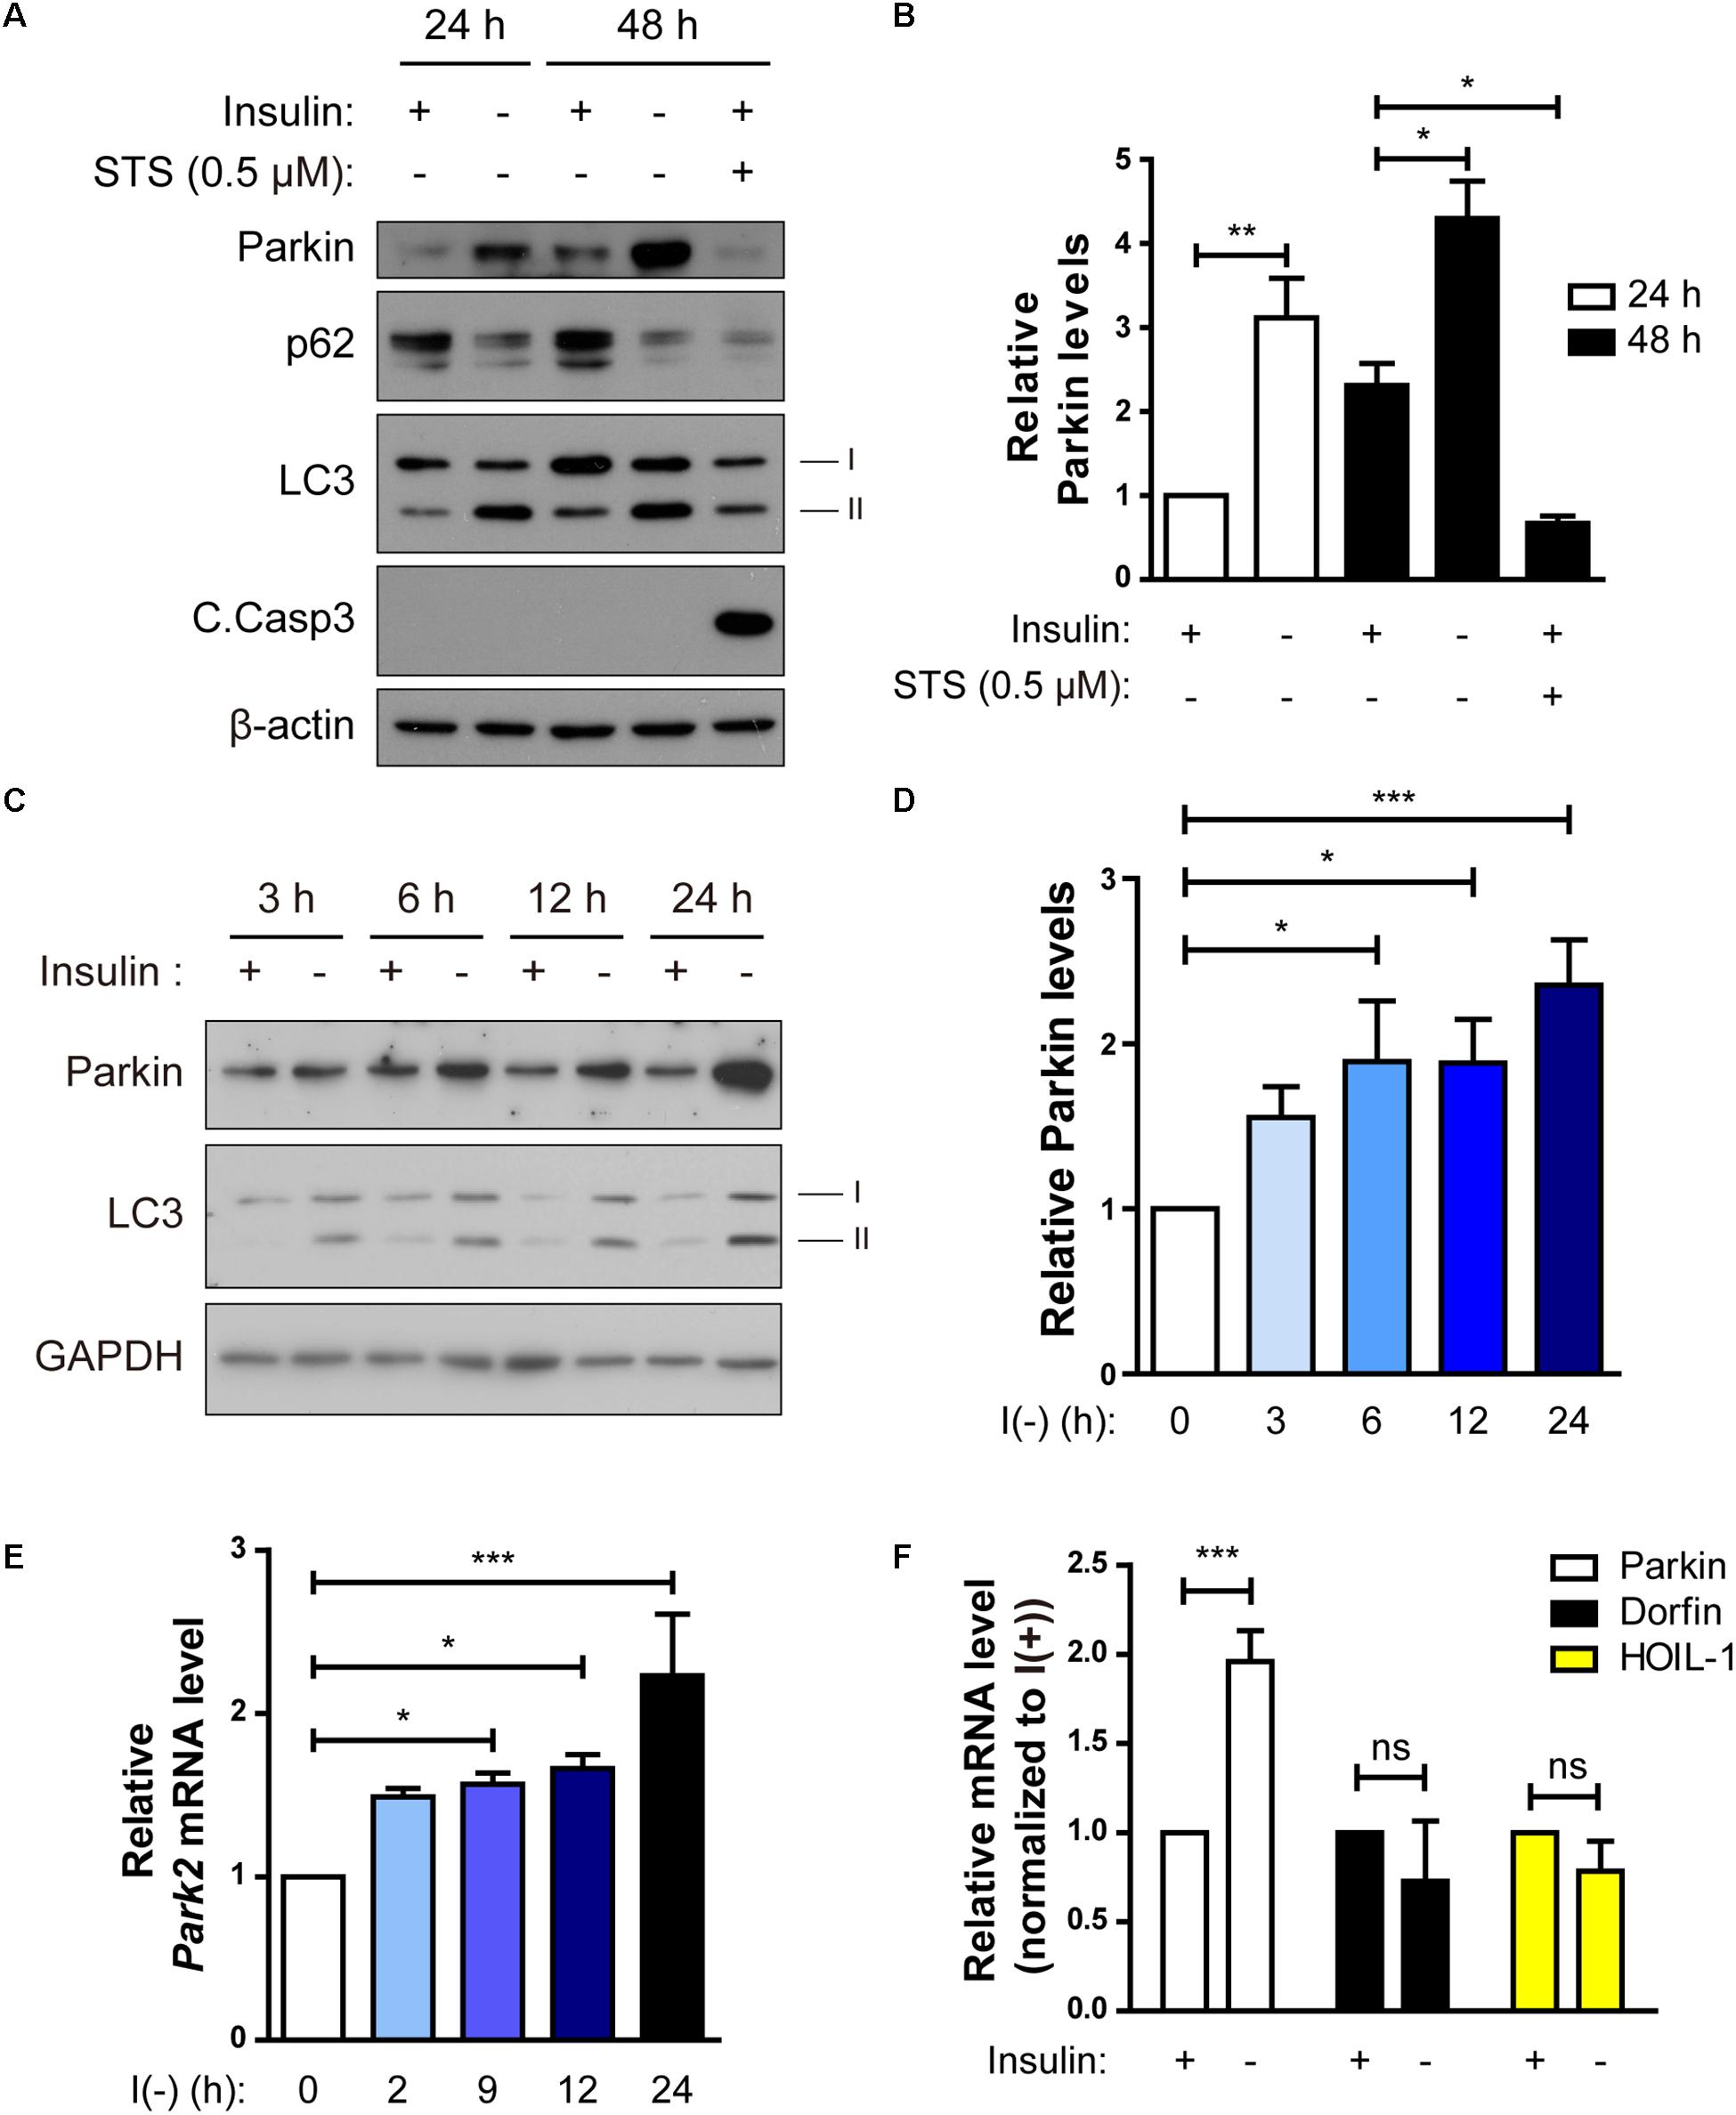
Figure 4. Parkin expression is upregulated following insulin withdrawal. (A) Western blotting analysis of Parkin protein level in HCN cells after insulin withdrawal for 24 and 48 h. (B) Quantification of Parkin protein level (n = 3 or 4). (C) Time course analysis of Parkin protein levels following insulin withdrawal. (D) Quantification of Parkin protein levels (n = 5) from (C). (E) Time course analysis of mRNA levels of Parkin following insulin withdrawal (n = 4). (F) Changes in the mRNA levels of Parkin, Dorfin, and HOIL-1 (n = 3–7). ∗p < 0.05, ∗∗p < 0.01, ∗∗∗p < 0.001; ns, not significant.
Insulin-Deprived HCN Cells Undergo Excessive Mitophagy
Because we observed mitochondrial Ca2+ accumulation and depolarization during ADCD, we next examined whether depolarized mitochondria underwent mitophagy. Co-transfection of HCN cells with GFP-LC3 and DsRed-Mito showed that their overlap was increased by insulin withdrawal Figures 3A,B,E). Phosphatidylinositol 3-phosphate (PI3P) is a key signaling lipid for recruitment of autophagy effector proteins to initiate autophagosome generation (Burman and Ktistakis, 2010). DFCP1 contains PI3P-recognizing FYVE domains and binds to PI3P, and thus can serve as a marker of autophagosome nucleation (Axe et al., 2008). Therefore, we assessed translocation of DFCP1 to the vicinity of damaged mitochondria as another measure of mitophagy (Lazarou et al., 2015). I(-) HCN cells showed not only more DFCP1 puncta, but also increased colocalization of DFCP1 and mitochondria in comparison with I(+) HCN cells, confirming the occurrence of mitophagy (Figures 3C,D,F).
As an alternative approach to demonstrate the localization of LC3 in mitochondria, we used subcellular fractionation. Successful separation of mitochondrial and cytosolic fractions was verified by Western blotting analysis using VDAC and β-tubulin as respective markers for these fractions. We observed more LC3-II in the mitochondrial fraction of I(-) HCN cells than in that of I(+) cells (Figures 3G,H). These results suggest that mitophagy is induced in HCN cells following insulin withdrawal.
Parkin Is Upregulated Through Inhibition of Its Transcriptional Repressor c-Jun in Insulin-Deprived HCN Cells
Parkin-mediated mitophagy has been actively studied (Narendra et al., 2008). However, it remains ill-defined whether Parkin-dependent mitophagy can contribute to cell death. Since we observed mitophagy in insulin-deprived HCN cells undergoing ADCD, we wondered if Parkin is involved in ADCD through regulation of mitophagy. To that end, we first checked Parkin levels in HCN cells following insulin withdrawal. Parkin protein levels were significantly increased 24 and 48 h after insulin withdrawal (Figures 4A,B). We compared the time course of Parkin upregulation with that of autophagy flux induction following insulin withdrawal. An increase in Parkin protein amount was first observed as early as 3 h after insulin withdrawal, which coincided well with an increase in autophagy flux (Figures 4C,D). Related to its protein levels, its transcript levels also increased significantly following insulin withdrawal (Figure 4E). Interestingly, Parkin protein level was decreased when apoptosis was induced by STS, suggesting the potential ADCD-specific role of Parkin in HCN cells (Figures 4A,B). Like Parkin, Dorfin, and HOIL-1 are also RING-IBR-RING-finger domain E3 ligases present in the brain (Niwa et al., 2002; Tanaka et al., 2004). Interestingly, their mRNA levels were not altered in response to insulin withdrawal (Figure 4F).
Because upregulation of the Parkin mRNA level by insulin withdrawal seemed to play an important role in ADCD of HCN cells, we investigated the regulation of Parkin gene transcription in insulin-deprived HCN cells. First, to delineate the Park2 promoter region critical for transcription, we cloned a 2.5-kilobase rat Park2 promoter fragment in the pGL3-luc vector in front of a sequence encoding luciferase and measured Park2 promoter activity by luciferase assay. Luciferase expression driven by the cloned Park2 promoter fragment led to substantial luciferase activity in the basal condition (presence of insulin) in comparison with the empty vector (Figure 5A). Activity was further increased by insulin withdrawal (Figure 5A). Next, we cloned a series of truncated versions of the Park2 promoter to find the sequences critical for Park2 transcription and found that 500 bp upstream of the Park2 gene is the core promoter region (Figure 5B).
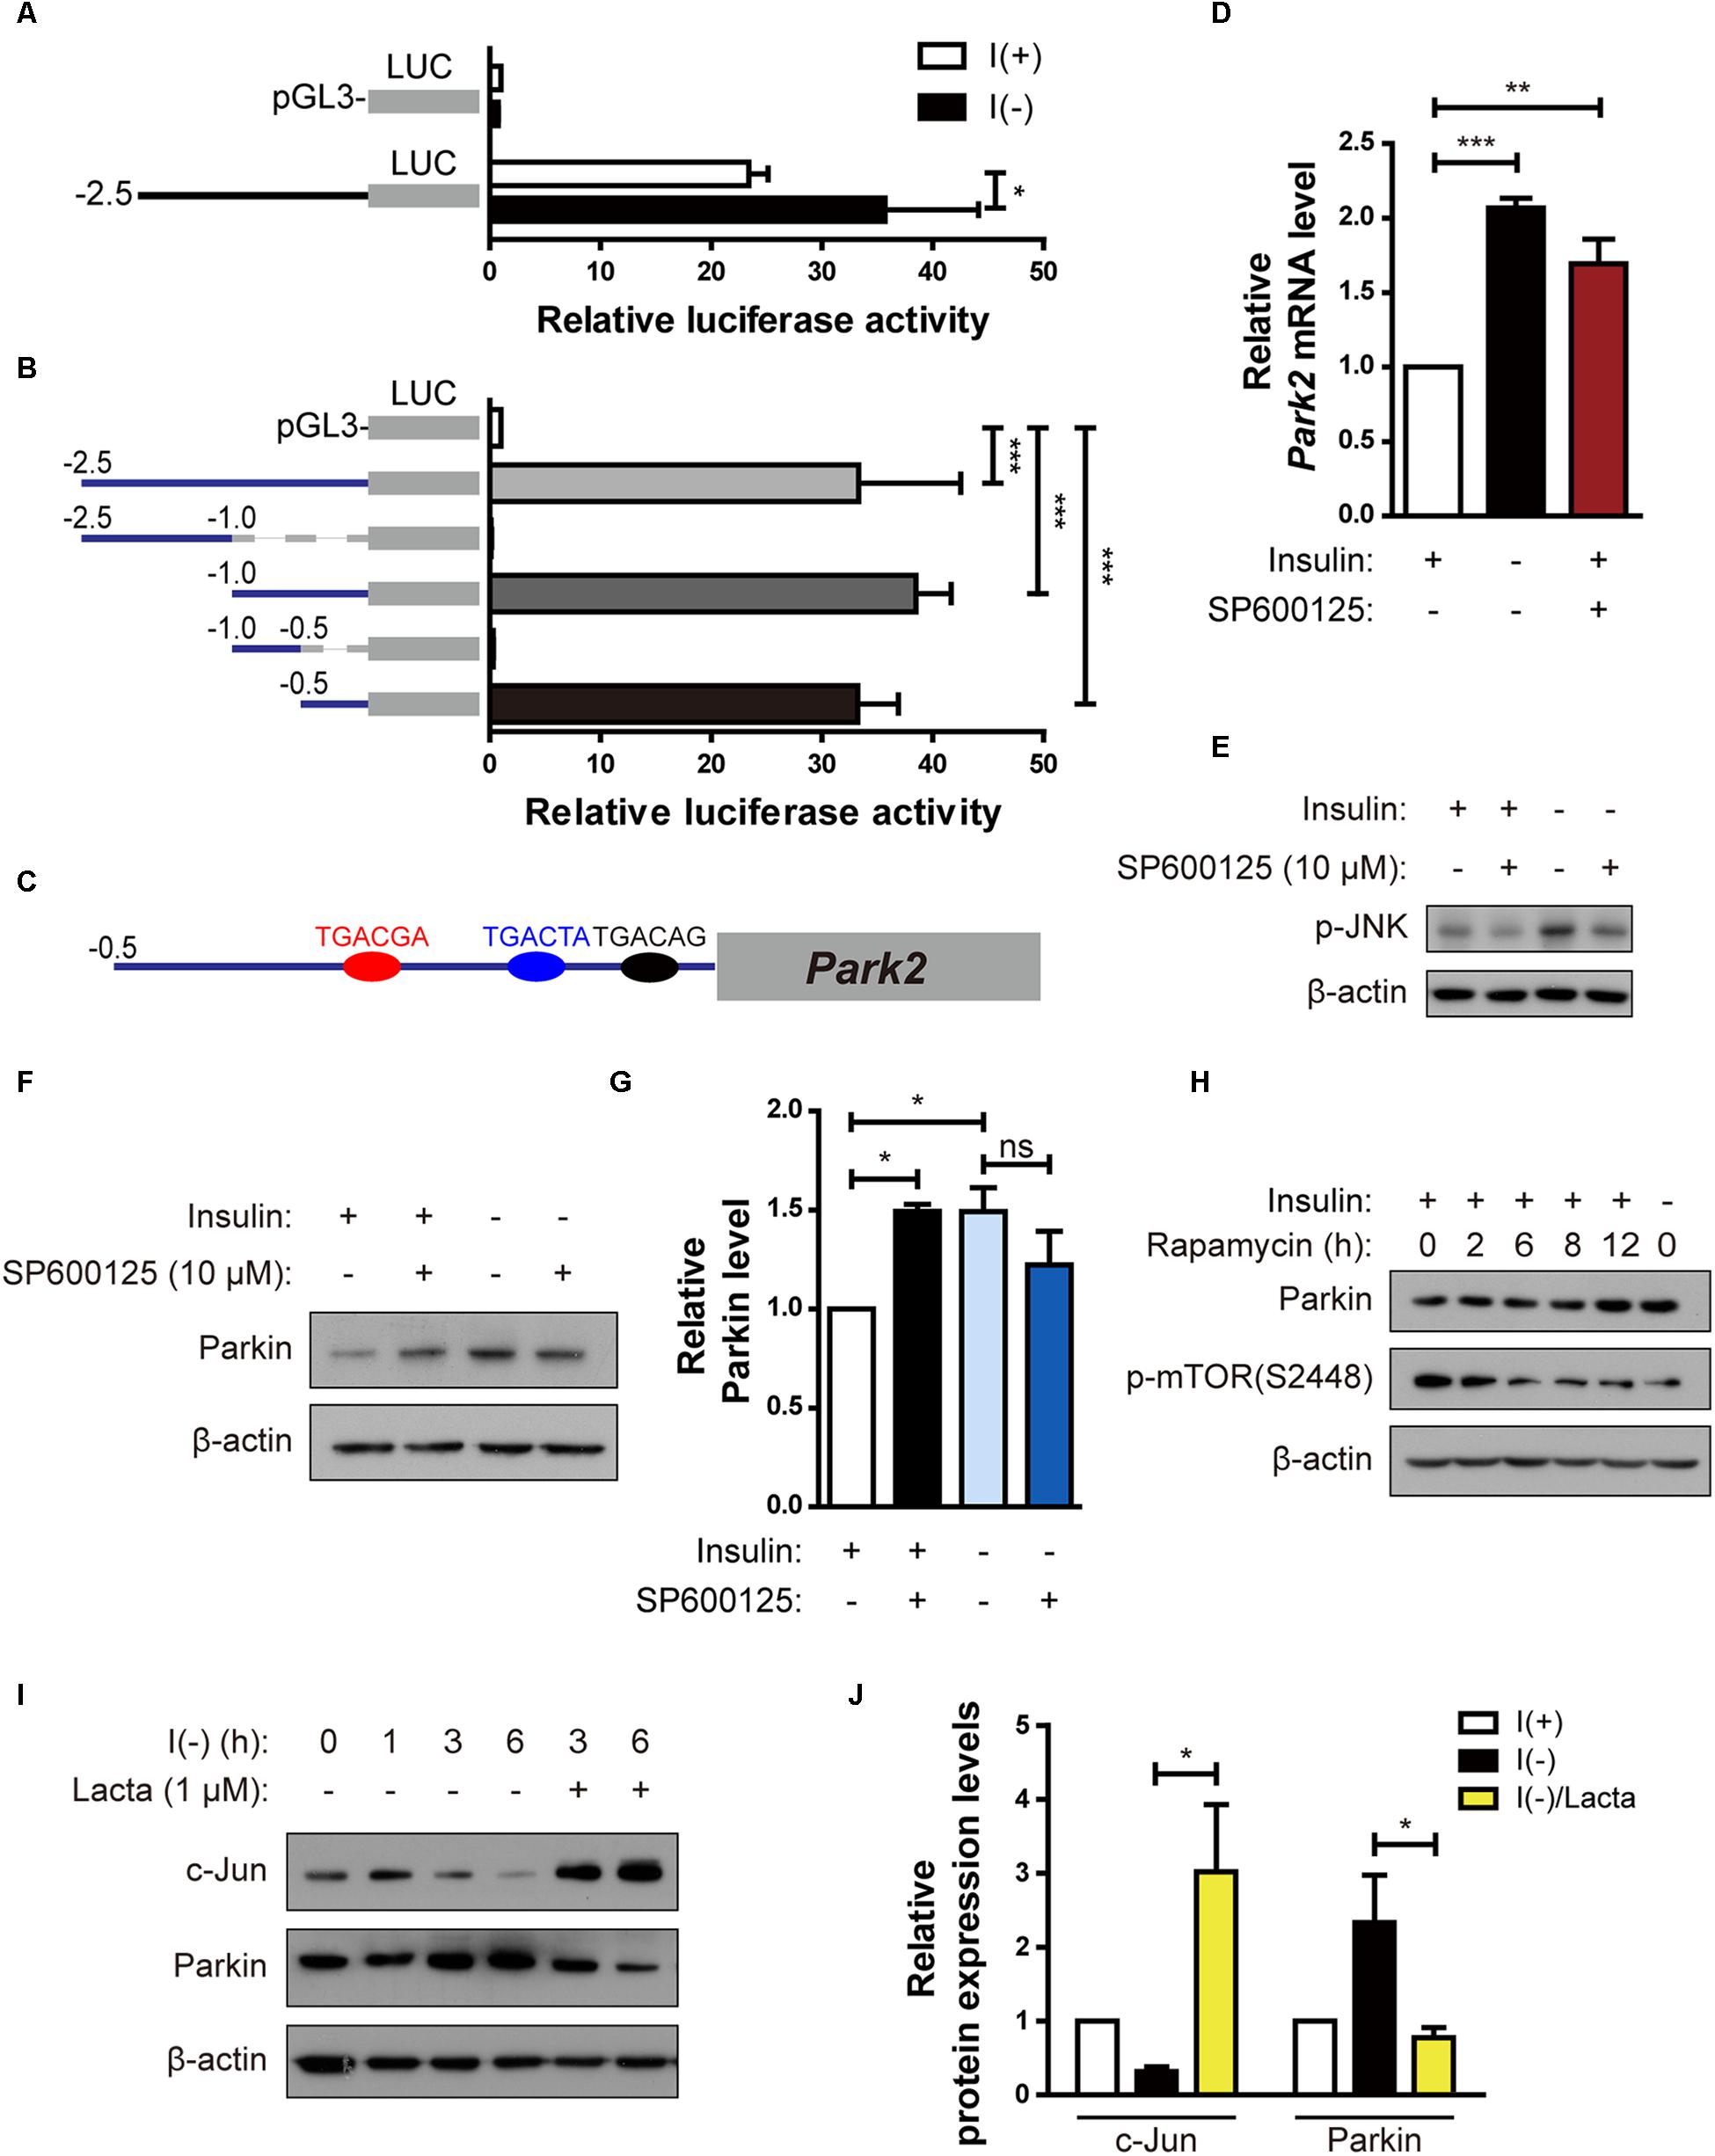
Figure 5. Parkin is upregulated in HCN cells by degradation of c-Jun, a transcriptional repressor, following insulin withdrawal. (A) Luciferase activity assay to analyze Park2 promoter activity after insulin withdrawal for 24 h (n = 3). (B) Activities of various truncated fragments of the Park2 promoter in I(+) cells. Promoter activity was measured using a luciferase assay (n = 3–7). (C) Prediction of c-Jun-binding sites in the Park2 promoter region. (D) Parkin mRNA level in HCN cells treated with SP600125, an ATP-dependent JNK inhibitor, (10 μM) for 8 h in comparison with that in I(-) HCN cells after insulin withdrawal for 24 h (n = 3). (E) Western blotting analysis of p-JNK levels in HCN cells after insulin withdrawal for 2 h. SP600125 (10 μM) was treated 10 μM for 2 h. The blots shown are representative of three experiments with similar results. (F) Western blotting analysis of Parkin protein levels in SP600125 (10 μM, 8 h) -treated HCN cells. The blots shown are representative of five experiments with similar results. (G) Quantification of Parkin levels (n = 5) from (F). (H) Increased Parkin protein levels in HCN cells treated with Rapamycin (20 nM, 2 h), a mTOR inhibitor. (I) Time course analysis of c-Jun protein levels following insulin withdrawal in comparison with lactacystin treatment (Lacta, 1 μM). (J) Quantification of c-Jun and Parkin protein levels in I(-) HCN cells treated with or without Lacta (1 μM) for 6 h (n = 3). ∗p < 0.05, ∗∗p < 0.01, ∗∗∗p < 0.001.
Next, we used the PROMO program (Messeguer et al., 2002; Farré et al., 2003) to predict the candidate transcription factors that may participate in both Parkin transcription and autophagy. Binding element analyses predicted several candidate transcription factors, including c-Jun because there were three potential c-Jun-binding sites in the Park2 promoter region (Figure 5C). c-Jun is a transcription factor phosphorylated and activated mainly by c-Jun NH2 terminal kinase (JNK) (Minden et al., 1994). Based on prior reports on c-Jun functions in autophagy inhibition (Yogev and Shaulian, 2010) and Park2 transcriptional repression (Bouman et al., 2011), we hypothesized that c-Jun decreases Parkin level. To test this hypothesis, we used an ATP-competitive JNK inhibitor, SP60015, to block phosphorylation of c-Jun by JNK. SP600125 treatment increased Parkin mRNA and protein levels in the presence of insulin, suggesting that Park2 is under transcriptional repression by c-Jun in the I(+) condition when Parkin level is low (Figures 5D–G). However, Parkin expression levels was not further increased by SP600125 treatment in insulin-deprived HCN cells (Figures 5F,G), probably due to already high Parkin protein level in I(-) HCN cells. Inactivation of the mammalian target of rapamycin (mTOR)-Akt pathway in I(-) HCN cells was observed previously (Yu et al., 2008). To test whether the mTOR-Akt cascade is involved in Parkin expression, we checked the Parkin expression levels in I(+) condition with rapamycin, which is an mTOR inhibitor. We observed increased Parkin expression in rapamycin-treated I(+) HCN cells, suggesting the involvement of mTOR-Akt pathway in regulation of Parkin following insulin withdrawal in HCN cells (Figure 5H).
If c-Jun is a transcriptional repressor of the Park2 gene, then its level should decrease following insulin withdrawal to allow the upregulation of the Parkin mRNA level. To validate this notion, we assessed changes in c-Jun protein in the absence of insulin. c-Jun protein amount was reduced in a time-dependent manner with kinetics similar to that of Parkin increase (Figure 5I). This gradual decrease in c-Jun level was due to its degradation via the ubiquitin–proteasome system, since the proteasome inhibitor lactacystin prevented c-Jun degradation (Figures 5I,J). Lactacystin-mediated blockage of c-Jun degradation decreased the Parkin protein level under insulin withdrawal conditions, confirming the inhibitory role of c-Jun in Parkin expression (Figures 5I,J). Taken together, these data reveal that c-Jun is a transcriptional repressor of the Park2 gene, and proteasome-dependent degradation of c-Jun leads to upregulation of Parkin in insulin-deprived HCN cells.
Parkin Knockout Prevents ADCD in HCN Cells Following Insulin Withdrawal
To investigate the role of Parkin in ADCD of insulin-deprived HCN cells, we over-expressed Parkin, however, there was no significant change in ADCD rate (data not shown). We speculated that Parkin level was already high in insulin-deprived HCN cells and therefor over-expression of Parkin did not induce additional effects. Therefore, we ablated the Park2 gene in HCN cells by using the CRISPR/Cas9 gene-editing technique and designated the knockout (KO) cells as sgParkin and control cells as sgCon.
Parkin KO attenuated an increase in LC3-II levels following insulin withdrawal (Figures 6A,B). Autophagy flux was also decreased in sgParkin cells, as revealed by a decrease in accumulation of LC3-II induced by Baf.A1 (Figures 6C,D). Also, ablation of the Park2 gene reduced cell death in I(-) HCN cells (Figure 6E). However, Parkin KO did not prevent, but rather promoted apoptosis, since the two prototypical apoptotic inducers STS and etoposide (ETO) increased cell death rate to a greater extent and led to a more robust activation of caspase 3 and PARP in sgParkin than in sgCon cells (Figures 6F–H). These results suggest that Parkin has opposite pro-death or anti-death roles depending on HCN cell death mode. Parkin is essential for insulin withdrawal-triggered mitophagy and plays a pro-death role in ADCD. However, Parkin has anti-apoptotic activity against well-known apoptotic inducers and its deletion renders HCN cells more susceptible to apoptosis.
In the Parkin-dependent mitophagy model, PINK1 is essential for the action of Parkin (Narendra et al., 2010; Youle and Narendra, 2011). PINK1 constitutively shuttles between the cytosol and mitochondria in normal cells but accumulates on the outer membrane of depolarized mitochondria (Narendra et al., 2010). Therefore, we examined whether PINK1 is recruited to mitochondria in I(-) HCN cells. Fluorescence imaging analyses showed an increased accumulation of PINK1 on the mitochondria in I(-) HCN cells (Figures 7A–C). To further examine the involvement of PINK1 in mitophagy, we used an anti-p-Ub-S65 antibody. PINK1 is a ubiquitin kinase. Once stabilized on the outer membrane the depolarized mitochondria, PINK1 phosphorylates ubiquitin at S65, which further stimulates the E3 ligase activity of Parkin (Kane et al., 2014). As expected, in accordance with PINK1 accumulation, the signal intensity p-Ub-S65 was substantially increased in I(-) HCN cells (Figures 7D,E). In this experiment, the potent depolarizing agent CCCP was used as a positive control to chemically induce mitophagy (Figures 7A–D). In addition, ADCD was reduced by PINK1 KO (Figure 7F). In conclusion, PINK1 acts upstream of Parkin in insulin-deprived HCN cells, and HCN cells undergo ADCD through PINK1/Parkin-dependent mitophagy.
Parkin KO Rescues Mitochondrial Alterations and Prevents Initiation of Mitophagy in Insulin-Deprived HCN Cells
Next, we examined whether Parkin deletion affects events upstream of mitophagy. Interestingly, mitochondrial Ca2+ level was reduced in sgParkin cells (Figures 8A,B). Unexpectedly, we found that the ratio of depolarized mitochondria was lower in sgParkin than sgCon cells following insulin withdrawal (Figure 8C). These results suggest that Parkin is required for efficient ER-to-mitochondria Ca2+ transfer and ensuing depolarization. In accordance with decreases in the mitochondrial Ca2+ accumulation and depolarization, subsequent mitophagy-related events, such as mitochondrial translocation of LC3 (Figures 8D,E,H) and DFCP1 (Figures 8F,G,I), were all attenuated in I(-) sgParkin cells, suggesting that Parkin KO interfered with the initial steps of mitophagy. Our results suggest that Parkin deletion not only impairs the recognition of the depolarized mitochondria and their removal, but also blocks early changes in mitochondrial physiology and prevents initiation of mitophagy. Therefore, mechanistically, Parkin is intimately involved in mitophagy from its very early steps, including ER-to-mitochondria Ca2+ transfer and recruitment of the autophagy-initiating/elongating molecules to mitochondria.
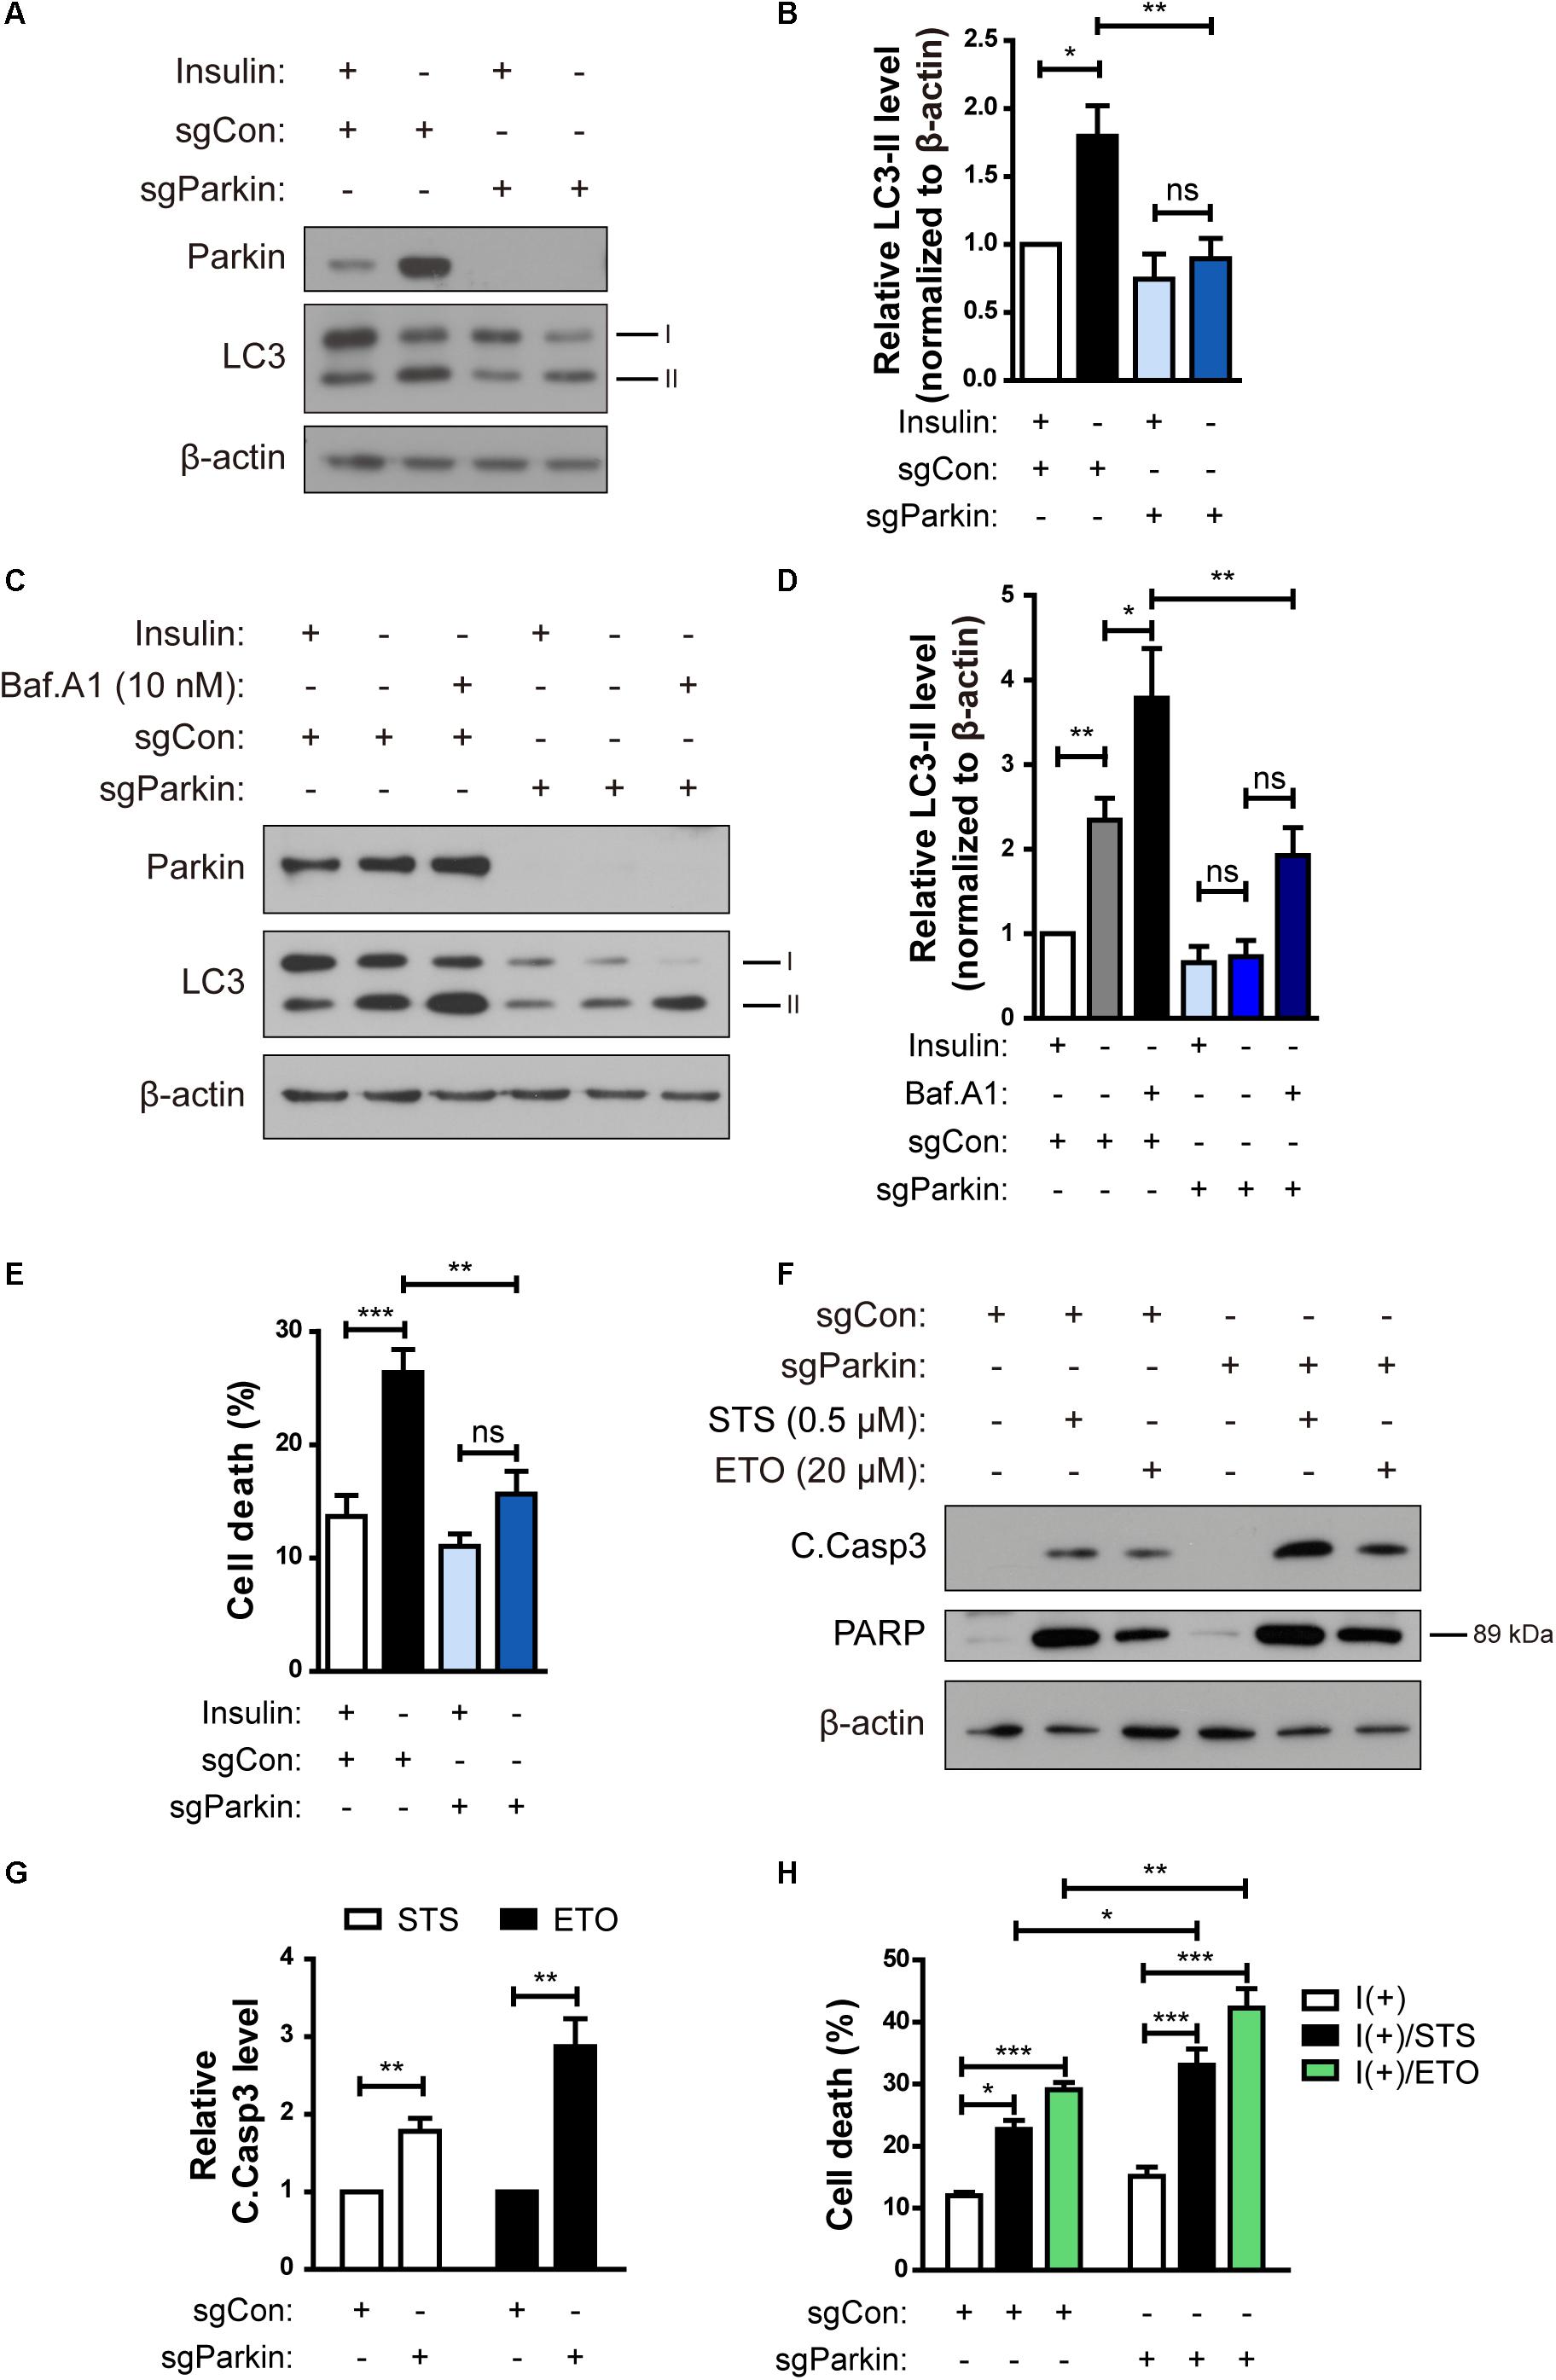
Figure 6. Parkin knockout (KO) prevents ADCD in HCN cells following insulin withdrawal. (A) A decrease in autophagy level in sgParkin cells after insulin withdrawal for 24 h. (B) Quantification of LC3-II levels (n = 6). (C) Autophagic flux in sgParkin cells after insulin withdrawal. Cells were treated with Baf.A1 (10 nM) before harvesting. The blots shown are representative of four experiments with similar results. (D) Quantification of LC3-II levels (n = 4) from (C). (E) Cell death rates in sgCon and sgParkin cells after insulin withdrawal for 24 h (n = 11). (F) Western blotting analysis of C.Casp3, PARP after STS (0.5 μM) or etoposide (ETO) (20 μM) treatment for 8 h. (G) Quantification of C.Casp3 level after normalization to β-actin (n = 5–7). (H) Cell death rates of sgCon and sgParkin cells after STS or ETO treatment for 8 h (n = 3). ∗p < 0.05, ∗∗p < 0.01, ∗∗∗p < 0.001.
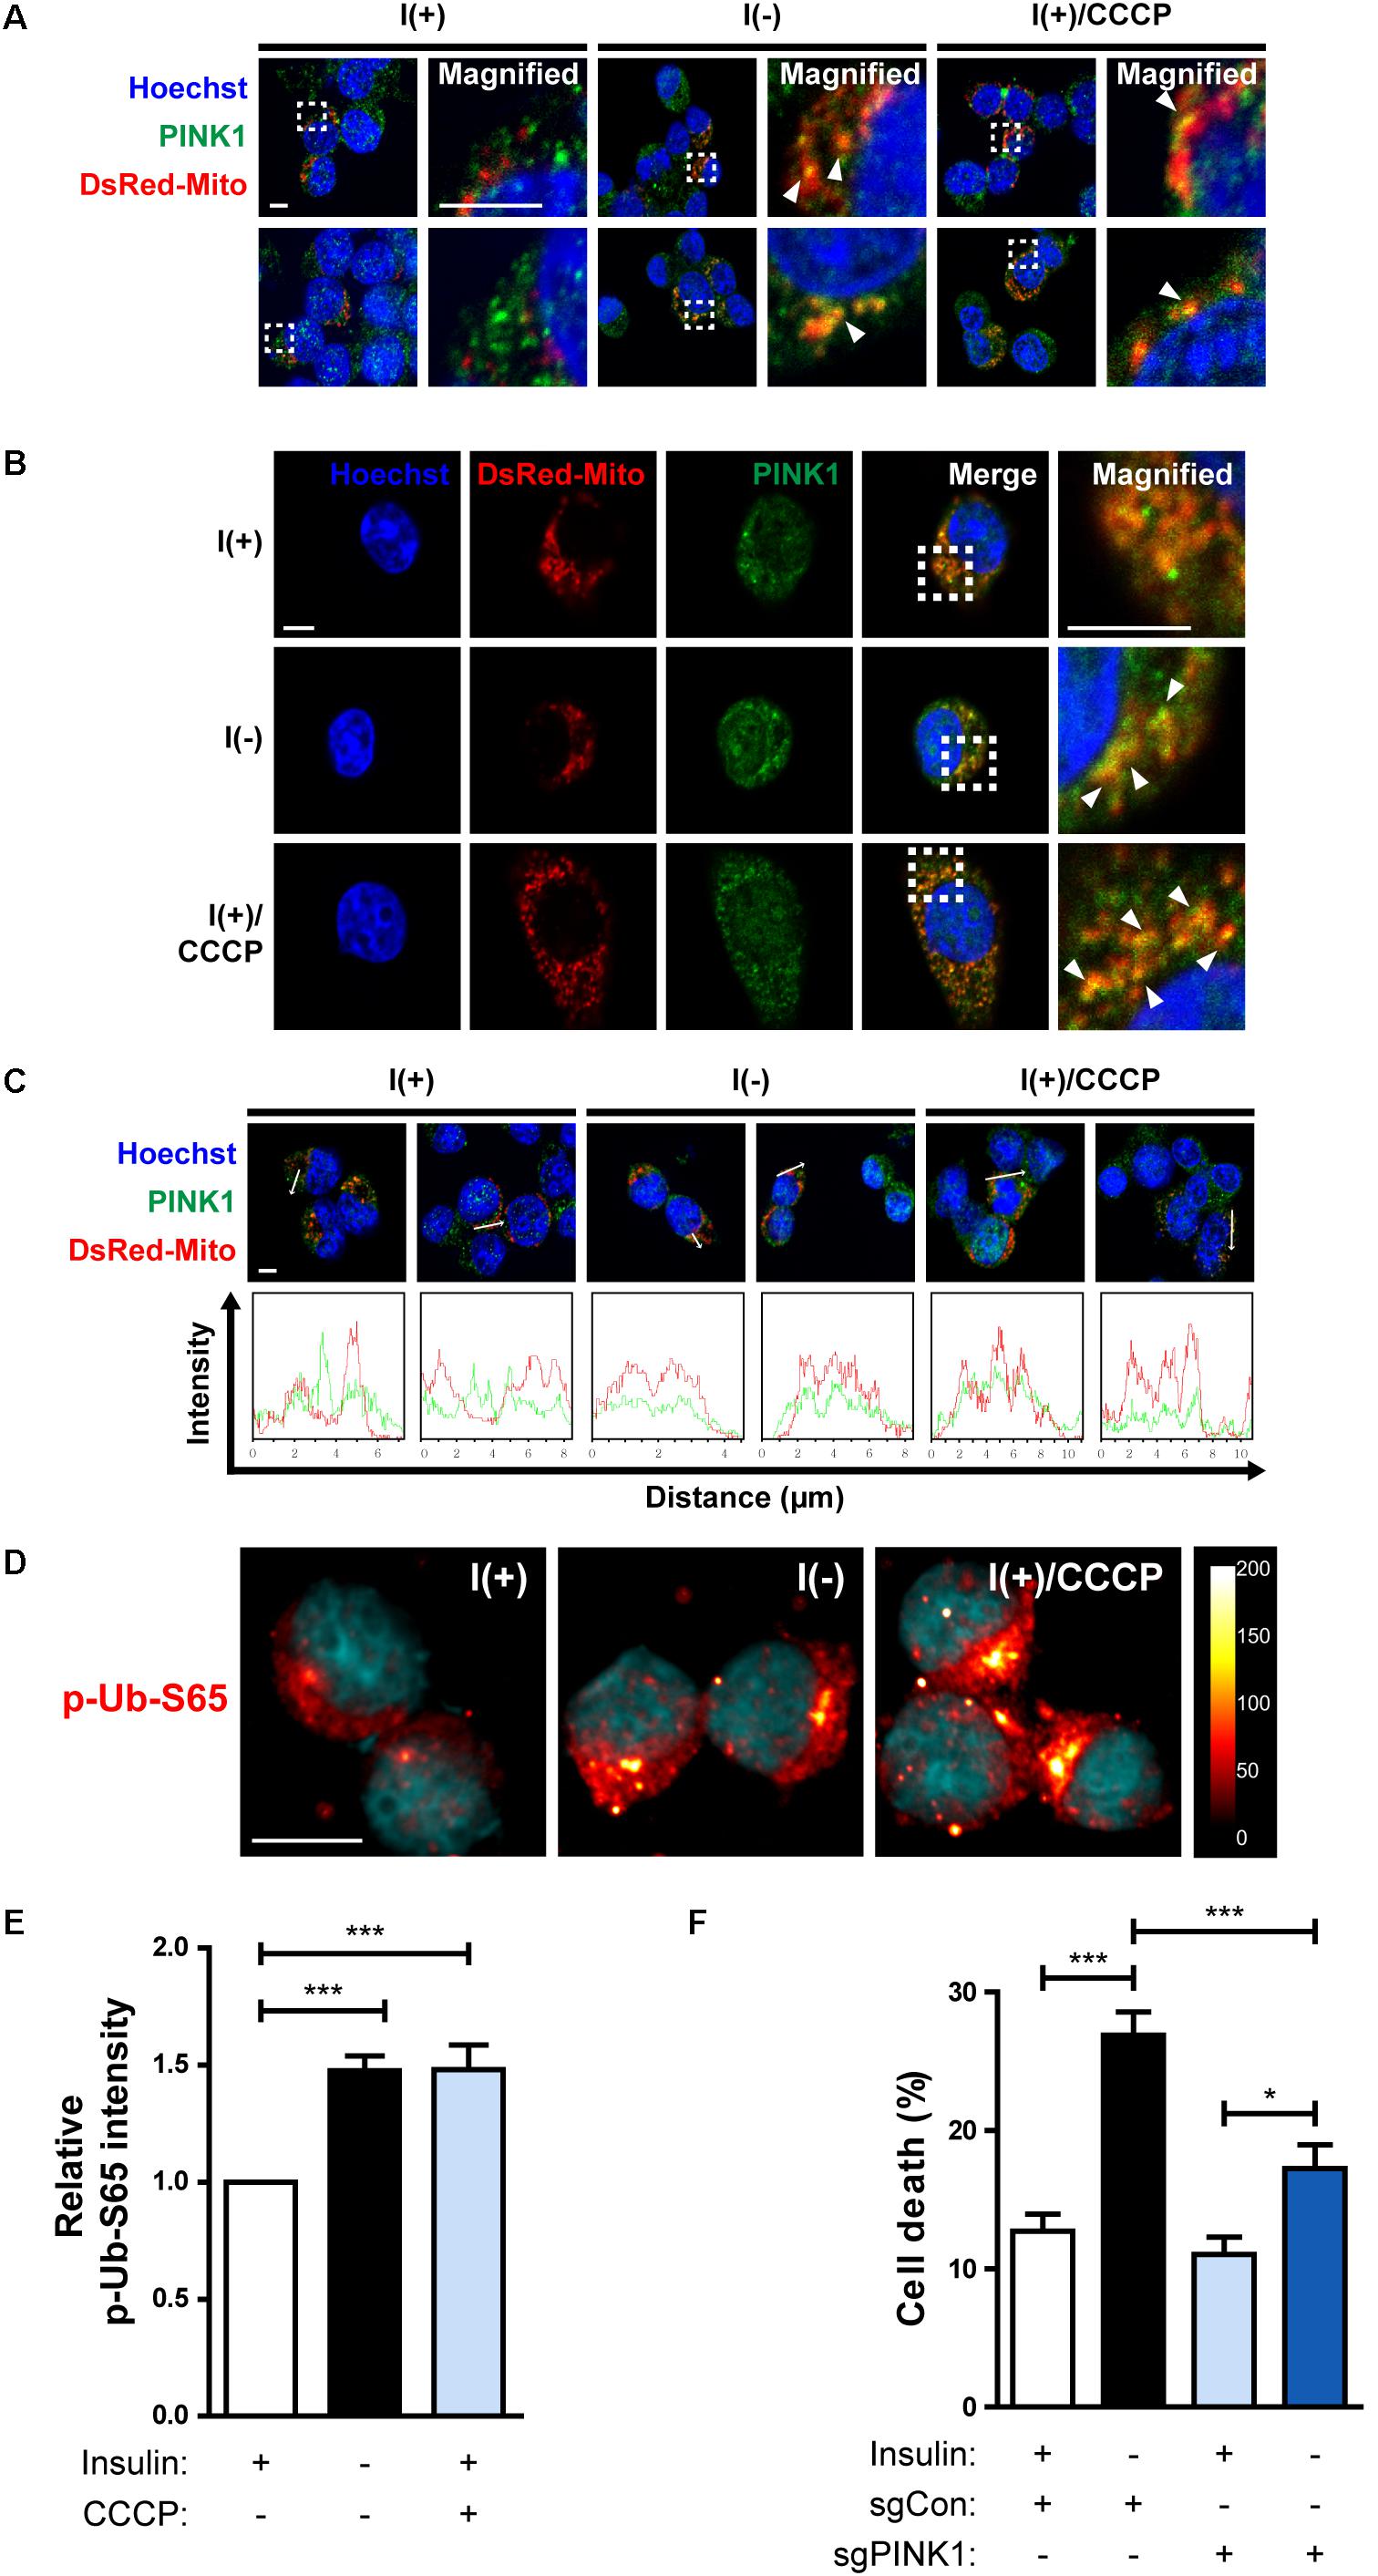
Figure 7. HCN cells undergo PINK1/Parkin-dependent mitophagy following insulin withdrawal. (A,B) An increase in colocalization of PINK1 and mitochondria after insulin withdrawal for 24 h. Arrowheads indicate DsRed-Mito and PINK1 colocalization. Scale bars, 5 μm. (C) Intensity profile graphs of PINK1 and DsRed-Mito. Scale bar, 5 μm. (D) An increase in the level of p-Ub-S65 after insulin withdrawal for 24 h. Cells were treated with CCCP (10 μM) for 0.5 h as a positive control of mitophagy. Blue staining indicates Hoechst, and red staining indicates p-Ub-S65. Intensity is indicated in arbitrary units. Scale bar, 10 μm. (E) The mean intensity of p-Ub-S65 was quantified using ImageJ software (n = 33 cells for I(+), 38 cells for I(−), 46 cells for I(+)/CCCP from 3 independent experiments). (F) Cell death rates of sgCon and sgPINK1 cells (n = 4). ∗p < 0.05, ∗∗∗p < 0.001.
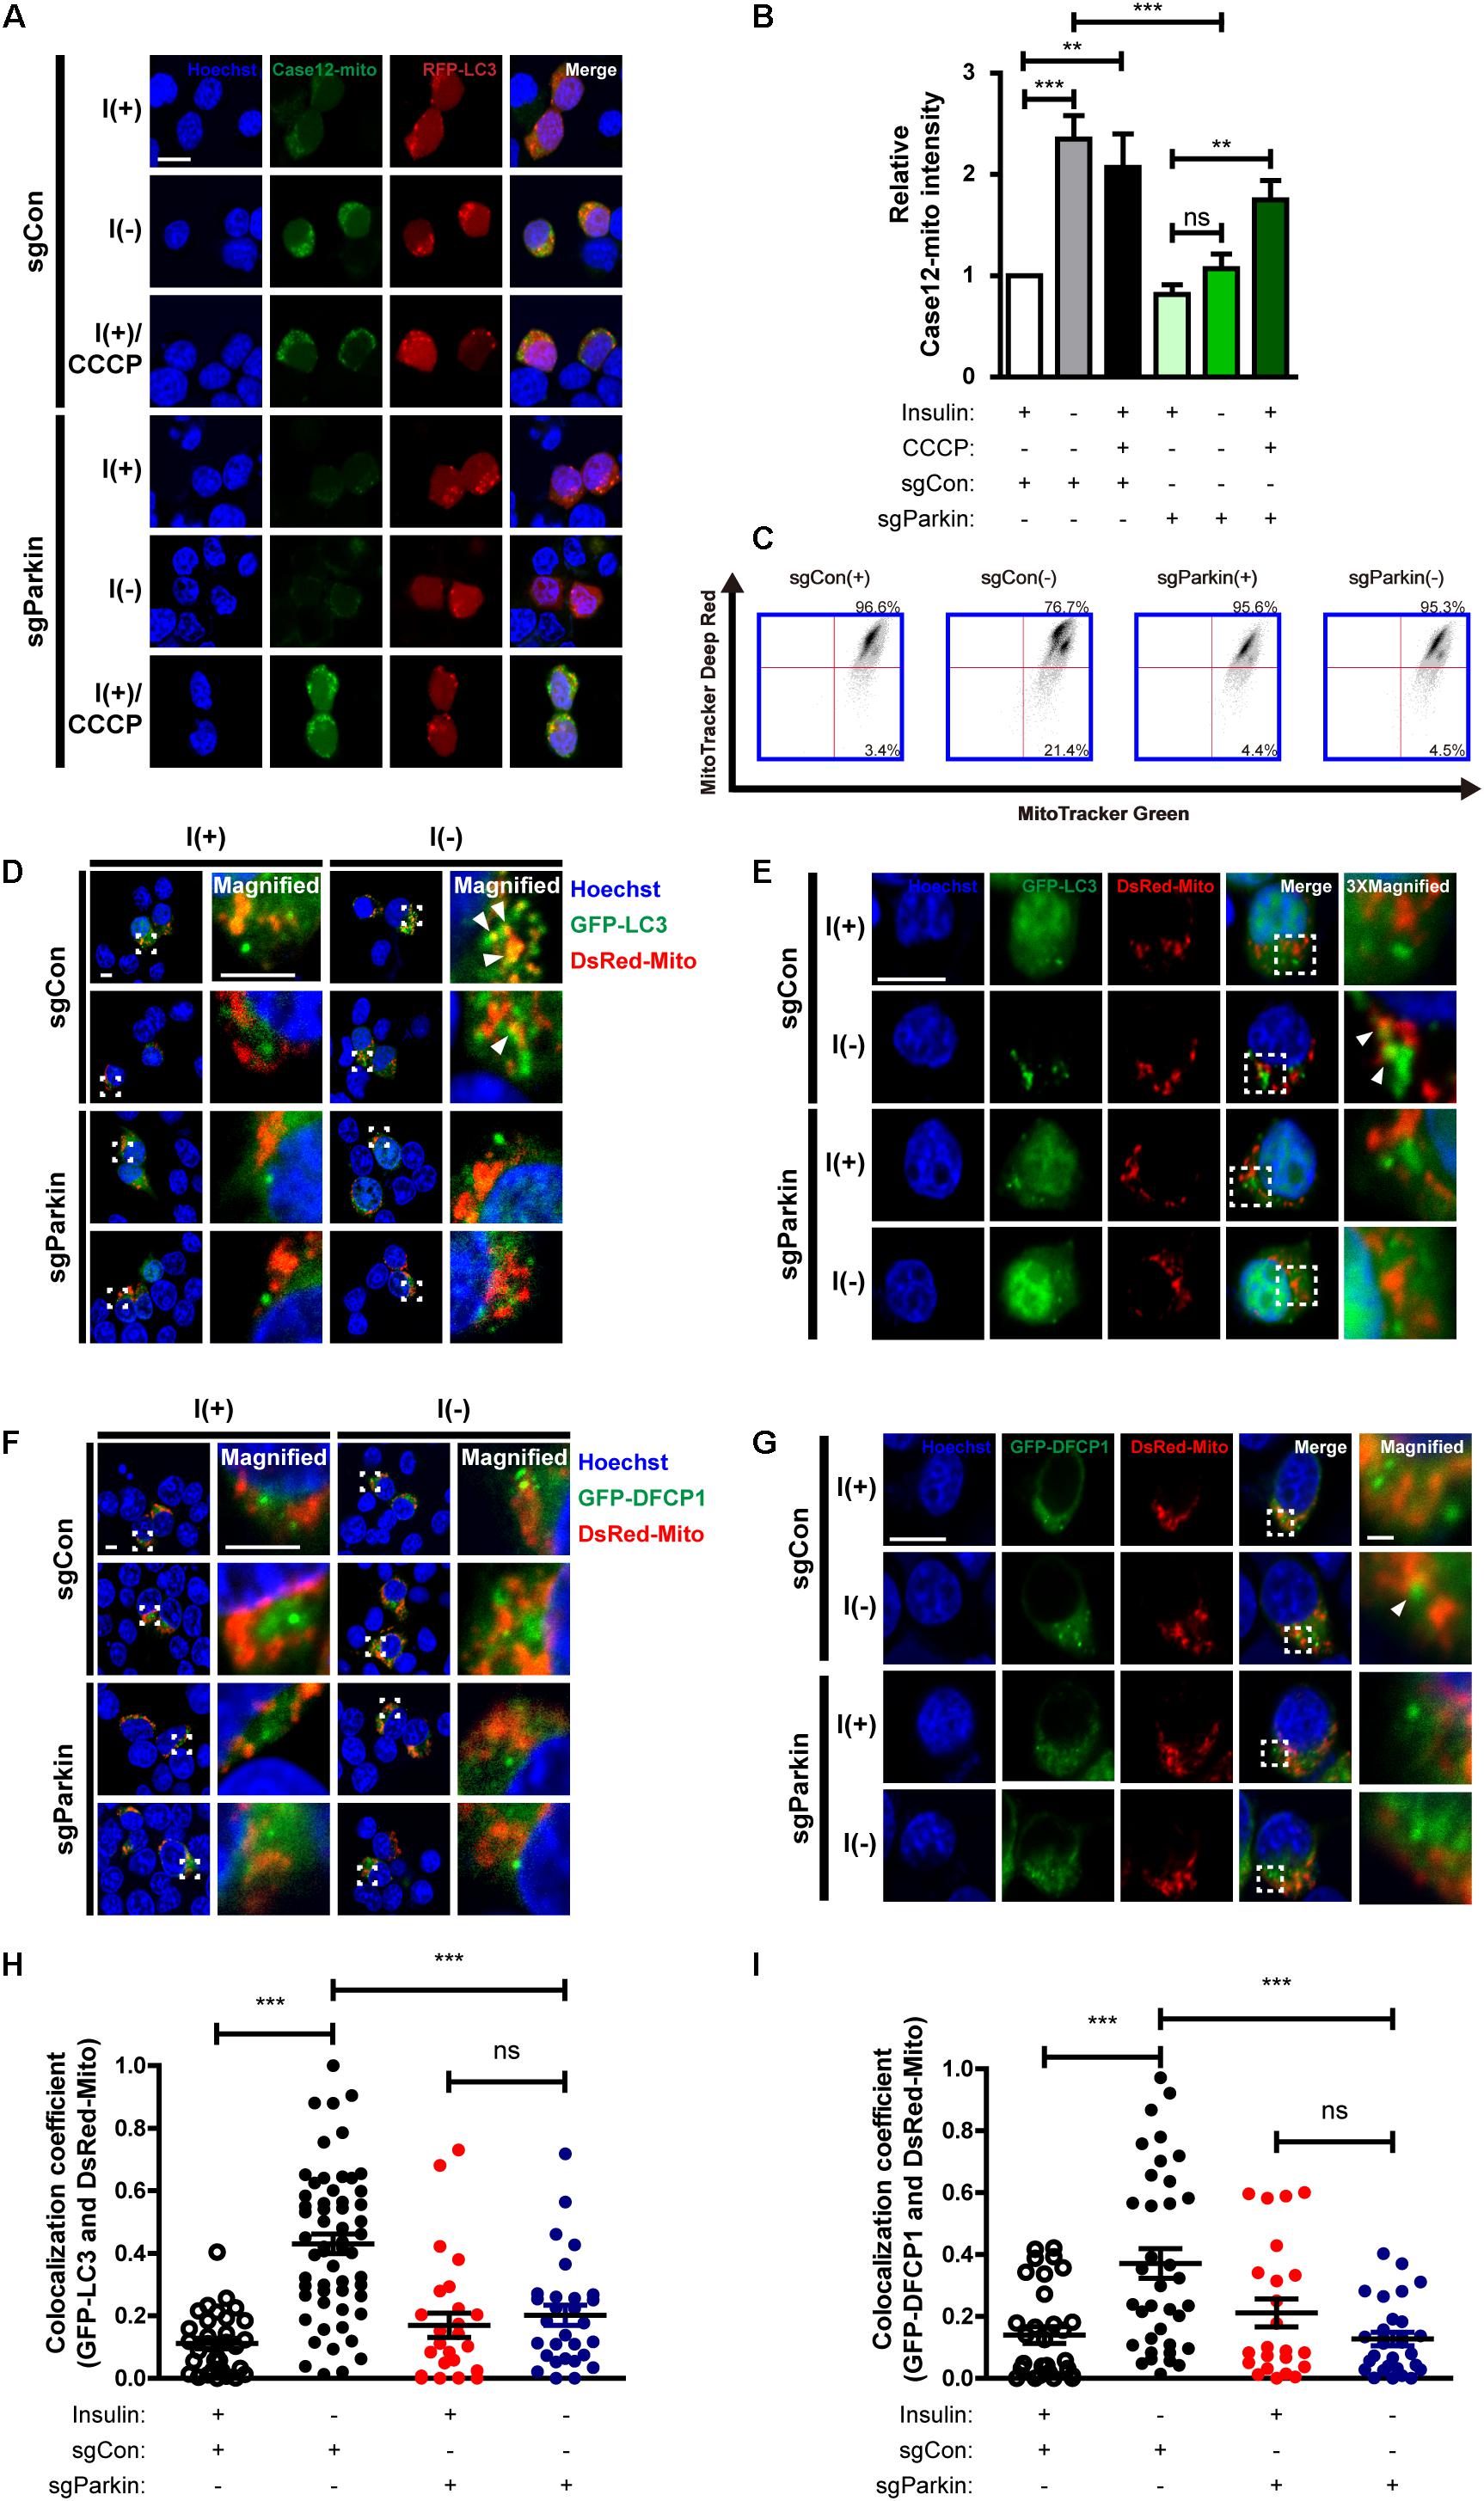
Figure 8. Parkin KO prevents initiation of mitophagy following insulin withdrawal. (A) Fluorescence images of Case12-mito in sgParkin cells after insulin withdrawal for 24 h. Scale bar, 5 μm. (B) Quantification of fluorescence intensity of Case12-mito (n = 39 cells for sgCon(+), 28 cells for sgCon(-), 36 cells for sgCon(+)/CCCP, 80 cells for sgParkin(+), 73 cells for sgParkin(-), 37 cells for sgParkin(+)/CCCP from 3 independent experiments). (C) Double staining with MitoTracker Green and MitoTracker Deep Red to measure the ratio of depolarized mitochondria relative to total mitochondria after insulin withdrawal for 24 h. (D,E) Colocalization of LC3 and mitochondria in sgParkin cells after co-transfection with GFP-LC3 and DsRed-Mito. Colocalization was analyzed after insulin withdrawal for 24 h. Arrowheads indicate colocalization of GFP-LC3 and DsRed-Mito. Scale bars, 5 μm for (D), 10 μm for (E). (F,G) Colocalization of DFCP1 and mitochondria (arrowheads) in sgParkin cells after insulin withdrawal for 24 h. Scale bars, 5 μm for (F), 10 μm for (G). (H) Quantification of colocalization of LC3 and mitochondria (n = 26–52 cells from 3 independent experiments). (I) Quantitative analysis of colocalization of DFCP1 and mitochondria (n = 23–36 cells from 3 independent experiments). ∗∗p < 0.01, ∗∗∗p < 0.001; ns, not significant.
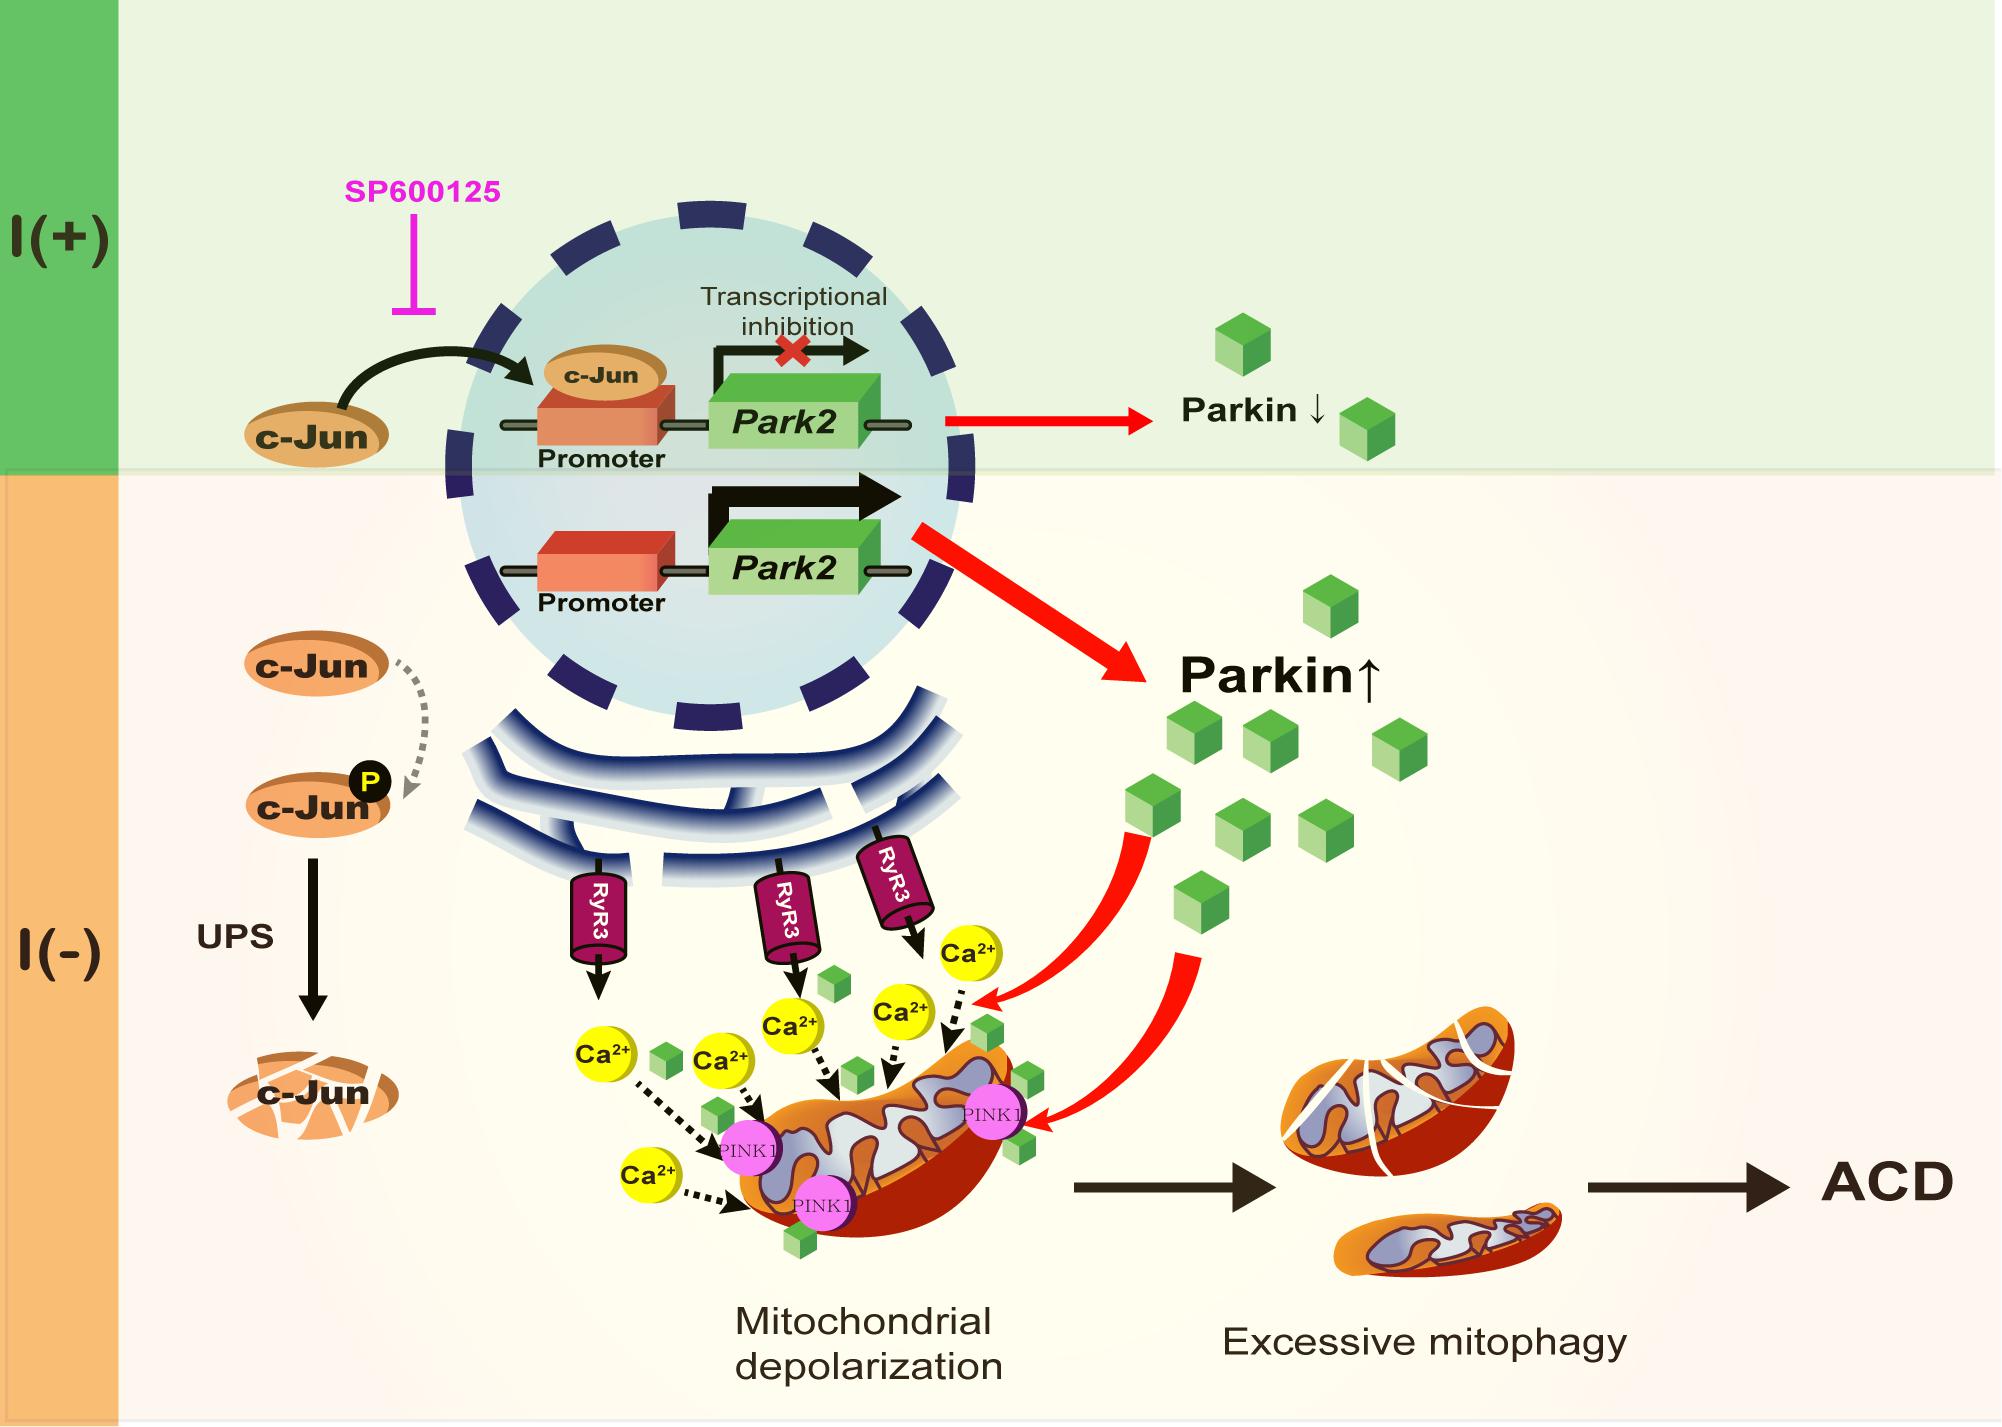
Figure 9. A schematic diagram of Parkin-dependent mitophagy and ADCD. Parkin expression is increased by the degradation of c-Jun, a transcriptional repressor of Parkin in insulin-deprived HCN cells. Insulin withdrawal induced mitochondrial depolarization and recruitment of Parkin and PINK1 to mitochondria, where Parkin is also required for ER-to-mitochondria Ca2+ transfer. PINK1/Parkin-dependent mitophagy occurs in HCN cells following insulin withdrawal causing excessive mitophagy and ADCD.
Discussion
Parkin can suppress or promote apoptosis depending on cell type and stressor. Our results are more in line with the anti-apoptotic role of Parkin in HCN cells challenged with well-known apoptotic stimuli. In contrast to this pro-survival role, we also found that Parkin promotes ADCD following the removal of insulin, the key survival neurotrophic factor for HCN cells. Currently, it is not known how these opposite roles of Parkin in the control of distinct modes of cell death are regulated. Overall, deregulated Parkin activity and mishandling of depolarized mitochondria will be detrimental to the cells and lead to neurodegeneration through various pathways depending on cell type and degeneration cue.
Although, PD is mainly a movement disorder with motor symptoms, non-motor symptoms such as sleep abnormalities, autonomic failure, and a range of neuropsychiatric symptoms including depression, anxiety, cognitive impairment, dementia, and impulse control disorders are increasingly being recognized as features of PD pathology (Meissner et al., 2011). So far, most therapeutic efforts have been focused on motor control, and alleviation of non-motor symptoms has received less attention. Therefore, there is an unmet need to alleviate non-motor symptoms for better therapeutic design and management of PD. However, currently there is no good animal or cellular model to help address the neuropsychiatric symptoms of PD. In that regard, our present study on Parkin-mediated mitophagy in HCN cells could contribute to understanding the various roles of Parkin in brain areas other than substantia nigra.
What is the interconnection between mitophagy and conventional autophagy? Although, it may not be easy to distinguish the effects of mitophagy from those of conventional bulk autophagy in the same cell, it is interesting that ablation of Parkin attenuates not only mitophagy, but also conventional autophagy. Parkin may play additional roles in facilitation of conventional autophagy in insulin-deprived HCN cells. Another possibility is that elimination of mitochondria has a greater effect on autophagy than elimination of other intracellular constituents in HCN cells. Since interference with mitophagy by using Mdivi-1 reduced autophagy level in HCN cells, the latter possibility seems plausible. During bulk autophagy, as in nutrient starvation conditions, autophagy can be selective for certain intracellular organelles, such as ribosomes and peroxisomes (Hara-Kuge and Fujiki, 2008; Cebollero et al., 2012). In certain cell types, including HCN cells, mitochondria could be the main cargo for autophagic degradation.
In this study, we also identified a new mode of action of Parkin in regulation of mitophagy. Our data suggest that ER-to-mitochondria Ca2+ mobilization triggers Parkin/PINK1-dependent mitophagy and at the same time Parkin is required for this Ca2+ mobilization. In line with this idea, a previous study reported that Parkin upregulation increases ER? mitochondria contact to regulate Ca2+ transfer (Calì et al., 2013). Upon insulin withdrawal, Parkin mediates Ca2+ accumulation in mitochondria and thereby instigates mitochondrial depolarization at the early stage of mitophagy. This may allow recruitment of PINK1 and Parkin and progress of mitophagy. Then, recruited Parkin recognizes and removes dysfunctional mitochondria. According to our model, Parkin is intimately involved from the beginning of mitophagy, and liaises with PINK1 in a mutually cooperative way for the progress of mitophagy. Parkin’s role is more than recognition and removal of depolarized mitochondria; it is an initiator and actuator of mitophagy in the context of ADCD. A schematic diagram shown in Figure 9 summarizes the regulation of Parkin expression and its roles during ADCD.
It is also puzzling how Parkin-mediated selective elimination of dysfunctional mitochondria leads to cell death in insulin-deprived HCN cells, whereas Parkin-dependent mitophagy promotes and cellular homeostasis according to other studies. Currently, the link between mitophagy and cell death remains under-studied. What mechanisms determine the outcome of Parkin-driven mitophagy, i.e., whether it ensures mitochondrial quality control or facilitates mitophagic cell death? Further studies are warranted to resolve this issue.
Author Contributions
S-WY contributed to conception and design, data analysis and interpretation, manuscript writing, and approved the manuscript. HP contributed to conception and design, collection and assembly of data, data analysis and interpretation, and manuscript writing. KMC and H-KA contributed to data collection and analysis. BC and CM contributed to study design, and data analysis and interpretation. J-EG, JH, and HW collected the data.
Funding
This work was supported by the National Research Foundation of Korea (NRF) (Grants Nos. 2017R1A2B4004289 and 2018M3C7A1056275) and the DGIST Convergence Science Center Program (18-BD-04) of the Ministry of Science and ICT of Korea.
Conflict of Interest Statement
The authors declare that the research was conducted in the absence of any commercial or financial relationships that could be construed as a potential conflict of interest.
References
Åberg, M. A., Åberg, N. D., Hedbäcker, H., Oscarsson, J., and Eriksson, P. S. (2000). Peripheral infusion of IGF-I selectively induces neurogenesis in the adult rat hippocampus. J. Neurosci. 20, 2896–2903.
Alvarez-Buylla, A., and Lim, D. A. (2004). For the long run: maintaining germinal niches in the adult brain. Neuron 41, 683–686.
Axe, E. L., Walker, S. A., Manifava, M., Chandra, P., Roderick, H. L., Habermann, A., et al. (2008). Autophagosome formation from membrane compartments enriched in phosphatidylinositol 3-phosphate and dynamically connected to the endoplasmic reticulum. J. Cell Biol. 182, 685–701. doi: 10.1083/jcb.200803137
Baek, S.-H., Kim, E.-K., Goudreau, J. L., Lookingland, K. J., Kim, S. W., and Yu, S.-W. (2009). Insulin withdrawal-induced cell death in adult hippocampal neural stem cells as a model of autophagic cell death. Autophagy 5,277–279.
Baumgartner, H. K., Gerasimenko, J. V., Thorne, C., Ferdek, P., Pozzan, T., Tepikin, A. V., et al. (2009). Calcium elevation in mitochondria is the main Ca2+ requirement for mitochondrial permeability transition pore (mPTP) opening. J. Biol. Chem. 284, 20796–20803. doi: 10.1074/jbc.M109.025353
Bouman, L., Schlierf, A., Lutz, A., Shan, J., Deinlein, A., Kast, J., et al. (2011). Parkin is transcriptionally regulated by ATF4: evidence for an interconnection between mitochondrial stress and ER stress. Cell Death Diff. 18, 769–782. doi: 10.1038/cdd.2010.142
Burman, C., and Ktistakis, N. T. (2010). Regulation of autophagy by phosphatidylinositol 3-phosphate. FEBS lett. 584, 1302–1312. doi: 10.1016/j.febslet.2010.01.011
Calì, T., Ottolini, D., Negro, A., and Brini, M. (2013). Enhanced parkin levels favor ER-mitochondria crosstalk and guarantee Ca 2+ transfer to sustain cell bioenergetics. Mole. Basis Dis. 1832, 495–508.
Cebollero, E., Reggiori, F., and Kraft, C. (2012). Reticulophagy and ribophagy: regulated degradation of protein production factories. Int. J. Cell Biol. 2012:182834. doi: 10.1155/2012/182834
Chung, K. M., Jeong, E.-J., Park, H., An, H.-K., and Yu, S.-W. (2016). Mediation of autophagic cell death by type 3 ryanodine receptor (RyR3) in adult hippocampal neural stem cells. Front. Cell. Neurosc. 10:116.
Chung, K. M., Park, H., Jung, S., Ha, S., Yoo, S. J., Woo, H., et al. (2015). Calpain determines the propensity of adult hippocampal neural stem cells to autophagic cell death following insulin withdrawal. Stem Cells 33, 3052–3064. doi: 10.1002/stem.2082
Coucouvanis, E., and Martin, G. R. (1995). Signals for death and survival: a two-step mechanism for cavitation in the vertebrate embryo. Cell 83, 279–287.
Dauer, W., and Przedborski, S. (2003). Parkinson’s disease: mechanisms and models. Neuron 39, 889–909.
Dawson, T. M., and Dawson, V. L. (2010). The role of parkin in familial and sporadic parkinson’s disease. Mov. disord. 25(Suppl. 1), S32–S39. doi: 10.1002/mds.22798
Dimauro, I., Pearson, T., Caporossi, D., and Jackson, M. J. (2012). A simple protocol for the subcellular fractionation of skeletal muscle cells and tissue. BMC Res. Notes 5:513. doi: 10.1186/1756-0500-5-513
Ellis, R. E., Yuan, J., and Horvitz, H. R. (1991). Mechanisms and functions of cell death. Ann. Rev. Cell Biol. 7, 663–698.
Farré, D., Roset, R., Huerta, M., Adsuara, J. E., Roselló, L., Albà, M. M., et al. (2003). Identification of patterns in biological sequences at the ALGGEN server: PROMO and MALGEN. Nucleic Acids Res. 31, 3651–3653.
Galluzzi, L., and Kroemer, G. (2008). Necroptosis: a specialized pathway of programmed necrosis. Cell 135, 1161–1163. doi: 10.1016/j.cell.2008.12.004
Galluzzi, L., Maiuri, M., Vitale, I., Zischka, H., Castedo, M., Zitvogel, L., et al. (2007). Cell death modalities: classification and pathophysiological implications. Cell Death Diff. 14, 1237–1243.
Galluzzi, L., Vitale, I., Aaronson, S. A., Abrams, J. M., Adam, D., Agostinis, P., et al. (2018). Molecular mechanisms of cell death: recommendations of the nomenclature committee on cell death 2018. Cell Death Diff. 25, 486–541. doi: 10.1038/s41418-017-0012-4
Gould, E., McEwen, B. S., Tanapat, P., Galea, L. A., and Fuchs, E. (1997). Neurogenesis in the dentate gyrus of the adult tree shrew is regulated by psychosocial stress and NMDA receptor activation. J. Neurosci. 17, 2492–2498.
Ha, S., Jeong, S.-H., Yi, K., Chung, K. M., Hong, C. J., Kim, S. W., et al. (2017). Phosphorylation of p62 by AMP-activated protein kinase mediates autophagic cell death in adult hippocampal neural stem cells. J. Biol. Chem. 292,13795–13808. doi: 10.1074/jbc.M117.780874
Ha, S., Ryu, H. Y., Chung, K. M., Baek, S.-H., Kim, E.-K., and Yu, S.-W. (2015). Regulation of autophagic cell death by glycogen synthase kinase-3β in adult hippocampal neural stem cells following insulin withdrawal. Mole. Brain 8:30. doi: 10.1186/s13041-015-0119-9
Hara-Kuge, S., and Fujiki, Y. (2008). The peroxin Pex14p is involved in LC3-dependent degradation of mammalian peroxisomes. Exp. Cell Res. 314,3531–3541. doi: 10.1016/j.yexcr.2008.09.015
Høyer-Hansen, M., Bastholm, L., Szyniarowski, P., Campanella, M., Szabadkai, G., Farkas, T., et al. (2007). Control of macroautophagy by calcium, calmodulin-dependent kinase kinase-β, and Bcl-2. Mol. Cell 25, 193–205.
Ichimura, Y., Kirisako, T., Takao, T., Satomi, Y., Shimonishi, Y., Ishihara, N., et al. (2000). A ubiquitin-like system mediates protein lipidation. Nature 408:488.
Ichimura, Y., Kominami, E., Tanaka, K., and Komatsu, M. (2008). Selective turnover of p62/A170/SQSTM1 by autophagy. Autophagy 4, 1063–1066.
Itakura, E., and Mizushima, N. (2010). Characterization of autophagosome formation site by a hierarchical analysis of mammalian Atg proteins. Autophagy 6, 764–776.
Kabeya, Y., Mizushima, N., Ueno, T., Yamamoto, A., Kirisako, T., Noda, T., et al. (2000). LC3, a mammalian homologue of yeast Apg8p, is localized in autophagosome membranes after processing. EMBO J. 19, 5720–5728.
Kane, L. A., Lazarou, M., Fogel, A. I., Li, Y., Yamano, K., Sarraf, S. A., et al. (2014). PINK1 phosphorylates ubiquitin to activate Parkin E3 ubiquitin ligase activity. J. Cell Biol. 205:143. doi: 10.1083/jcb.201402104
Kimura, S., Noda, T., and Yoshimori, T. (2007). Dissection of the autophagosome maturation process by a novel reporter protein, tandem fluorescent-tagged LC3. Autophagy 3, 452–460.
Klionsky, D. J., Abdelmohsen, K., Abe, A., Abedin, M. J., Abeliovich, H., Acevedo Arozena, A., et al. (2016). Guidelines for the use and interpretation of assays for monitoring autophagy. Autophagy 12, 1–222.
Klionsky, D. J., Baehrecke, E. H., Brumell, J. H., Chu, C. T., Codogno, P., Cuervo, A. M., et al. (2011). A comprehensive glossary of autophagy-related molecules and processes. Autophagy 7, 1273–1294. doi: 10.4161/auto.7.11.17661
Lazarou, M., Sliter, D. A., Kane, L. A., Sarraf, S. A., Wang, C., Burman, J. L., et al. (2015). The ubiquitin kinase PINK1 recruits autophagy receptors to induce mitophagy. Nature 524:309. doi: 10.1038/nature14893
Lemasters, J. J. (2005). Selective mitochondrial autophagy, or mitophagy, as a targeted defense against oxidative stress, mitochondrial dysfunction, and aging. Rejuvenat. Res. 8, 3–5.
Lichtenwalner, R., Forbes, M., Bennett, S., Lynch, C., Sonntag, W., and Riddle, D. (2001). Intracerebroventricular infusion of insulin-like growth factor-I ameliorates the age-related decline in hippocampal neurogenesis. Neuroscience 107, 603–613.
Meissner, W. G., Frasier, M., Gasser, T., Goetz, C. G., Lozano, A., Piccini, P., et al. (2011). Priorities in parkinson’s disease research. Nat. Rev. Drug Disc. 10:377. doi: 10.1038/nrd3430
Messeguer, X., Escudero, R., Farré, D., Nuñez, O., Martınez, J., and Albà, M. M. (2002). PROMO: detection of known transcription regulatory elements using species-tailored searches. Bioinformatics 18, 333–334.
Minden, A., Lin, A., Smeal, T., Derijard, B., Cobb, M., Davis, R., et al. (1994). c-Jun N-terminal phosphorylation correlates with activation of the JNK subgroup but not the ERK subgroup of mitogen-activated protein kinases. Mol. Cell. Biol. 14, 6683–6688.
Mizushima, N., and Komatsu, M. (2011). Autophagy: renovation of cells and tissues. Cell 147, 728–741. doi: 10.1016/j.cell.2011.10.026
Moriwaki, K., Bertin, J., Gough, P., Orlowski, G., and Chan, F. K. (2016). Differential roles of RIPK1 and RIPK3 in TNF-induced necroptosis and chemotherapeutic agent-induced cell death. Cell Death Dis. 6:e1636. doi: 10.1038/cddis.2015.16
Narendra, D., Tanaka, A., Suen, D.-F., and Youle, R. J. (2008). Parkin is recruited selectively to impaired mitochondria and promotes their autophagy. J. Cell Biol. 183, 795–803. doi: 10.1083/jcb.200809125
Narendra, D. P., Jin, S. M., Tanaka, A., Suen, D.-F., Gautier, C. A., Shen, J., et al. (2010). PINK1 is selectively stabilized on impaired mitochondria to activate Parkin. PLoS Biol. 8:e1000298. doi: 10.1371/journal.pbio.1000298
Niwa, J.-I., Ishigaki, S., Hishikawa, N., Yamamoto, M., Doyu, M., Murata, S., et al. (2002). Dorfin ubiquitylates mutant SOD1 and prevents mutant SOD1-mediated neurotoxicity. J. Biol. Chem. 277, 36793–36798.
Palmer, T. D., Takahashi, J., and Gage, F. H. (1997). The adult rat hippocampus contains primordial neural stem cells. Mol. Cell. Neurosci. 8, 389–404.
Pankiv, S., Clausen, T. H., Lamark, T., Brech, A., Bruun, J.-A., Outzen, H., et al. (2007). p62/SQSTM1 binds directly to Atg8/LC3 to facilitate degradation of ubiquitinated protein aggregates by autophagy. J. Biol. Chem. 282, 24131–24145.
Rello, S., Stockert, J., Moreno, V. L., Gamez, A., Pacheco, M., Juarranz, A., et al. (2005). Morphological criteria to distinguish cell death induced by apoptotic and necrotic treatments. Apoptosis 10, 201–208.
Rodríguez, J. J., Jones, V. C., Tabuchi, M., Allan, S. M., Knight, E. M., LaFerla, F. M., et al. (2008). Impaired adult neurogenesis in the dentate gyrus of a triple transgenic mouse model of Alzheimer’s disease. PloS one 3:e2935.
Satoo, K., Noda, N. N., Kumeta, H., Fujioka, Y., Mizushima, N., Ohsumi, Y., et al. (2009). The structure of Atg4B–LC3 complex reveals the mechanism of LC3 processing and delipidation during autophagy. The EMBO J. 28, 1341–1350. doi: 10.1038/emboj.2009.80
Scaduto, R. C. Jr., and Grotyohann, L. W. (1999). Measurement of mitochondrial membrane potential using fluorescent rhodamine derivatives. Biophys. J. 76, 469–477.
Shintani, T., and Klionsky, D. J. (2004). Autophagy in health and disease: a double-edged sword. Science 306, 990–995.
Shors, T. J., Miesegaes, G., Beylin, A., Zhao, M., Rydel, T., and Gould, E. (2001). Neurogenesis in the adult is involved in the formation of trace memories. Nature 410:372.
Sun, N., Yun, J., Liu, J., Malide, D., Liu, C., Rovira, I. I., et al. (2015). Measuring in vivo mitophagy. Mol. Cell 60, 685–696. doi: 10.1016/j.molcel.2015.10.009
Takeuchi, A., Kim, B., and Matsuoka, S. (2013). The mitochondrial Na+-Ca 2+ exchanger, NCLX, regulates automaticity of HL-1 cardiomyocytes. Sci. Rep. 3:2766. doi: 10.1038/srep02766
Tanaka, K., Suzuki, T., Hattori, N., and Mizuno, Y. (2004). Ubiquitin, proteasome and parkin. Mol. Cell Res. 1695, 235–247.
Tsujimoto, Y., and Shimizu, S. (2005). Another way to die: autophagic programmed cell death. Cell Death Diff. 12, 1528–1534.
Yang, Z., and Klionsky, D. J. (2010). Eaten alive: a history of macroautophagy. Nature Cell Biol. 12:814. doi: 10.1038/ncb0910-814
Yogev, O., and Shaulian, E. (2010). Jun proteins inhibit autophagy and induce cell death. Autophagy 6, 566–567. doi: 10.4161/auto.6.4.11950
Youle, R. J., and Narendra, D. P. (2011). Mechanisms of mitophagy. Nature Rev. Mol. Cell Biol. 12:9. doi: 10.1038/nrm3028
Keywords: autophagy-dependent cell death, c-Jun, hippocampal neural stem cells, mitophagy, Parkin
Citation: Park H, Chung KM, An H-K, Gim J-E, Hong J, Woo H, Cho B, Moon C and Yu S-W (2019) Parkin Promotes Mitophagic Cell Death in Adult Hippocampal Neural Stem Cells Following Insulin Withdrawal. Front. Mol. Neurosci. 12:46. doi: 10.3389/fnmol.2019.00046
Received: 18 October 2018; Accepted: 05 February 2019;
Published: 22 February 2019.
Edited by:
Vsevolod V. Gurevich, Vanderbilt University, United StatesReviewed by:
Alicia M. Pickrell, Virginia Tech, United StatesRalf J. Braun, University of Bayreuth, Germany
Matteo Bordi, University of Rome Tor Vergata, Italy
Copyright © 2019 Park, Chung, An, Gim, Hong, Woo, Cho, Moon and Yu. This is an open-access article distributed under the terms of the Creative Commons Attribution License (CC BY). The use, distribution or reproduction in other forums is permitted, provided the original author(s) and the copyright owner(s) are credited and that the original publication in this journal is cited, in accordance with accepted academic practice. No use, distribution or reproduction is permitted which does not comply with these terms.
*Correspondence: Seong-Woon Yu, yusw@dgist.ac.kr