NCS-1 Deficiency Affects mRNA Levels of Genes Involved in Regulation of ATP Synthesis and Mitochondrial Stress in Highly Vulnerable Substantia nigra Dopaminergic Neurons
 Carsten Simons1†
  Julia Benkert1†
  Nora Deuter1 Christina Poetschke1 Olaf Pongs2
  Toni Schneider3
  Johanna Duda1
  Birgit Liss1,4*
- 1Institute of Applied Physiology, University of Ulm, Ulm, Germany
- 2Institute of Physiology, Center for Integrative Physiology and Molecular Medicine, University of the Saarland, Homburg, Germany
- 3Institute of Neurophysiology, University of Cologne, Cologne, Germany
- 4New College, University of Oxford, Oxford, United Kingdom
Neuronal Ca2+ sensor proteins (NCS) transduce changes in Ca2+ homeostasis into altered signaling and neuronal function. NCS-1 activity has emerged as important for neuronal viability and pathophysiology. The progressive degeneration of dopaminergic (DA) neurons, particularly within the Substantia nigra (SN), is the hallmark of Parkinson’s disease (PD), causing its motor symptoms. The activity-related Ca2+ homeostasis of SN DA neurons, mitochondrial dysfunction, and metabolic stress promote neurodegeneration and PD. In contrast, NCS-1 in general has neuroprotective effects. The underlying mechanisms are unclear. We analyzed transcriptional changes in SN DA neurons upon NCS-1 loss by combining UV-laser microdissection and RT-qPCR-approaches to compare expression levels of a panel of PD and/or Ca2+-stress related genes from wildtype and NCS-1 KO mice. In NCS-1 KO, we detected significantly lower mRNA levels of mitochondrially coded ND1, a subunit of the respiratory chain, and of the neuron-specific enolase ENO2, a glycolytic enzyme. We also detected lower levels of the mitochondrial uncoupling proteins UCP4 and UCP5, the PARK7 gene product DJ-1, and the voltage-gated Ca2+ channel Cav2.3 in SN DA neurons from NCS-1 KO. Transcripts of other analyzed uncoupling proteins (UCPs), mitochondrial Ca2+ transporters, PARK genes, and ion channels were not altered. As Cav channels are linked to regulation of gene expression, metabolic stress and degeneration of SN DA neurons in PD, we analyzed Cav2.3 KO mice, to address if the transcriptional changes in NCS-1 KO were also present in Cav.2.3 KO, and thus probably correlated with lower Cav2.3 transcripts. However, in SN DA neurons from Cav2.3 KO mice, ND1 mRNA as well as genomic DNA levels were elevated, while ENO2, UCP4, UCP5, and DJ-1 transcript levels were not altered. In conclusion, our data indicate a possible novel function of NCS-1 in regulating gene transcription or stabilization of mRNAs in SN DA neurons. Although we do not provide functional data, our findings at the transcript level could point to impaired ATP production (lower ND1 and ENO2) and elevated metabolic stress (lower UCP4, UCP5, and DJ-1 levels) in SN DA neurons from NCS-1 KO mice. We speculate that NCS-1 is involved in stimulating ATP synthesis, while at the same time controlling mitochondrial metabolic stress, and in this way could protect SN DA neurons from degeneration.
Introduction
Ca2+ signaling is important for a variety of neuronal functions, like membrane excitability, neurotransmitter release, gene transcription, and many other processes crucial for neuronal functions and viability (Berridge, 1998; Brini et al., 2014). The nature, magnitude, and location of the Ca2+ signal is crucial for its distinct effects (La Rovere et al., 2016). Hence, intracellular Ca2+ levels are tightly controlled (Gleichmann and Mattson, 2011; Heine et al., 2019). Neuronal Ca2+ sensor proteins (NCS) respond to changes in intracellular Ca2+ concentrations with conformational changes that allow them to bind diverse interaction partners, and to activate a variety of different signaling pathways (Burgoyne and Haynes, 2012; Choudhary et al., 2018; Burgoyne et al., 2019). The widely expressed neuronal Ca2+ sensor NCS-1 (Pongs et al., 1993) modulates e.g., voltage-gated Ca2+ channels (Cav) (Tsujimoto et al., 2002; Weiss et al., 2010), A-type K+ channels (Nakamura et al., 2001; Guo et al., 2002), that are composed of Kv4 α- and KChip3 β-subunits in SN DA neurons (Liss et al., 2001), G-protein coupled receptor kinases (GRK), and G-protein coupled dopamine D2-receptors (Kabbani et al., 2002; Pandalaneni et al., 2015), to just name a few. Changes in NCS-1 expression will alter the relation with its target proteins and were described in a variety of diseases, including schizophrenia and Parkinson’s disease, both characterized by dysfunctional dopaminergic signaling (Koh et al., 2003; Kabbani et al., 2012; Dragicevic et al., 2014; Boeckel and Ehrlich, 2018; Bandura and Feng, 2019; Catoni et al., 2019).
Parkinson’s disease (PD) is the second most common neurodegenerative disease (Schulz et al., 2016; Obeso et al., 2017). Its motor-related symptoms are caused by a progressive loss of dopaminergic (DA) neurons, particularly within the Substantia nigra (SN) (Damier et al., 1999; Surmeier et al., 2017b; Giguere et al., 2018). While the cause for most PD cases is still unclear, ion channel activity, activity-related Ca2+ homeostasis, mitochondrial dysfunction, and elevated metabolic stress constitute key interacting events in PD pathology (Duda et al., 2016; Michel et al., 2016; Surmeier et al., 2017b; Cherubini and Wade-Martins, 2018). In some familial inherited PD cases, disease-causing mutations in so-called PARK genes have been identified, most of them linked to elevated metabolic stress (van der Brug et al., 2015; Deng et al., 2018; Blauwendraat et al., 2019). SN DA neurons are particularly vulnerable to metabolic stress and other PD-stressors, due to their energetically demanding large axonal arborizations, as well as a stressful Ca2+ entry during action potential firing, mediated by Cav channels. This distinguishes them from the more resistant DA neurons in the ventral tegmental area (VTA) that are rarely affected in PD (Pissadaki and Bolam, 2013; Pacelli et al., 2015; Duda et al., 2016; Surmeier et al., 2017a). These activity-related, voltage-gated Ca2+ dynamics sustain electrical activity, ATP synthesis, and dopamine release of SN DA neurons and thus movement, but they constitute an intrinsic metabolic burden (Guzman et al., 2010, 2018; Duda et al., 2016; Zaichick et al., 2017). Moreover, the Ca2+ buffer capacity of calbindin negative SN DA neurons is low compared to other neurons, e.g., the resistant calbindin positive VTA DA neurons (Foehring et al., 2009; Dopeso-Reyes et al., 2014; Blesa and Vila, 2019). They rely mainly on mitochondrial-ER Ca2+ buffering (Cali et al., 2013; Lee et al., 2018) and on inhibitory regulatory feedback mechanisms that reduce activity related Ca2+ entry and associated neurodegenerative events, like Ca2+ dependent activation of K+ channels (Wolfart et al., 2001; Anderson et al., 2013; Dragicevic et al., 2014; Subramaniam et al., 2014; Iyer et al., 2017). One of these Ca2+ and K+ channel dependent feedback mechanisms operant in SN DA neurons involves NCS-1 function (Dragicevic et al., 2014; Poetschke et al., 2015; Catoni et al., 2019).
NCS-1 has emerged as particularly important in this context of activity-related Ca2+ stress and vulnerability of SN DA neurons in PD (Bandura and Feng, 2019; Catoni et al., 2019). In general, NCS-1 has been shown to stimulate mitochondrial function and neuronal survival promotion (Nakamura et al., 2006, 2019; Angebault et al., 2018; Boeckel and Ehrlich, 2018). Furthermore, especially in SN DA neurons, NCS-1 inhibits their stressful activity in a Ca2+ and Cav dependent fashion, by stimulation of inhibitory, K+ channel coupled dopamine D2-autoreceptors (Kabbani et al., 2002; Dragicevic et al., 2014; Robinson et al., 2017), and NCS-1 mRNA levels are elevated in remaining human SN DA neurons from post-mortem PD brains (Dragicevic et al., 2014).
Here, we aimed to gain insights into effects of general NCS-1 loss on gene expression in SN DA neurons. By combining UV-lasermicrodissection (UV-LMD) with retrograde tracing and quantitative PCR approaches, we examined a panel of candidate genes in SN DA neurons from NCS-1 KO mice and wildtype controls. We quantified mRNA levels of the voltage-gated Ca2+ channel α-subunits Cav1.3, Cav2.3, Cav3.1, the voltage- and Ca2+-gated A-type K+ channel α- and β-subunits Kv4.3 and KChip3, the mitochondrial Ca2+ transporters MCU, LETM1, mNCX, the mitochondrial uncoupling proteins UCP2 – UCP5, and of PARK genes that affect mitochondrial function and/or Ca2+ homeostasis (SNCA, DJ-1, PGC-1α, and GBA1). Furthermore, we analyzed the expression of the glycolytic enzyme neuron-specific enolase 2 (ENO2) and of the NADH-ubiquinone oxidoreductase chain 1 (ND1), a subunit of the complex I of the mitochondrial respiratory chain. We gained evidence for selective transcriptional downregulation of proteins involved in ATP synthesis (ND1, ENO2) and metabolic stress defense (UCP4, UCP5, DJ-1) in SN DA neurons from NCS-1 KO mice, that were associated with but likely not causal to lower Cav2.3 mRNA levels.
We conclude that NCS-1 (directly or indirectly) is involved in stimulating the transcription or the mRNA stability of these genes in SN DA neurons.
Materials and Methods
Ethical Approval
All animal procedures were approved by the German Regierungspräsidium Tübingen (AZ 35/9185.81-3TV No. 1291, Reg. No. o.147) and conducted to the guidelines of the German Tierschutzgesetz.
Mice
All mice were bred in in-house breeding facilities at Ulm University. The NCS-1 KO is back-crossed at least 10 times into C57BL/6J, thus reaching a 99% analogy with C57BL/6J and losing the 129/SvJ original background (Ng et al., 2016). Cav2.3 KO mice were only back-crossed 4 times, leading to a 75% C57BL/6J and 25% 129/SvJ mixed background, as they do not breed well, likely due to the physiological function of Cav2.3 in mouse sperms (Wennemuth et al., 2000). SN DA neurons from NCS-1 and Cav2.3 KO mice were compared to their respective distinct +/+ wildtype background littermates. For NCS-1 KO and their WT, we analyzed juvenile mice (PN13), for Cav2.3 KO and their WT, we show results for adults (∼ PN90), as in contrast to NCS-1, Cav2.3 expression increases with post-natal maturation (Benkert et al., 2019). Data were derived from 18 NCS-1 KO and 18 NCS-1 WT mice, and from 5 Cav2.3 KO and 5 Cav2.3 WT mice. Only male mice were analyzed.
In vivo Retrograde Tracing
SN DA neurons from adult mice were retrogradely labeled as described (Liss et al., 2005; Lammel et al., 2008; Krabbe et al., 2015). Red fluorescent latex retrobeads (Lumafluor) were injected unilaterally into the dorsal striatum (bregma: 0.98 mm, lateral 1.9 and 2.7 mm, ventral: -3.2 mm, 2 × 60 nl) under stereotactic control (Kopf Instruments) with a NanoFil syringe attached to a micropump (UMP3 with SYS-Micro4 Controller; World Precision Instruments) at a rate of 50 nl/min and general isoflurane anesthesia. After 7 days, mice were sacrificed and striatal injection sites were verified using TH-immunofluorescence stain (primary antibody: rabbit anti-TH, 1:1,000, catalog no. 657012, Merck group; secondary antibody: Alexa Fluor 488 goat anti-rabbit IgG, 1:1,000, catalog no. A-11034, Thermo Fisher Scientific) and Nissl stain (Neuro Trace 640/660 deep-red fluorescent Nissl stain solution, 1:1,000 in 1x PBS, catalog no. N21483, Thermo Fisher Scientific), according to the mouse brain atlas (Paxinos and Franklin, 2013) as described (Liss et al., 2005; Krabbe et al., 2015).
Tissue Preparation, UV-Laser Microdissection (UV-LMD), and Reverse Transcription
Carried out similarly as previously described in detail (Grundemann et al., 2011; Dragicevic et al., 2014; Duda et al., 2018). Briefly, 12 μm coronal mouse brain sections were cut with a cryomicrotome CM3050 S (Leica), mounted on PEN-membrane slides (Microdissect), and fixed with an ascending ethanol series. Sections were stored in sterile Falcon tubes with silica gel at -80°C until used for UV-LMD. UV-LMD was carried out with a LMD7000 system (Leica Microsystems); laser-microdissected cells (pools of 10 SN DA neurons, each) were collected into the lid of a certified RNase free reaction tube (PCR Tubes Thinwall Clear 0.5 ml, Axygen) containing 4.7 μl lysis-buffer, and reverse transcription was performed without an RNA-isolation step by using random hexamer primers and superscript II RT enzyme (Thermo Fisher Scientific). For juvenile mice, mounted sections were stained (1 min) with a cresylviolet-ethanol solution, and SN DA neurons were identified by anatomical location, morphology and size in brightfield mode. In adult mice, fluorescence-traced SN DA neurons were identified under Y3 filter (565–610 nm, exposure time: 250 ms). The size/area of lasered cells was determined automatically after calibration by the LMD7000 software (Version 8.2.0.6739, Leica Microsystems). We ensured that lasered areas were similar for all analyzed animals/compared groups (Supplementary Figure S1 and Supplementary Table S2).
Qualitative Multiplex Nested PCR and Quantitative Realtime PCR
All cDNA reactions were precipitated as described (Liss, 2002) and resolved in 17 μl RNase free water (5Prime, Molecular biology grade, certified RNase free). Qualitative and quantitative PCRs were carried out, essentially as described (Liss et al., 2001; Grundemann et al., 2011; Poetschke et al., 2015; Duda et al., 2018). All primers except for ND1 were spanning at least one intron to quantify only cDNA-derived signals. We performed a qualitative multiplex PCR with the GeneAmp PCR System 9700, Thermo Fisher Scientific, with an aliquot of 5 μl (30%) of each individual cDNA-pool for respective marker genes: Tyrosine hydroxylase (TH) as a marker for dopaminergic midbrain neurons, the glutamic acid decarboxylase isoforms GAD65 and GAD67 as markers for GABAergic neurons, glial fibrillary acidic protein (GFAP) as a marker for astroglia cells and calbindind28k (CBd28k), that is strongly expressed only in less vulnerable DA midbrain neurons. Qualitative PCR products were analyzed in a QIAxcel Advanced System (Quiagen). Only cDNA pools expressing the correct marker gene profile (i.e., TH positive, GAD, GFAP, CBd28k negative) were further analyzed via qPCR. All primer pairs and amplicon information are given in Supplementary Table S1.
Quantitative realtime PCR was performed as described (Grundemann et al., 2011; Duda et al., 2018), by using the 7900 HT Fast realtime PCR System and QuantStudio 3 System, both Thermo Fisher Scientific Thermocyclers. TaqManTM primer/probe assays were marked with a 3′ BHQ (black hole quencher) and 5′ FAM (Carboxyfluorescein). TaqMan assays were carefully established and performance was evaluated by generating standard curves, using defined amounts of cDNA (derived from midbrain tissue mRNA), over four magnitudes of 10-fold dilutions as templates, in at least three independent experiments, as described (Liss, 2002; Duda et al., 2018). All TaqMan assays and standard curve details are summarized in Table 1.
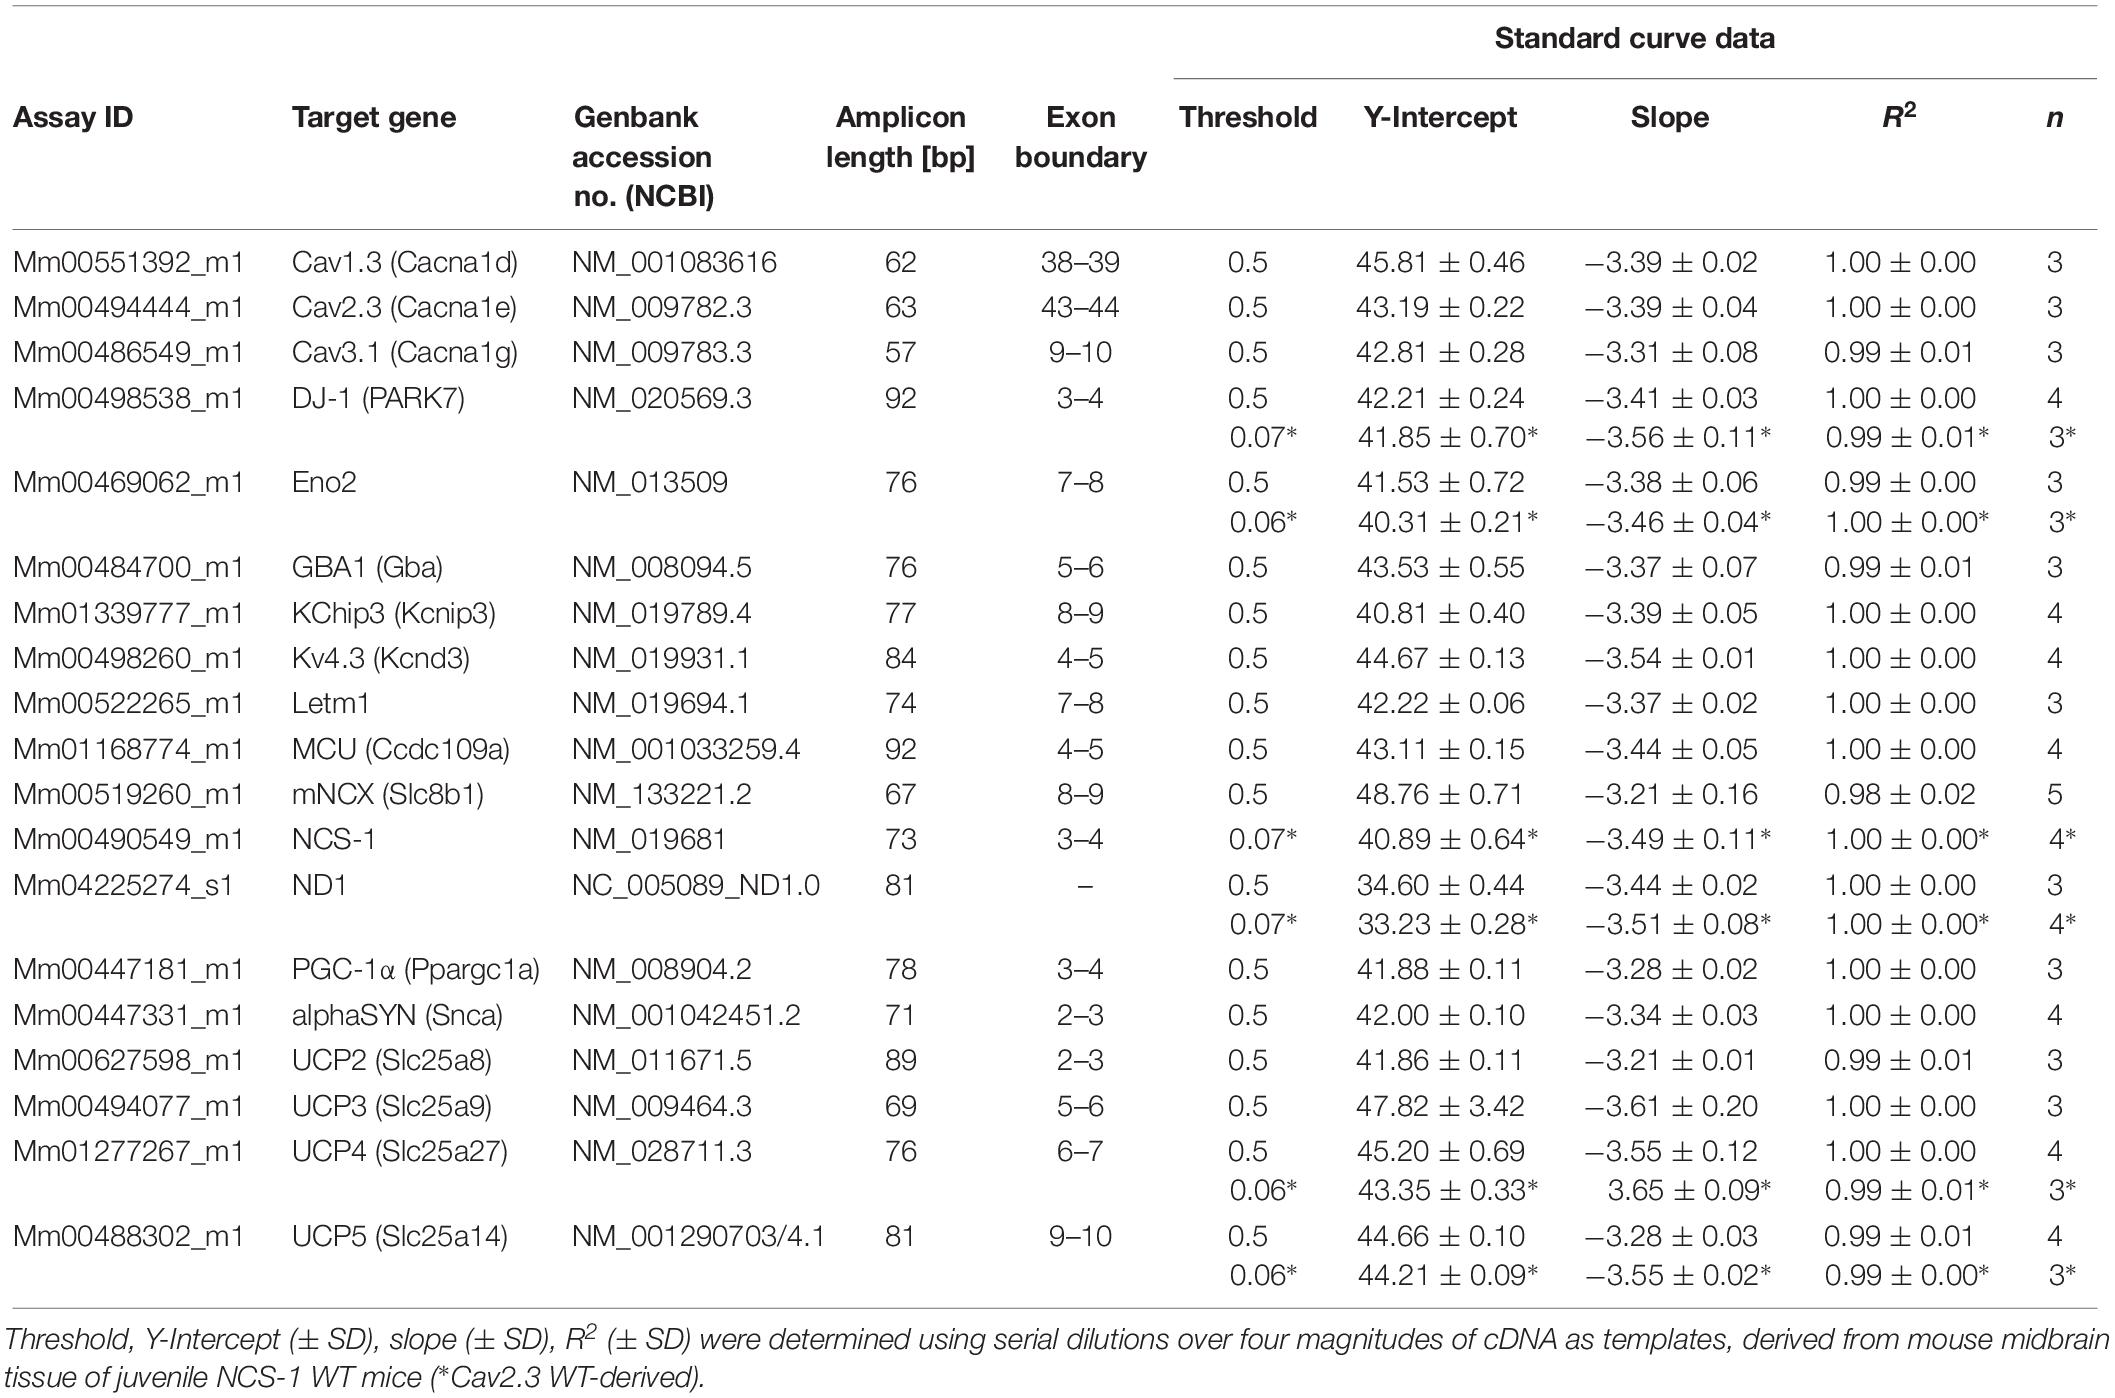
Table 1. TaqMan® assay and standard curve information.
Isolation of Genomic DNA From Laser-Microdissected Neurons and qPCR Quantification of Genomic ND1
Laser-microdissected pools of 10 SN DA neurons as well as single neurons were harvested into the lid of a reaction tube (PCR Tubes Thinwall Clear 0.5 ml, Axygen), containing 15 μl ATL-buffer (tissue lysis buffer, Qiagen). The QiaAmp DNA Micro-Kit (Qiagen) was used and the manufacturer protocol was adapted as described for genomic DNA isolation (Muhling et al., 2014). Genomic DNA was eluted in 30 μl water and 5 μl were used for ND1 qPCR. Mitochondrial genome copy number was estimated by quantifying the mitochondrially coded NADH-ubiquinone oxidoreductase chain I (ND1) from genomic DNA via qPCR, as described (Bender et al., 2006; Muhling et al., 2014). We quantified genomic ND1 levels in single SN DA neurons as well as in pools of 10 neurons (Supplementary Table S2 and Supplementary Figure S2). As we detected no significant differences in mean copy-number per individual SN DA neuron between both approaches, respective data sets were pooled.
qPCR Data Analysis and Statistics
For qPCR data analysis as well as for graphical representation, the SDS 2.4 software (Thermo Fisher Scientific), the QuantStudioTM Design and Analysis Software (Thermo Fisher Scientific) and GraphPad Prism 6 (GraphPad Software Inc.) were used. The cDNA-amount per cell in relation to the utilized standard was calculated as described (Grundemann et al., 2011; Schlaudraff et al., 2014; Duda et al., 2018), according to the following formula:
S stands for the serial dilution factor of the standard curve (in our case 10 for serial dilution steps of 10), Nocells corresponds to the number of harvested neurons per cDNA sample (here 10), and cDNA fraction refers to the fraction of the cDNA (or respectively genomic ND1 DNA) reaction product, used as a template in qPCR reactions (cDNA: 1.5/17 for ND1 and ENO2; 5/17 for all other analyzed genes. Genomic DNA: 5/30 for ND1). The YIntercept unit magnitude corresponds to the respective standard utilized (e.g., pg equivalents of standard cDNA, derived from midbrain tissue mRNA). To facilitate comparison, cDNA amounts were calculated with a YIntercept of 45.00 for all genes. Expression data are given as mean ± SD with and without normalization to the neuronal size per microdissected area (by dividing respective expression values to the corresponding area of the individual microdissected neurons). Note that the mitochondrially encoded ND1 gene contains no intron, thus the RT-qPCR results reflect number of cDNA and genomic ND1 molecules per sample.
Outlier tests were performed in GraphPad Prism 6 and outliers were removed according to ROUT-outlier test. For statistical analysis, the non-parametric Mann-Whitney U (MWU) test was used. Significant differences are marked by asterisks (∗p ≤ 0.05; ∗∗p < 0.01; ∗∗∗p < 0.001, and ****p < 0.0001).
Results
To study possible transcriptional changes in vulnerable SN DA neurons upon NCS-1 loss, we quantified mRNA levels of PD and/or Ca2+ stress-related genes. To analyze relative mRNA expression levels with best possible resolution, we used our well-established single cell UV-LMD RT-qPCR protocol, and optimized TaqMan primer/probe assays. Figure 1A summarizes the general work-flow, Table 1 and Supplementary Table S1 summarize details of all utilized PCR primer/probe assays. As illustrated in Figure 1B, all analyzed mRNAs are readily detected in wildtype mouse midbrain tissue, including NCS-1. This was also the case in individual laser-microdissected SN DA neurons from wildtype mice for most genes, with the following exceptions: the mitochondrial uncoupling protein UCP2 was detected only in about 50% (n = 8 of 15), the mitochondrial Ca2+ exchanger mNCX only in about 22% (n = 2 of 9) of SN DA neurons, while UCP3 was not detected at all, in accordance with previous work (Andrews et al., 2005; Liss et al., 2005; Hoang et al., 2012). Hence, we focused on comparing mRNA levels of ND1 and ENO2 proteins, the mitochondrial Ca2+ transporters MCU and LETM1, the mitochondrial uncoupling proteins UCP2, 4, and 5, the PARK genes DJ-1, SNCA, PGC-1α, and GBA1, and the ion channels Cav1.3, Cav2.3, Cav3.1, and Kv4.3/KChip3, in SN neurons that were positive for tyrosine hydroxylase, ND1 and ENO2, while negative for calbindind28k, GAD65/67, and GFAP. RT-qPCR data were normalized to cell sizes, derived from laser-microdissected areas. Mean cell sizes/lasered areas were similar for all compared groups (Supplementary Figure S1 and Supplementary Table S2).
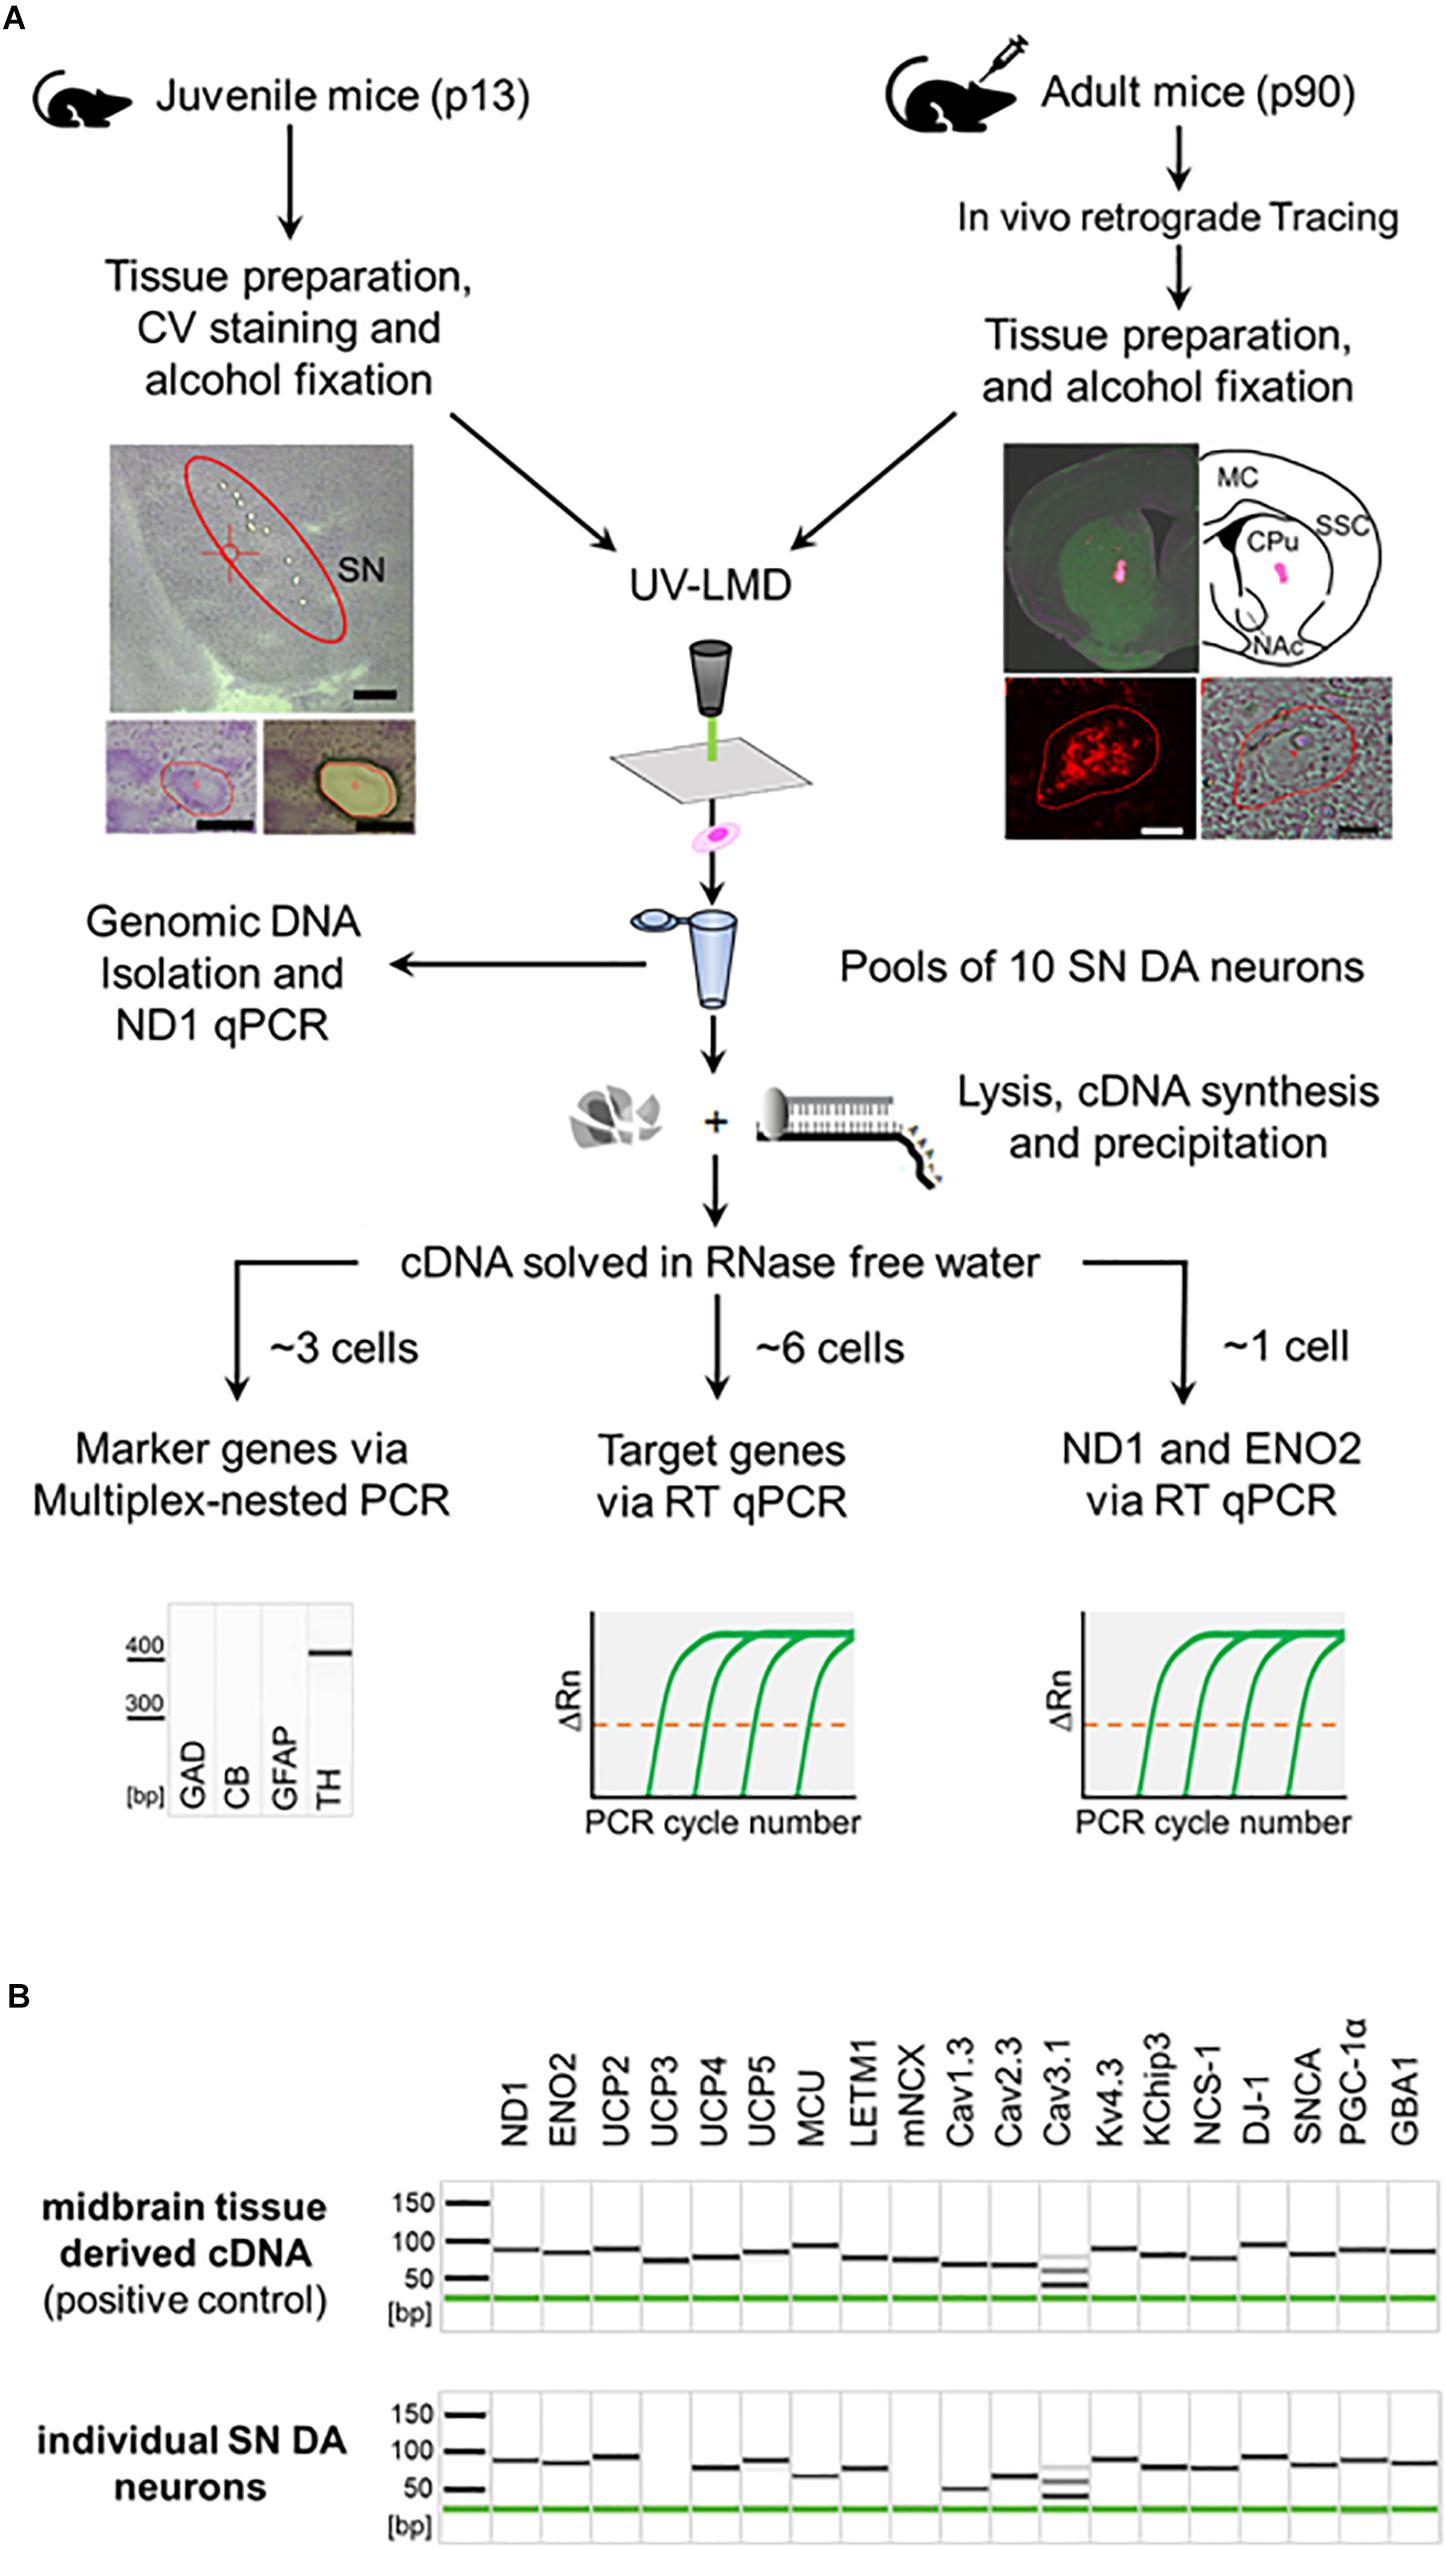
Figure 1. General workflow illustrating procedure for combined UV-LMD and RT-qPCR based mRNA and genomic DNA analysis for individual mouse SN DA neurons. (A) Coronal cryo-sections from juvenile (PN13) mice were stained with cresylviolet (CV) and ethanol-fixed. SN of adult mice (PN90) was in vivo retrogradely traced and coronal cryo-sections were not CV-stained but only ethanol-fixed. SN DA neurons were isolated via UV-LMD into a sterile reaction tube. Subsequently, either genomic DNA was isolated from each sample for qPCR-based quantification of genomic ND1, or a combined lysis and cDNA synthesis protocol was applied, followed by cDNA precipitation for qPCR-based mRNA quantification. A fraction of each cDNA-pool was used for qualitative multiplex-nested marker gene PCR. Note that only samples expressing the correct marker gene profile (TH positive, GAD, CB, GFAP negative) were further analyzed via TaqManTM qPCR, as indicated. GAD, L-glutamate decarboxylase; CB, calbindind28k; GFAP, glial fibrillary acidic protein; TH, tyrosine hydroxylase. Left photographs: Upper: Overview of a juvenile CV-stained wildtype mouse coronal section after UV-LMD of 10 SN DA neurons. The Substantia nigra (SN) is highlighted. Scale bar: 500 μm. Lower: An exemplary juvenile SN DA neuron before (left) and after (right) UV-LMD. Scale bars: 30 μm. Right photographs: Upper: View of an adult in vivo traced injection site (i.e., dorsal striatum), next to an illustration of the respective brain section according to the mouse brain atlas (Paxinos and Franklin, 2013). MC, motor cortex; SSC, somatosensory cortex; CPu, Caudate putamen; NAc, Nucleus Accumbens. Lower: Traced SN DA neuron in fluorescence (left) and brightfield mode (right). Scale bars: 10 μm. (B) Upper: Gel image after capillary electrophoresis of RT-PCR products indicates that all presumed mRNAs are expressed in standard cDNA, derived from PN13 C57BL/6J mouse midbrain tissue in a 1:104 dilution (positive control). Lower: Gel image after capillary electrophoresis of RT-PCR products of an individual SN DA neuron from a WT mouse indicates that all genes analyzed in this study, except for UCP3 and mNCX, are regularly expressed at the mRNA level in individual TH positive SN neurons from WT mice. Note, that we detected positive signals for mNCX only in ∼22% (2 of 9) and signals for UCP2 only in ∼50% (8 of 15) of analyzed WT SN DA neurons.
We first analyzed ND1 and ENO2 mRNA, as markers for mitochondrial and glycolytic ATP synthesis, respectively in SN DA neurons from NCS-1 KO and WT mice. Both mRNAs were readily detected in all samples, but levels for both genes were about 20% lower in NCS-1 KO (Figure 2, Table 2 and Supplementary Table S2; ND1: n = 87 for WT, n = 93 for KO, KO/WT = 0.82, p = 0.0152; ENO2: n = 87 for WT, n = 84 for KO, KO/WT = 0.72, p = 0.0034). As the mitochondrially coded ND1 gene is intronless, the RT-qPCR results reflect the amounts of cDNA and genomic DNA. To address if the lower detected mRNA levels are rather caused by lower numbers of mitochondrial genomes than by lower number of ND1 transcripts, we compared genomic ND1 levels in SN DA neurons from WT and NCS-1 KO mice (Figure 2, Table 2, and Supplementary Table S2). As genomic ND1 levels were similar, this argues for lower ND1 transcription or lower ND1 mRNA stability, but similar numbers of mitochondrial genomes in SN DA neurons from NCS-1 KO mice.
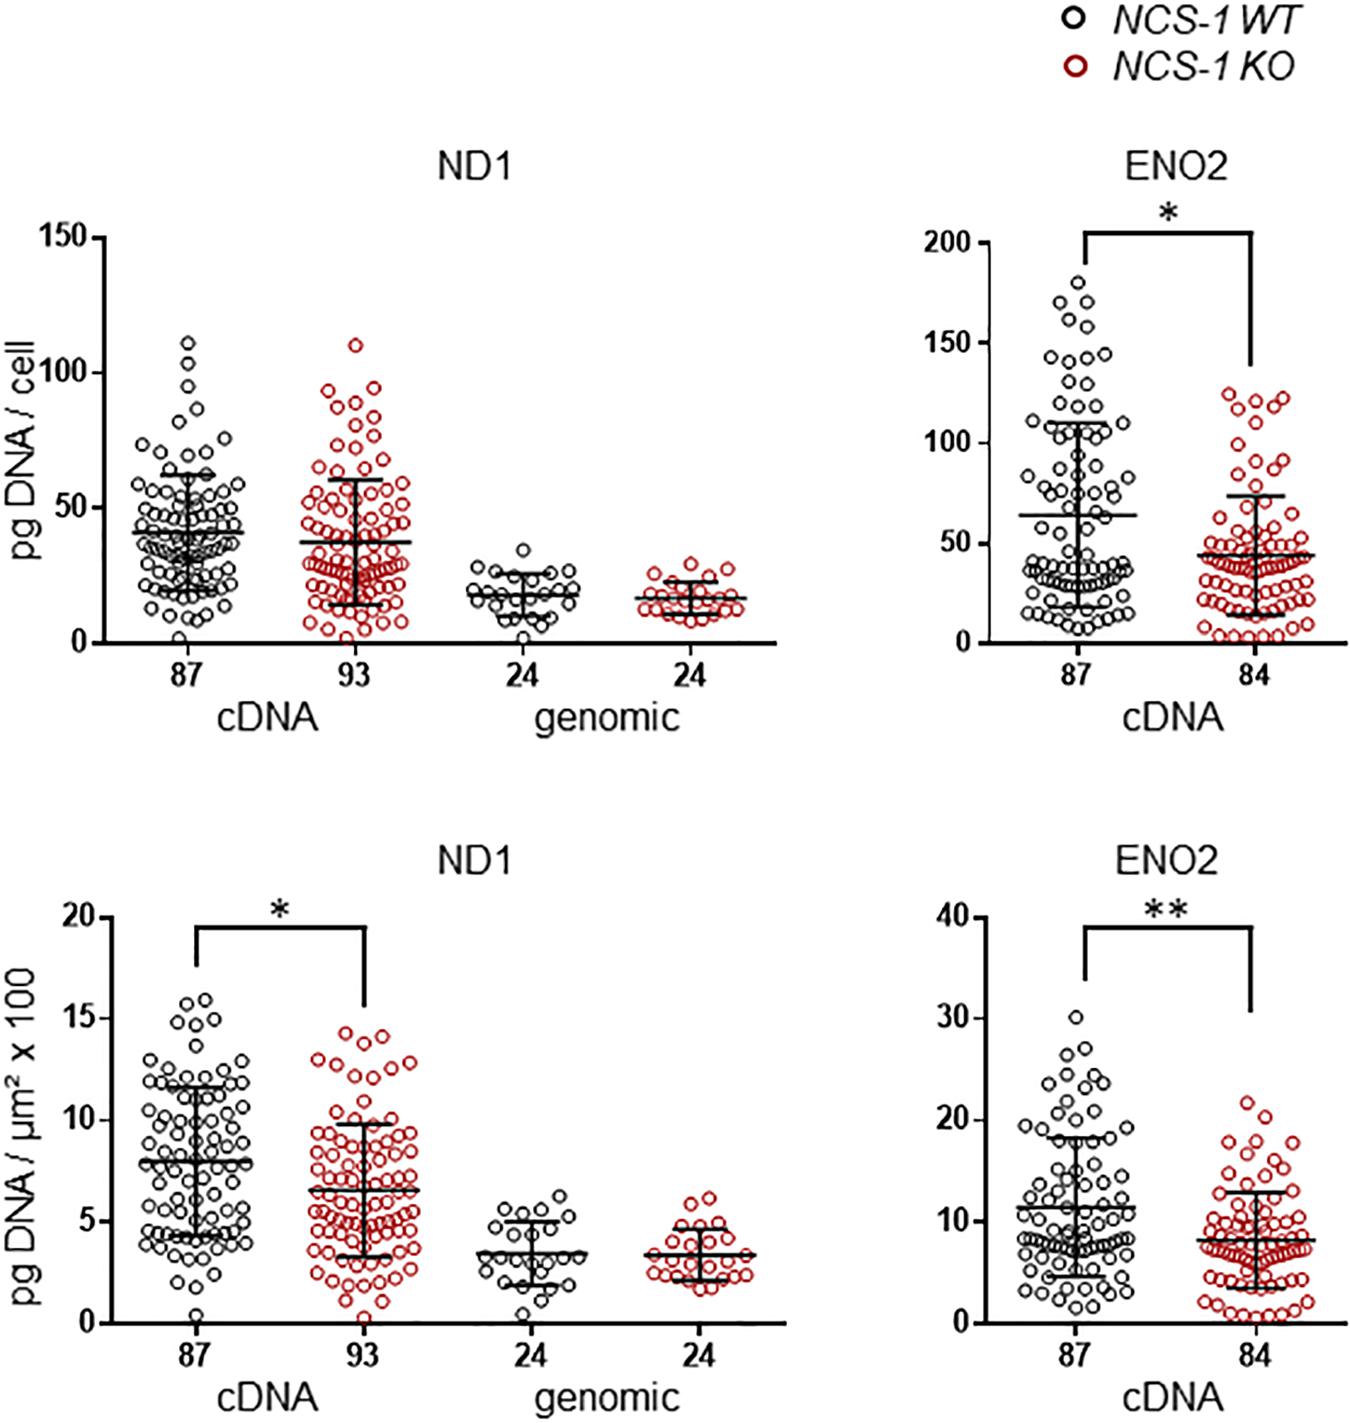
Figure 2. Lower relative cDNA levels of ND1 and ENO2 in SN DA neurons from NCS-1 KO mice compared to WT. Left: qPCR-derived relative cDNA and genomic DNA levels of mitochondrially coded NADH-ubiquinone oxidoreductase chain 1 (ND1) in individual TH positive SN DA neurons from juvenile NCS-1 KO and WT mice, relative to respective tissue cDNA derived standard curves (in pg/cell, upper), and in addition normalized to specific laser-microdissected neuron sizes (in μm2 × 100, lower). Note that ND1 cDNA levels reflect cDNA and also genomic DNA-derived signals, as the mitochondrially encoded ND1 gene contains no intron, but genomic ND1 levels alone are similar between WT and KO. Right: Similar qPCR-derived relative cDNA levels for the same samples as in (A) for the neuron specific enolase (ENO2). Data are given as scatter plots with mean ± SD. Significant differences are indicated according to Mann–Whitney U-tests and marked with asterisks (∗p ≤ 0.05; ∗∗p < 0.01). Numbers of analyzed individual SN DA neuron-derived cDNA samples (n) are given on the x-axis. All data and statistics detailed in Supplementary Figure S2 and Supplementary Table S2.
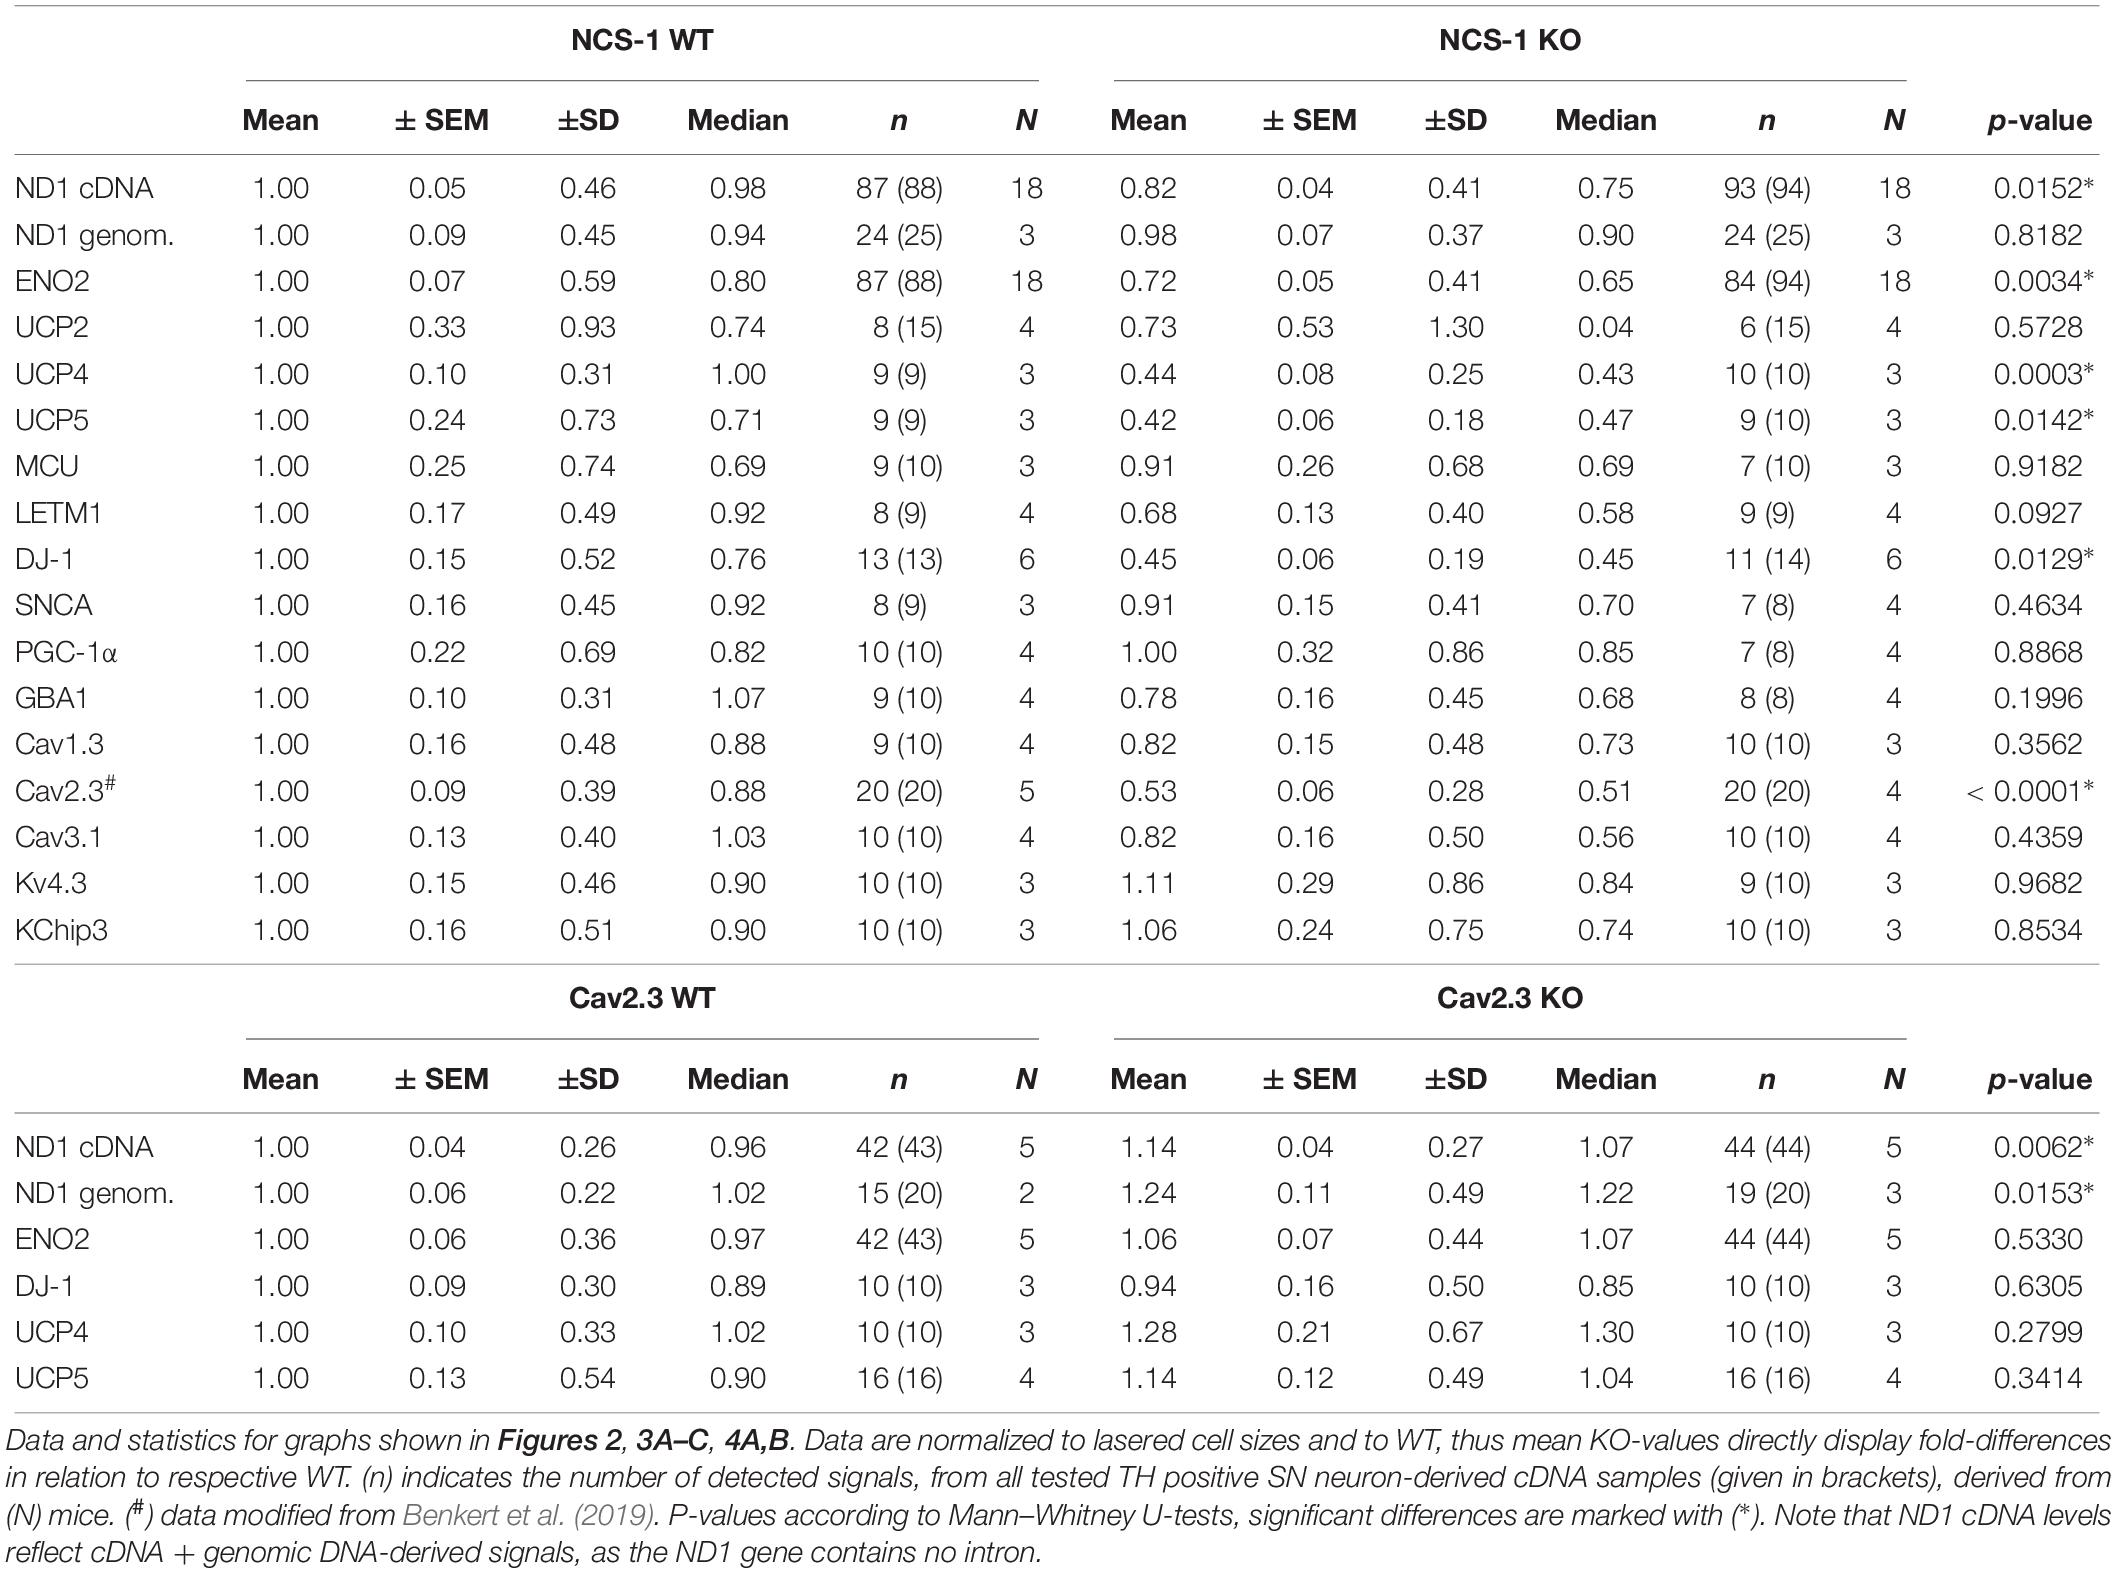
Table 2. Relative mRNA levels in SN DA neurons of either NCS-1 KO or Cav2.3 KO, normalized to individual cell sizes, and to respective WT data.
Furthermore, we detected about 60% lower levels of the mitochondrial uncoupling proteins UCP4 and UCP5, while those of UCP2, MCU and LETM1 were not changed (Figure 3A, Table 2, and Supplementary Table S3; UCP4: n = 9 for WT, n = 10 for KO, KO/WT = 0.44, p = 0.0003; UCP5: n = 9 for WT, n = 9 for KO, KO/WT = 0.42, p = 0.0142). For mNCX, we detected signals only in 2 out of 9 WT samples and in none of the 10 NCS-1 KO samples (Supplementary Table S3), thus a statistical comparison is not meaningful. Similar as for UCP4 and UCP5, we detected about 55% lower mRNA levels of the PARK7 gene product, the deglycase DJ-1 (Figure 3B, Table 2, and Supplementary Table S3; n = 13 for WT, n = 11 for KO, KO/WT = 0.45, p = 0.0129). In contrast, mRNA levels of all other analyzed PD-related genes (SNCA, PGC-1α, and GBA1) were similar in SN DA neurons from NCS-1 KO and WT mice (Figure 3B, Table 2, and Supplementary Table S3). mRNA levels of Cav2.3 R-type channel α-subunits were also about 50% lower (n = 20 for WT, n = 20 for KO, KO/WT = 0.53, p < 0.0001) in SN DA neurons from NCS-1 KO mice. In contrast, those of Cav1.3 and of Cav3.1 were not changed. Likewise, transcript levels of Ca2+ sensing KChip3 and of Kv4.3 A-type K+ channel subunits were also similar in NCS-1 KO and WT mice (Figure 3C, Table 2, and Supplementary Table S3).
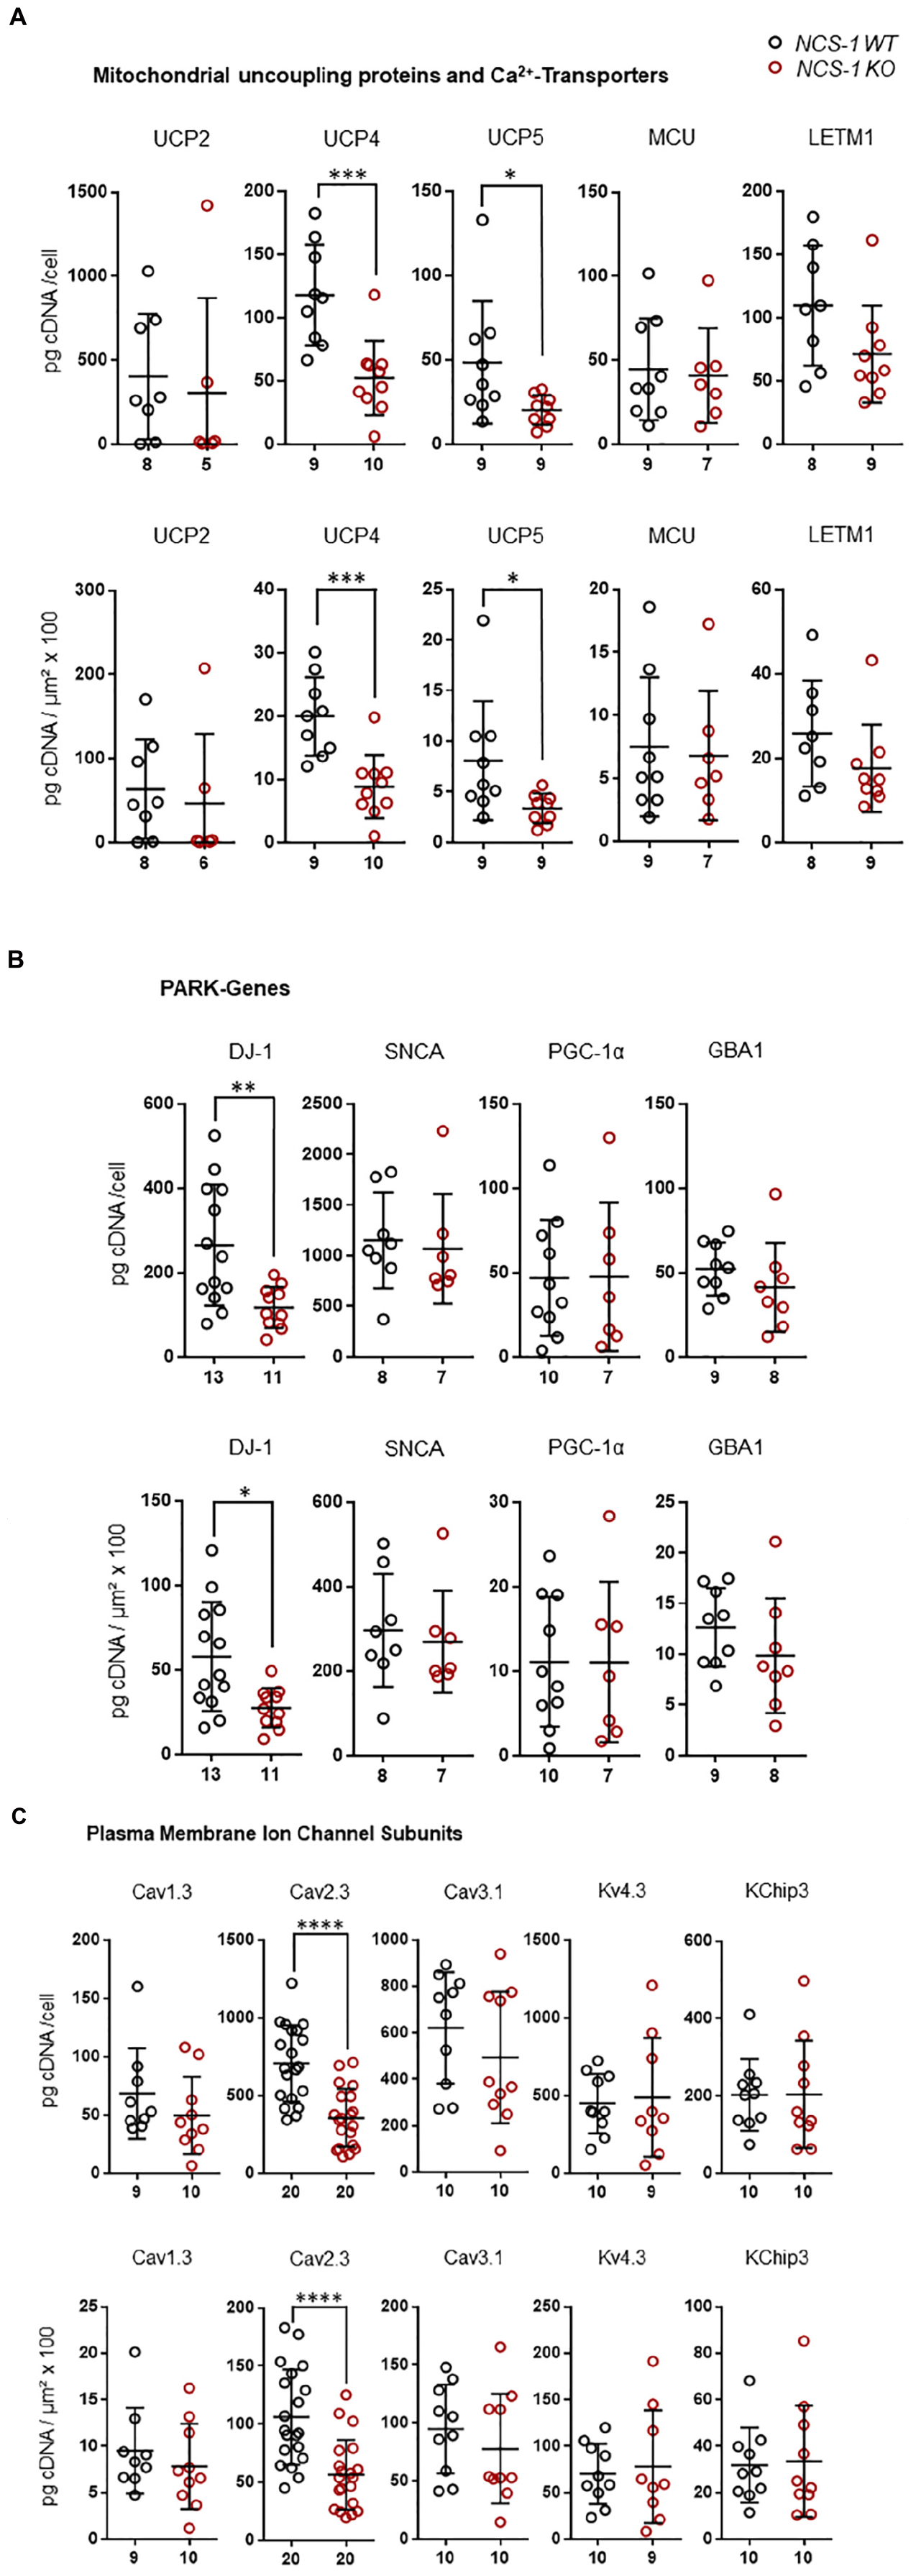
Figure 3. Lower mRNA levels selectively of UCP4, UCP5, DJ-1, and Cav2.3 in SN DA neurons from NCS-1 KO mice compared to WT. Relative RT-qPCR-derived data from individual TH positive SN neurons from juvenile NCS-1 KO and WT mice (A) for mitochondrial uncoupling proteins UCP2, UCP4, UCP5 and mitochondrial Ca2+ transporters MCU, and LETM1, (B) for the PD-associated PARK genes DJ-1, SNCA, PGC-1α, GBA1, and (C) for the voltage-gated ion channel pore forming α-subunits Cav1.3, Cav2.3, Cav3.2, and Kv4.3, as well as for KChip3. Data are given relative to respective tissue cDNA-derived standard curves (in pg/cell, upper), and normalized to specific laser-microdissected neuron sizes (in μm2 × 100, lower), as scatter plots with mean ± SD. Cav2.3 data modified from Benkert et al. (2019). Significant differences are indicated according to Mann–Whitney U-tests and marked with asterisks (∗p ≤ 0.05; ∗∗p < 0.01; ∗∗∗p < 0.001 and ****p < 0.0001). Numbers of analyzed individual SN DA neuron-derived cDNA samples (n) are given on the x-axis. All data and statistics detailed in Supplementary Table S3.
In summary, we detected at the transcriptional level an orchestrated downregulation, of ND1 and ENO2, both involved in ATP synthesis, of the mitochondrial uncoupling proteins UCP4 and UCP5, the PARK7 gene DJ-1, and of Cav2.3 in SN DA neurons from NCS-1 KO mice, compared to WT.
Cav channels can regulate gene expression (Gomez-Ospina et al., 2006; Barbado et al., 2009; Pinato et al., 2009), and in SN DA neurons Cav activity contributes to elevated metabolic stress and to their degeneration in PD (Surmeier et al., 2017a; Guzman et al., 2018; Tabata et al., 2018). To address if the lower mRNA levels of ND1, ENO2, UCP4, and 5, and DJ-1 in SN DA neurons from NCS-1 KO mice are possibly secondary to the lower Cav2.3 levels in NCS-1 KO, we analyzed the expression of these genes in SN DA neurons from Cav2.3 KO mice and respective wildtype controls. In SN DA neurons from Cav2.3 KO, ND1 mRNA as well as genomic DNA levels were about 15 and 25% higher compared to those of WT mice, respectively, pointing to more mitochondrial genomes in SN DA neurons from Cav2.3 KO (Figure 4A, Table 2, and Supplementary Table S2; ND1 mRNA + genomic DNA: n = 42 for WT, n = 44 for KO, KO/WT = 1.14, p = 0.0062; genomic DNA: n = 15 for WT, n = 19 for WT, KO/WT = 1.24, p = 0.0153). For all other tested mRNAs, levels were similar between WT and Cav2.3 KO (ENO2: Figure 4A, Table 2, and Supplementary Table S2; UCP4 and5, DJ-1: Figure 4B, Table 2, and Supplementary Table S4).
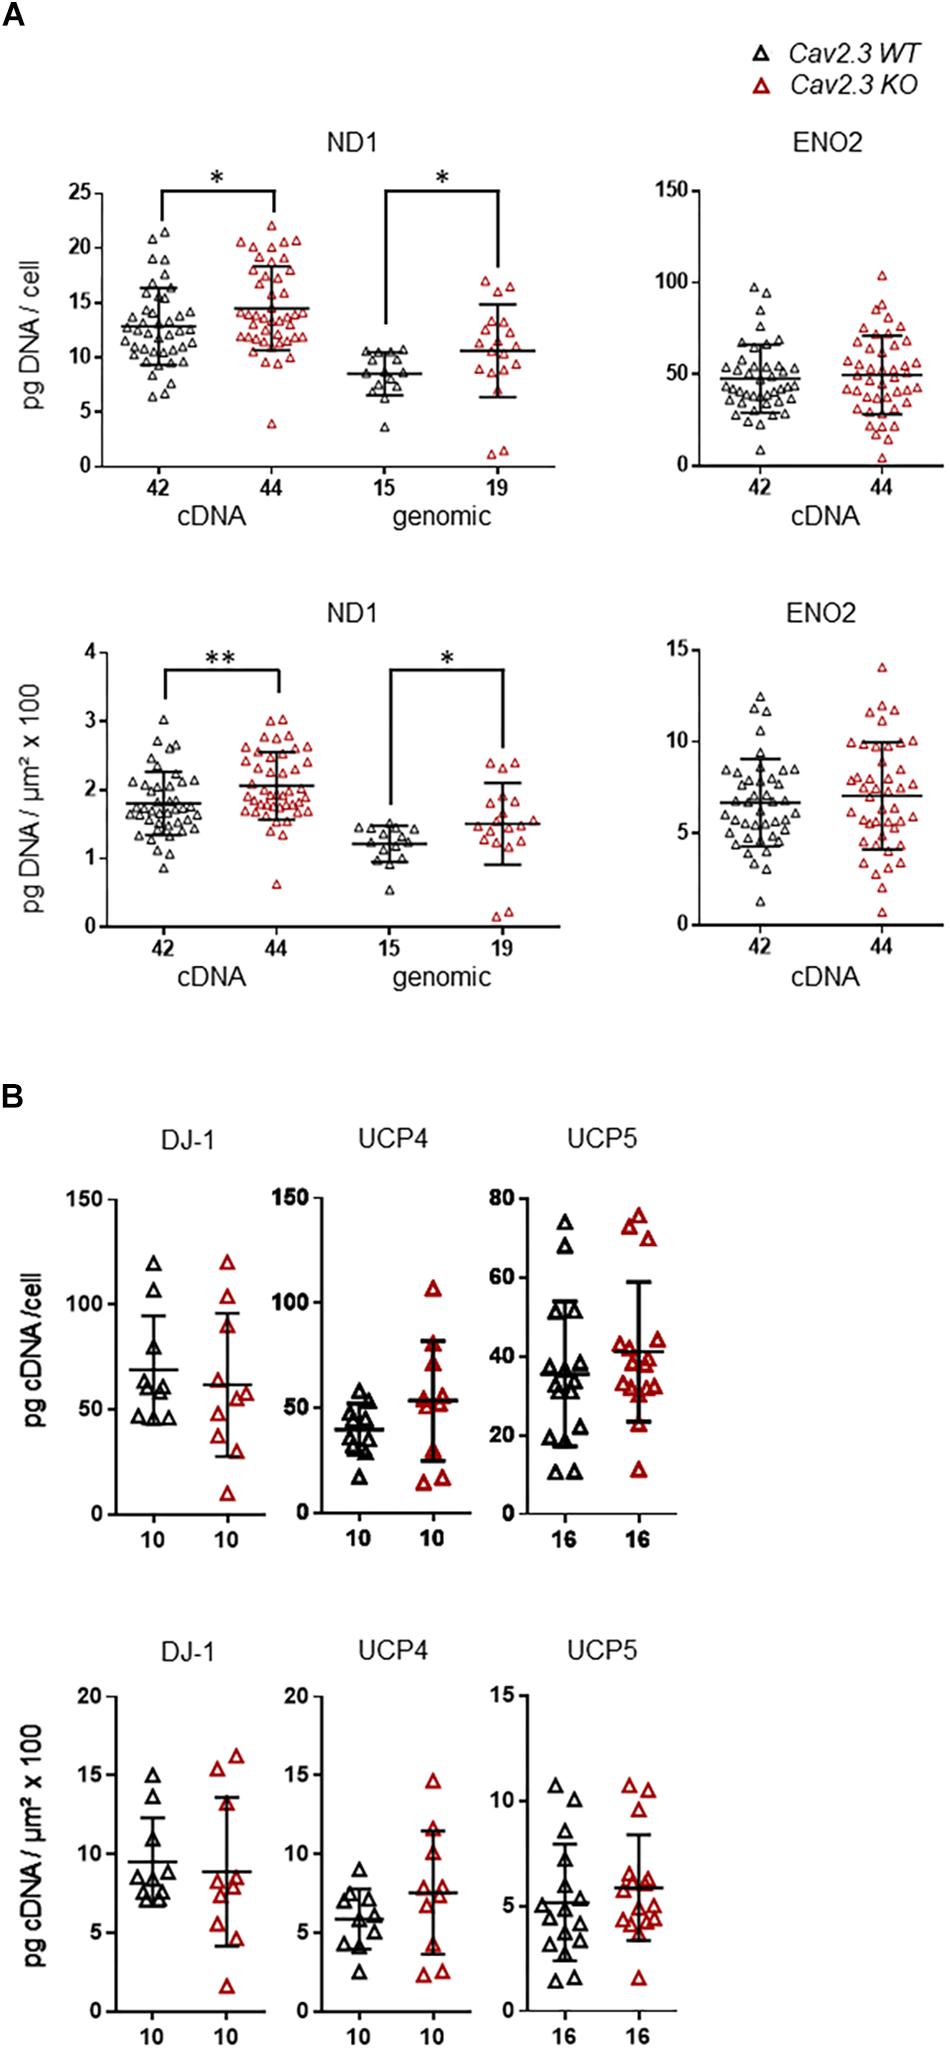
Figure 4. Higher expression levels selectively of ND1 cDNA and genomic DNA in SN DA neurons from Cav2.3 KO mice compared to WT. (A) Left: qPCR-derived relative cDNA and genomic DNA levels of mitochondrially coded NADH-ubiquinone oxidoreductase chain 1 (ND1) in individual TH positive SN DA neurons from adult Cav2.3 WT and KO mice, relative to respective tissue cDNA derived standard curves (in pg/cell, upper), or normalized to specific laser-microdissected neuron sizes (in μm2 × 100, lower). Note that ND1 cDNA levels reflect cDNA + genomic DNA-derived signals, as the ND1 gene contains no intron, and cDNA as well as genomic ND1 levels are elevated in the KO. Right: Similar qPCR-derived relative cDNA levels for the same samples as in (A, left) for the neuron-specific enolase (ENO2). (B) Relative RT-qPCR-derived data from individual TH positive SN neurons from Cav2.3 KO and WT mice for the genes as indicated (displaying lower mRNA levels in SN DA neurons from NCS-1 KO mice). All data are given as scatter plots with mean ± SD. Significant differences are indicated according to Mann–Whitney U-tests and marked with asterisks (∗p ≤ 0.05; ∗∗p < 0.01). Numbers of analyzed individual SN DA neuron-derived cDNA samples (n) are given on the x-axis. All data and statistics detailed in Supplementary Figure S2 and Supplementary Tables S2, S4.
Finally, we plotted the detected transcript levels for UCP4, UCP5, DJ-1, and Cav2.3 for NCS-1 KO and WT to that of ND1 and ENO2, determined in the same samples, to assess if the detected changes in SN DA neurons from NCS-1 KO mice were correlated with each other. Lower UCP4, UCP5 and Cav2.3 mRNA levels in NCS-1 KO were not correlated to that of ND1, as they were still significantly lower in KO when compared to WT in relation to ND1 mRNA levels, while in relation to ENO2, only UCP4 mRNA was still significantly lower in NCS-1 KO (Figure 5, Table 3, and Supplementary Table S5).
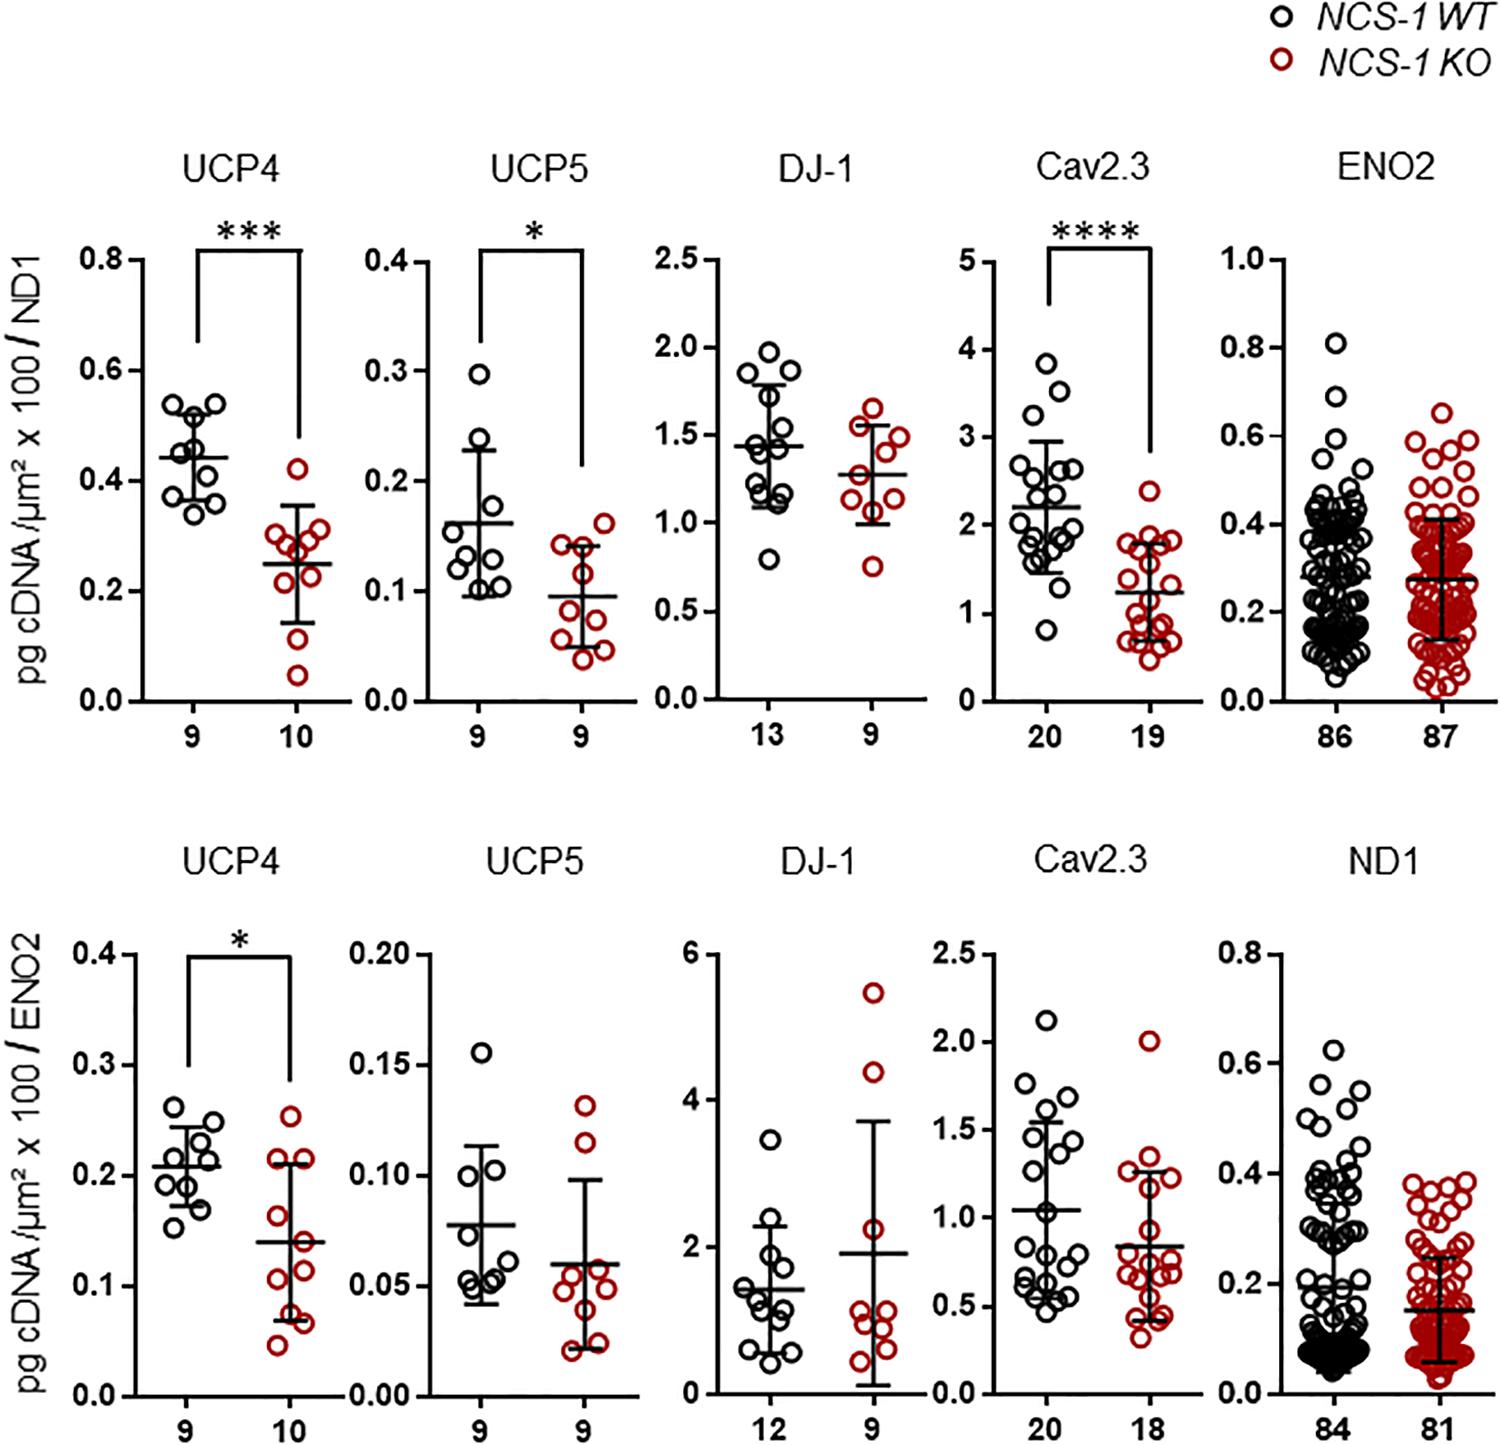
Figure 5. RT-qPCR data for genes with altered expression in SN DA neurons from NCS-1 KO, in relation to ND1 and ENO2 mRNA expression for the same samples. Relative mRNA expression data for NCS-1 WT and KO, normalized to cell sizes, from Figures 2, 3, plotted in relation to that of ND1 and ENO2, as indicated. Data are given as scatter plots with mean ± SD. Significant differences are indicated according to Mann–Whitney U-tests and marked with asterisks (∗p ≤ 0.05; ∗∗∗p < 0.001, and ****p < 0.0001). Numbers of analyzed individual SN DA neuron-derived cDNA samples (n) are given on the x-axis. All data and statistics detailed in Supplementary Table S5.
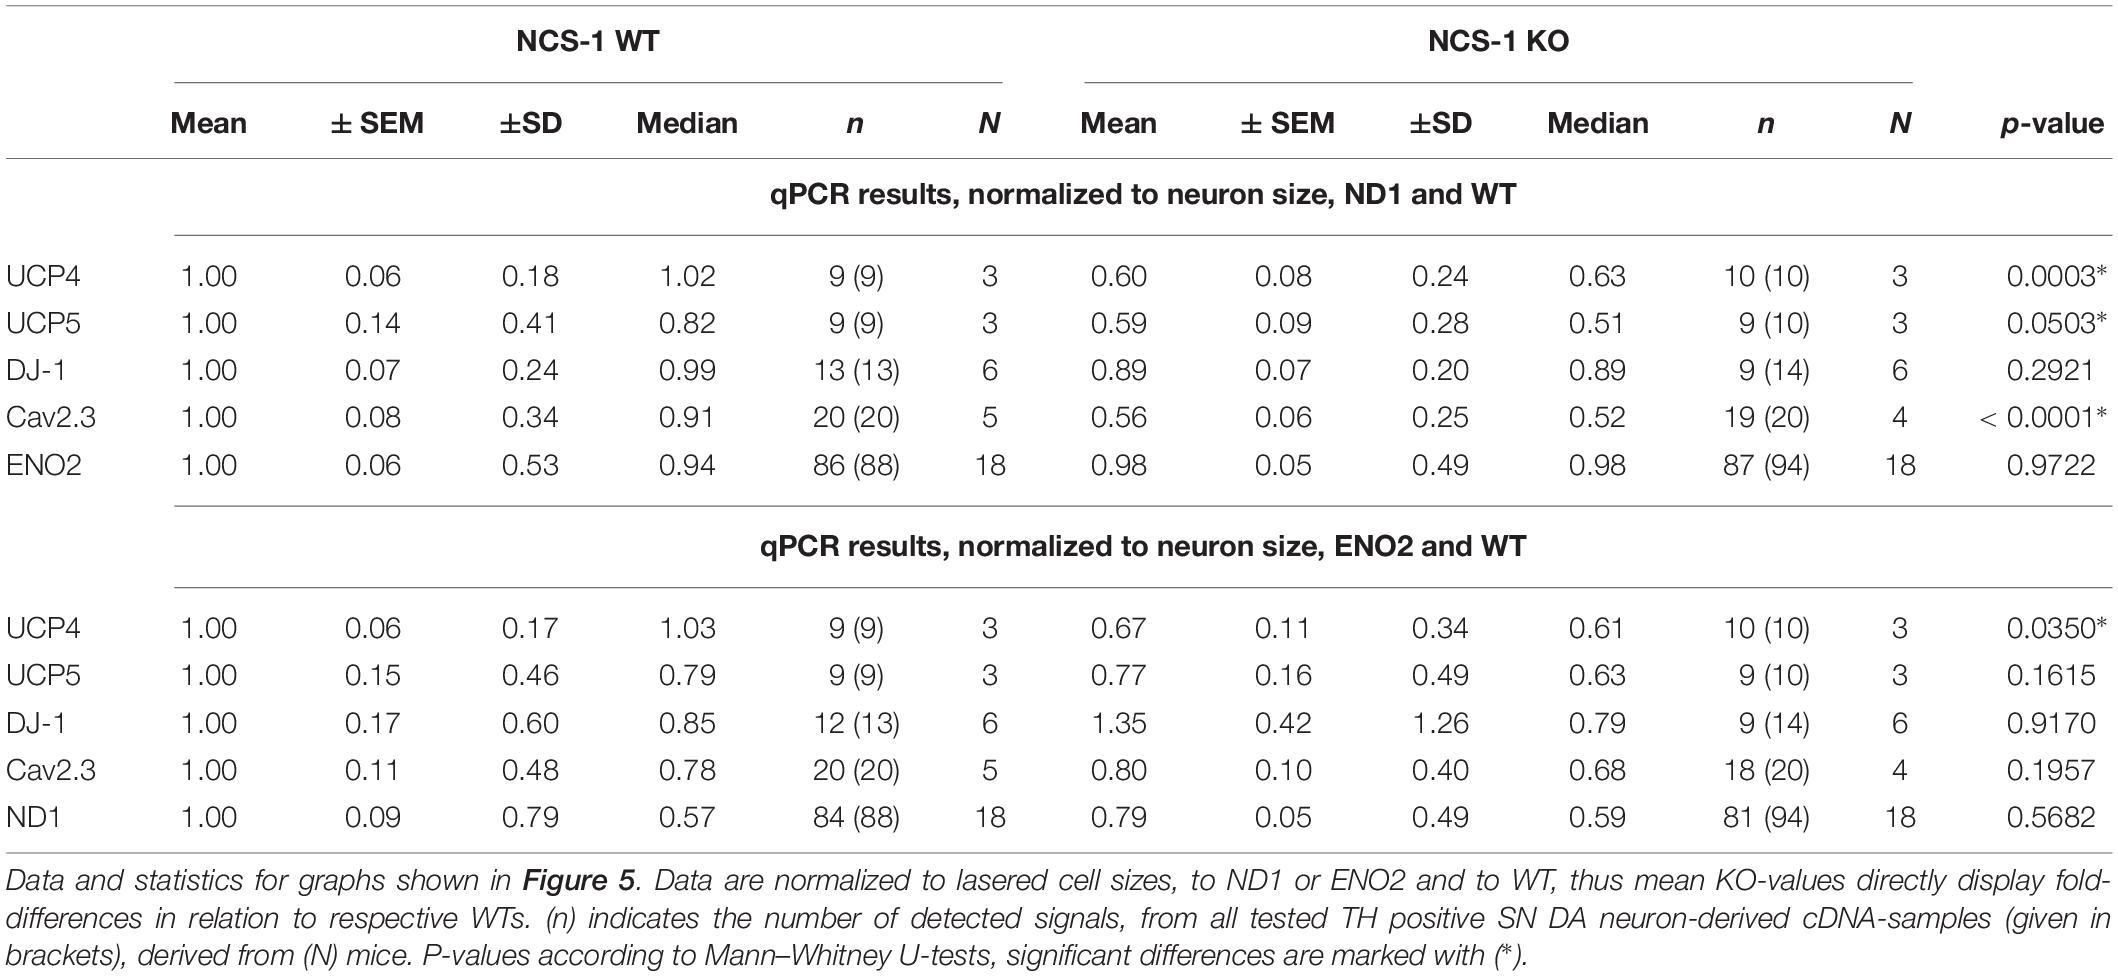
Table 3. Relative mRNA levels in SN DA neurons of NCS-1 KO and WT, normalized to cell sizes, in respect to that of ND1 or ENO2.
Discussion
Here, we addressed transcriptional changes in SN DA neurons, caused by the loss of NCS-1. We combined UV-LMD with RT-qPCR approaches to analyze mRNA levels in individual SN DA neurons of NCS-1 KO mice, compared to their respective wildtype. Figure 6 summarizes the main findings and conclusion of this study and illustrates complex Ca2+ signaling in SN DA neurons.
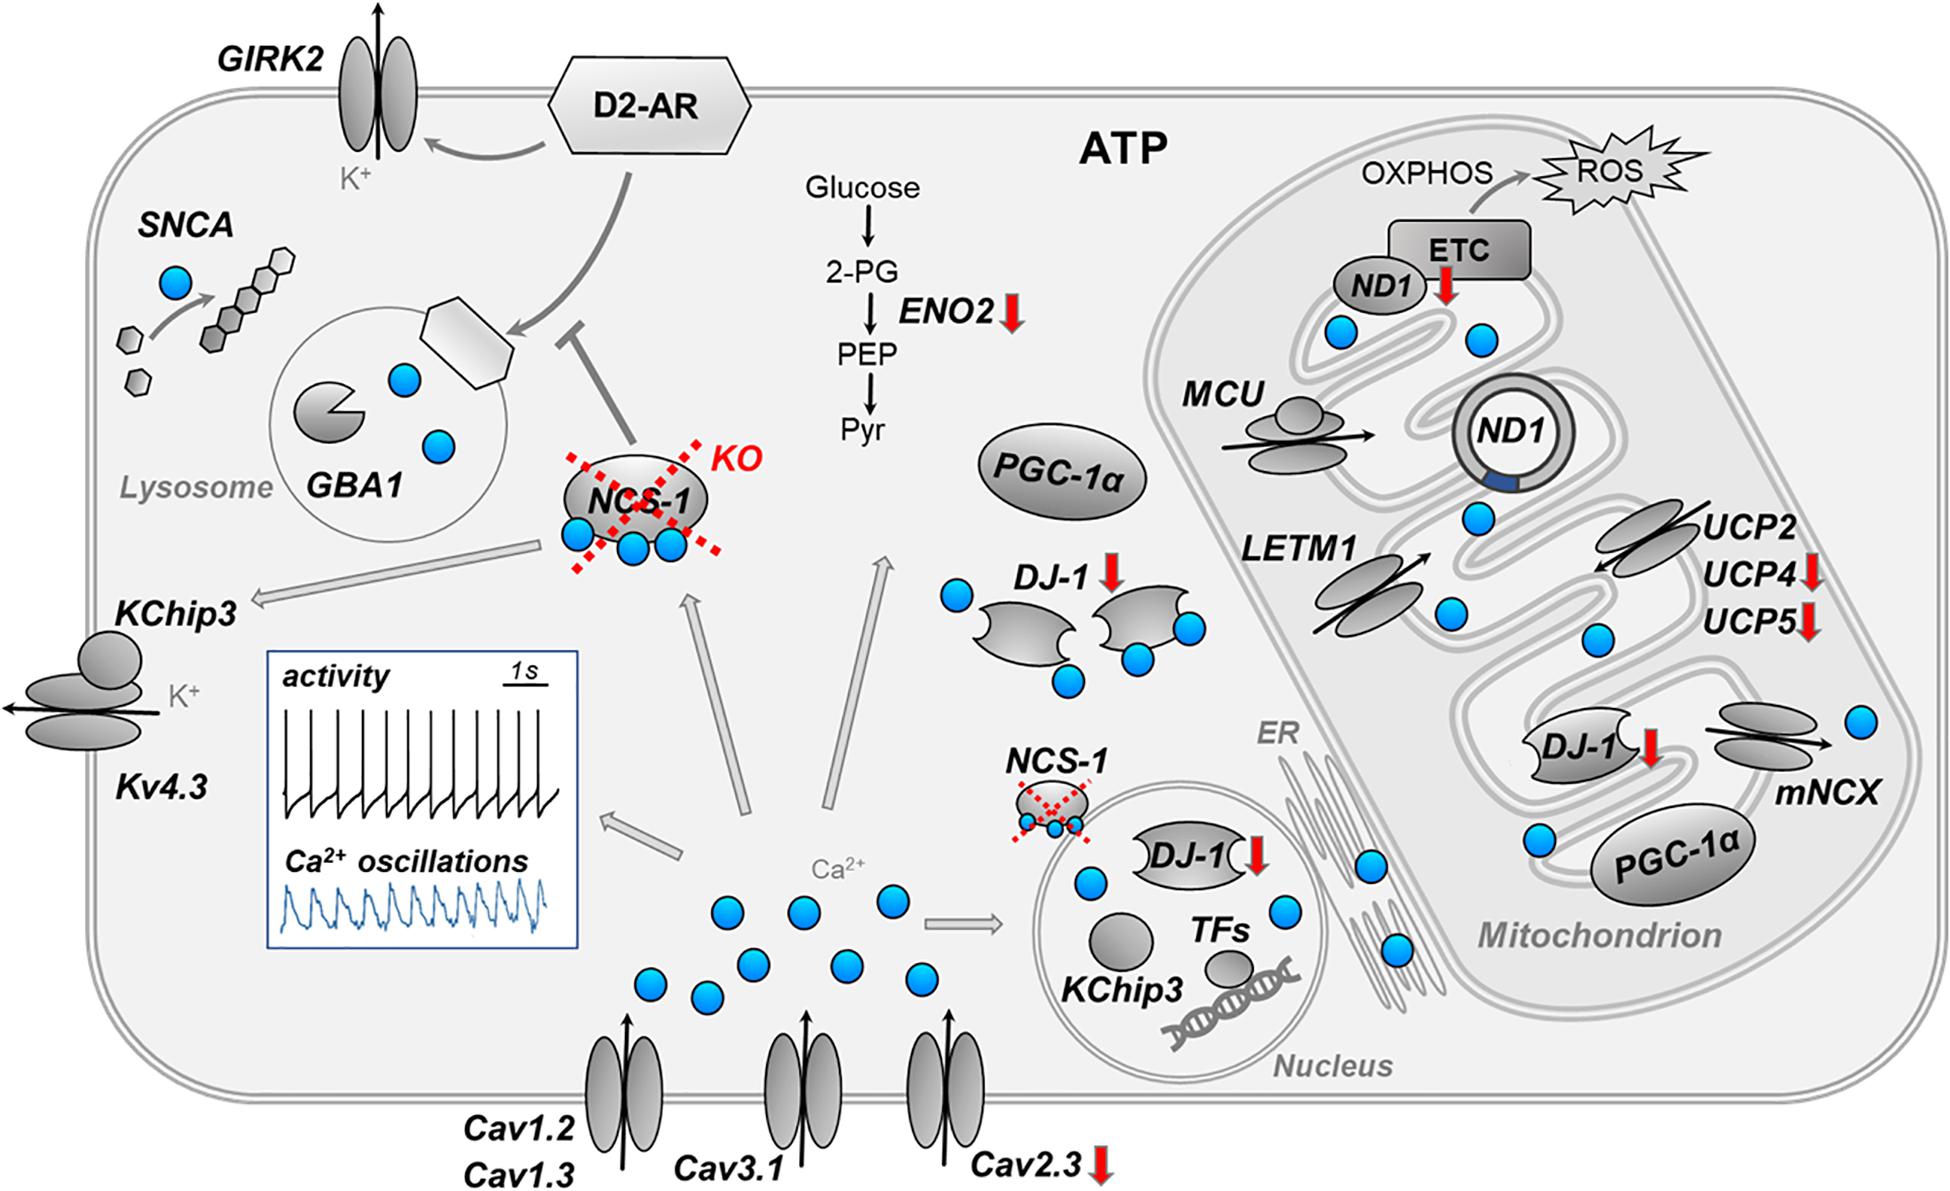
Figure 6. Summary cartoon of detected gene expression changes in SN DA neuron from NCS-1 KO mice. The cartoon summarizes the main findings and conclusions of this study and illustrates the complex activity- and compartment-dependent roles of Ca2+ signaling in vulnerable SN DA neurons. The white insert-box illustrates the autonomous pacemaker activity (black trace) and the associated Ca2+ transients (blue trace) of SN DA neurons (perforated patch clamp and Calcium-imaging experiment, adapted from Liss and Striessnig (2019). Loss of NCS-1 is indicated by red cross, red arrows indicate transcriptional changes in NCS-1 KO mice. Ca2+ (blue dots) has a variety of different physiological and potentially detrimental functions in distinct compartments of SN DA neurons, like stimulating ATP synthesis enzymes, controlling gene expression, and triggering apoptosis. Ca2+ can indirectly inhibit electrical activity of SN DA neurons by stimulating NCS-1/D2-AR or Kv4.3/KChip3 activity. Similar as NCS-1, KChip3 (also known as DREAM or Calsenilin) is not only a β-subunit of voltage-gated Kv4.3 K+ channels, but it can also translocate from the plasma-membrane to the nucleus, where it controls Ca2+ dependent enzymes or gene expression. For further details, see text. ATP, adenosine triphosphate; Cav, voltage-gated Ca2+ channel; DJ-1, protein deglycase; D2-AR, dopamine D2 autoreceptor; ENO2, neuron specific enolase; ER, endoplasmic reticulum; ETC, electron transfer chain; GBA1, glucocerebrosidase 1; GIRK2, G protein-coupled inwardly rectifying potassium channel; KChip3, Calsenilin (also known as DREAM); KO, knockout; Kv4.3, voltage-gated potassium channel subfamily D member; LETM1, leucine zipper EF-hand containing transmembrane protein 1; MCU, mitochondrial Ca2+ uniporter (pore-forming subunit); mNCX, mitochondrial sodium-calcium exchanger; NCS-1, neuronal calcium sensor 1; ND1, NADH-ubiquinone oxidoreductase chain 1; OXPHOS, oxidative phosphorylation; PEP, phosphoenolpyruvate; PGC-1α, peroxisome proliferator-activated receptor gamma coactivator 1-alpha; Pyr, pyruvate; ROS, reactive oxygen species; SNCA, alpha-synuclein gene; TFs, transcription factors; UCP, uncoupling protein; 2-PG, 2-phosphoglycerate.
NCS-1 – A Regulator of Gene Transcription in SN DA Neurons?
The finding that ND1, ENO2, UCP4, UCP5, DJ-1, and Cav2.3 transcripts are significantly lower in SN DA neurons from NCS-1 KO mice, indicates that NCS-1 is involved in regulating the transcription of these genes or the stability of their mRNAs in these neurons.
Ca2+ dependent regulation of gene expression in general, and in particular of genes involved in Ca2+ homeostasis and metabolic stress, is well described (Berridge et al., 2000; West et al., 2001; Greer and Greenberg, 2008; Naranjo and Mellstrom, 2012). For instance, a Ca2+ dependent regulation by calcineurin is described for NCS-1 gene expression itself (Hamasaki-Katagiri and Ames, 2010) that is stimulated by the neurotrophic factor GDNF (Nakamura et al., 2019). How exactly NCS-1 in turn could regulate gene expression remains less clear. A role of NCS-1 for controlling activity-related nuclear Ca2+ levels is reported for cardiomyocytes (Nakao et al., 2015). NCS-1 is present in the nucleus or in perinuclear regions (Burgoyne, 2007; Nakao et al., 2015), its nuclear targeting is Ca2+ dependent (O’Callaghan et al., 2002), and recent evidence suggests that NCS-1 might regulate gene transcription by sensing nuclear Ca2+ (Naranjo and Mellstrom, 2012; Nakamura et al., 2019). NCS-1 could control gene expression by indirect mechanisms, such as stimulation of Calmodulin kinase II, PI3/AKT-signaling (Petko et al., 2009; Nakamura et al., 2011), cAMP responsive elements (Souza et al., 2011), or DJ-1 (Xu et al., 2005; Takahashi-Niki et al., 2017). DJ-1 itself can translocate into the nucleus, particularly in response to metabolic stress, and regulates expression, e.g., of UCPs (Xu et al., 2018). Hence, the detected lower mRNA levels of UCP4 and UCP5 in NCS-1 KO mice might be secondary to the transcriptional downregulation of DJ-1. Lower levels of UCP4 and UCP5 were also described in SN tissue from DJ-1 KO mice (Guzman et al., 2010). Though the complex functions of DJ-1 are still not entirely clear, a support of mitochondrial function and reduction of metabolic stress is established (Biosa et al., 2017), and loss-of-function mutations in DJ-1 (PARK7) cause familial inherited PD (Bonifati et al., 2003).
Cav channel activity has also been linked to Ca2+ dependent regulation of gene expression (Gomez-Ospina et al., 2006; Barbado et al., 2009; Pinato et al., 2009). However, as mRNA levels of ENO2, UCP4, UCP5, and DJ-1 were all not altered in SN DA neurons of Cav2.3 KO mice, we conclude that their transcriptional downregulation in NCS-1 KO mice is rather not secondary to lower Cav2.3 levels. The higher ND1 mRNA and genomic levels in SN DA neurons from Cav2.3 KO might compensate for a reduced Ca2+ mediated stimulation of enzymes for ATP production. However, these are only theoretical speculations.
We found no evidence for transcriptional compensation of NCS-1 loss by KChip3. KChip3 (also named Calsenilin or DREAM) has overlapping functions with NCS-1 (Naranjo and Mellstrom, 2012; Burgoyne et al., 2019), and not only constitutes a beta subunit for Kv4.3 channels (An et al., 2000), that are involved in PD pathology (Subramaniam et al., 2014; Dragicevic et al., 2015), but it can also shuttle from the plasma-membrane to the nucleus, and act as a Ca2+ dependent transcription repressor by direct DNA binding (Carrion et al., 1999; Mellstrom and Naranjo, 2001; Gomez-Villafuertes et al., 2005; Mellstrom et al., 2014).
Possible compensation is generally important to consider, particularly for global knockouts. Both analyzed KO mouse strains have been already studied intensively and displayed clear phenotypes, in line with the described functions of NCS-1 and Cav2.3. The here studied NCS-1 KO mice showed decreased motivation, associated with lower dopamine release in the nucleus accumbens (Ng et al., 2016), and they are prone to gain weight and develop type 2 diabetes (Ratai et al., 2019). A different NCS-1 KO mouse strain, lacking exon 1 and resulting in disrupted NCS-1 protein, displayed an anxiety- and depression-like phenotype, reduced novelty-induced exploratory behavior (de Rezende et al., 2014), as well as reduced stress tolerance in cardiomyocytes due to dysfunctional mitochondrial detoxification and Ca2+ dependent pathways (Nakamura et al., 2016, 2019). Cav2.3-deficient mice display a mild cardiac, endocrine and neuronal phenotype (Pereverzev et al., 2005), assessed in four different KO mouse strains (Weiergraber et al., 2006). Mainly, they display slightly impaired insulin and somatostatin secretion (Jing et al., 2005; Zhang et al., 2007), mild cardiac arrhythmia (Weiergraber et al., 2005), and they are less prone to epilepsy (Weiergraber et al., 2007, 2010; Dibue-Adjei et al., 2017).
NCS-1 – A Regulator of ATP Synthesis and Metabolic Stress in SN DA Neurons?
Our data suggest that NCS-1 activity in SN DA neurons is correlated with the expression of genes important for glycolytic and mitochondrial ATP production (ND1, ENO2), as well as of genes that control mitochondrial function and reduce metabolic stress (UCP4, UCP5, DJ-1). This might offer an explanation for a possible but not yet demonstrated neuroprotective function of NCS-1 for SN DA neurons: stimulation of ATP synthesis while at the same time controlling metabolic stress levels.
This conclusion would be in line with a reported NCS-1 stimulation of mitochondrial function and of Ca2+ dependent survival promotion in injured neurons in general (Angebault et al., 2018; Nakamura et al., 2019). However, it is important to note that we do not provide any functional data here to support this conclusion. We are currently addressing this issue by comparing respiration, ATP production capacity, and mitochondrial uncoupling in freshly-dissected vital SN slices from NCS-1 KO and wildtype mice via Seahorse XFe analysis.
Our findings are however well-complemented by a similar study in cardiomyocytes, at protein and functional levels (Nakamura et al., 2016). In cardiomyocytes of NCS-1 KO mice, the overall respiration and mitochondrial biogenesis was reduced, accompanied by a decreased functional expression of mitochondrial proteins. This phenotype could be rescued by NCS-1 overexpression, similar as described for respective mitochondrial dysfunction in fibroblasts from Wolfram Syndrome patients (Angebault et al., 2018). Furthermore, a reduced UCP-mediated proton leak in response to oxidative stress, accompanied with elevated mitochondrial oxidant stress, was described for cardiomyocytes of NCS-1 KO mice (Nakamura et al., 2016) – in line with the lower UCP4 and UCP5 mRNA levels that we report here for SN DA neurons.
Transcriptional downregulation of ND1, ENO2, and Cav2.3 might reflect a compensatory response to reduce stressful activity, related Ca2+ load, and ATP synthesis in SN DA neurons in the absence of protective NCS-1. However, these theoretical considerations would need to be experimentally addressed.
On a wider note, cell-specific stimulation of NCS-1 function (Mansilla et al., 2017) might offer a novel therapeutic strategy for combating metabolic stress and neurodegeneration. However, given the ubiquitous expression of NCS-1 and its multiple, complex, and still not fully understood functions, manipulation of this intricate network should be considered with caution.
Ethics Statement
This study was carried out in accordance with the recommendations of the German Tierschutzgesetz, and the Regierungspräsidium Tübingen. The protocols were approved by the German Regierungspräsidium Tübingen (AZ 35/9185.81-3TV No. 1291, Reg. Nr. 0.147).
Author Contributions
CS, ND, and JB carried out the molecular biology experiments. JD, JB, and CP performed the in vivo retrograde tracing. JD and JB contributed the UV-LMD of adult mice. OP provided NCS-1 KO mice. TS provided Cav2.3 KO mice. BL designed the study. BL, JD, JB, and CS wrote the manuscript. All authors revised the manuscript.
Funding
This work was supported by the German DFG (Graduate Schools CEMMA and Molecular Medicine, and Li1754-1(1-3) to BL), the Austrian Science Fund (SFB F44-12 to BL), and the Alfried Krupp Foundation (to BL). CS was supported by the Medical Faculty of Ulm University, and the Excellence Initiative of the Federal and State Governments.
Conflict of Interest
The authors declare that the research was conducted in the absence of any commercial or financial relationships that could be construed as a potential conflict of interest.
Acknowledgments
We thank Desirée Spaich for training and excellent technical support.
Supplementary Material
The Supplementary Material for this article can be found online at: https://www.frontiersin.org/articles/10.3389/fnmol.2019.00252/full#supplementary-material
References
An, W. F., Bowlby, M. R., Betty, M., Cao, J., Ling, H. P., Mendoza, G., et al. (2000). Modulation of A-type potassium channels by a family of calcium sensors. Nature 403, 553–556. doi: 10.1038/35000592
Anderson, D., Engbers, J. D., Heath, N. C., Bartoletti, T. M., Mehaffey, W. H., Zamponi, G. W., et al. (2013). The Cav3-Kv4 complex acts as a calcium sensor to maintain inhibitory charge transfer during extracellular calcium fluctuations. J. Neurosci. 33, 7811–7824. doi: 10.1523/JNEUROSCI.5384-12.2013
Andrews, Z. B., Diano, S., and Horvath, T. L. (2005). Mitochondrial uncoupling proteins in the CNS: in support of function and survival. Nat. Rev. Neurosci. 6, 829–840. doi: 10.1038/nrn1767
Angebault, C., Fauconnier, J., Patergnani, S., Rieusset, J., Danese, A., Affortit, C. A., et al. (2018). ER-mitochondria cross-talk is regulated by the Ca2+ sensor NCS1 and is impaired in Wolfram syndrome. Sci. Signal. 11:eaaq1380. doi: 10.1126/scisignal.aaq1380
Bandura, J., and Feng, Z. P. (2019). Current understanding of the role of neuronal calcium sensor 1 in neurological disorders. Mol. Neurobiol. 56, 6080–6094. doi: 10.1007/s12035-019-1497-2
Barbado, M., Fablet, K., Ronjat, M., and De Waard, M. (2009). Gene regulation by voltage-dependent calcium channels. Biochim. Biophys. Acta 1793, 1096–1104. doi: 10.1016/j.bbamcr.2009.02.004
Bender, A., Krishnan, K. J., Morris, C. M., Taylor, G. A., Reeve, A. K., Perry, R. H., et al. (2006). High levels of mitochondrial DNA deletions in substantia nigra neurons in aging and Parkinson disease. Nat. Genet. 38, 515–517. doi: 10.1038/ng1769
Benkert, J., Hess, S., Roy, S., Beccano-Kelly, D., Wiederspohn, N., Duda, J., et al. (2019). Cav2.3 channels contribute to dopaminergic neuron loss in a model of Parkinson’s disease. Nat. Commun. 10:5094. doi: 10.1038/s41467-019-12834-x
Berridge, M. J. (1998). Neuronal calcium signaling. Neuron 21, 13–26. doi: 10.1016/s0896-6273(00)80510-3
Berridge, M. J., Lipp, P., and Bootman, M. D. (2000). The versatility and universality of calcium signalling. Nat. Rev. Mol. Cell Biol. 1, 11–21. doi: 10.1038/35036035
Biosa, A., Sandrelli, F., Beltramini, M., Greggio, E., Bubacco, L., and Bisaglia, M. (2017). Recent findings on the physiological function of DJ-1: beyond Parkinson’s disease. Neurobiol. Dis. 108, 65–72. doi: 10.1016/j.nbd.2017.08.005
Blauwendraat, C., Heilbron, K., Vallerga, C. L., Bandres-Ciga, S., von Coelln, R., Pihlstrom, L., et al. (2019). Parkinson’s disease age at onset genome-wide association study: defining heritability, genetic loci, and alpha-synuclein mechanisms. Mov. Disord. 34, 866–875. doi: 10.1002/mds.27659
Blesa, J., and Vila, M. (2019). Parkinson disease, substantia nigra vulnerability, and calbindin expression: enlightening the darkness? Mov. Disord. 34, 161–163. doi: 10.1002/mds.27618
Boeckel, G. R., and Ehrlich, B. E. (2018). NCS-1 is a regulator of calcium signaling in health and disease. Biochim. Biophys. Acta Mol. Cell Res. 1865, 1660–1667. doi: 10.1016/j.bbamcr.2018.05.005
Bonifati, V., Rizzu, P., van Baren, M. J., Schaap, O., Breedveld, G. J., Krieger, E., et al. (2003). Mutations in the DJ-1 gene associated with autosomal recessive early-onset parkinsonism. Science 299, 256–259. doi: 10.1126/science.1077209
Brini, M., Cali, T., Ottolini, D., and Carafoli, E. (2014). Neuronal calcium signaling: function and dysfunction. Cell Mol. Life. Sci. 71, 2787–2814. doi: 10.1007/s00018-013-1550-7
Burgoyne, R. D. (2007). Neuronal calcium sensor proteins: generating diversity in neuronal Ca2+ signalling. Nat. Rev. Neurosci. 8, 182–193. doi: 10.1038/nrn2093
Burgoyne, R. D., and Haynes, L. P. (2012). Understanding the physiological roles of the neuronal calcium sensor proteins. Mol. Brain 5:2. doi: 10.1186/1756-6606-5-2
Burgoyne, R. D., Helassa, N., McCue, H. V., and Haynes, L. P. (2019). Calcium sensors in neuronal function and dysfunction. Cold Spring Harb. Perspect. Biol. 11:a035154. doi: 10.1101/cshperspect.a035154
Cali, T., Ottolini, D., and Brini, M. (2013). Calcium and endoplasmic reticulum-mitochondria tethering in neurodegeneration. DNA Cell Biol. 32, 140–146. doi: 10.1089/dna.2013.2011
Carrion, A. M., Link, W. A., Ledo, F., Mellstrom, B., and Naranjo, J. R. (1999). DREAM is a Ca2+-regulated transcriptional repressor. Nature 398, 80–84. doi: 10.1038/18044
Catoni, C., Cali, T., and Brini, M. (2019). Calcium, dopamine and neuronal calcium sensor 1: their contribution to Parkinson’s Disease. Front. Mol. Neurosci. 12:55. doi: 10.3389/fnmol.2019.00055
Cherubini, M., and Wade-Martins, R. (2018). Convergent pathways in Parkinson’s disease. Cell Tissue Res. 373, 79–90. doi: 10.1007/s00441-017-2700-2
Choudhary, D., Kragelund, B. B., Heidarsson, P. O., and Cecconi, C. (2018). the complex conformational dynamics of neuronal calcium sensor-1: a single molecule perspective. Front. Mol. Neurosci. 11:468. doi: 10.3389/fnmol.2018.00468
Damier, P., Hirsch, E. C., Agid, Y., and Graybiel, A. M. (1999). The substantia nigra of the human brain. II. Patterns of loss of dopamine-containing neurons in Parkinson’s disease. Brain 122(Pt 8), 1437–1448.
de Rezende, V. B., Rosa, D. V., Comim, C. M., Magno, L. A., Rodrigues, A. L., Vidigal, P., et al. (2014). NCS-1 deficiency causes anxiety and depressive-like behavior with impaired non-aversive memory in mice. Physiol. Behav. 130, 91–98. doi: 10.1016/j.physbeh.2014.03.005
Deng, H., Wang, P., and Jankovic, J. (2018). The genetics of Parkinson disease. Ageing Res. Rev. 42, 72–85. doi: 10.1016/j.arr.2017.12.007
Dibue-Adjei, M., Kamp, M. A., Alpdogan, S., Tevoufouet, E. E., Neiss, W. F., Hescheler, J., et al. (2017). Cav2.3 (R-Type) calcium channels are critical for mediating anticonvulsive and neuroprotective properties of lamotrigine in vivo. Cell Physiol. Biochem. 44, 935–947. doi: 10.1159/000485361
Dopeso-Reyes, I. G., Rico, A. J., Roda, E., Sierra, S., Pignataro, D., Lanz, M., et al. (2014). Calbindin content and differential vulnerability of midbrain efferent dopaminergic neurons in macaques. Front. Neuroanat. 8:146. doi: 10.3389/fnana.2014.00146
Dragicevic, E., Poetschke, C., Duda, J., Schlaudraff, F., Lammel, S., Schiemann, J., et al. (2014). Cav1.3 channels control D2-autoreceptor responses via NCS-1 in substantia nigra dopamine neurons. Brain 137, 2287–2302. doi: 10.1093/brain/awu131
Dragicevic, E., Schiemann, J., and Liss, B. (2015). Dopamine midbrain neurons in health and Parkinson’s disease: emerging roles of voltage-gated calcium channels and ATP-sensitive potassium channels. Neuroscience 284, 798–814. doi: 10.1016/j.neuroscience.2014.10.037
Duda, J., Fauler, M., Grundemann, J., and Liss, B. (2018). Cell-Specific RNA quantification in human sn da neurons from heterogeneous post-mortem midbrain samples by UV-Laser microdissection and RT-qPCR. Methods Mol. Biol. 1723, 335–360. doi: 10.1007/978-1-4939-7558-7_19
Duda, J., Potschke, C., and Liss, B. (2016). Converging roles of ion channels, calcium, metabolic stress, and activity pattern of Substantia nigra dopaminergic neurons in health and Parkinson’s disease. J. Neurochem. 139(Suppl. 1), 156–178. doi: 10.1111/jnc.13572
Foehring, R. C., Zhang, X. F., Lee, J. C., and Callaway, J. C. (2009). Endogenous calcium buffering capacity of substantia nigral dopamine neurons. J. Neurophysiol. 102, 2326–2333. doi: 10.1152/jn.00038.2009
Giguere, N., Burke Nanni, S., and Trudeau, L. E. (2018). On cell loss and selective vulnerability of neuronal populations in Parkinson’s Disease. Front. Neurol. 9:455. doi: 10.3389/fneur.2018.00455
Gleichmann, M., and Mattson, M. P. (2011). Neuronal calcium homeostasis and dysregulation. Antioxid. Redox. Signal. 14, 1261–1273. doi: 10.1089/ars.2010.3386
Gomez-Ospina, N., Tsuruta, F., Barreto-Chang, O., Hu, L., and Dolmetsch, R. (2006). The C terminus of the L-type voltage-gated calcium channel Cav1.2 encodes a transcription factor. Cell 127, 591–606. doi: 10.1016/j.cell.2006.10.017
Gomez-Villafuertes, R., Torres, B., Barrio, J., Savignac, M., Gabellini, N., Rizzato, F., et al. (2005). Downstream regulatory element antagonist modulator regulates Ca2+ homeostasis and viability in cerebellar neurons. J. Neurosci. 25, 10822–10830. doi: 10.1523/jneurosci.3912-05.2005
Greer, P. L., and Greenberg, M. E. (2008). From synapse to nucleus: calcium-dependent gene transcription in the control of synapse development and function. Neuron 59, 846–860. doi: 10.1016/j.neuron.2008.09.002
Grundemann, J., Schlaudraff, F., and Liss, B. (2011). UV-laser microdissection and mRNA expression analysis of individual neurons from postmortem Parkinson’s disease brains. Methods Mol. Biol. 755, 363–374. doi: 10.1007/978-1-61779-163-5_30
Guo, W., Malin, S. A., Johns, D. C., Jeromin, A., and Nerbonne, J. M. (2002). Modulation of Kv4-encoded K(+) currents in the mammalian myocardium by neuronal calcium sensor-1. J. Biol. Chem. 277, 26436–26443. doi: 10.1074/jbc.m201431200
Guzman, J. N., Ilijic, E., Yang, B., Sanchez-Padilla, J., Wokosin, D., Galtieri, D., et al. (2018). Systemic isradipine treatment diminishes calcium-dependent mitochondrial oxidant stress. J. Clin. Invest. 128, 2266–2280. doi: 10.1172/JCI95898
Guzman, J. N., Sanchez-Padilla, J., Wokosin, D., Kondapalli, J., Ilijic, E., Schumacker, P. T., et al. (2010). Oxidant stress evoked by pacemaking in dopaminergic neurons is attenuated by DJ-1. Nature 468, 696–700. doi: 10.1038/nature09536
Hamasaki-Katagiri, N., and Ames, J. B. (2010). Neuronal calcium sensor-1 (Ncs1p) is up-regulated by calcineurin to promote Ca2+ tolerance in fission yeast. J. Biol. Chem. 285, 4405–4414. doi: 10.1074/jbc.M109.058594
Heine, M., Heck, J., Ciuraszkiewicz, A., and Bikbaev, A. (2019). Dynamic compartmentalization of calcium channel signalling in neurons. Neuropharmacology [Epub ahead of print].
Hoang, T., Smith, M. D., and Jelokhani-Niaraki, M. (2012). Toward understanding the mechanism of ion transport activity of neuronal uncoupling proteins UCP2, UCP4, and UCP5. Biochemistry 51, 4004–4014. doi: 10.1021/bi3003378
Iyer, R., Ungless, M. A., and Faisal, A. A. (2017). Calcium-activated SK channels control firing regularity by modulating sodium channel availability in midbrain dopamine neurons. Sci. Rep. 7:5248. doi: 10.1038/s41598-017-05578-5
Jing, X., Li, D. Q., Olofsson, C. S., Salehi, A., Surve, V. V., Caballero, J., et al. (2005). Cav2.3 calcium channels control second-phase insulin release. J. Clin. Invest. 115, 146–154. doi: 10.1172/jci22518
Kabbani, N., Negyessy, L., Lin, R., Goldman-Rakic, P., and Levenson, R. (2002). Interaction with neuronal calcium sensor NCS-1 mediates desensitization of the D2 dopamine receptor. J. Neurosci. 22, 8476–8486. doi: 10.1523/jneurosci.22-19-08476.2002
Kabbani, N., Woll, M. P., Nordman, J. C., and Levenson, R. (2012). Dopamine receptor interacting proteins: targeting neuronal calcium sensor-1/D2 dopamine receptor interaction for antipsychotic drug development. Curr. Drug Targets 13, 72–79. doi: 10.2174/138945012798868515
Koh, P. O., Undie, A. S., Kabbani, N., Levenson, R., Goldman-Rakic, P. S., and Lidow, M. S. (2003). Up-regulation of neuronal calcium sensor-1 (NCS-1) in the prefrontal cortex of schizophrenic and bipolar patients. Proc. Natl. Acad. Sci. U.S.A. 100, 313–317. doi: 10.1073/pnas.232693499
Krabbe, S., Duda, J., Schiemann, J., Poetschke, C., Schneider, G., Kandel, E. R., et al. (2015). Increased dopamine D2 receptor activity in the striatum alters the firing pattern of dopamine neurons in the ventral tegmental area. Proc. Natl. Acad. Sci. U.S.A. 112, E1498–E1506. doi: 10.1073/pnas.1500450112
La Rovere, R. M., Roest, G., Bultynck, G., and Parys, J. B. (2016). Intracellular Ca2+ signaling and Ca2+ microdomains in the control of cell survival, apoptosis and autophagy. Cell Calcium 60, 74–87. doi: 10.1016/j.ceca.2016.04.005
Lammel, S., Hetzel, A., Hackel, O., Jones, I., Liss, B., and Roeper, J. (2008). Unique properties of mesoprefrontal neurons within a dual mesocorticolimbic dopamine system. Neuron 57, 760–773. doi: 10.1016/j.neuron.2008.01.022
Lee, K. S., Huh, S., Lee, S., Wu, Z., Kim, A. K., Kang, H. Y., et al. (2018). Altered ER-mitochondria contact impacts mitochondria calcium homeostasis and contributes to neurodegeneration in vivo in disease models. Proc. Natl. Acad. Sci. U.S.A. 115, E8844–E8853. doi: 10.1073/pnas.1721136115
Liss, B. (2002). Improved quantitative real-time RT-PCR for expression profiling of individual cells. Nucleic Acids Res. 30:e89.
Liss, B., Franz, O., Sewing, S., Bruns, R., Neuhoff, H., and Roeper, J. (2001). Tuning pacemaker frequency of individual dopaminergic neurons by Kv4.3L and KChip3.1 transcription. EMBO J. 20, 5715–5724. doi: 10.1093/emboj/20.20.5715
Liss, B., Haeckel, O., Wildmann, J., Miki, T., Seino, S., and Roeper, J. (2005). K-ATP channels promote the differential degeneration of dopaminergic midbrain neurons. Nat. Neurosci. 8, 1742–1751. doi: 10.1038/nn1570
Liss, B., and Striessnig, J. (2019). The potential of L-type calcium channels as a drug target for neuroprotective therapy in Parkinson’s disease. Annu. Rev. Pharmacol. Toxicol. 59, 263–289. doi: 10.1146/annurev-pharmtox-010818-021214
Mansilla, A., Chaves-Sanjuan, A., Campillo, N. E., Semelidou, O., Martinez-Gonzalez, L., Infantes, L., et al. (2017). Interference of the complex between NCS-1 and Ric8a with phenothiazines regulates synaptic function and is an approach for fragile X syndrome. Proc. Natl. Acad. Sci. U.S.A. 114, E999–E1008. doi: 10.1073/pnas.1611089114
Mellstrom, B., and Naranjo, J. R. (2001). Ca2+-dependent transcriptional repression and derepression: DREAM, a direct effector. Semin. Cell Dev. Biol. 12, 59–63. doi: 10.1006/scdb.2000.0218
Mellstrom, B., Sahun, I., Ruiz-Nuno, A., Murtra, P., Gomez-Villafuertes, R., Savignac, M., et al. (2014). DREAM controls the on/off switch of specific activity-dependent transcription pathways. Mol. Cell. Biol. 34, 877–887. doi: 10.1128/MCB.00360-13
Michel, P. P., Hirsch, E. C., and Hunot, S. (2016). Understanding dopaminergic cell death pathways in parkinson disease. Neuron 90, 675–691. doi: 10.1016/j.neuron.2016.03.038
Muhling, T., Duda, J., Weishaupt, J. H., Ludolph, A. C., and Liss, B. (2014). Elevated mRNA levels of distinct mitochondrial and plasma membrane Ca2+ transporters in individual hypoglossal motor neurons of endstage SOD1 transgenic mice. Front. Cell Neurosci. 8:353. doi: 10.3389/fncel.2014.00353
Nakamura, T. Y., Jeromin, A., Mikoshiba, K., and Wakabayashi, S. (2011). Neuronal calcium sensor-1 promotes immature heart function and hypertrophy by enhancing Ca2+ signals. Circ. Res. 109, 512–523. doi: 10.1161/CIRCRESAHA.111.248864
Nakamura, T. Y., Jeromin, A., Smith, G., Kurushima, H., Koga, H., Nakabeppu, Y., et al. (2006). Novel role of neuronal Ca2+ sensor-1 as a survival factor up-regulated in injured neurons. J. Cell Biol. 172, 1081–1091. doi: 10.1083/jcb.200508156
Nakamura, T. Y., Nakao, S., and Wakabayashi, S. (2016). Neuronal Ca2+ sensor-1 contributes to stress tolerance in cardiomyocytes via activation of mitochondrial detoxification pathways. J. Mol. Cell Cardiol. 99, 23–34. doi: 10.1016/j.yjmcc.2016.08.013
Nakamura, T. Y., Nakao, S., and Wakabayashi, S. (2019). Emerging roles of neuronal ca2+ sensor-1 in cardiac and neuronal tissues: a mini review. Front. Mol. Neurosci. 12:56. doi: 10.3389/fnmol.2019.00056
Nakamura, T. Y., Pountney, D. J., Ozaita, A., Nandi, S., Ueda, S., Rudy, B., et al. (2001). A role for frequenin, a Ca2+-binding protein, as a regulator of Kv4 K+-currents. Proc. Natl. Acad. Sci. U.S.A. 98, 12808–12813. doi: 10.1073/pnas.221168498
Nakao, S., Wakabayashi, S., and Nakamura, T. Y. (2015). Stimulus-dependent regulation of nuclear Ca2+ signaling in cardiomyocytes: a role of neuronal calcium sensor-1. PLoS One 10:e0125050. doi: 10.1371/journal.pone.0125050
Naranjo, J. R., and Mellstrom, B. (2012). Ca2+-dependent transcriptional control of Ca homeostasis. J. Biol. Chem. 287, 31674–31680. doi: 10.1074/jbc.R112.384982
Ng, E., Varaschin, R. K., Su, P., Browne, C. J., Hermainski, J., Le Foll, B., et al. (2016). Neuronal calcium sensor-1 deletion in the mouse decreases motivation and dopamine release in the nucleus accumbens. Behav. Brain Res. 301, 213–225. doi: 10.1016/j.bbr.2015.12.037
Obeso, J. A., Stamelou, M., Goetz, C. G., Poewe, W., Lang, A. E., Weintraub, D., et al. (2017). Past, present, and future of Parkinson’s disease: a special essay on the 200th anniversary of the shaking palsy. Mov. Disord. 32, 1264–1310. doi: 10.1002/mds.27115
O’Callaghan, D. W., Ivings, L., Weiss, J. L., Ashby, M. C., Tepikin, A. V., and Burgoyne, R. D. (2002). Differential use of myristoyl groups on neuronal calcium sensor proteins as a determinant of spatio-temporal aspects of Ca2+ signal transduction. J. Biol. Chem. 277, 14227–14237. doi: 10.1074/jbc.m111750200
Pacelli, C., Giguere, N., Bourque, M. J., Levesque, M., Slack, R. S., and Trudeau, L. E. (2015). Elevated mitochondrial bioenergetics and axonal arborization size are key contributors to the vulnerability of dopamine neurons. Curr. Biol. 25, 2349–2360. doi: 10.1016/j.cub.2015.07.050
Pandalaneni, S., Karuppiah, V., Saleem, M., Haynes, L. P., Burgoyne, R. D., Mayans, O., et al. (2015). Neuronal calcium sensor-1 binds the D2 dopamine receptor and g-protein-coupled receptor kinase 1 (GRK1) peptides using different modes of interactions. J. Biol. Chem. 290, 18744–18756. doi: 10.1074/jbc.M114.627059
Paxinos, G., and Franklin, K. (2013). The Mouse Brain in Stereotaxic Coordinates, 2nd Edn, Cambridge, MA: Academic Press.
Pereverzev, A., Salehi, A., Mikhna, M., Renstrom, E., Hescheler, J., Weiergraber, M., et al. (2005). The ablation of the Cav2.3/E-type voltage-gated Ca2+ channel causes a mild phenotype despite an altered glucose induced glucagon response in isolated islets of Langerhans. Eur. J. Pharmacol. 511, 65–72. doi: 10.1016/j.ejphar.2005.01.044
Petko, J. A., Kabbani, N., Frey, C., Woll, M., Hickey, K., Craig, M., et al. (2009). Proteomic and functional analysis of NCS-1 binding proteins reveals novel signaling pathways required for inner ear development in zebrafish. BMC Neurosci. 10:27. doi: 10.1186/1471-2202-10-27
Pinato, G., Pegoraro, S., Iacono, G., Ruaro, M. E., and Torre, V. (2009). Calcium control of gene regulation in rat hippocampal neuronal cultures. J. Cell. Physiol. 220, 727–747. doi: 10.1002/jcp.21820
Pissadaki, E. K., and Bolam, J. P. (2013). The energy cost of action potential propagation in dopamine neurons: clues to susceptibility in Parkinson’s disease. Front. Comput. Neurosci. 7:13. doi: 10.3389/fncom.2013.00013
Poetschke, C., Dragicevic, E., Duda, J., Benkert, J., Dougalis, A., DeZio, R., et al. (2015). Compensatory T-type Ca2+ channel activity alters D2-autoreceptor responses of Substantia nigra dopamine neurons from Cav1.3 L-type Ca2+ channel KO mice. Sci. Rep. 5:13688. doi: 10.1038/srep13688
Pongs, O., Lindemeier, J., Zhu, X. R., Theil, T., Engelkamp, D., Krah-Jentgens, I., et al. (1993). Frequenin–a novel calcium-binding protein that modulates synaptic efficacy in the Drosophila nervous system. Neuron 11, 15–28. doi: 10.1016/0896-6273(93)90267-u
Ratai, O., Hermainski, J., Ravichandran, K., and Pongs, O. (2019). NCS-1 deficiency is Associated with obesity and diabetes type 2 in mice. Front. Mol. Neurosci. 12:78. doi: 10.3389/fnmol.2019.00078
Robinson, B. G., Condon, A. F., Radl, D., Borrelli, E., Williams, J. T., and Neve, K. A. (2017). Cocaine-induced adaptation of dopamine D2S, but not D2L autoreceptors. eLife 6:e31924. doi: 10.7554/eLife.31924
Schlaudraff, F., Grundemann, J., Fauler, M., Dragicevic, E., Hardy, J., and Liss, B. (2014). Orchestrated increase of dopamine and PARK mRNAs but not miR-133b in dopamine neurons in Parkinson’s disease. Neurobiol. Aging 35, 2302–2315. doi: 10.1016/j.neurobiolaging.2014.03.016
Schulz, J. B., Hausmann, L., and Hardy, J. (2016). 199 years of Parkinson disease - what have we learned and what is the path to the future? J. Neurochem. 139(Suppl. 1), 3–7. doi: 10.1111/jnc.13733
Souza, B. R., Torres, K. C., Miranda, D. M., Motta, B. S., Caetano, F. S., Rosa, D. V., et al. (2011). Downregulation of the cAMP/PKA pathway in PC12 cells overexpressing NCS-1. Cell Mol. Neurobiol. 31, 135–143. doi: 10.1007/s10571-010-9562-4
Subramaniam, M., Althof, D., Gispert, S., Schwenk, J., Auburger, G., Kulik, A., et al. (2014). Mutant alpha-synuclein enhances firing frequencies in dopamine substantia nigra neurons by oxidative impairment of A-type potassium channels. J. Neurosci. 34, 13586–13599. doi: 10.1523/JNEUROSCI.5069-13.2014
Surmeier, D. J., Halliday, G. M., and Simuni, T. (2017a). Calcium, mitochondrial dysfunction and slowing the progression of Parkinson’s disease. Exp. Neurol. 298, 202–209. doi: 10.1016/j.expneurol.2017.08.001
Surmeier, D. J., Obeso, J. A., and Halliday, G. M. (2017b). Parkinson’s disease is not simply a prion disorder. J. Neurosci. 37, 9799–9807. doi: 10.1523/jneurosci.1787-16.2017
Tabata, Y., Imaizumi, Y., Sugawara, M., Andoh-Noda, T., Banno, S., Chai, M., et al. (2018). T-type calcium channels determine the vulnerability of dopaminergic neurons to mitochondrial stress in familial Parkinson disease. Stem Cell Rep. 11, 1171–1184. doi: 10.1016/j.stemcr.2018.09.006
Takahashi-Niki, K., Niki, T., Iguchi-Ariga, S. M. M., and Ariga, H. (2017). Transcriptional regulation of DJ-1. Adv. Exp. Med. Biol. 1037, 89–95. doi: 10.1007/978-981-10-6583-5_7
Tsujimoto, T., Jeromin, A., Saitoh, N., Roder, J. C., and Takahashi, T. (2002). Neuronal calcium sensor 1 and activity-dependent facilitation of P/Q-type calcium currents at presynaptic nerve terminals. Science 295, 2276–2279. doi: 10.1126/science.1068278
van der Brug, M. P., Singleton, A., Gasser, T., and Lewis, P. A. (2015). Parkinson’s disease: from human genetics to clinical trials. Sci. Transl. Med. 7:205.
Weiergraber, M., Henry, M., Radhakrishnan, K., Hescheler, J., and Schneider, T. (2007). Hippocampal seizure resistance and reduced neuronal excitotoxicity in mice lacking the Cav2.3 E/R-type voltage-gated calcium channel. J. Neurophysiol. 97, 3660–3669. doi: 10.1152/jn.01193.2006
Weiergraber, M., Henry, M., Sudkamp, M., de Vivie, E. R., Hescheler, J., and Schneider, T. (2005). Ablation of Cav2.3/E-type voltage-gated calcium channel results in cardiac arrhythmia and altered autonomic control within the murine cardiovascular system. Basic Res. Cardiol. 100, 1–13. doi: 10.1007/s00395-004-0488-1
Weiergraber, M., Kamp, M. A., Radhakrishnan, K., Hescheler, J., and Schneider, T. (2006). The Cav2.3 voltage-gated calcium channel in epileptogenesis–shedding new light on an enigmatic channel. Neurosci. Biobehav. Rev. 30, 1122–1144. doi: 10.1016/j.neubiorev.2006.07.004
Weiergraber, M., Stephani, U., and Kohling, R. (2010). Voltage-gated calcium channels in the etiopathogenesis and treatment of absence epilepsy. Brain Res. Rev. 62, 245–271. doi: 10.1016/j.brainresrev.2009.12.005
Weiss, J. L., Hui, H., and Burgoyne, R. D. (2010). Neuronal calcium sensor-1 regulation of calcium channels, secretion, and neuronal outgrowth. Cell Mol. Neurobiol. 30, 1283–1292. doi: 10.1007/s10571-010-9588-7
Wennemuth, G., Westenbroek, R. E., Xu, T., Hille, B., and Babcock, D. F. (2000). Cav2.2 and Cav2.3 (N- and R-type) Ca2+ channels in depolarization-evoked entry of Ca2+ into mouse sperm. J. Biol. Chem. 275, 21210–21217. doi: 10.1074/jbc.m002068200
West, A. E., Chen, W. G., Dalva, M. B., Dolmetsch, R. E., Kornhauser, J. M., Shaywitz, A. J., et al. (2001). Calcium regulation of neuronal gene expression. Proc. Natl. Acad. Sci. U.S.A. 98, 11024–11031.
Wolfart, J., Neuhoff, H., Franz, O., and Roeper, J. (2001). Differential expression of the small-conductance, calcium-activated potassium channel SK3 is critical for pacemaker control in dopaminergic midbrain neurons. J. Neurosci. 21, 3443–3456. doi: 10.1523/jneurosci.21-10-03443.2001
Xu, J., Zhong, N., Wang, H., Elias, J. E., Kim, C. Y., Woldman, I., et al. (2005). The Parkinson’s disease-associated DJ-1 protein is a transcriptional co-activator that protects against neuronal apoptosis. Hum. Mol. Genet. 14, 1231–1241. doi: 10.1093/hmg/ddi134
Xu, S., Yang, X., Qian, Y., and Xiao, Q. (2018). Parkinson’s disease-related DJ-1 modulates the expression of uncoupling protein 4 against oxidative stress. J. Neurochem. 145, 312–322. doi: 10.1111/jnc.14297
Zaichick, S. V., McGrath, K. M., and Caraveo, G. (2017). The role of Ca2+ signaling in Parkinson’s disease. Dis. Model. Mech. 10, 519–535. doi: 10.1242/dmm.028738
Keywords: ND1, ENO2, Parkinson’s disease, mitochondrial uncoupling proteins, voltage-gated calcium channels, Cav2.3, KChip3/DREAM/Calsenilin, DJ-1/PARK7
Citation: Simons C, Benkert J, Deuter N, Poetschke C, Pongs O, Schneider T, Duda J and Liss B (2019) NCS-1 Deficiency Affects mRNA Levels of Genes Involved in Regulation of ATP Synthesis and Mitochondrial Stress in Highly Vulnerable Substantia nigra Dopaminergic Neurons. Front. Mol. Neurosci. 12:252. doi: 10.3389/fnmol.2019.00252
Received: 20 December 2018; Accepted: 27 September 2019;
Published: 27 November 2019.
Edited by:
Daniele Dell’Orco, University of Verona, ItalyReviewed by:
Tomoe Y. Nakamura, National Cerebral and Cardiovascular Center, JapanMarisa Brini, University of Padova, Italy
Copyright © 2019 Simons, Benkert, Deuter, Poetschke, Pongs, Schneider, Duda and Liss. This is an open-access article distributed under the terms of the Creative Commons Attribution License (CC BY). The use, distribution or reproduction in other forums is permitted, provided the original author(s) and the copyright owner(s) are credited and that the original publication in this journal is cited, in accordance with accepted academic practice. No use, distribution or reproduction is permitted which does not comply with these terms.
*Correspondence: Birgit Liss, birgit.liss@uni-ulm.de
†These authors have contributed equally to this work