A Topological Cluster of Differentially Regulated Genes in Mice Lacking PER3
 Daan R. Van der Veen1
  Emma E. Laing1
  Sung-Eun Bae1
  Jonathan D. Johnston1
  Derk-Jan Dijk1,2
  Simon N. Archer1*
- 1School of Biosciences and Medicine, Faculty of Health and Medical Sciences, University of Surrey, Guildford, United Kingdom
- 2UK Dementia Research Institute, London, United Kingdom
Polymorphisms in the human circadian clock gene PERIOD3 (PER3) are associated with a wide variety of phenotypes such as diurnal preference, delayed sleep phase disorder, sleep homeostasis, cognitive performance, bipolar disorder, type 2 diabetes, cardiac regulation, cancer, light sensitivity, hormone and cytokine secretion, and addiction. However, the molecular mechanisms underlying these phenotypic associations remain unknown. Per3 knockout mice (Per3–/–) have phenotypes related to activity, sleep homeostasis, anhedonia, metabolism, and behavioral responses to light. Using a protocol that induces behavioral differences in response to light in wild type and Per3–/– mice, we compared genome-wide expression in the eye and hypothalamus in the two genotypes. Differentially expressed transcripts were related to inflammation, taste, olfactory and melatonin receptors, lipid metabolism, cell cycle, ubiquitination, and hormones, as well as receptors and channels related to sleep regulation. Differentially expressed transcripts in both tissues co-localized with Per3 on an ∼8Mbp region of distal chromosome 4. The most down-regulated transcript is Prdm16, which is involved in adipocyte differentiation and may mediate altered body mass accumulation in Per3–/– mice. eQTL analysis with BXD mouse strains showed that the expression of some of these transcripts and also others co-localized at distal chromosome 4, is correlated with brain tissue expression levels of Per3 with a highly significant linkage to genetic variation in that region. These data identify a cluster of transcripts on mouse distal chromosome 4 that are co-regulated with Per3 and whose expression levels correlate with those of Per3. This locus lies within a topologically associating domain island that contains many genes with functional links to several of the diverse non-circadian phenotypes associated with polymorphisms in human PER3.
Introduction
The circadian timing system defines biological timing and its synchronization to the environmental 24-h light/dark cycle. The central pacemaker in the suprachiasmatic nuclei (SCN) of the hypothalamus entrains to environmental cues and synchronizes peripheral clocks in tissues and organs to regulate 24-h rhythms in physiology and behavior. A set of highly conserved circadian clock genes and their products interact in the molecular feedback loops that determine circadian clock function (Archer and Oster, 2015).
The Period3 (Per3) gene is a component of the circadian clock. Its presence is not required for central circadian clock function, although absence of PER3 in mice has subtle effects on the circadian period of locomotor activity, and larger effects on the period of circadian gene expression in ex vivo dissociated SCN cells and peripheral organ cell cultures (Shearman et al., 2000; Bae et al., 2001; Pendergast et al., 2012; Ramanathan et al., 2014). Absence of functional PER3 protein in Per3 knock out mice (Per3–/–) has also been associated with reduced inhibition by light of locomotor activity (negative masking), and changes in the overall amount of locomotor activity and sleep homeostasis (van der Veen and Archer, 2010; Hasan et al., 2011).
We have shown that a primate-specific, variable number, tandem repeat (VNTR), coding region polymorphism in human PER3 is associated with diurnal preference, delayed sleep phase disorder, sleep homeostasis, increased body mass index (BMI) in people who sleep late during work days, cognitive performance, fMRI-assessed brain activity, lower intelligence in people with long sleep duration during work days, and cardiac regulation (Archer et al., 2003; Viola et al., 2007, 2012; Groeger et al., 2008; Vandewalle et al., 2009, 2011; Lazar et al., 2012; Lo et al., 2012). Others have reported associations with bipolar disorder (Benedetti et al., 2008), schizophrenia (Karthikeyan et al., 2014a), white matter integrity (Bollettini et al., 2017), type 2 diabetes (Karthikeyan et al., 2014b), cancer (Alexander et al., 2015), light sensitivity (Chellappa et al., 2012), hormone secretion (Wirth et al., 2013), cytokine secretion (Guess et al., 2009), and addiction (Zou et al., 2008). In addition, we have also shown that transgenically humanizing mouse Per3 with the VNTR polymorphism phenocopies some aspects of human sleep homeostasis such as increased theta power during wake and delta power during sleep (Hasan et al., 2014). Thus, PER3 is associated with a wide range of phenotypes, but the molecular mechanisms underlying these pleiotropic effects remain unknown.
Because Per3 is a circadian clock gene that has been associated with light-dependent phenotypes, here we characterized differential gene expression between wild type and Per3–/– mice in hypothalamic and whole eye tissue during an ultradian light/dark protocol that produced different behavioral responses in the genotypes. Many transcripts that were differentially expressed in Per3–/– mice localized to a cluster of genes around Per3 on distal chromosome 4. Expression quantitative trait loci (eQTL) analyses identified strong linkage between Per3 expression and genetic variation within the same distal chromosome 4 cluster and high correlation between Per3 expression and the expression of genes within the cluster. Differentially expressed transcripts were related to non-circadian functions including sleep homeostasis and identify genetic targets that might underlie some of the diverse phenotypes associated with PER3.
Materials and Methods
Animals
Male Period3 knockout mice (Per3–/–) (Shearman et al., 2000) and their wild-type (WT) litter mates on a C57Bl/6J background were bred at the University of Surrey, as described previously (van der Veen and Archer, 2010). Genotyping was performed as previously described (Shearman et al., 2000). Throughout all experiments, mice were kept under controlled environmental conditions [20–22°C ambient temperature, 55 ± 10% relative humidity, light intensity at cage bottom was ∼170 mW/m2 (∼50 lux)]. All experimental procedures were approved by the University of Surrey Animal Ethics Committee and carried out under a United Kingdom Home Office License.
Animal Experiments
To investigate differential gene expression between WT and Per3–/– mice, animals were subjected to an ultradian light/dark paradigm that we have previously published (van der Veen and Archer, 2010). Male, adult WT and Per3–/– mice [N = 8 per genotype, age = 66.0 ± 3.4 days (mean ± SEM)] were individually housed in running wheel cages in a 12 h light/12 h dark cycle (LD 12:12) for 10 days. Mice were subsequently exposed to 17 cycles of an LD 3.5:3.5 starting at lights-on on day 11. In the second hour of the last ultradian light cycle, mice were killed by cervical dislocation and tissue (brain and whole eye) was collected in RNAlater stabilization reagent (Qiagen, United Kingdom) and frozen at −80°C until further analysis. Running wheel data were collected throughout the experiment (ClockLab, Actimetrics, Wilmette, IL, United States) and used to confirm previously observed significant attenuation of behavioral suppression by light in Per3–/– mice (van der Veen and Archer, 2010).
To investigate genotype differences in body mass accumulation, normal diet-fed male WT and Per3–/– mice were individually housed under LD 12:12 at 4 weeks of age [28.0 ± 0.9 days (mean ± SEM)] and switched to either a 10 kcal% (control) or 45 kcal% (high) fat diet (D12450B and D12451, respectively, Research Diets, Inc., NJ, United States). The LD 12:12 cycle was advanced by 4 h every 7 days (Davidson et al., 2006), and this protocol was continued for 14 weeks. Body mass and food consumption was established twice per week (N = 8 per genotype, per diet). Body mass data for two WT mice on high fat diet was removed from the analysis due to instability of body mass during the protocol. Data was statistically tested using Proc MIXED in SAS (Cary, NC, United States).
Tissue Specific Differential Gene Expression
The whole-genome transcriptome was quantified by microarrays as previously described (Hasan et al., 2014). In short, for both Per3–/– and WT mice (N = 8 per genotype) mRNA was purified from a frozen block of hypothalamic tissue and whole eye using the RNeasy Mini Kit (Qiagen, United Kingdom). Hypothalamic blocks were prepared by placing the frozen brain on ice, and then ventral to dorsal cutting a square (∼2 × 2 mm) boxed around the optic chiasm in the horizontal plane [starting at 0.02 mm caudal to Bregma in Paxinos and Franklin (2001)], trimmed to a depth of ∼2 mm. This block included the SCN of the hypothalamus. RNA quantity was measured spectrophotometrically (Nanodrop, Thermo Fisher Scientific, Waltham, MA, United States) and integrity was quality controlled using an Agilent Bioanalyzer (Agilent Technologies United Kingdom Limited, United Kingdom). RNA was used to prepare labeled cRNA, which was hybridized to Agilent Whole Mouse Genome slides (60 mer, 4 × 44K features), and array features were extracted using Agilent Feature Extraction Software (Agilent Technologies). The results of these array data have been made publically available at the NCBI Gene Expression Omnibus database. Expression levels were analyzed using GeneSpring version 12 (Agilent Technologies). Differential expression of probes and genes was quantified both as the fold change expression between genotypes, and significantly differential expression between genotypes were identified using unpaired T-Tests with an asymptotic P-value computation with Benjamini–Hochberg correction for multiple testing. As a second approach to identify differential gene expression between WT and Per3–/– mice, we applied the RankProdIt analysis, as described previously (Laing and Smith, 2010). One sample for Per3–/– whole eye was removed due to hybridization errors.
Quantitative PCR
Male, adult WT and Per3–/– mice [N = 8 per genotype, age = 65.0 ± 1.6 days (mean ± SEM)] were individually housed in running wheel cages in an LD 12:12 for 19 days, after which they were exposed to constant darkness. On the second day of constant darkness (DD), three mice per genotype were culled every 4 h at circadian time (CT) 0, 4, 8, 12, 16, and 20 (CT0 = time of previous lights on). Mice were killed by cervical dislocation and tissues were harvested in RNAlater stabilization reagent (Qiagen, United Kingdom) and frozen at −80°C until further analysis. RNA was extracted using the RNeasy Mini Kit (Qiagen, Hilden, Germany) according to the manufacturer’s instructions. For each sample, the relative levels of expression of Prdm16 and housekeeping gene large ribosomal protein subunit P0 (Rplp0) were measured using Taqman qPCR and quantified using the delta delta CT method. The qPCR primers and probe for each gene are shown in Supplementary Table S1.
Expression Quantitative Trait Loci Analyses
eQTL were computed with the use of GeneNetwork1 (Mulligan et al., 2017). In GeneNetwork there are six record ID options to select that target different regions of Per3 mRNA. Gene Network recommends selecting a record ID that targets an exonic region so for the analyses presented here, we selected record 1421086_at, which targets the last three exons and proximal 3′ UTR of Per3. eQTLs for Per3 in the mouse BXD RI family were mapped for Brain mRNA [UCHSC BXD Whole Brain M430 2.0 (Nov06) RMA (Saba et al., 2006)], Eye mRNA [Eye M430v2 (Sep08) RMA], and Liver mRNA [GSE16780 UCLA Hybrid MDP Liver Affy HT M430A (Sep11) RMA (Bennett et al., 2010)]. Using the GeneNetwork mapping tool, we computed the likelihood ratio statistics (LRS score) for 1421086_at using interval mapping (1000 permutations). We next computed the sample correlations to establish the top 500 correlated (Pearson’s R) expression regions of 1421086_at for the eye mRNA dataset, and the chromosomal locations of the their maximal LRS locations. We established the gene location of the specific transcripts that have a maximal LRS in one of five chromosomal regions with maximal LRS counts > 50, and for each of the five groups calculated whether the number of linked genes per chromosome were more, or less than expected: Expected per chromosome = (# genes chromosome/# genes genome) × # genes in cluster; Fraction of expected = (observed per chromosome/expected per chromosome) − 1.
Bioinformatics
Gene ontology (GO) enrichment for biological processes and molecular functions associated with gene expression data was performed using Webgestalt 2019 (Zhang et al., 2005; Liao et al., 2019). We performed over representation analysis with the geneontology database using mouse gene symbol annotation and the mouse genome as a reference. P values were Benjamini–Hochberg corrected and a false discovery rate (FDR) of <0.05 was used to select significant terms. Gene/protein interaction networks for differentially expressed genes were generated using STRING v11 with the confidence of interaction set to “high.” Unconnected nodes in the generated networks were not displayed. For the topologically associating domain (TAD) analysis, we used the Hi-C browser at Penn State University2. Mouse assembly mm9 was used together with mouse cortex Hi-C data (Dixon et al., 2012) at a resolution of 40 kb.
Results
Differential Gene Expression in the Eye and Hypothalamus of Per3–/– Mice
To investigate the contribution of Per3 to molecular pathways that could underlie some of its diverse associated phenotypes, we performed transcriptomic analysis of hypothalamic and whole eye tissue from WT and Per3–/– mice. When mice are exposed to light during their active dark period, they reduce locomotor activity (negative masking) and we have previously shown reduced negative masking in Per3–/– mice compared to WT when exposed to an ultradian light/dark protocol (3.5 h light/3.5 h dark) (van der Veen and Archer, 2010). We therefore collected tissue samples from mice on the same ultradian protocol. Mice were kept on an LD 12:12 cycle for 10 days and then exposed to 17 cycles of LD 3.5:3.5. Tissues for transcriptomics were collected during the 17th ultradian light cycle, which corresponded to the prior circadian mid-active phase, a time when we previously saw the greatest behavioral difference between genotypes (Figure 1A). Analysis of wheel-running activity during the ultradian protocol (Figure 1B) confirmed our previous observation of reduced suppression of activity in Per3–/– mice during the ultradian light periods compared with WT (P < 0.001 for genotype∗time, post hoc P < 0.05).
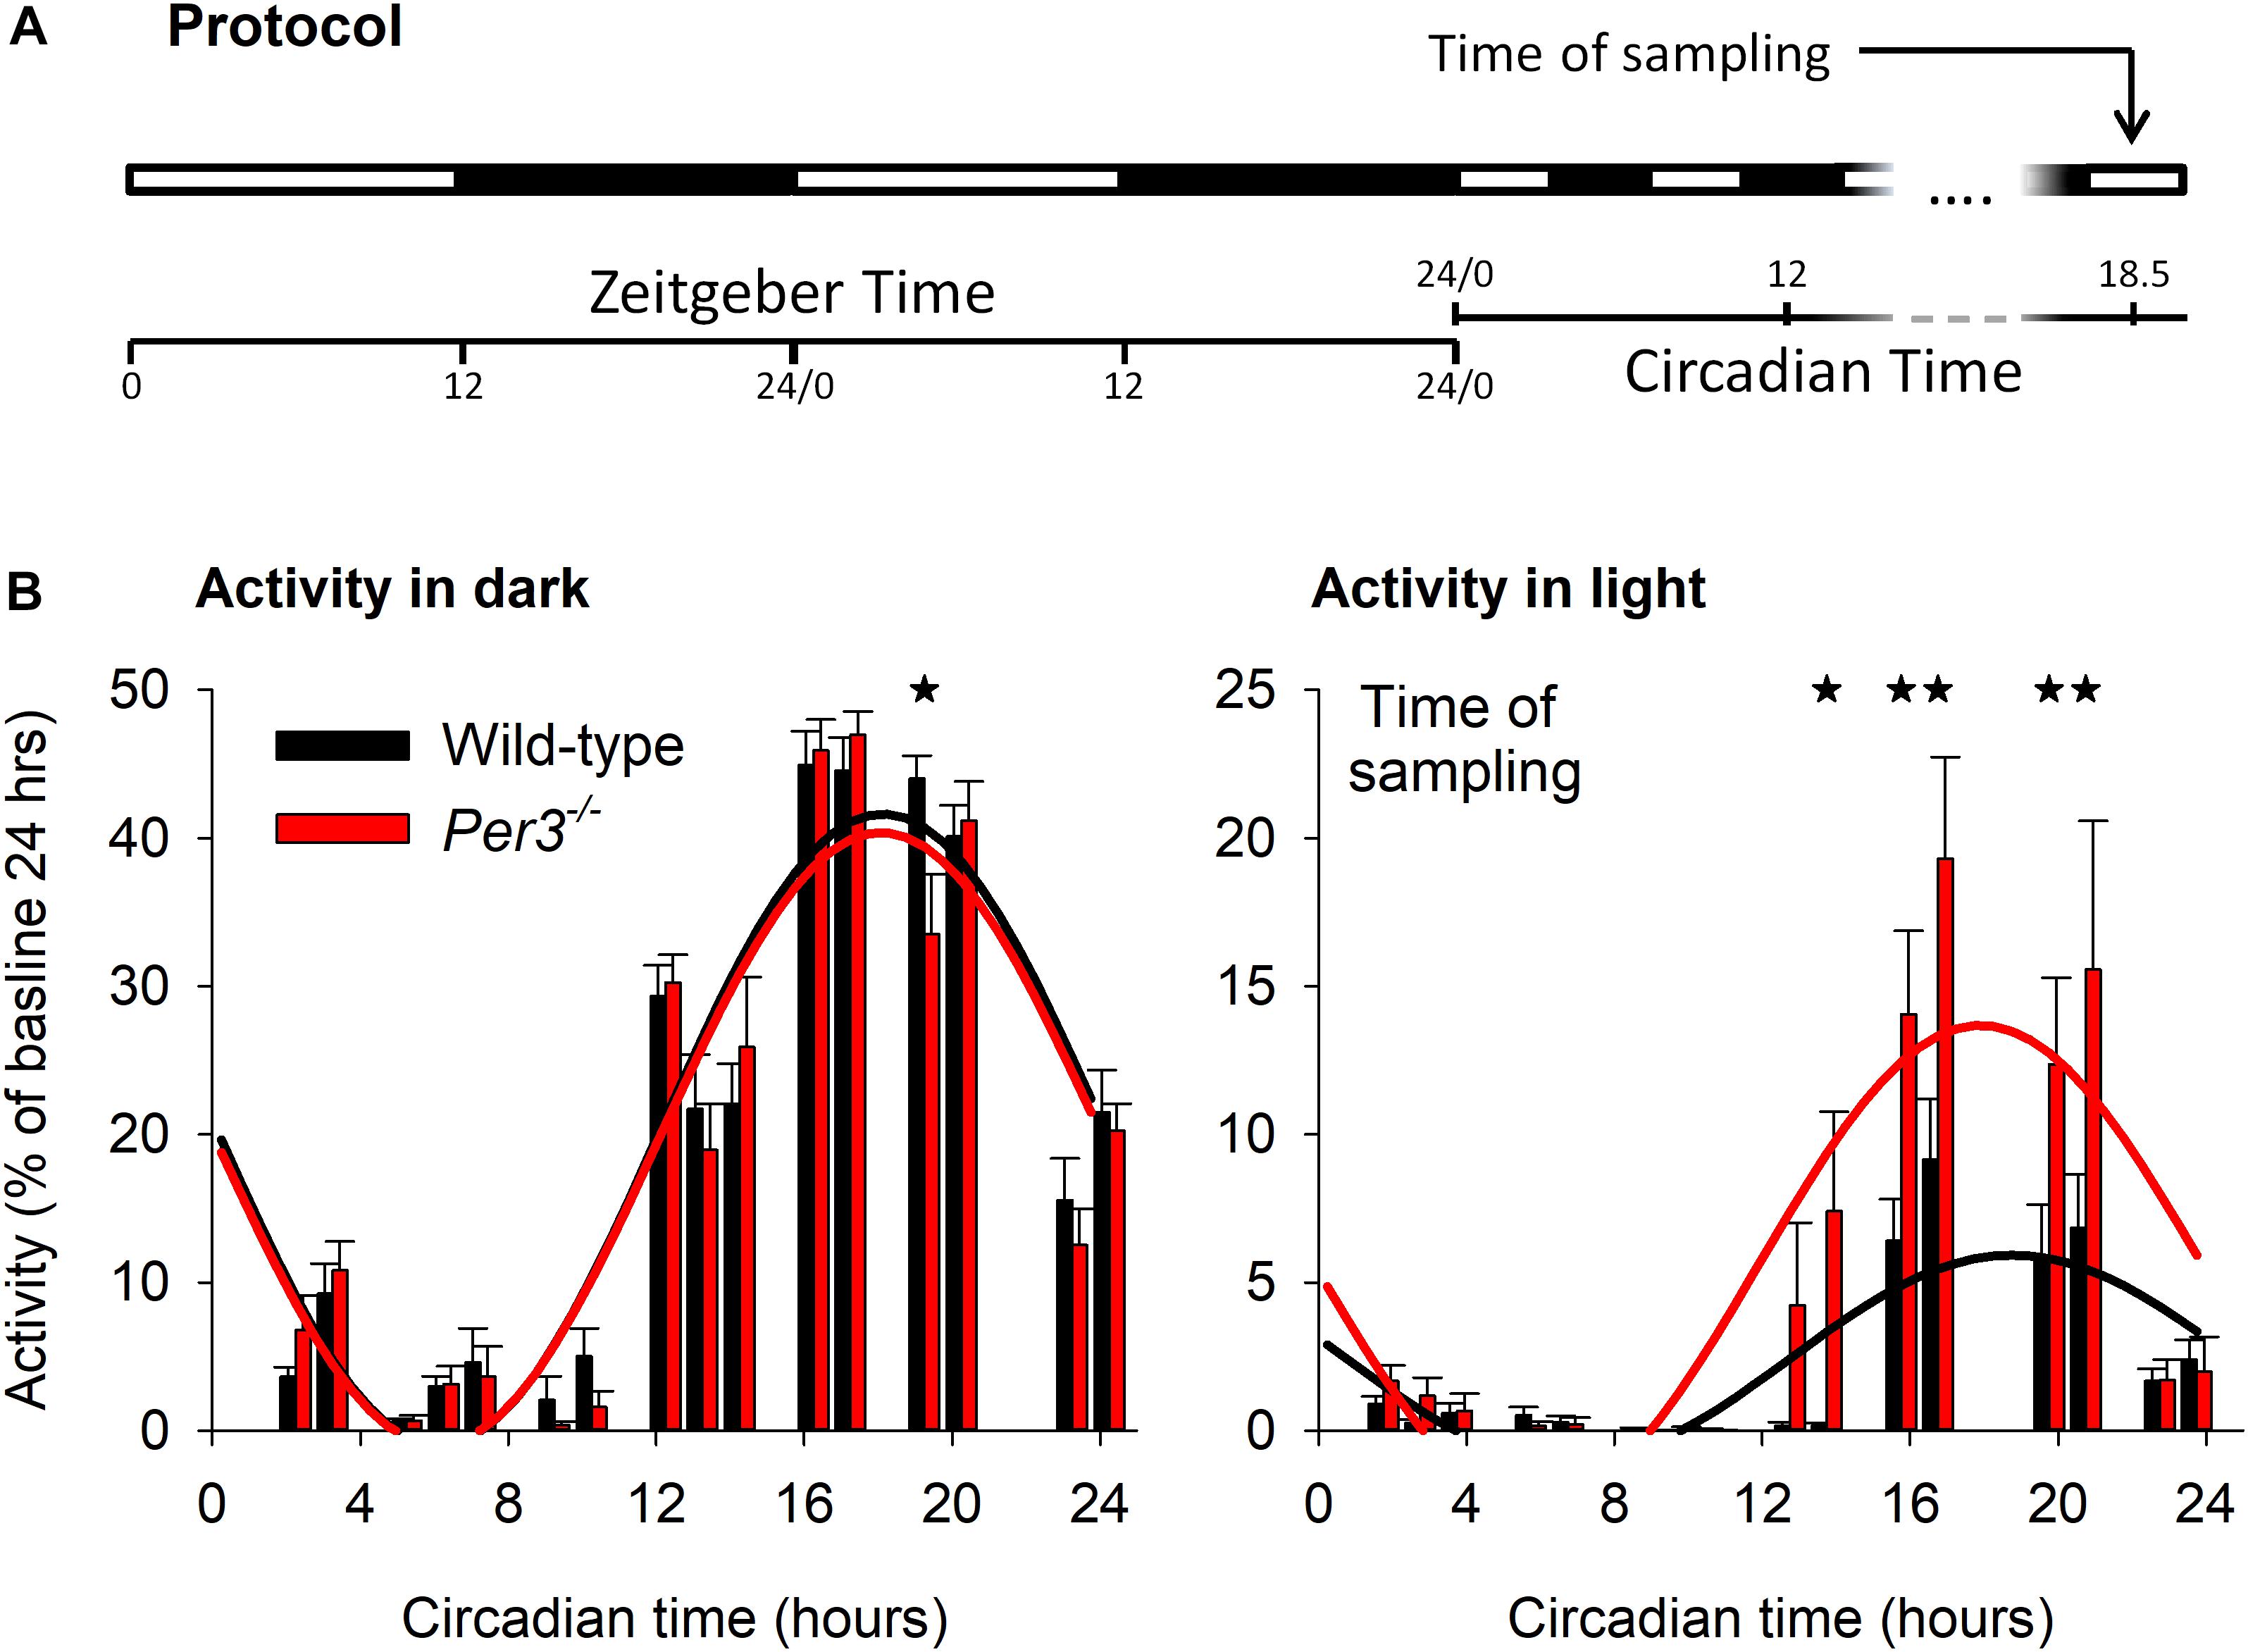
Figure 1. Ultradian light/dark protocol and activity behavior. Light-dark protocol of Per3–/– and WT mice (A), indicating that mice were killed in the 17th ultradian light-dark cycle, corresponding to circadian time (CT) 18.5. (B) Group mean total behavioral activity in the dark (left) and light (right) as percentage of total activity in baseline during ultradian light-dark cycles, as a function of CT. Cosinor fits to activity (WT = black, Per3–/– = red) indicated significantly higher levels of activity during the light phase for Per3–/– mice, with maximal predicted differences in negative behavioral masking at the time of sampling. Please note that all asterisks are single but several adjacent time points are significant at the P < 0.05 level.
Transcriptome analyses identified 74 probes in the hypothalamus (mapping to 67 annotated transcripts) that were differentially expressed > twofold between the genotypes, of which 35 were upregulated and 39 were downregulated (Supplementary Data File S1). In the eye, there were 75 probes (mapping to 71 annotated transcripts) that were differentially expressed > twofold between the genotypes (28 upregulated, 47 downregulated) (Supplementary Data File S1). By far the most down-regulated (>sevenfold) transcript in both hypothalamus and eye in Per3–/– was Prdm16 (PR/SET domain 16), a transcriptional regulator that functions in adipose cell differentiation (Seale et al., 2007), neurogenesis (Baizabal et al., 2018), and transforming growth factor beta (TGFβ) signaling (Zeng et al., 2017).
Large average fold changes in expression may also have large variance in expression values and therefore insignificant p values and ranking probes according to corrected p values identified fewer differentially expressed transcripts. Conversely, small variance in expression values can give rise to significant p values but small associated fold changes. Thus, either approach applied on its own can fail to detect biologically relevant differential gene expression. We therefore also applied an approach that combines fold change and significance levels to determine differentially expressed gene ranking (Xiao et al., 2014).
The top 50 differentially expressed transcripts identified from this combined analysis for each tissue are shown in the heatmaps of Figure 2A (also Supplementary Data File S2) where expression values are shown for all individual mice. This analysis identified a larger overlap of differentially expressed transcripts between the tissues (13 transcripts in common) and also highlighted multiple transcripts for the same gene being differentially expressed in the eye. Twenty-three of the transcripts that code for 17 known genes are co-located in an ∼8 Mb region (149.000–157.000 Mbp) surrounding Per3 on mouse distal chromosome 4 (Figure 2B) and the majority of these are downregulated in Per3–/– mice, including Per3 itself. These data suggest that the expression levels of genes within this co-located cluster are co-regulated with Per3 and predominantly in a positive way.
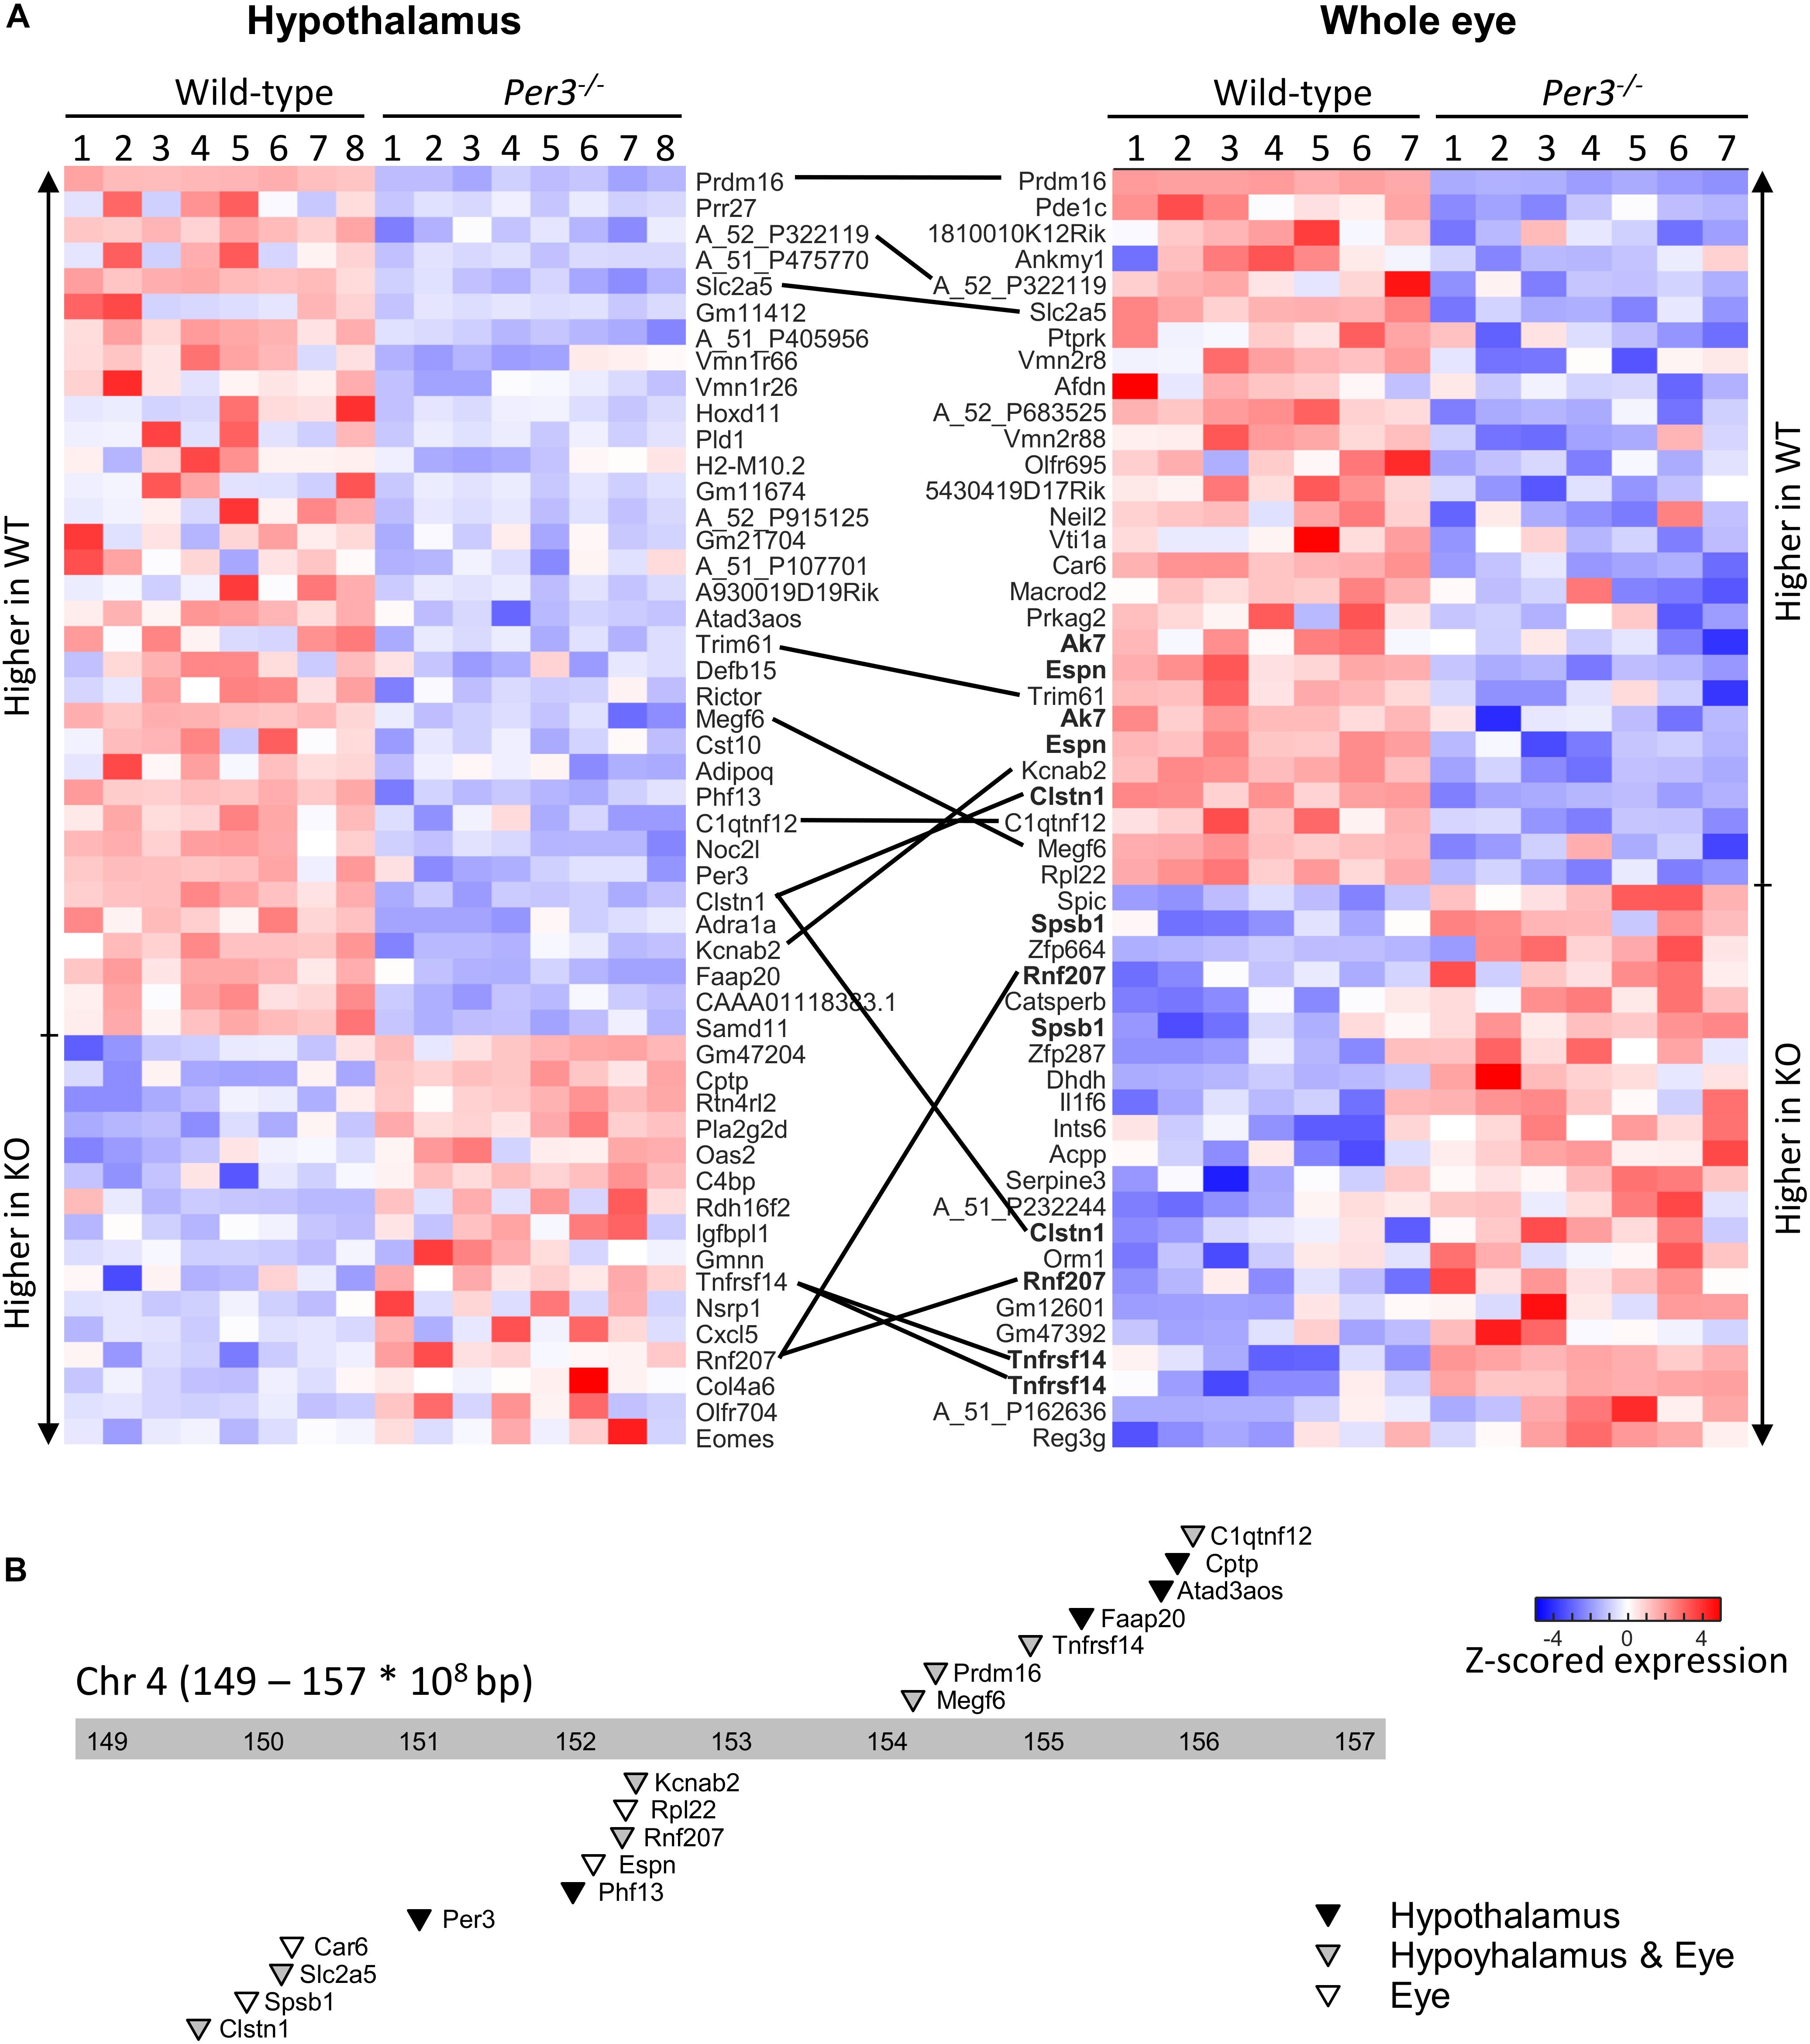
Figure 2. Differential gene expression between WT and Per3–/– mice. (A) Top-50 differentially regulated microarray probes in the hypothalamus and whole eye of WT, and Per3–/– mice. Each row depicts normalized transcript expression in biological replicates (N = 8 per genotype for hypothalamus, and N = 7 per genotype for whole eye), and are top-to-bottom ordered from largest to smallest fold-change between WT and Per3–/– mice, in groups of up- and down-regulated probes. Probes – or where possible associated gene names of probes – are indicated, and black lines connect the same probes/genes between tissues. Multiple probes targeting the same gene in the eye are in bold. (B) Chromosome location of 17 genes represented in the probes from (A), which are all localized around Per3, on the distal end (149–157 × 108bp) of mouse chromosome 4. Triangles point to loci of the probes, and shading indicates whether genes were differentially regulated in the hypothalamus (black), whole eye (white), or both (gray).
Differentially expressed transcripts co-localized with Per3 were associated with glucose/fructose regulation (Slc2a5, C1qtnf12), phospholipase activity (Cptp), RNA binding and translation (Rpl22), DNA repair (Faap20), potassium channel and cardiovascular function (Kcnab2, Rnf207), chromatin modification (Prdm16, Phf13), and immune response (Spsb1, Tnfrsf14). Some are also involved in diseases such as Alzheimer’s (Clstn1) and deafness (Espn). If probes are simply ranked according to uncorrected p value, this co-localization enrichment increases to include 17 and 14 of the top-20 probes for the hypothalamus and eye, respectively, and includes additional transcripts of interest such as Dvl1 (Wnt signaling) and Park7 (Parkinson’s disease).
The combined fold change/p value analysis confirmed Prdm16 to be the most down-regulated transcript in both tissues. When the expression levels of Prdm16 in both eye and hypothalamus are compared for individual WT and Per3–/– mice, the very tight clustering of expression values demonstrates the consistency of this effect (Figures 3A,B). We also observed the down regulation of Prdm16 by qPCR amplification in samples of whole eye tissue collected at 4-hourly intervals across 24 h from WT and Per3–/– mice that had been housed in constant darkness, which allows the detection of intrinsic circadian rhythms in the absence of an entraining light/dark cycle. The data show a circadian rhythm in the expression of Prdm16 in WT mice and a significantly down-regulated expression profile in Per3–/– mice (Figure 3C; genotype effect P < 0.0001). These qPCR data independently demonstrate in an alternative protocol, that PRDM16 is indeed down-regulated in Per3–/– compared with WT mice.
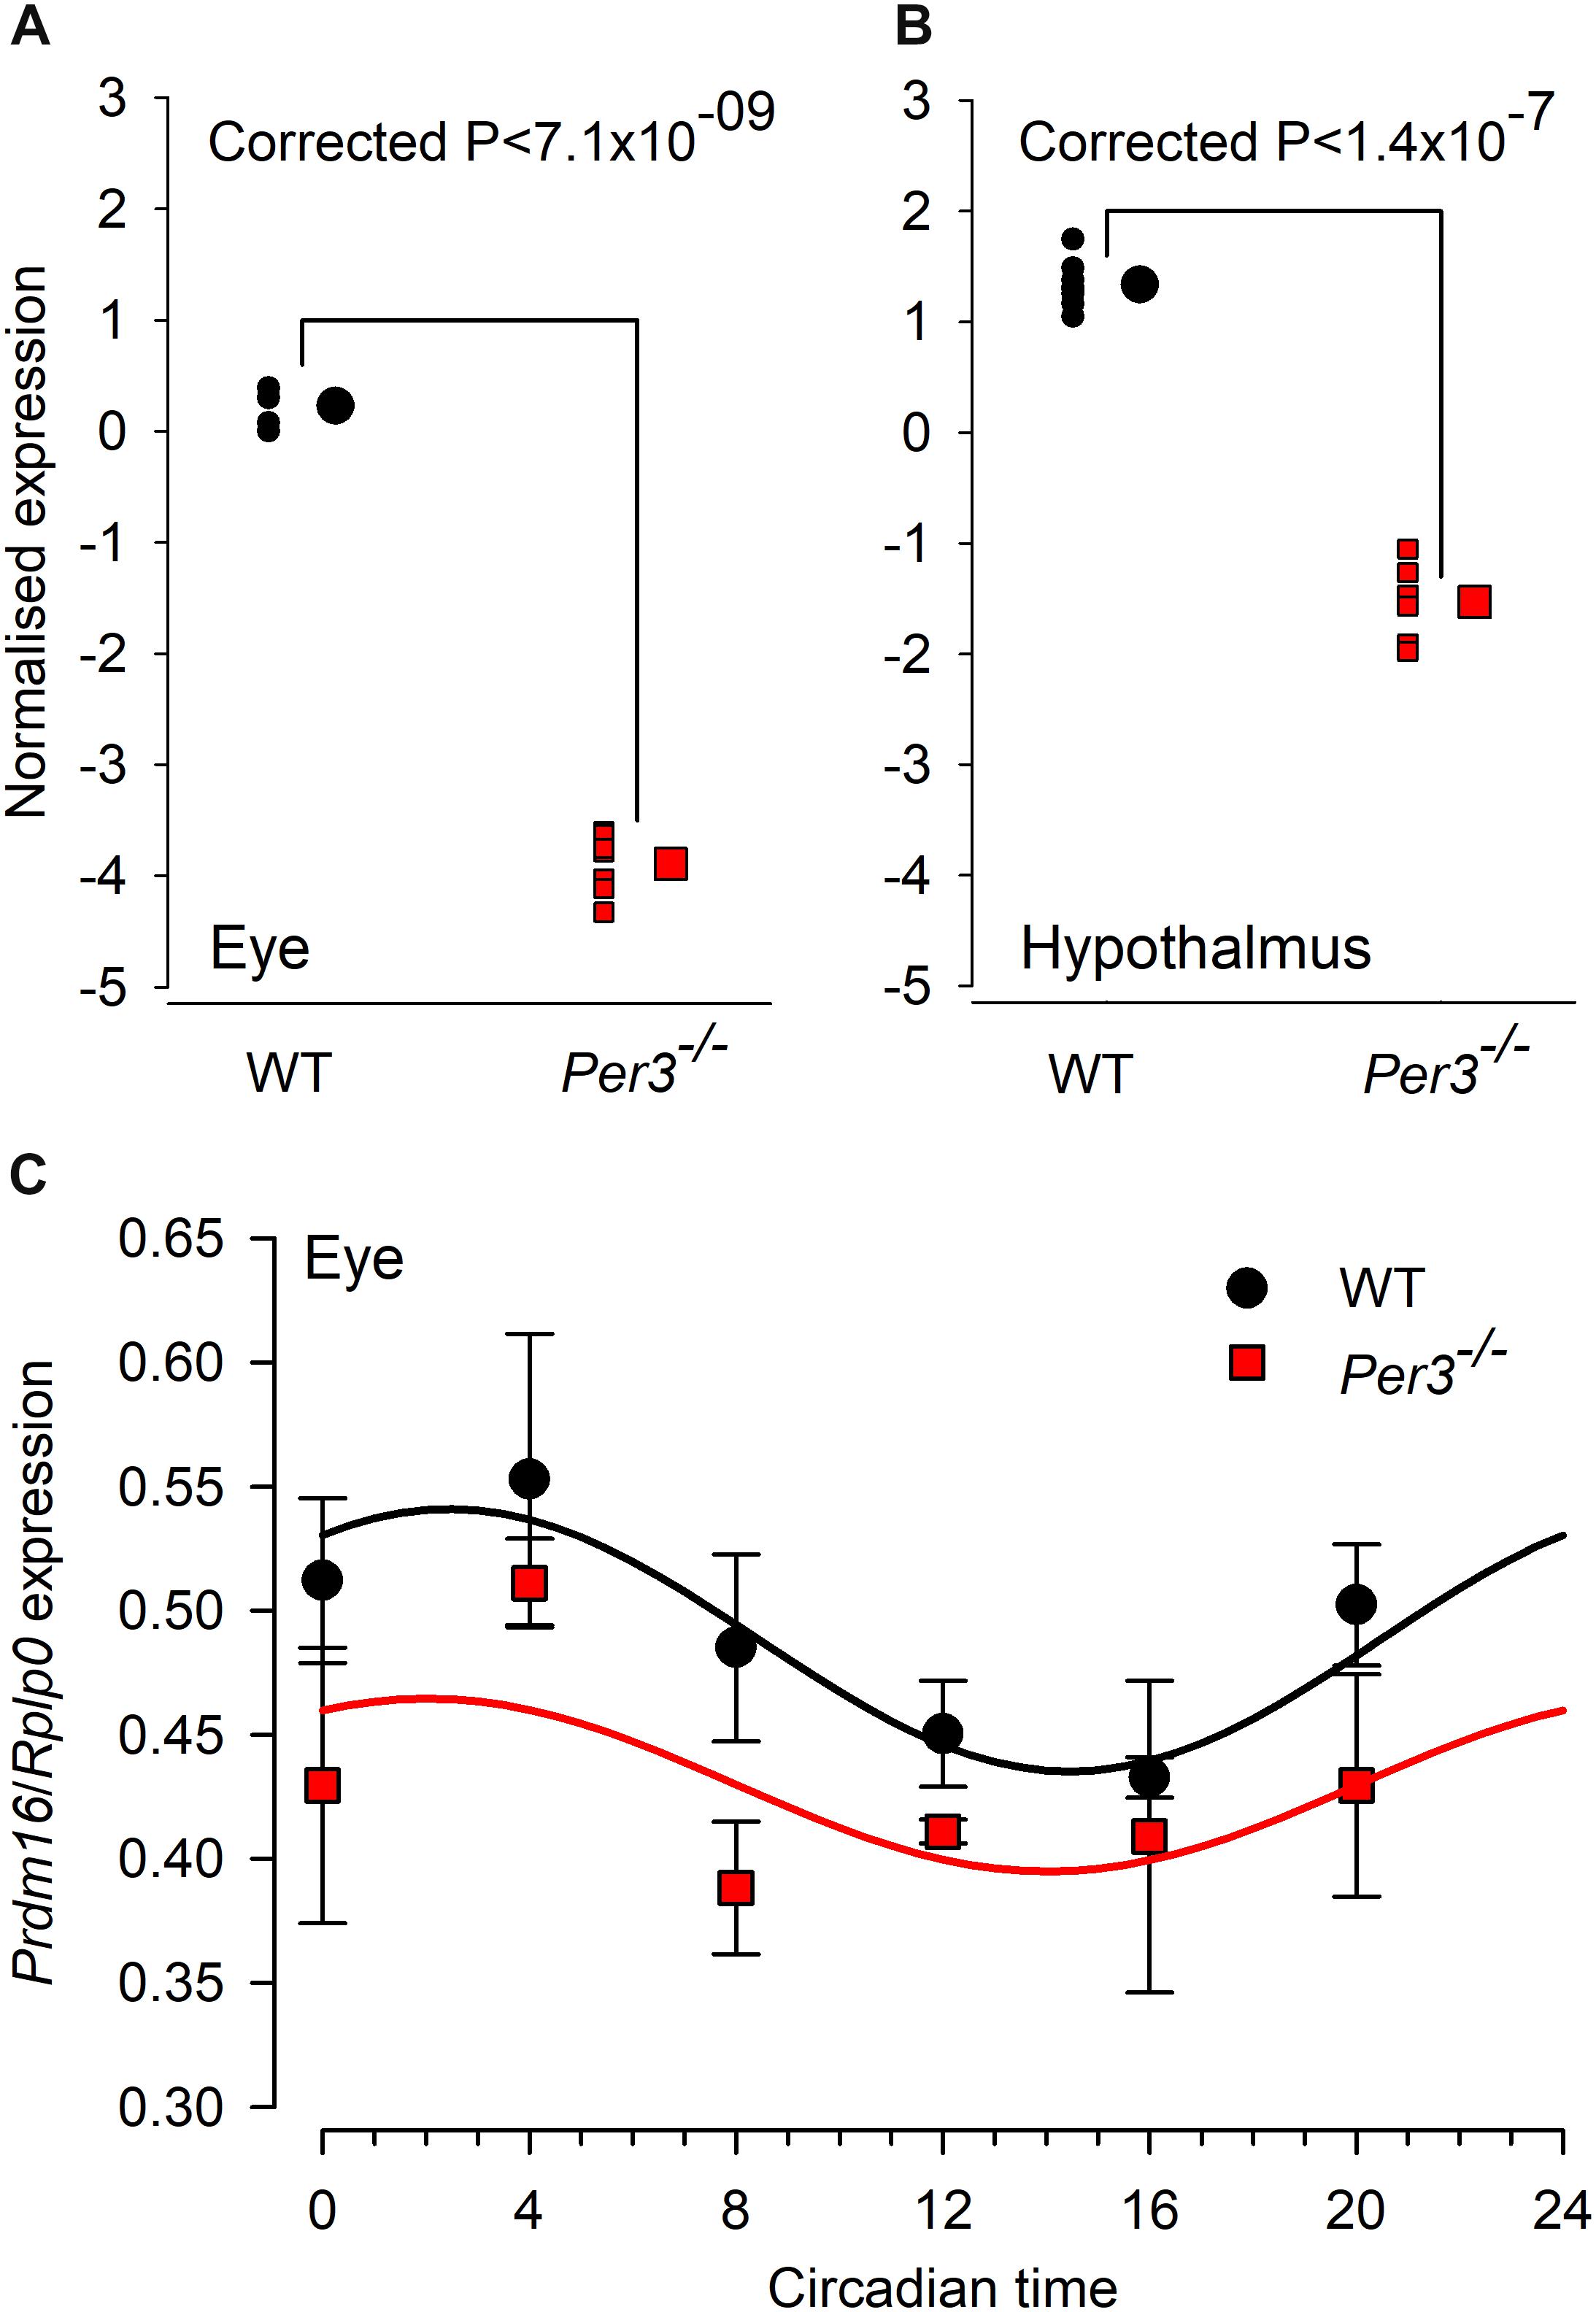
Figure 3. Individual microarrays and qPCR confirmation for differential Prdm16 expression. Normalized microarray expression levels of Prdm16 mRNA in whole eye (A) and hypothalamus (B) of individual wild-type (black circles) and Per3–/– (red squares; N = 7 per genotype). Large black circles and red squares are the mean (±SEM, not visible) normalized expression levels for WT and Per3–/–, respectively. (C) In vivo circadian expression patterns of Prdm16 mRNA (mean ± SEM) was confirmed through qPCR analysis in mouse whole eye, sampled across the circadian day (N = 8 per genotype). Prdm16 mRNA exhibited circadian expression patterns in both WT and Per3–/– mice, but overall levels in Per3–/– mice were significantly lower (T-test, P < 0.05).
Accumulated Weight Gain in Per3–/– Mice
Several clock genes have been associated with metabolic phenotypes in mice (Bass and Takahashi, 2010), and human PER3 has been linked with BMI and obesity (Lazar et al., 2012; Samblas et al., 2018). Thus, we wanted to investigate further whether down-regulation of Prdm16 in Per3–/– mice could affect metabolism and body mass. WT and Per3–/– mice were fed either a normal or a high fat diet from 4 weeks of age for a period of 14 weeks. Body weight and food consumption were recorded twice per week. During the protocol, mice were housed individually on an LD 12:12 cycle that was advanced by 6 h every 7 days, which represents a chronic jet-lag protocol shown to be stressful in mice (Davidson et al., 2006). Although this is different to the ultradian protocol used for the transcriptome experiment, we chose this approach as being more suitable to identify a metabolic phenotype difference between WT and Per3–/– mice because exposure to continuously shifted light/dark schedules in mice is associated with metabolic disorders (Kolbe and Oster, 2019). There was a significant effect of genotype, diet and time on body mass accumulation (interaction P < 0.0001, post hoc multiple comparisons P < 0.001–0.05 for WT vs. Per3–/– mice in high fat diet). Compared to WT, Per3–/– mice accumulated less body mass when fed on a high fat diet during weeks 4–13 (Figure 4A). Both WT and Per3–/– mice consumed less food when on the high fat diet compared to the normal diet (Figure 4B), and Per3–/– mice consumed less than WT on both diets (Figure 4B). This shows that PER3 associates with altered body mass accumulation during early development.
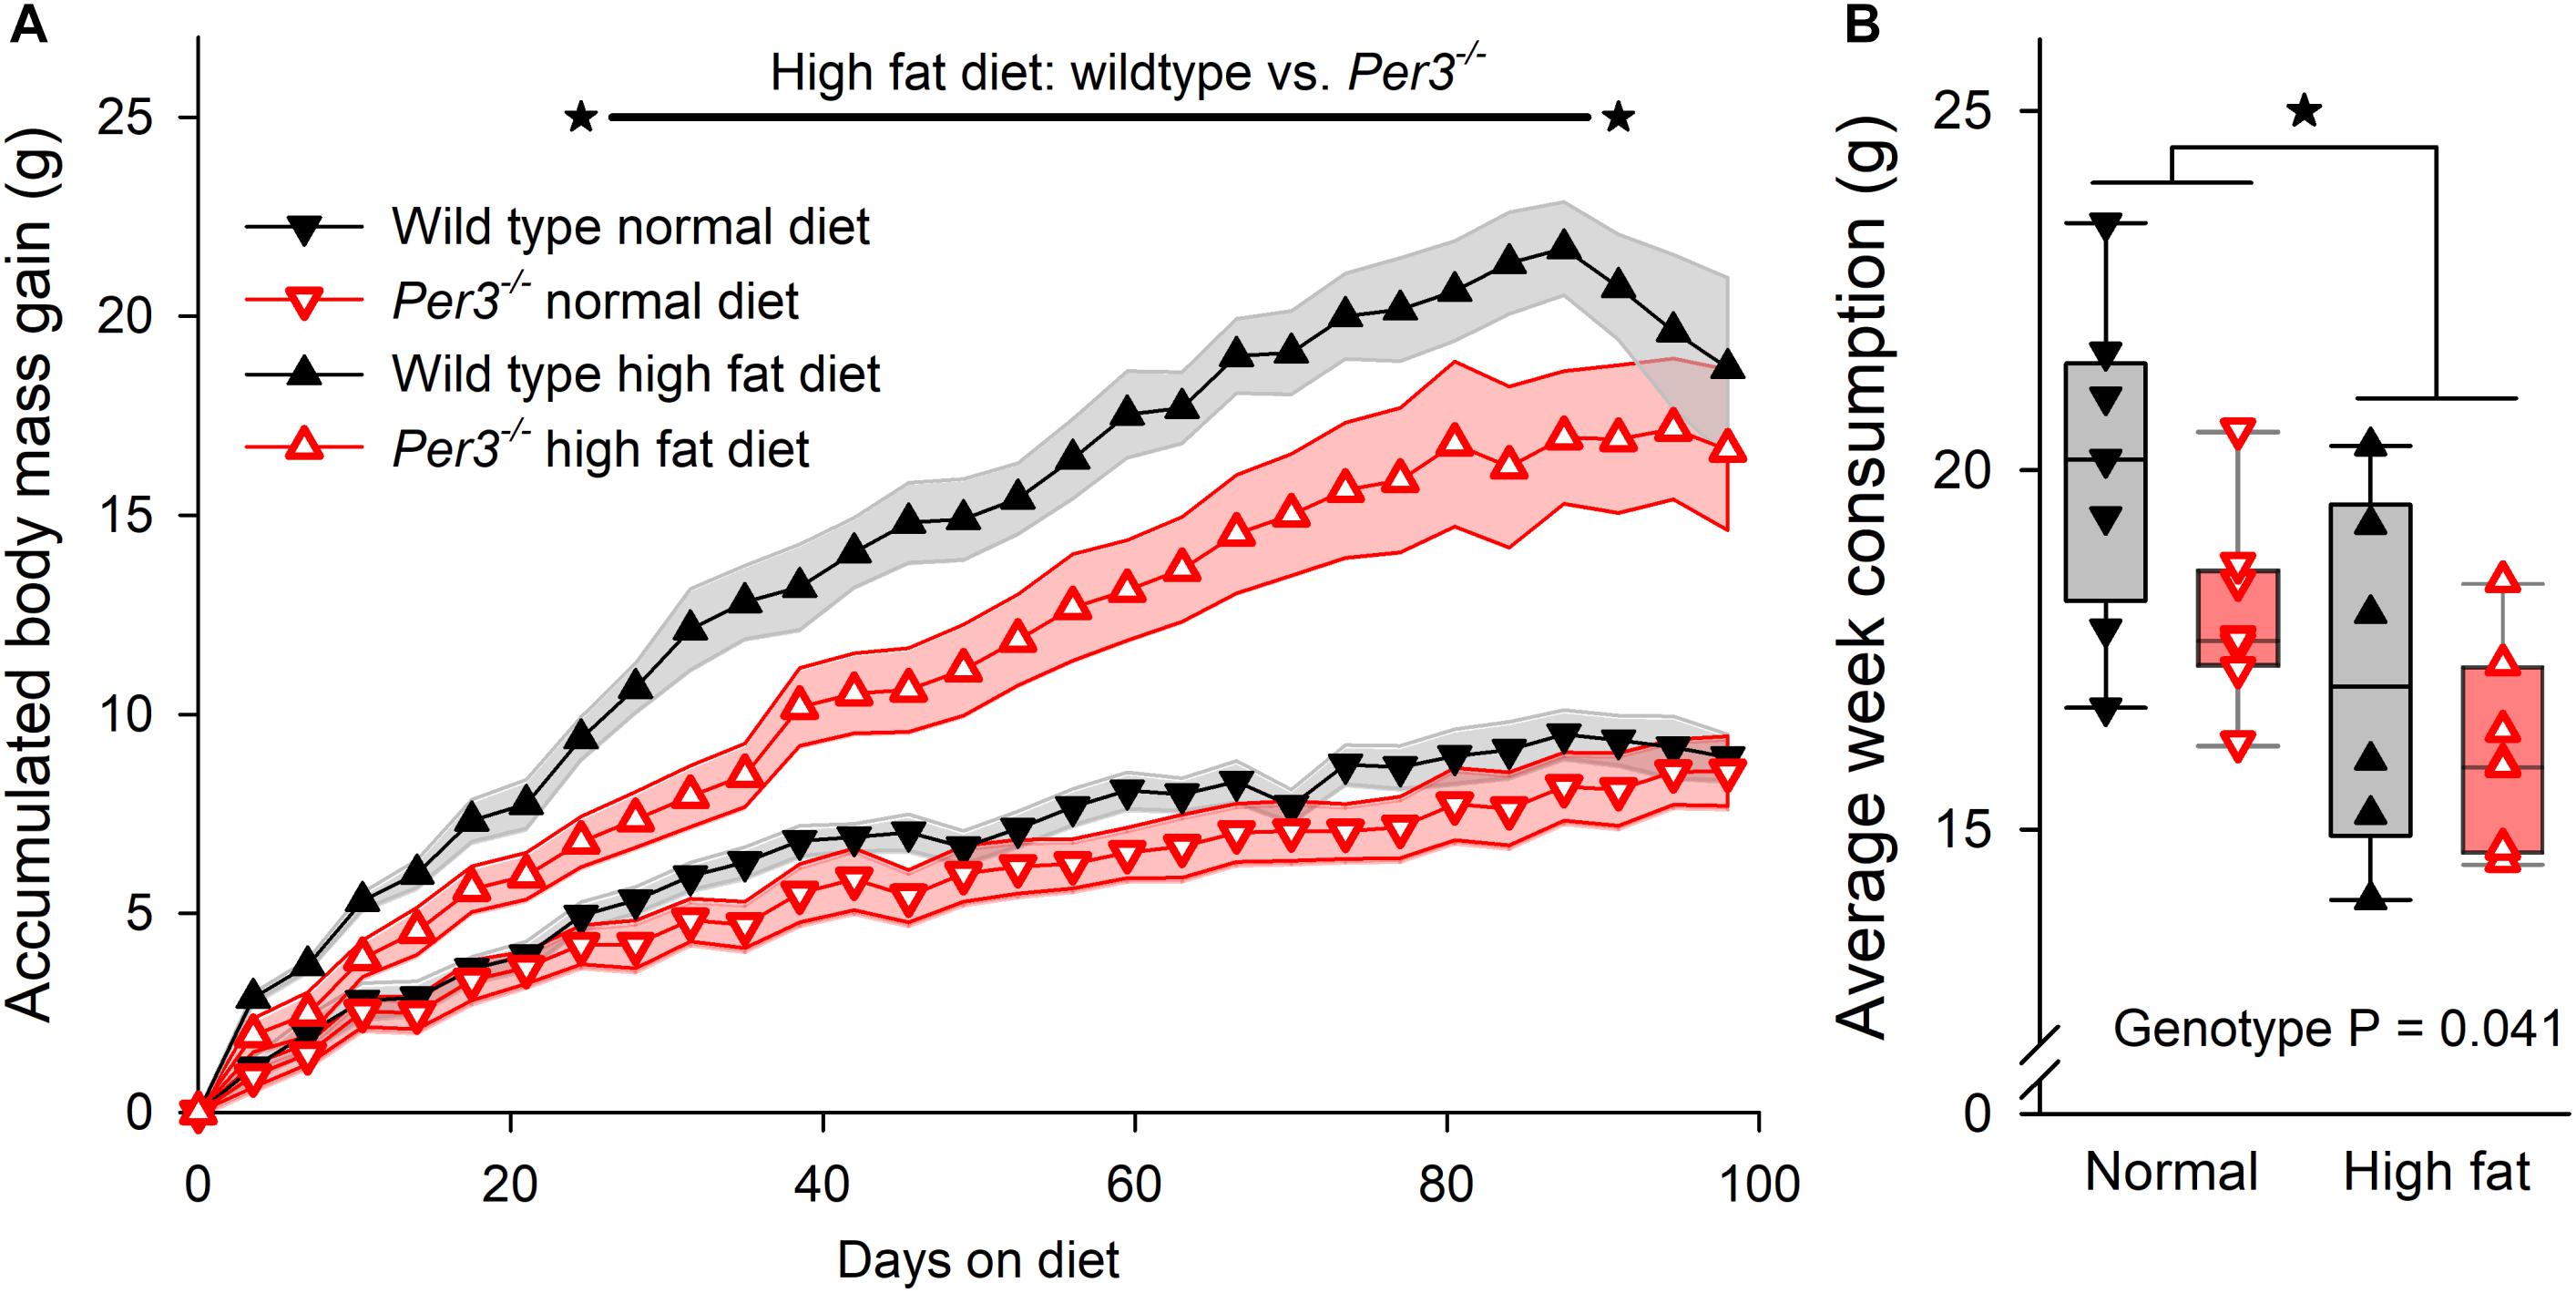
Figure 4. Body mass accumulation in WT and Per3–/– mice. (A) Accumulative body mass gain in wildtype (sold black symbols) and Per3–/– (open red symbols) mice, fed on normal (downward triangle) and high-fat (upward triangles) diet. The asterisks connected by the black line indicates a significantly (P < 0.001–0.05 for post hoc multiple comparisons) higher accumulated body mass gain in wildtype mice, compared to Per3–/– mice on a high fat diet. (B) Individual, and boxplot interquartile ranges of average food consumption for both genotypes on both diets, indicating that WT mice eat more food than Per3–/– mice (P < 0.05) irrespective of diet, and that irrespective of genotypes, mice eat less when on a high-fat diet (P < 0.05). There were no significant interaction effects. *P < 0.05.
Genes associated with biological pathways are likely to be differentially expressed at varying levels. Thus, for GO pathway level analysis we relaxed the fold change cut-off to include all probes that were significantly differentially expressed between genotypes, as determined by a rank products analysis. This analysis identified 226 probes (103 up-regulated and 123 down regulated in Per3–/– compared to WT) that mapped to 194 unique genes in whole eye, and 775 probes (299 up regulated and 476 down regulated) that mapped to 672 unique genes in hypothalamus (Supplementary Data File S3). GO enrichment analysis (Webgestalt; Zhang et al., 2005; Liao et al., 2019) for the differentially expressed genes in the eye revealed 14 significant biological processes and molecular functions (FDR < 0.05) including steroid hydroxylase activity, oxidoreductase activity, fatty acid metabolic process, and inflammatory response (Supplementary Data File S4). For the differentially expressed genes in the hypothalamus, there were many more significant GO terms and the top 40 ranked by FDR are shown in Supplementary Data File S5. For the hypothalamus, biological processes and molecular functions included response to oxygen-containing compound, circulatory system development, cell proliferation, double-stranded DNA binding, RNA polymerase II regulatory region DNA binding, tissue development, and transcription regulatory region DNA binding.
The differentially expressed transcripts identified by rank products analysis also showed significant enrichment for interaction networks (STRING v 11, analysis set for high confidence; whole eye number of edges 85, expected number 36, enrichment P = 1.943e-12; hypothalamus number of edges 404, expected number 227, enrichment P = 4.44e-13) (Figures 5, 6). The interaction network for the eye contains a sub-network centered around complement component (C3) with related inflammatory functions and another sub-network with several members related to cytochrome P450 metabolism, which were also enriched in several of the terms in the GO analysis (Figure 5). The interaction network for the hypothalamus (Figure 6) contains several clusters of interest that include ubiquitination, cell cycle and mitosis, taste, melatonin, and olfactory receptors. Other clusters have functions that are closely related to sleep including a cluster centered around prostaglandin synthase 2 (Ptgs2) involved in lipid/fat metabolism (also containing Adipoq, Adipor2, Prdm16, and Ucp1), and an elongated cluster containing prolactin, growth hormone and growth hormone receptor, thyroid stimulating hormone and thyroid stimulating hormone receptor, prostaglandin D2 receptor, and adrenergic and adenosine receptors. The densest cluster in the network contains mainly extracellular matrix proteins with functions related to circulatory activity (Figure 6).
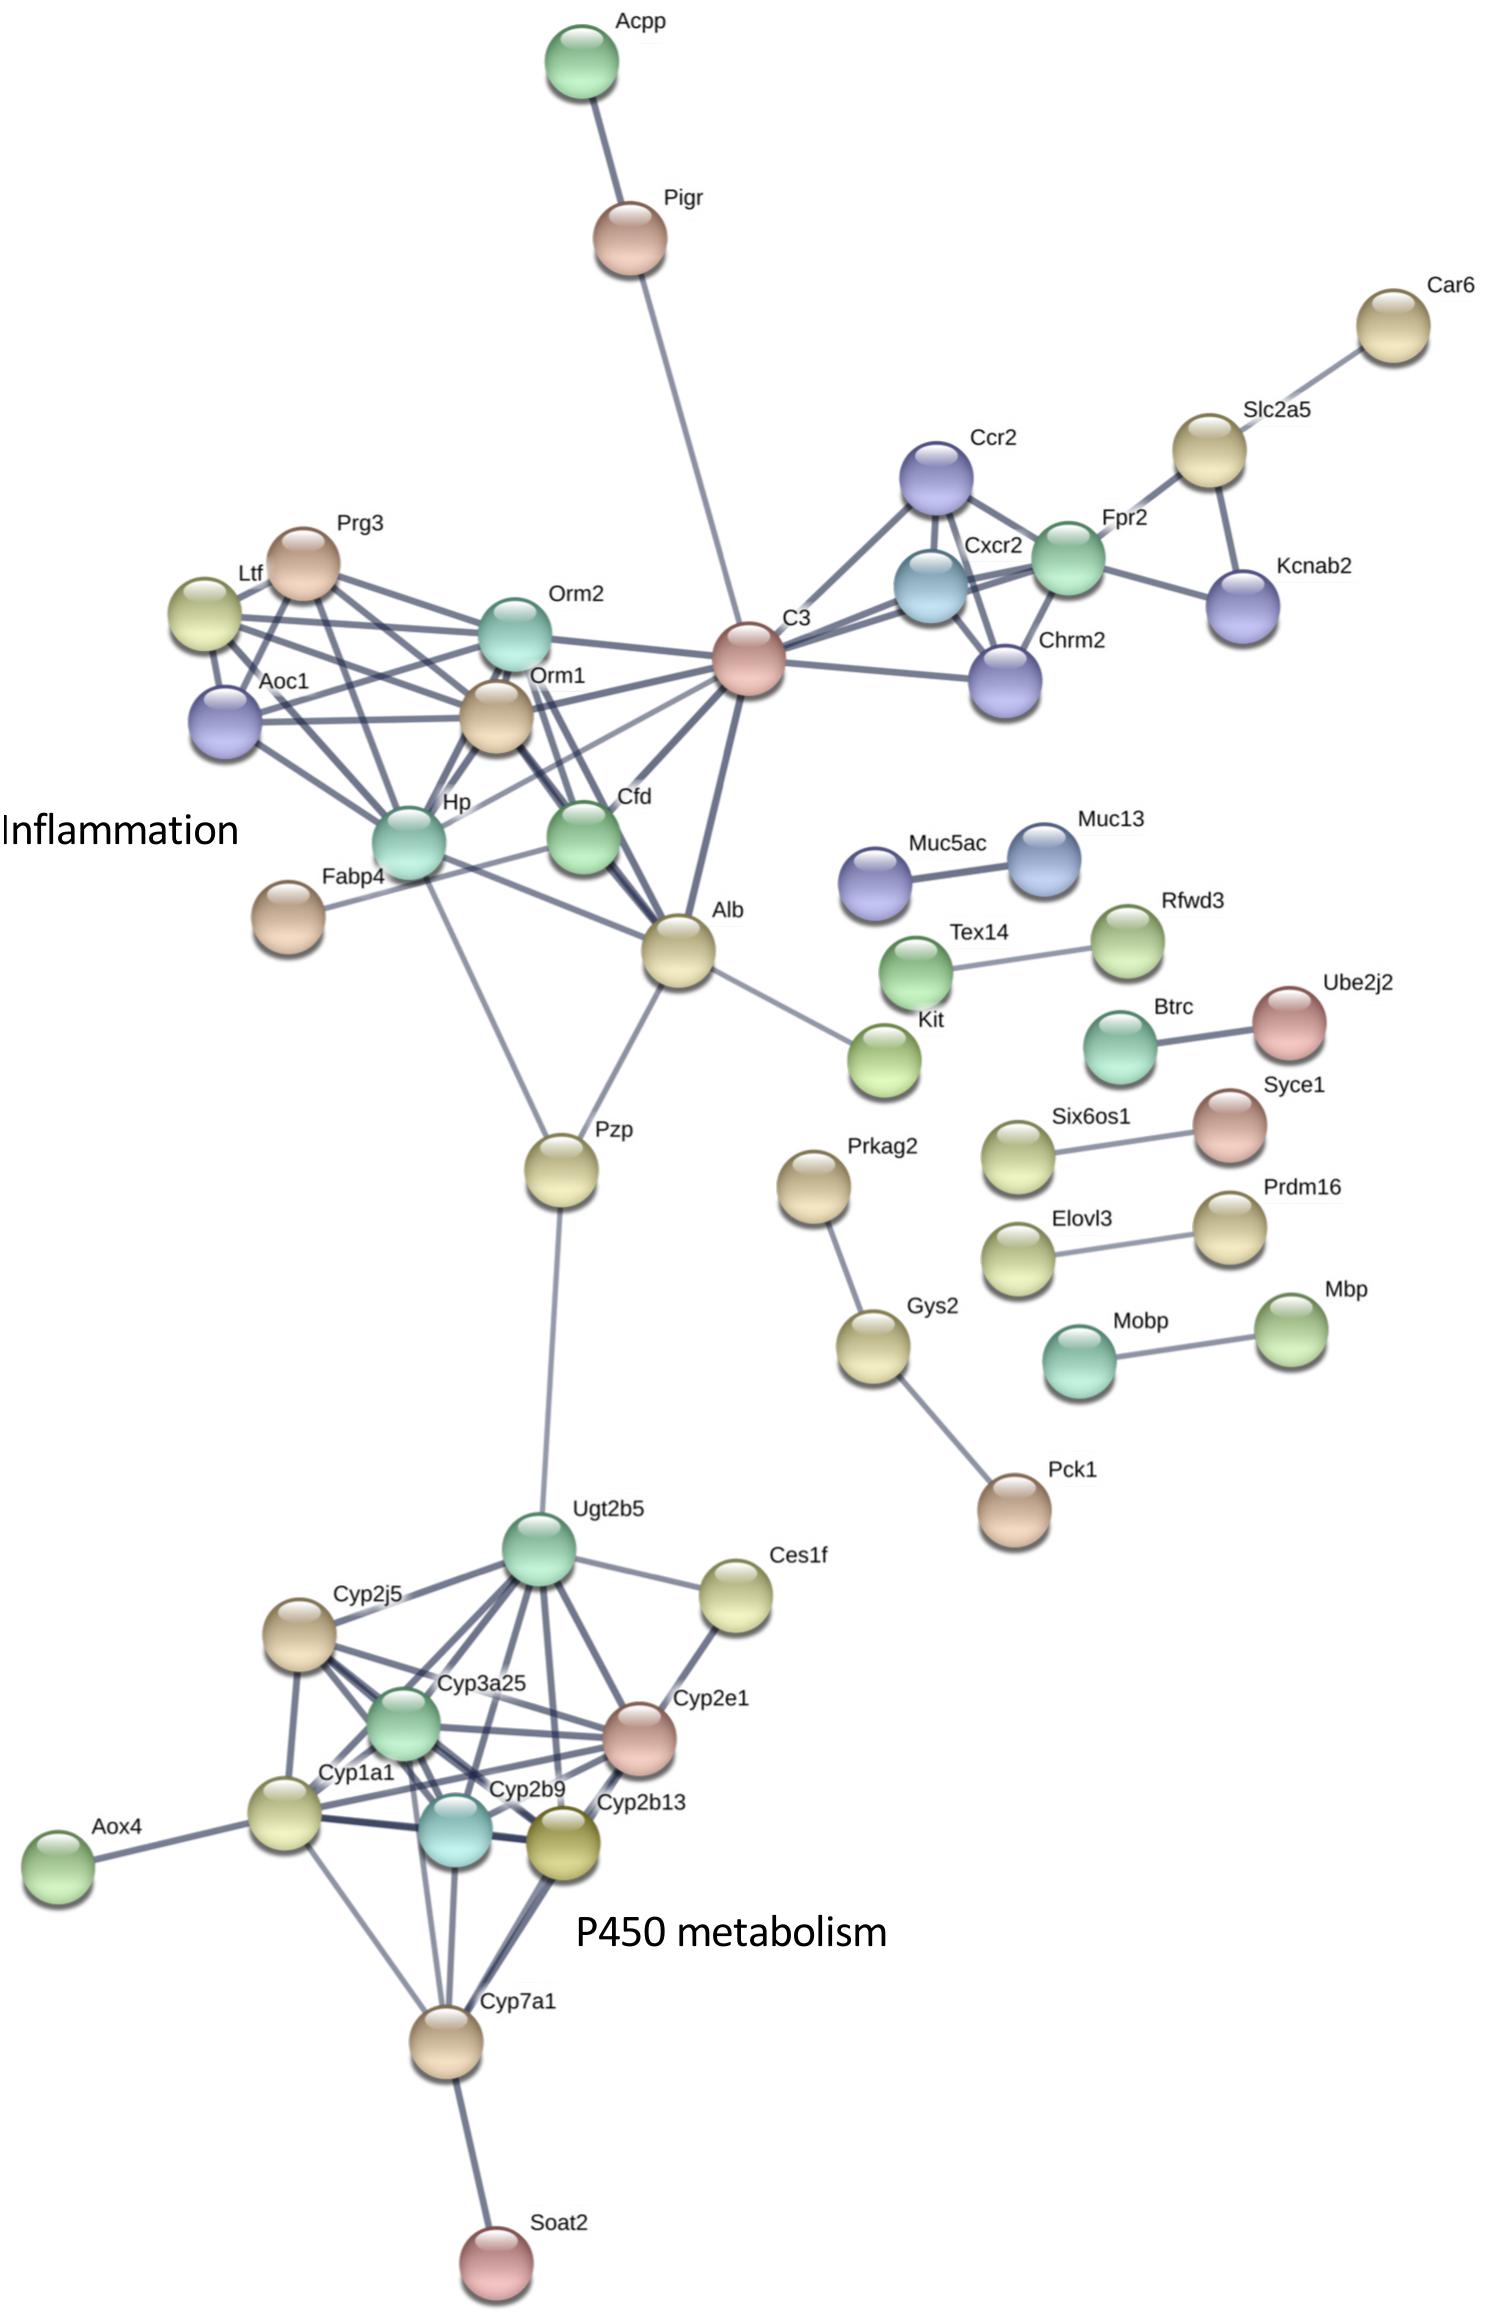
Figure 5. Interaction network for differentially expressed eye transcripts. STRING v11 was used to generate gene/protein interaction networks from transcripts differentially expressed in the eye, according to rank products analysis. The interaction confidence limit was set to high, thickness of edges corresponds to confidence, and unconnected nodes are not displayed. Network clusters associated with inflammation and P450 metabolism are shown. The total number of edges in the network was 85, the expected number derived from the input gene list (n = 194) was 36, and the corresponding enrichment p value was 1.943e-12.
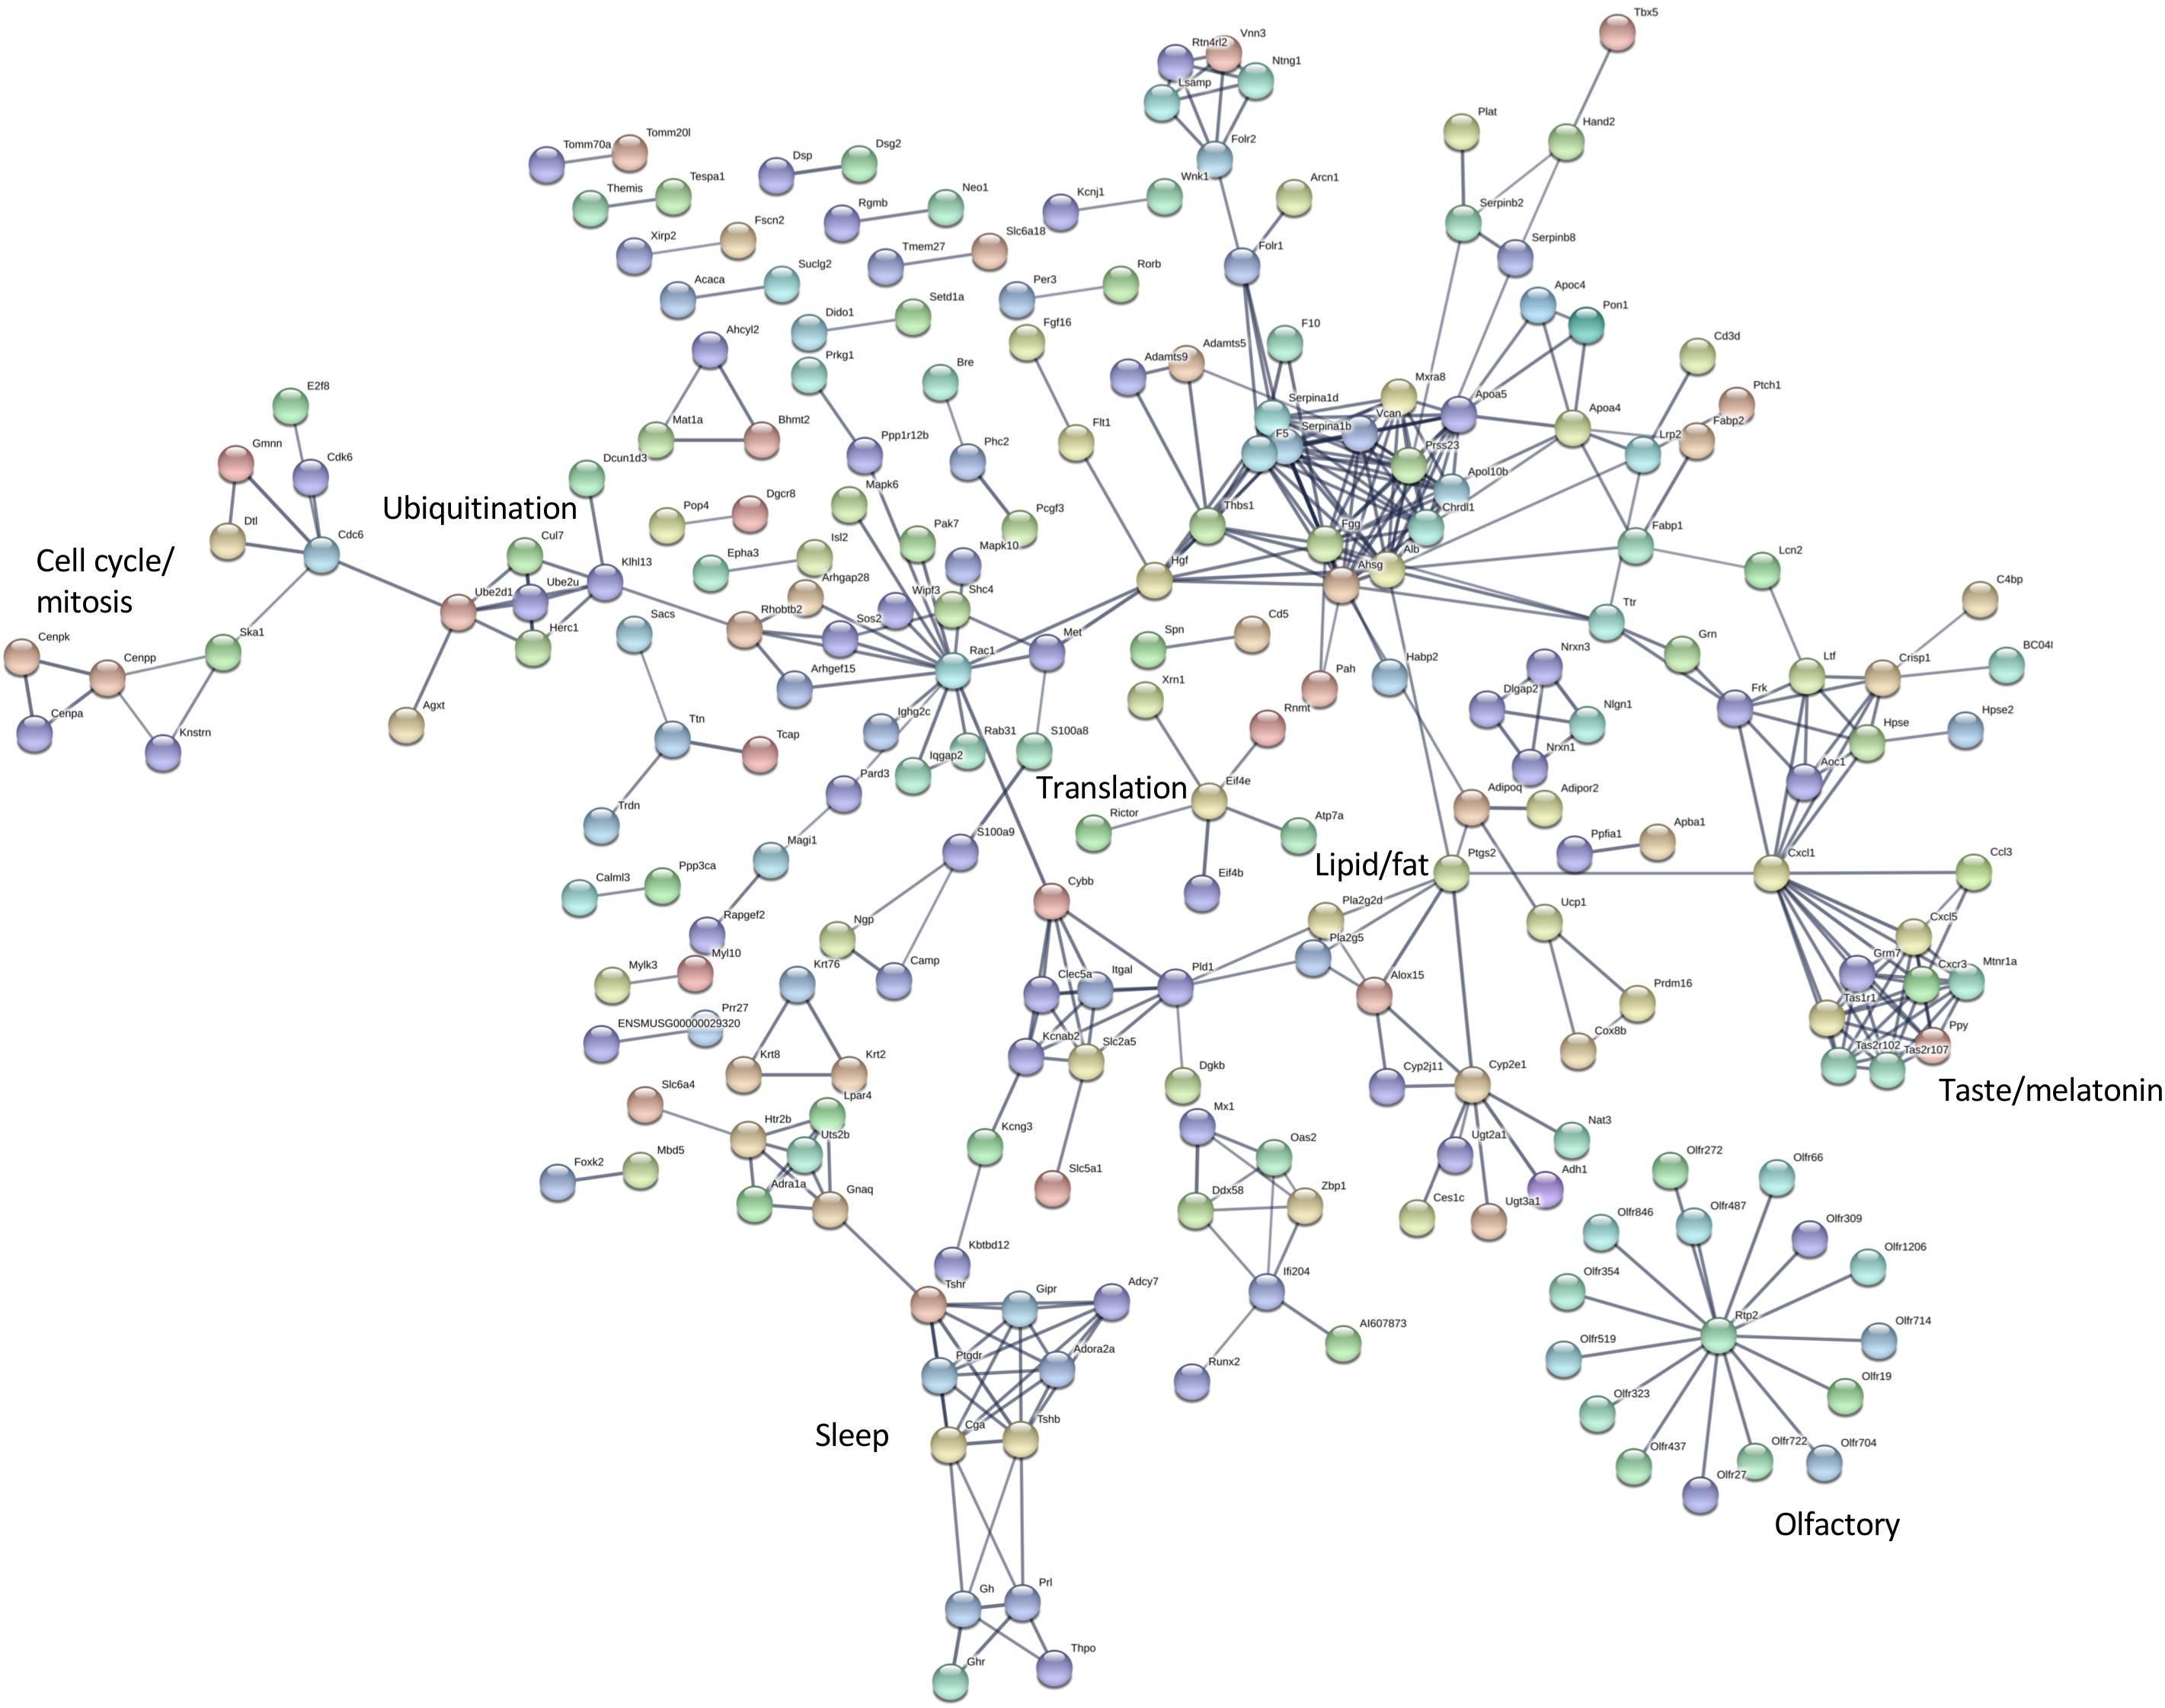
Figure 6. Interaction network for differentially expressed hypothalamus transcripts. STRING v11 was used to generate gene/protein interaction networks from transcripts differentially expressed in the hypothalamus, according to rank products analysis. The interaction confidence limit was set to high, thickness of edges corresponds to confidence, and unconnected nodes are not displayed. Network clusters associated with functions of interest are indicated. The total number of edges in the network was 404, the expected number derived from the input gene list (n = 672) was 227, and the corresponding enrichment p value was 4.44e-13.
Expression QTL Correlation Analysis With Per3 in BXD Mice
Because of the co-localization with Per3 of a large proportion of the differentially expressed genes in Per3–/– mice, we next used expression eQTL database analysis (see text footnote 1) to identify chromosomal loci where genetic variation correlated with Per3 expression levels in multiple tissue experiments from recombinant backcross strains of C57BL/6J and DBA/2J (BXD) mice. We performed LRS (likelihood ratio statistic; LRS = logarithm of the odds [LOD] × 4.61) score mapping for Per3 gene expression for brain and peripheral tissue gene expression datasets for BXD mice strains (see text footnote 1; see section “Materials and Methods” for details). Many brain regions showed a highly significant LRS peak for Per3 expression on distal chromosome 4 at exactly the same region where differentially expressed microarray transcripts co-localized with Per3 in our data. These brain regions included the nucleus accumbens, hippocampus, eye, cerebellum, prefrontal cortex, and striatum. For convenience, in Figure 7A we show the results of this mapping for whole brain, as well as eye and liver. It should be noted that there is only one dataset available for hypothalamic gene expression, which does not show a significant LRS peak for Per3 expression on chromosome 4. The liver dataset is characteristic of peripheral tissues that showed a much reduced and often not significant LRS peak at distal chromosome 4 for Per3 expression. Thus, this linkage appears stronger in brain tissues. The LRS peak at chromosome 4 was particularly significant for the eye (Figure 7A). Although, as expected, this peak centers around Per3, it remains significant for a far broader region of distal chromosome 4 that covers many genes (Supplementary Figure S1), including those that we showed to be co-regulated with Per3 in our transcriptomic analyses (Figure 2).
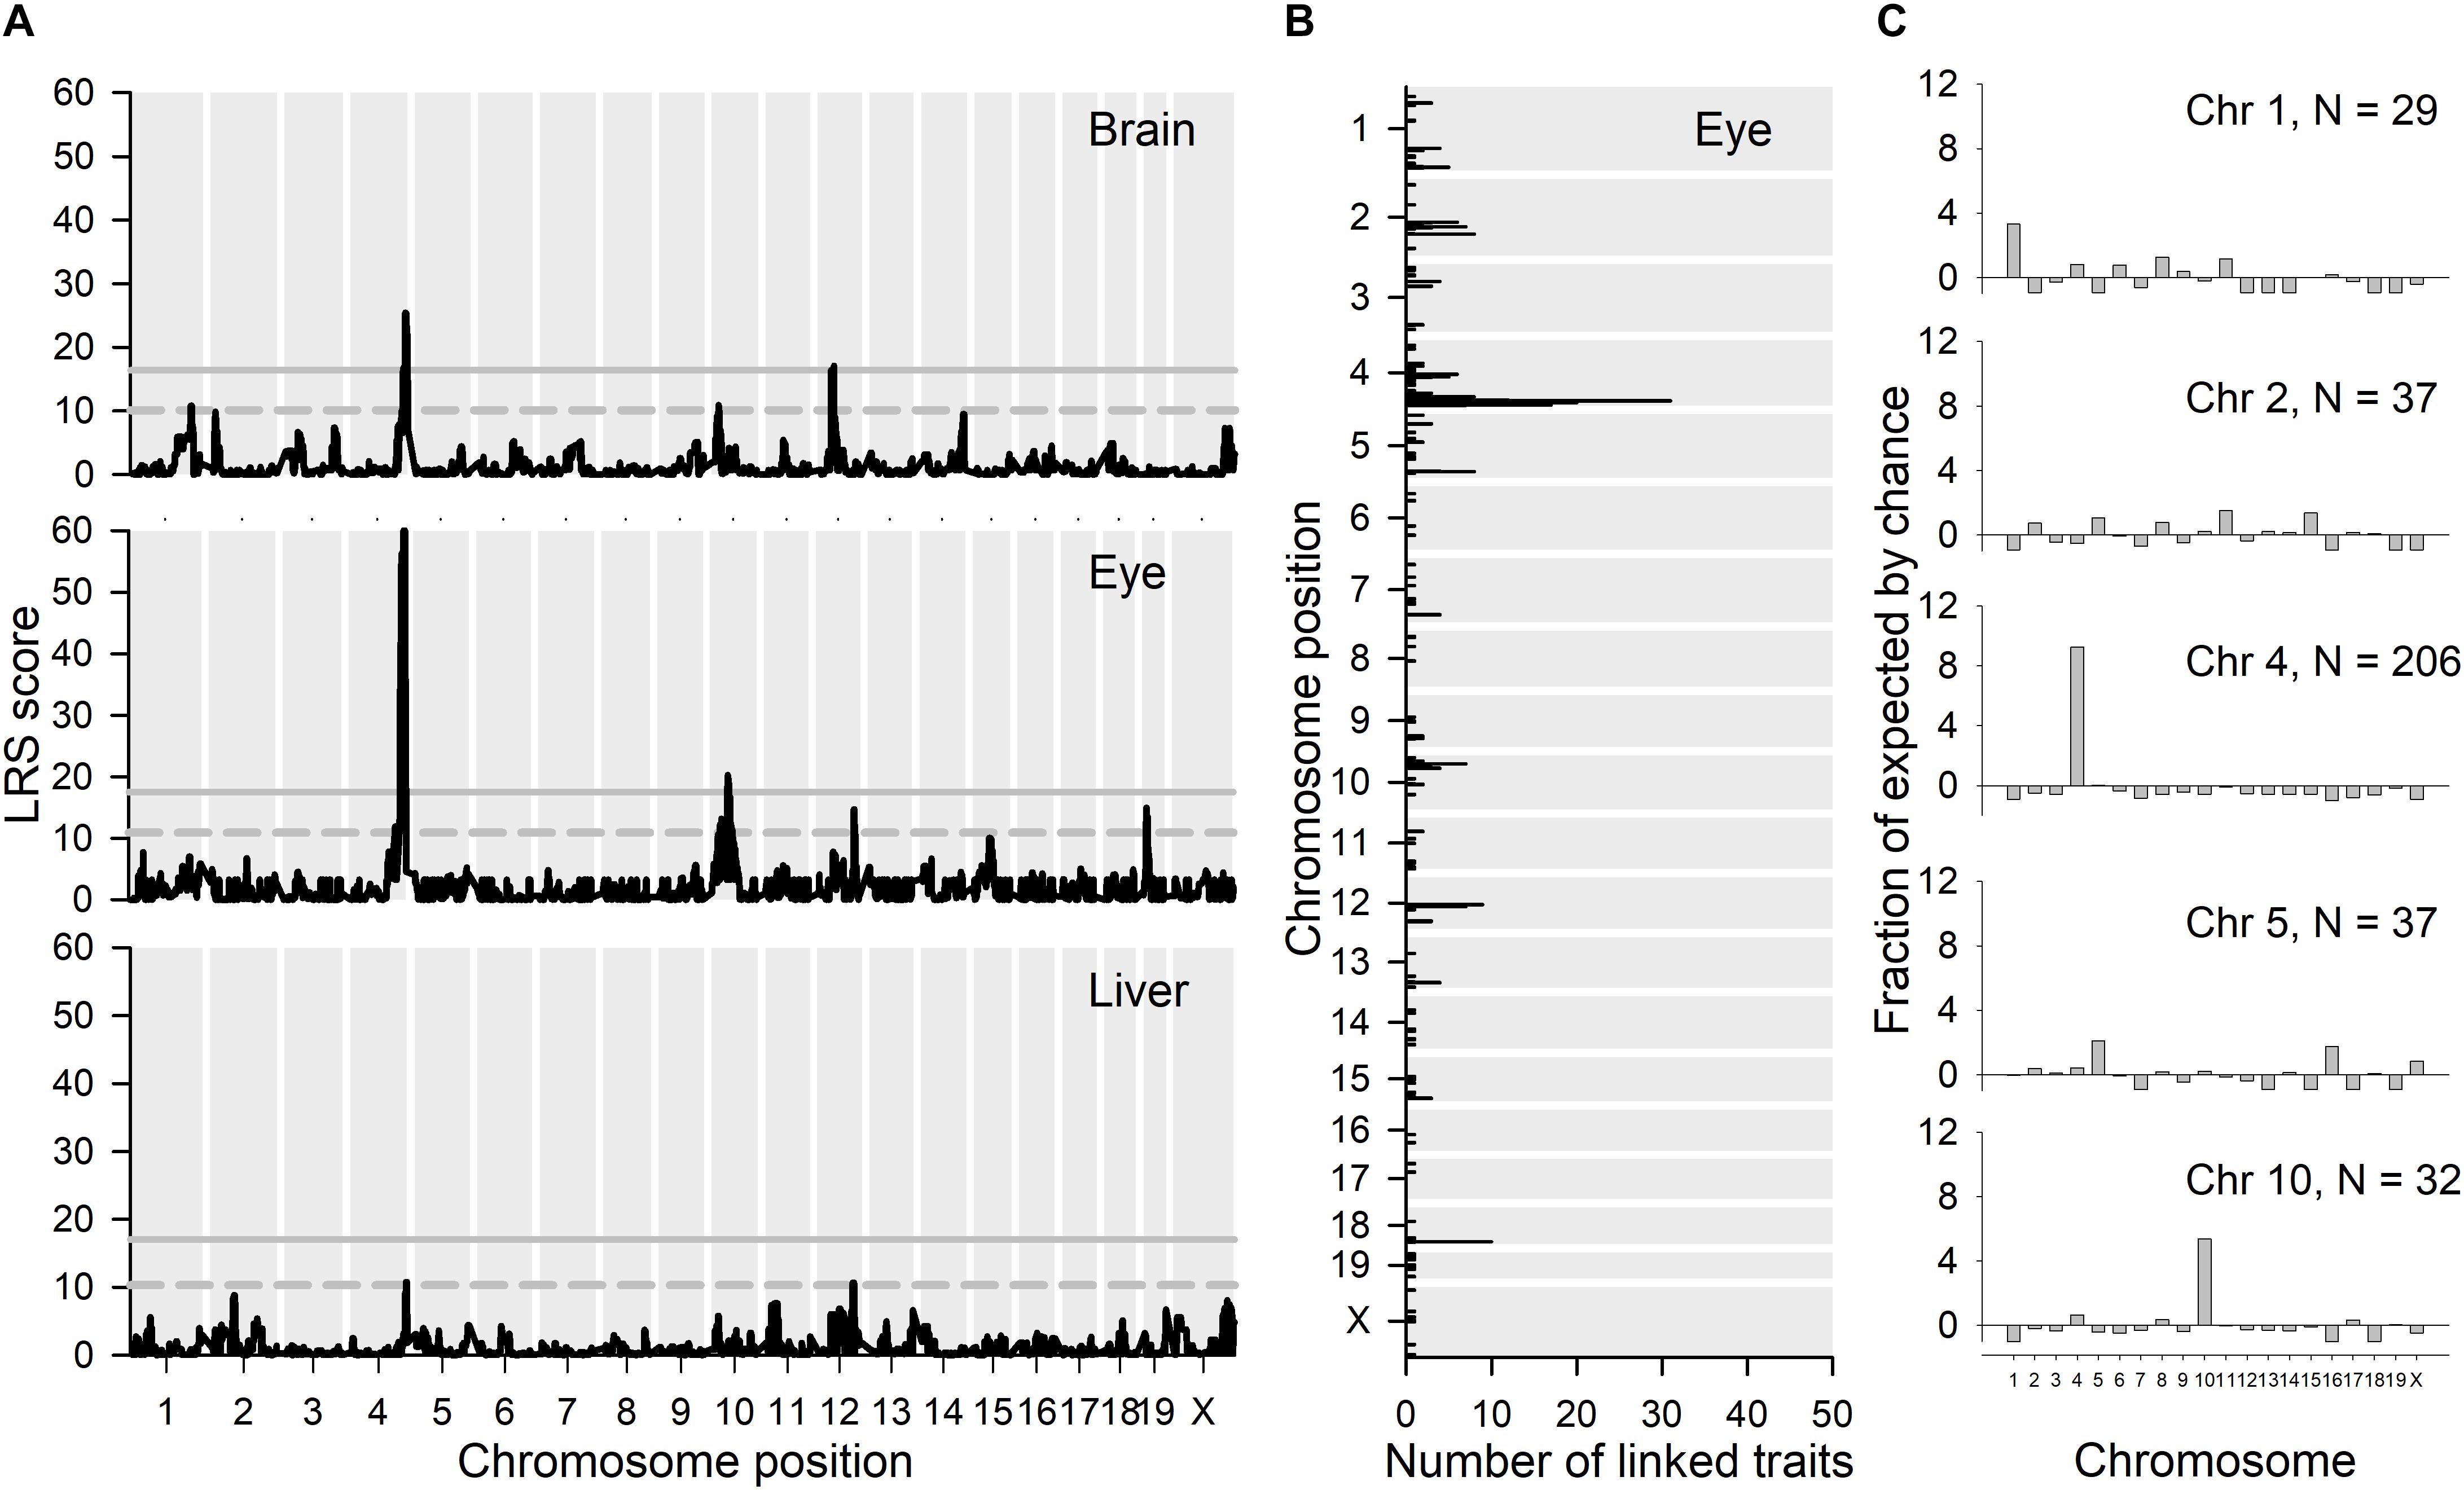
Figure 7. eQTL analyses. (A) GeneNetwork was used to map the chromosomal locations of likelihood ratio statistics (LRS scores) for genetic variation linked with Per3 expression (1421086_at) in brain, eye and liver using interval mapping. (B) The top 500 transcripts whose expression correlated with Per3 expression in eye were extracted and their maximal LRS and number of traits at each location are shown in the figure. (C) We then looked at the chromosomes that contain substantial enrichments of maximal expression linkage for the top 500 correlated mRNA transcripts shown in (B), and for each of those chromosomes we looked at which transcripts exhibit these maximal LRS locations. For each of the chromosomes that exhibit substantial maximal linkage, we show the proportional enrichment (fraction of expected, see section “Materials and Methods”) of linked transcripts for each chromosome in (C).
We next used the BXD gene expression datasets to identify genes whose expression showed a significant correlation with Per3 expression levels. The top 500 transcripts whose expression covaries with Per3 in the eye are listed in Supplementary Data File S6. In the LRS map for Per3 expression in the eye (Figure 7A), in addition to the main LRS peak at chromosome 4, there are also peaks that reach suggestive significance on chromosomes 10, 12, 15, and 19. However, many of the most significantly correlated transcripts from these analyses were also located in the same region at distal chromosome 4 surrounding Per3 (Figure 7B) and also had maximal LRS expression linkage scores with genetic variation in the same region of chromosome 4 (Figure 7C). Although the majority of the transcripts showed cis eQTL linkage, 19 of the top 100 transcripts had expression linkage at chromosome 4 but were physically located on other chromosomes, and four transcripts were located on chromosome 4 with linkage to other chromosomes. The P values for the correlations listed in Supplementary Data File S6 are non-corrected for multiple testing, but even when a recommended three orders of magnitude are subtracted from the P values, 96 of the top 100 correlations remain significant [see Supplementary Figure S2a for example of gene expression scatter plot for the highest ranked correlation apart from Per3 transcripts (Vamp3)].
In our transcriptomics data, Prdm16 was the most down-regulated transcript in both hypothalamic and eye tissue in Per3–/– mice. Several Prdm16 transcripts appear in the eye Per3 gene expression correlation list (Supplementary Data File S6). The Prdm16 transcript with the highest-ranking p value has a strong positive correlation with Per3 expression (Supplementary Figure S2b). While this agrees with our own transcriptome data (i.e., low levels of Per3 expression are associated with low levels of Prdm16 expression), it should be noted that other Prdm16 transcripts have negative correlations with Per3 expression.
The list of the top 500 transcripts whose expression covaried with Per3 in the eye was submitted to Webgestalt for GO analysis. This identified 322 unique coding genes which were enriched for many significant GO terms for biological processes and molecular functions that included kinase binding, ribonucleotide binding, response to light stimulus, positive regulation of gene expression, regulation of myelination, ubiquitin protein ligase binding, and regulation of cell cycle (see Supplementary Data File S7 for top 40). Several of these terms show overlap with the node clusters for the interaction network for differentially expressed genes in the hypothalamus, e.g., cell cycle, ubiquitination, translation (Figure 6). It should also be noted that the interaction network for differentially expressed genes in the eye contained two connected nodes for Mobp (myelin associated oligodendrocyte basic protein) and Mbp (myelin basic protein) (Figure 4). Although these two specific genes do not feature in the top 500 covarying genes from the BXD datasets, it nevertheless points to a potential overlap in the regulation of molecular function.
Discussion
In this study, we replicated the reduced negative masking behavioral phenotype that we had previously observed in the Per3–/– mice subjected to an ultradian light:dark cycle (van der Veen and Archer, 2010). We chose to use this behavioral difference between WT and Per3–/– mice to investigate the differential gene expression associated with the absence of a functional PER3 protein in eye and hypothalamic tissue within a light/dark protocol that we knew produced marked differential behavioral responses between WT and Per3–/– mice. However, we acknowledge that we cannot distinguish between differential gene expression induced by this protocol and any underlying differences in gene expression that may not be related to the protocol, which would have required a transcriptomic comparison at baseline LD 12:12 conditions. Nevertheless, we chose the protocol to maximize the opportunity to detect differential gene expression between the genotypes, which is what we report here.
Analyses of differentially expressed transcripts identified genes whose function were not related directly with circadian rhythms but more generally with functions such as transcription/translation, ubiquitination, cell cycle, and metabolism. More specific functions were related to olfaction, taste, lipid/fat regulation, ion channels and hormones and hormone receptors. Some of these have been implicated with sleep regulation and homeostasis and this agrees with our previous findings for differential expression in humanized mice expressing either the 4- or 5-repeat alleles for the human PER3 VNTR polymorphism. Genes of particular interest include those for prostaglandin endoperoxide synthase 2 (Ptgs2) and prostaglandin D2 receptor (Ptgdr), which has been linked with NREM sleep regulation (Oishi et al., 2015). Ptgs2 is also expressed together with the brain specific sleep-loss correlate Homer1a as part of the recovery mechanism from glutamate-induced neuronal hyperactivity (Maret et al., 2007). Polymorphisms in the adenosine receptor gene (Adora2a) affect sleep homeostasis (Retey et al., 2007) and interact with the PER3 VNTR polymorphism to determine cognitive performance during sleep restriction (Rupp et al., 2013). Growth hormone (Gh, Ghr), prolactin (Prl), and thyroid stimulating hormone (Tshb, Tshr) are all associated with sleep/wake regulation, e.g., prolactin and REM sleep (Machado et al., 2017), thyroid stimulating hormone and sleep deprivation (Pereira and Andersen, 2014), and relations between age-related growth hormone secretion and REM sleep (Van Cauter et al., 2000). The melatonin receptor Mtnr1a is differentially expressed in the hypothalamus and has links with circadian rhythms and also with exhaustion in shift workers (Sulkava et al., 2017), insomnia in schizophrenics (Park et al., 2011), and with Alzheimer’s (Sulkava et al., 2018). The human PER3 VNTR polymorphism has been linked with myelination and brain structure (Bollettini et al., 2017; Dewandre et al., 2018), and it is interesting that two genes associated with myelination (Mobp, Mbp) were differentially expressed in the eye.
We showed that the most down-regulated gene in both eye and hypothalamus in the Per3–/– mice was Prdm16 and, with qPCR, we observed reduced circadian rhythmicity of PRDM16 in conditions of constant darkness in the eye. Prdm16 is located close to Per3 on distal chromosome 4 and showed highly correlated levels of expression with Per3 in BXD lines. PRDM16 is a zinc finger transcription factor that regulates a range of developmental processes that include the neocortex (Inoue et al., 2017), cardiovascular system and hematopoiesis (Chi and Cohen, 2016), and brown fat development (Seale et al., 2007). PRDM16 influences brown fat development by regulating expression of uncoupling protein 1, Ucp1 (Iida et al., 2015), which was also differentially expressed in the hypothalamus. PRDM16 enhances Ucp1 gene expression via a direct interaction with a subunit (MED1) of the mediator component of the RNA polymerase II complex (Iida et al., 2015). This regulation by PRDM16 also involves interaction with thyroid hormones receptors at thyroid receptor elements in gene promoters (Iida et al., 2015), which is perhaps also relevant for the differential expression of Tshb and Tshr that we observed in our data. It has also been shown that binding of PRDM16 to MED1 alters chromatin structure and regulates the activity of super-enhancers that drive expression of co-regulated genes (Harms et al., 2014). Because PRDM16 was consistently down-regulated in both tissues, which was confirmed with qPCR and agreed with the BXD expression correlation data, we investigated if there was a body mass phenotype in the Per3–/– mice. We indeed found that Per3–/– mice accumulated less body mass than WT mice when fed on a high-fat diet from age 4 weeks. Previously it has been shown that Per3–/– mice (albeit on a different background and with different lighting conditions) accumulated more body mass than WT when fed a high-fat diet (Dallmann and Weaver, 2010). However, that was only apparent from age 20 weeks and the reduced body mass accumulation that we found in the Per3–/– mice agrees with data from younger mice in the previous study. Indeed, after 13 weeks in our study the difference in accumulated body mass gain is no longer significant and it is possible that with extended measurements we would have seen an increase in body mass accumulation in the Per3–/– mice compared to WT mice, as was observed in older mice in the previous study. Thus, the influence of PER3/PRDM16 on body mass accumulation seems to be age-dependent, but may also be strain dependent as has been noted for metabolic phenotypes in other clock gene knock outs (Johnston et al., 2009). It is also interesting to note that both our study and the previous one by Dallmann and Weaver observed reduced food intake in both genotypes in the high fat diet compared to normal diet, and also reduced food intake in Per3–/– mice compared to WT.
We found that there was a highly significant LRS linkage peak between Per3 expression and genetic variation at distal chromosome 4 and that the LRS peak width corresponded almost exactly with the region where we identified differentially expressed transcripts in the Per3–/– mice that colocalized around Per3. The only other core circadian clock gene to show a significant LRS peak for the BXD eye RNA dataset was Nr1d1 (Reverbα) but the LRS peak was located on chromosome 4 while Nr1d1 itself is on chromosome 11. There was a suggestive LRS peak for Clock at chromosome 1 that coincided exactly with the locations of Per2 and Hdac4. Apart from Per3, none of the other circadian clock genes were found to covary in expression with other genes located in the same chromosomal region. However, some of the other core clock genes did show corelated expression with other known clock elements, whereas Per3 did not. For example, the gene with expression most highly correlated with that of Arntl was Clock, and the fourth and seventh highest correlations were with Per2 and Dbp, respectively. Similarly, for Per2 the second and third highest expression correlations were with Tef and Dbp, respectively. Thus, unlike Per3, the expression of other clock genes is closely linked with the expression of other clock elements and not neighboring non-circadian genes. These observations are consistent with what we know about Per3 – it is a non-essential clock gene with many associated non-circadian phenotypes.
Previously, we created knock in mice homozygous for either the 4- or 5-repeat allele of the primate-specific human PER3 VNTR polymorphism (Hasan et al., 2014). We investigated differential gene expression in the hypothalamus in those mice after 12 h of sleep deprivation. We compared the lists of significantly differentially expressed genes from this and the previous experiment. From the Venn diagram in Supplementary Figure S3 (see also Supplementary Table S2 for lists of overlapping genes), we see that there is overlap between the lists for the KO eye and hypothalamus from this study but less overlap between those lists and the genes that were differentially expressed between the 4- and 5-repeat homozygous mice for the hypothalamus. It is also evident that there is little overlap between the KO eye and hypothalamus and the genes that covary with Per3 in the eye in the BXD mice, although there is more overlap between those BXD genes and the differentially expressed VNTR alleles. From this we can speculate that when Per3 is present in BXD mice, there is a set of genes colocalized at distal chromosome 4 whose expression is coregulated together with Per3. The absence of PER3 protein only directly affects the expression of a smaller number of genes in this region. Expression of Per3 with either the 4- or 5-repeat alleles affects the expression of a larger number of coregulated genes but again only a small subset of the BXD covarying genes. This implies that PER3 itself only directly influences a small subset of other genes in this coregulated chromosomal region.
All of the data that we have presented here are consistent with the hypothesis that much of the gene expression in the distal region of mouse chromosome 4 is co-regulated. Such chromosomal regions of transcriptional co-regulation have been shown to be related directly with chromatin architecture whereby chromosomal regions of closely interacting chromatin form distinguishable units called TADs. Control elements within TADs can enhance gene expression within the TAD and suppress gene expression in a neighboring TAD (Dixon et al., 2016). In mammals, neighboring TADs are often co-regulated in a super structure whereby connecting chromatin loops produce strong chromatin interaction between TADs, with neighboring TADs in either active or inactive expression states (Szabo et al., 2019). To investigate the possibility that distal chromosome 4 contains a co-regulated TAD neighborhood, we used a Hi-C browser (see section “Materials and Methods”) to show chromatin interaction and associated predicted TADs in a published mouse cortex Hi-C dataset (Dixon et al., 2012). The results confirm that there is indeed an island of three interacting TADs at distal mouse chromosome 4 that corresponds almost exactly with the region (149–157 Mb) where we identified a cluster of differentially expressed transcripts in mouse eye and hypothalamus in our data (Supplementary Figure S4). This also corresponds precisely with the position and width of the eQTL LRS peak for Per3 expression, and with the chromosomal position of genes whose expression in BXD lines significantly covaries with Per3 expression.
Topologically associating domain boundaries are defined by specific chromatin features including binding of protein elements such as CCCTC-binding factor (CTCF) and cohesion complex (Dixon et al., 2016). From the heatmap in Supplementary Figure S4b, it can be seen that Per3 is located very close to the boundary between two predicted neighboring TADs. The Per3 functional knock out mouse was created using a PGK-NEO cassette that replaced exon 3 and the intron between exon 3 and exon 4, introducing a stop codon in all three reading frames, resulting in undetectable levels of PER3 protein (Shearman et al., 2000). However, addition of the cassette increased the detectable size of the Per3 mRNA by 2 kb and expression levels of Per3 mRNA were significantly reduced in the suprachiasmatic nucleus and skeletal muscle, which is in line with our reduced expression for Per3 in the hypothalamus of Per3–/– mice. Thus, we cannot exclude the possibility that insertion of an extra 2 kb in the Per3 KO transgene has somehow altered chromatin architecture in this region and affected the TAD boundary dynamics, leading to altered regulation of local gene expression, including that of Per3 itself.
A similar TAD island is also present at the region of human chromosome 1 that is syntenic with mouse distal chromosome 4, where PER3 is also positioned at the boundary between two neighboring TADs. The human PER3 VNTR polymorphism is an insertion of only 54 bp in exon 19 (in the current human genome assembly GRCh38.p13) and rather than altering chromatin structure and TAD dynamics, it seems more likely that this coding-region polymorphism affects PER3 protein function which leads to the observed phenotypic associations (although the VNTR does overlap with a regulatory open chromatin mark). However, the human genome assembly also shows that the PER3 gene overlaps with a long non-coding RNA (lncRNA) transcript (lncZ98884.1-201) present on the opposite strand. The transcriptional start site of the lncRNA coincides with PER3 exon 18, where there is also an H3K27Ac histone acetylation mark and a DNaseI sensitivity site, which are both markers of chromatin modification and accessibility associated with regulatory elements at gene transcription start sites. Thus, transcription of the lncRNA could be affected by the adjacent PER3 VNTR. The function of this particular lncRNA is unknown, but lncRNAs mainly regulate transcription and translation and it is possible that this antisense transcript regulates PER3 expression in addition to other genes. The current mouse genome annotation does not include an antisense lncRNA within Per3 but this cannot be ruled out.
Some developmental diseases caused by chromosome abnormalities have been shown to disrupt TAD architecture that regulates developmental gene expression (e.g., F syndrome caused by an inversion on chromosome 2; see Lupianez et al., 2016, for review). Human 1p36 deletion syndrome is caused by a chromosomal deletion in a region of chromosome 1 that is syntentic with mouse distal chromosome 4. Developmental abnormalities include intellectual disability, brain anomalies, vision problems, hearing loss, facial anomalies, and heart defects (Jordan et al., 2015). Disruption to several genes has been associated with the syndrome, including PRDM16 and KCNAB2, which were differentially expressed in the present study. Thus, we hypothesize that 1p36 deletion disrupts the conserved TAD architecture in this region.
We and others have previously shown that PER3 associates with a wide range of non-circadian phenotypes. In this study, we have demonstrated that the functional knock out of Per3 led to changes in the expression of genes with functions related to those phenotypes. A significant number of the co-regulated genes also occur in close proximity to Per3 on distal chromosome 4, where eQTL analyses show there is a significant linkage peak that covers the same chromosomal location and many genes in that region show correlated expression with Per3 in BXD lines. Chromatin interaction analyses showed that this region is a TAD superdomain which explains the local co-regulation that we observed in both our data and the eQTL data. Thus, expression of Per3 (and human PER3 at syntenic chromosome 1) is co-regulated with a number of neighboring genes which presumably explains its association with a range of pleiotropic phenotypes. The links between these phenotypes and human disease underlines the relevance for a greater awareness of genetic variation and regulation in this chromosomal region.
Data Availability Statement
The datasets for this study can be found in the GEO database, under accession number GSE143650: https://www.ncbi.nlm.nih.gov/geo/query/acc.cgi?acc=GSE143650.
Ethics Statement
All experimental procedures were approved by the University of Surrey, Animal Ethics Committee and carried out under a United Kingdom Home Office License.
Author Contributions
DVdV, JJ, D-JD, and SA conceived the research and wrote the manuscript. DVdV, S-EB, and SA performed the research. DVdV, EL, and SA analyzed the data.
Funding
This research was supported by the United Kingdom Biotechnology and Biological Sciences Research Council (BB/E003672/1, BB/F022883, and BB/F020309/1).
Conflict of Interest
The authors declare that the research was conducted in the absence of any commercial or financial relationships that could be construed as a potential conflict of interest.
Supplementary Material
The Supplementary Material for this article can be found online at: https://www.frontiersin.org/articles/10.3389/fnmol.2020.00015/full#supplementary-material
Footnotes
- ^ genenetwork.org (accessed June 2019).
- ^ promoter.bx.psu.edu/hi-c
References
Alexander, M., Burch, J. B., Steck, S. E., Chen, C. F., Hurley, T. G., Cavicchia, P., et al. (2015). Case-control study of the PERIOD3 clock gene length polymorphism and colorectal adenoma formation. Oncol. Rep. 33, 935–941. doi: 10.3892/or.2014.3667
Archer, S. N., and Oster, H. (2015). How sleep and wakefulness influence circadian rhythmicity: effects of insufficient and mistimed sleep on the animal and human transcriptome. J. Sleep Res. 24, 476–493. doi: 10.1111/jsr.12307
Archer, S. N., Robilliard, D. L., Skene, D. J., Smits, M., Williams, A., Arendt, J., et al. (2003). A length polymorphism in the circadian clock gene Per3 is linked to delayed sleep phase syndrome and extreme diurnal preference. Sleep 26, 413–415. doi: 10.1093/sleep/26.4.413
Bae, K., Jin, X., Maywood, E. S., Hastings, M. H., Reppert, S. M., and Weaver, D. R. (2001). Differential functions of mPer1, mPer2, and mPer3 in the SCN circadian clock. Neuron 30, 525–536. doi: 10.1016/s0896-6273(01)00302-6
Baizabal, J. M., Mistry, M., Garcia, M. T., Gomez, N., Olukoya, O., Tran, D., et al. (2018). The epigenetic state of PRDM16-regulated enhancers in radial glia controls cortical neuron position. Neuron 99, 239–241. doi: 10.1016/j.neuron.2018.06.031
Bass, J., and Takahashi, J. S. (2010). Circadian integration of metabolism and energetics. Science 330, 1349–1354. doi: 10.1126/science.1195027
Benedetti, F., Dallaspezia, S., Colombo, C., Pirovano, A., Marino, E., and Smeraldi, E. (2008). A length polymorphism in the circadian clock gene Per3 influences age at onset of bipolar disorder. Neurosci. Lett. 445, 184–187. doi: 10.1016/j.neulet.2008.09.002
Bennett, B. J., Farber, C. R., Orozco, L., Kang, H. M., Ghazalpour, A., Siemers, N., et al. (2010). A high-resolution association mapping panel for the dissection of complex traits in mice. Genome Res. 20, 281–290. doi: 10.1101/gr.099234.109
Bollettini, I., Melloni, E. M., Aggio, V., Poletti, S., Lorenzi, C., Pirovano, A., et al. (2017). Clock genes associate with white matter integrity in depressed bipolar patients. Chronobiol. Int. 34, 212–224. doi: 10.1080/07420528.2016.1260026
Chellappa, S. L., Viola, A. U., Schmidt, C., Bachmann, V., Gabel, V., Maire, M., et al. (2012). Human melatonin and alerting response to blue-enriched light depend on a polymorphism in the clock gene PER3. J. Clin. Endocrinol. Metab. 97, E433–E437. doi: 10.1210/jc.2011-2391
Chi, J., and Cohen, P. (2016). The multifaceted roles of PRDM16: adipose biology and beyond. Trends Endocrinol. Metab. 27, 11–23. doi: 10.1016/j.tem.2015.11.005
Dallmann, R., and Weaver, D. R. (2010). Altered body mass regulation in male mPeriod mutant mice on high-fat diet. Chronobiol. Int. 27, 1317–1328. doi: 10.3109/07420528.2010.489166
Davidson, A. J., Sellix, M. T., Daniel, J., Yamazaki, S., Menaker, M., and Block, G. D. (2006). Chronic jet-lag increases mortality in aged mice. Curr. Biol. 16, R914–R916.
Dewandre, D., Atienza, M., Sanchez-Espinosa, M. P., and Cantero, J. L. (2018). Effects of PER3 clock gene polymorphisms on aging-related changes of the cerebral cortex. Brain Struct. Funct. 223, 597–607. doi: 10.1007/s00429-017-1513-0
Dixon, J. R., Gorkin, D. U., and Ren, B. (2016). Chromatin domains: the unit of chromosome organization. Mol. Cell 62, 668–680. doi: 10.1016/j.molcel.2016.05.018
Dixon, J. R., Selvaraj, S., Yue, F., Kim, A., Li, Y., Shen, Y., et al. (2012). Topological domains in mammalian genomes identified by analysis of chromatin interactions. Nature 485, 376–380. doi: 10.1038/nature11082
Groeger, J. A., Viola, A. U., Lo, J. C., von Schantz, M., Archer, S. N., and Dijk, D. J. (2008). Early morning executive functioning during sleep deprivation is compromised by a PERIOD3 polymorphism. Sleep 31, 1159–1167.
Guess, J., Burch, J. B., Ogoussan, K., Armstead, C. A., Zhang, H., Wagner, S., et al. (2009). Circadian disruption, Per3, and human cytokine secretion. Integr. Cancer Ther. 8, 329–336. doi: 10.1177/1534735409352029
Harms, M. J., Ishibashi, J., Wang, W., Lim, H. W., Goyama, S., Sato, T., et al. (2014). Prdm16 is required for the maintenance of brown adipocyte identity and function in adult mice. Cell Metab. 19, 593–604. doi: 10.1016/j.cmet.2014.03.007
Hasan, S., van der Veen, D. R., Winsky-Sommerer, R., Dijk, D. J., and Archer, S. N. (2011). Altered sleep and behavioral activity phenotypes in PER3-deficient mice. Am. J. Physiol. Regul. Integr. Comp. Physiol. 301, R1821–R1830. doi: 10.1152/ajpregu.00260.2011
Hasan, S., van der Veen, D. R., Winsky-Sommerer, R., Hogben, A., Laing, E. E., Koentgen, F., et al. (2014). A human sleep homeostasis phenotype in mice expressing a primate-specific PER3 variable-number tandem-repeat coding-region polymorphism. FASEB J. 28, 2441–2454. doi: 10.1096/fj.13-240135
Iida, S., Chen, W., Nakadai, T., Ohkuma, Y., and Roeder, R. G. (2015). PRDM16 enhances nuclear receptor-dependent transcription of the brown fat-specific Ucp1 gene through interactions with Mediator subunit MED1. Genes Dev. 29, 308–321. doi: 10.1101/gad.252809.114
Inoue, M., Iwai, R., Tabata, H., Konno, D., Komabayashi-Suzuki, M., Watanabe, C., et al. (2017). Prdm16 is crucial for progression of the multipolar phase during neural differentiation of the developing neocortex. Development 144, 385–399. doi: 10.1242/dev.136382
Johnston, J. D., Frost, G., and Otway, D. T. (2009). Adipose tissue, adipocytes and the circadian timing system. Obes. Rev. 10(Suppl. 2), 52–60. doi: 10.1111/j.1467-789x.2009.00665.x
Jordan, V. K., Zaveri, H. P., and Scott, D. A. (2015). 1p36 deletion syndrome: an update. Appl. Clin. Genet. 8, 189–200. doi: 10.2147/TACG.S65698
Karthikeyan, R., Marimuthu, G., Ramasubramanian, C., Arunachal, G., BaHammam, A. S., Spence, D. W., et al. (2014a). Association of Per3 length polymorphism with bipolar I disorder and schizophrenia. Neuropsychiatr. Dis. Treat. 10, 2325–2330. doi: 10.2147/NDT.S73765
Karthikeyan, R., Marimuthu, G., Sooriyakumar, M., BaHammam, A. S., Spence, D. W., Pandi-Perumal, S. R., et al. (2014b). Per3 length polymorphism in patients with type 2 diabetes mellitus. Horm. Mol. Biol. Clin. Investig. 18, 145–149. doi: 10.1515/hmbci-2013-0049
Kolbe, I., and Oster, H. (2019). Chronodisruption, metabolic homeostasis, and the regulation of inflammation in adipose tissues. Yale J. Biol. Med. 92, 317–325.
Laing, E., and Smith, C. P. (2010). RankProdIt: a web-interactive Rank Products analysis tool. BMC Res. Notes 3:221. doi: 10.1186/1756-0500-3-221
Lazar, A. S., Slak, A., Lo, J. C., Santhi, N., von Schantz, M., Archer, S. N., et al. (2012). Sleep, diurnal preference, health, and psychological well-being: a prospective single-allelic-variation study. Chronobiol. Int. 29, 131–146. doi: 10.3109/07420528.2011.641193
Liao, Y., Wang, J., Jaehnig, E. J., Shi, Z., and Zhang, B. (2019). WebGestalt 2019: gene set analysis toolkit with revamped UIs and APIs. Nucleic Acids Res. 47, W199–W205. doi: 10.1093/nar/gkz401
Lo, J. C., Groeger, J. A., Santhi, N., Arbon, E. L., Lazar, A. S., Hasan, S., et al. (2012). Effects of partial and acute total sleep deprivation on performance across cognitive domains, individuals and circadian phase. PLoS One 7:e45987. doi: 10.1371/journal.pone.0045987
Lupianez, D. G., Spielmann, M., and Mundlos, S. (2016). Breaking TADs: how alterations of chromatin domains result in disease. Trends Genet. 32, 225–237. doi: 10.1016/j.tig.2016.01.003
Machado, R. B., Rocha, M. R., and Suchecki, D. (2017). Brain prolactin is involved in stress-induced REM sleep rebound. Horm. Behav. 89, 38–47. doi: 10.1016/j.yhbeh.2016.12.004
Maret, S., Dorsaz, S., Gurcel, L., Pradervand, S., Petit, B., Pfister, C., et al. (2007). Homer1a is a core brain molecular correlate of sleep loss. Proc. Natl. Acad. Sci. U.S.A. 104, 20090–20095. doi: 10.1073/pnas.0710131104
Mulligan, M. K., Mozhui, K., Prins, P., and Williams, R. W. (2017). GeneNetwork: a toolbox for systems genetics. Methods Mol. Biol. 1488, 75–120. doi: 10.1007/978-1-4939-6427-7_4
Oishi, Y., Yoshida, K., Scammell, T. E., Urade, Y., Lazarus, M., and Saper, C. B. (2015). The roles of prostaglandin E2 and D2 in lipopolysaccharide-mediated changes in sleep. Brain Behav. Immun. 47, 172–177. doi: 10.1016/j.bbi.2014.11.019
Park, H. J., Park, J. K., Kim, S. K., Cho, A. R., Kim, J. W., Yim, S. V., et al. (2011). Association of polymorphism in the promoter of the melatonin receptor 1A gene with schizophrenia and with insomnia symptoms in schizophrenia patients. J. Mol. Neurosci. 45, 304–308. doi: 10.1007/s12031-011-9522-6
Paxinos, G., and Franklin, K. B. J. (2001). The Mouse Brain in Stereotaxic Coordinates. Cambridge, MA: Academic Press.
Pendergast, J. S., Niswender, K. D., and Yamazaki, S. (2012). Tissue-specific function of Period3 in circadian rhythmicity. PLoS One 7:e30254. doi: 10.1371/journal.pone.0030254
Pereira, J. C. Jr., and Andersen, M. L. (2014). The role of thyroid hormone in sleep deprivation. Med. Hypotheses 82, 350–355. doi: 10.1016/j.mehy.2014.01.003
Ramanathan, C., Xu, H., Khan, S. K., Shen, Y., Gitis, P. J., Welsh, D. K., et al. (2014). Cell type-specific functions of period genes revealed by novel adipocyte and hepatocyte circadian clock models. PLoS Genet. 10:e1004244. doi: 10.1371/journal.pgen.1004244
Retey, J. V., Adam, M., Khatami, R., Luhmann, U. F., Jung, H. H., Berger, W., et al. (2007). A genetic variation in the adenosine A2A receptor gene (ADORA2A) contributes to individual sensitivity to caffeine effects on sleep. Clin. Pharmacol. Ther. 81, 692–698. doi: 10.1038/sj.clpt.6100102
Rupp, T. L., Wesensten, N. J., Newman, R., and Balkin, T. J. (2013). PER3 and ADORA2A polymorphisms impact neurobehavioral performance during sleep restriction. J. Sleep Res. 22, 160–165. doi: 10.1111/j.1365-2869.2012.01062.x
Saba, L., Bhave, S. V., Grahame, N., Bice, P., Lapadat, R., Belknap, J., et al. (2006). Candidate genes and their regulatory elements: alcohol preference and tolerance. Mamm. Genome 17, 669–688. doi: 10.1007/s00335-005-0190-0
Samblas, M., Milagro, F. I., Mansego, M. L., Marti, A., and Martinez, J. A. (2018). PTPRS and PER3 methylation levels are associated with childhood obesity: results from a genome-wide methylation analysis. Pediatr. Obes. 13, 149–158. doi: 10.1111/ijpo.12224
Seale, P., Kajimura, S., Yang, W., Chin, S., Rohas, L. M., Uldry, M., et al. (2007). Transcriptional control of brown fat determination by PRDM16. Cell Metab. 6, 38–54. doi: 10.1016/j.cmet.2007.06.001
Shearman, L. P., Jin, X., Lee, C., Reppert, S. M., and Weaver, D. R. (2000). Targeted disruption of the mPer3 gene: subtle effects on circadian clock function. Mol. Cell. Biol. 20, 6269–6275. doi: 10.1128/mcb.20.17.6269-6275.2000
Sulkava, S., Muggalla, P., Sulkava, R., Ollila, H. M., Peuralinna, T., Myllykangas, L., et al. (2018). Melatonin receptor type 1A gene linked to Alzheimer’s disease in old age. Sleep 41:zsy103. doi: 10.1093/sleep/zsy103
Sulkava, S., Ollila, H. M., Alasaari, J., Puttonen, S., Harma, M., Viitasalo, K., et al. (2017). Common genetic variation near melatonin receptor 1A gene linked to job-related exhaustion in shift workers. Sleep 40:zsw011. doi: 10.1093/sleep/zsw011
Szabo, Q., Bantignies, F., and Cavalli, G. (2019). Principles of genome folding into topologically associating domains. Sci. Adv. 5:eaaw1668. doi: 10.1126/sciadv.aaw1668
Van Cauter, E., Leproult, R., and Plat, L. (2000). Age-related changes in slow wave sleep and REM sleep and relationship with growth hormone and cortisol levels in healthy men. JAMA 284, 861–868.
van der Veen, D. R., and Archer, S. N. (2010). Light-dependent behavioral phenotypes in PER3-deficient mice. J. Biol. Rhythms 25, 3–8. doi: 10.1177/0748730409356680
Vandewalle, G., Archer, S. N., Wuillaume, C., Balteau, E., Degueldre, C., Luxen, A., et al. (2009). Functional magnetic resonance imaging-assessed brain responses during an executive task depend on interaction of sleep homeostasis, circadian phase, and PER3 genotype. J. Neurosci. 29, 7948–7956. doi: 10.1523/JNEUROSCI.0229-09.2009
Vandewalle, G., Archer, S. N., Wuillaume, C., Balteau, E., Degueldre, C., Luxen, A., et al. (2011). Effects of light on cognitive brain responses depend on circadian phase and sleep homeostasis. J. Biol. Rhythms 26, 249–259. doi: 10.1177/0748730411401736
Viola, A. U., Archer, S. N., James, L. M., Groeger, J. A., Lo, J. C., Skene, D. J., et al. (2007). PER3 polymorphism predicts sleep structure and waking performance. Curr. Biol. 17, 613–618. doi: 10.1016/j.cub.2007.01.073
Viola, A. U., Chellappa, S. L., Archer, S. N., Pugin, F., Gotz, T., Dijk, D. J., et al. (2012). Interindividual differences in circadian rhythmicity and sleep homeostasis in older people: effect of a PER3 polymorphism. Neurobiol. Aging 33, 1010.e17–1010.e27. doi: 10.1016/j.neurobiolaging.2011.10.024
Wirth, M., Burch, J., Violanti, J., Burchfiel, C., Fekedulegn, D., Andrew, M., et al. (2013). Association of the Period3 clock gene length polymorphism with salivary cortisol secretion among police officers. Neuro Endocrinol. Lett. 34, 27–37.
Xiao, Y., Hsiao, T. H., Suresh, U., Chen, H. I., Wu, X., Wolf, S. E., et al. (2014). A novel significance score for gene selection and ranking. Bioinformatics 30, 801–807. doi: 10.1093/bioinformatics/btr671
Zeng, H. C., Bae, Y., Dawson, B. C., Chen, Y., Bertin, T., Munivez, E., et al. (2017). MicroRNA miR-23a cluster promotes osteocyte differentiation by regulating TGF-beta signalling in osteoblasts. Nat. Commun. 8:15000. doi: 10.1038/ncomms15000
Zhang, B., Kirov, S., and Snoddy, J. (2005). WebGestalt: an integrated system for exploring gene sets in various biological contexts. Nucleic Acids Res. 33, W741–W748.
Keywords: mouse, circadian, topological associating domain, metabolism, transcriptome
Citation: Van der Veen DR, Laing EE, Bae S-E, Johnston JD, Dijk D-J and Archer SN (2020) A Topological Cluster of Differentially Regulated Genes in Mice Lacking PER3. Front. Mol. Neurosci. 13:15. doi: 10.3389/fnmol.2020.00015
Received: 22 August 2019; Accepted: 20 January 2020;
Published: 13 February 2020.
Edited by:
Shin Yamazaki, UT Southwestern Medical Center, United StatesReviewed by:
Roberto Refinetti, Boise State University, United StatesHan Wang, Soochow University, China
Copyright © 2020 Van der Veen, Laing, Bae, Johnston, Dijk and Archer. This is an open-access article distributed under the terms of the Creative Commons Attribution License (CC BY). The use, distribution or reproduction in other forums is permitted, provided the original author(s) and the copyright owner(s) are credited and that the original publication in this journal is cited, in accordance with accepted academic practice. No use, distribution or reproduction is permitted which does not comply with these terms.
*Correspondence: Simon N. Archer, simon.archer@surrey.ac.uk