Integrated Metabolomics and Proteomics Analysis Reveals Plasma Lipid Metabolic Disturbance in Patients With Parkinson’s Disease
 Ling Hu1,2† Mei-Xue Dong2† Yan-Ling Huang3† Chang-Qi Lu1† Qian Qian1† Chun-Cheng Zhang4 Xiao-Min Xu5 Yang Liu1 Guang-Hui Chen2
  You-Dong Wei1*
- 1Department of Neurology, The First Affiliated Hospital of Chongqing Medical University, Chongqing, China
- 2Department of Neurology, Renmin Hospital of Wuhan University, Hubei General Hospital, Wuhan, China
- 3Department of Neurology, Chongqing University Central Hospital, Chongqing Emergency Medical Center, Chongqing, China
- 4Department of Neurology, The People’s Hospital of Tongliang District, Chongqing, China
- 5Department of Neurology, The Affiliated Hospital of Southwest Medical University, Luzhou, China
Parkinson’s disease (PD) is a common neurodegenerative disease in the elderly with a pathogenesis that remains unclear. We aimed to explore its pathogenesis through plasma integrated metabolomics and proteomics analysis. The clinical data of consecutively recruited PD patients and healthy controls were assessed. Fasting plasma samples were obtained and analyzed using metabolomics and proteomics methods. After that, differentially expressed metabolites and proteins were identified for further bioinformatics analysis. No significant difference was found in the clinical data between these two groups. Eighty-three metabolites were differentially expressed in PD patients identified by metabolomics analysis. These metabolites were predominately lipid and lipid-like molecules (63%), among which 25% were sphingolipids. The sphingolipid metabolism pathway was enriched and tended to be activated in the following KEGG pathway analysis. According to the proteomics analysis, forty proteins were identified to be differentially expressed, seven of which were apolipoproteins. Furthermore, five of the six top ranking Gene Ontology terms from cellular components and eleven of the other fourteen Gene Ontology terms from biological processes were directly associated with lipid metabolism. In KEGG pathway analysis, the five enriched pathways were also significantly related with lipid metabolism (p < 0.05). Overall, Parkinson’s disease is associated with plasma lipid metabolic disturbance, including an activated sphingolipid metabolism and decreased apolipoproteins.
Introduction
Parkinson’s disease (PD) is a common neurodegenerative disease and is expected to affect 14.2 million people worldwide by 2040 (Dorsey and Bloem, 2018). Its typical clinical features are motor symptoms, which result from accumulated Lewy bodies and the remarkable death of dopaminergic neurons in the substantia nigra pars compacta (SNpc). In addition, Parkinson’s disease is correlated with many non-motor symptoms, some of which even precede the motor symptoms by more than 10 years, including constipation, hyposmia, anxiety, depression, and rapid eye movement sleep behavior disorder (Emamzadeh and Surguchov, 2018). These non-motor symptoms are probably due to the disturbance of various neurotransmitters and multiple nerve systems in addition to the dopaminergic neurons in the SNpc (Lv and Ae, 2015). Most idiopathic PD patients are sporadic, and various environmental exposures have been identified as being correlated with the development of PD. Results of genome-wide association studies have also identified 90 independent mutations in more than 20 genes that increase risk factors for Parkinson’s disease (Blauwendraat et al., 2019). Therein, the strongest genetic risk factor is the Asn370Ser mutation of β-glucocerebrosidase, with an odds ratio greater than 5 (Sidransky et al., 2009). The interactions between environmental and genetic risk factors are still under investigation.
Drugs that increase intracerebral dopamine levels or directly stimulate dopamine receptors remain as the most common forms of treatment for PD patients (Connolly and Lang, 2014). These drugs are mainly for symptomatic treatment without neuroprotection or a so-called disease-modifying function. Researchers have found that mitochondrial oxidative stress and inflammation reaction play important roles in the apoptosis of dopaminergic neurons during the occurrence and development of Parkinson’s disease (Wei et al., 2018). However, drugs targeting oxidative stress have exhibited little therapeutic benefit (Trist et al., 2019). Research also indicates that Parkinson’s disease is related to the dysregulation of protein homeostasis, including intracellular and membrane protein trafficking, protein aggregation, and protein degradation by the ubiquitin-proteasome or lysosome-autophagy systems (Deng et al., 2018). Thus, the potential pathogenesis should be clarified and more effective disease-modifying treatments are urgently needed for PD patients.
Metabolomics is a comprehensive assessment of the total endogenous metabolites in a biological system, and proteomics can evaluate alterations at the protein level (Mostafa et al., 2016). These omics data can help researchers make many discoveries in the alteration of molecules and metabolic pathways following gene expression in PD patients. Plasma is an easily obtainable, non-invasive, and informative biofluid from patients, making it perfect to explore the pathogenesis of many neuropsychiatric disorders (Hu et al., 2016). Herein, we employed untargeted metabolomics and proteomics analysis to identify molecular changes in PD patients. Furthermore, an integrated bioinformatic analysis was performed to explore the probable pathogenesis of PD based on the above findings (Dong et al., 2018a).
Materials and Methods
Objects
Parkinson’s disease patients were consecutively recruited from April 2016 to February 2017 in the Department of Neurology, the First Affiliated Hospital of Chongqing Medical University, according to the criteria reported in a previous research (Dong et al., 2017b). The inclusion criteria was: (i) PD patients diagnosed using the European Federation of Neurological Societies and the International Parkinson Movement Disorder Society’s European Section (Berardelli et al., 2013), and (ii) patients only taking dopamine analogs or dopamine receptor agonists. The exclusion criteria was: (i) those with secondary Parkinson’s disease or Parkinson-plus syndrome; (ii) patients suffering from tumor, heart failure, chronic obstructive pulmonary disease, nephritis, infectious diseases, or any other severe chronic disease at the time of enrollment; and (iii) any history of stroke, brain surgery, head trauma, motor neuro disease, Alzheimer’s disease, or mental diseases.
A same amount of age- and sex-matched healthy controls (HCs) were included from the Department of Physical Examination. The controls were also without any history of illness in the central nervous system or suffering from any other severe disease. This study was approved by the ethics committee of the First Affiliated Hospital of Chongqing Medical University and performed in accordance with the Declaration of Helsinki. Informed consent was obtained from all individual participants included in the study. Clinical data, metabolomics analysis, and proteomics analysis were blindly assessed or performed (Dong et al., 2017a).
Clinical Data
The clinical data of all included participants were collected. Fasting plasma samples were obtained with an EDTA-K2 tube in the morning, and then stored at -80°C until experimental analysis. All the clinical scales were assessed by experienced neurologists. Statistical analyses were performed using Statistic Package for the Social Sciences 22.0 (IBM, Armonk, NY, United States). Categorical data are exhibited as absolute numbers while continuous data are exhibited as mean ± standard error. All the clinical data were compared between PD and HC groups using Pearson Chi-squared tests or Fisher exact tests for categorical data and Mann–Whitney U-tests with Bonferroni post hoc tests for continuous data, as appropriate (Dong et al., 2016).
Metabolomics Analysis
We adopted a Waters UPLC I-class system equipped with a binary solvent delivery manager (Waters Corporation, Milford, United States) to perform the untargeted liquid chromatography-mass spectrometry-based metabolomics (thirty-six objects per group); the detailed procedure was described in a previous research (Dong et al., 2018a). After that, data sets including m/z, peak retention time, and peak intensity of each ion were obtained. The m/z-peak retention time pairs were used to identify each ion based on Metlin1 and Human Metabolome Database (HMDB)2 while the peak intensity was deemed as the level of a metabolite. The data sets were further reduced by removing any peaks with a missing value in more than 60% of the total samples.
The positive and negative peak data were merged and multivariate statistical analyses were performed by the SIMCA-P 13.0 software package (Umetrics, Umeå, Sweden). The partial least squares-discriminant analysis (PLS-DA) model was constructed to show statistical differences and identify metabolites differentially expressed between PD patients and healthy controls, and this model was further validated by a permutation test with 200 iterations. Metabolites with variable influence on projection values (obtained from the PLS-DA model) of greater than 1.0, fold change values of greater than ±2, and p-values of less than 0.05 (Dong et al., 2018b) were identified to be differentially expressed. These differentially expressed metabolites were then classified by chemical taxonomy based on the HMDB database, and metabolic pathway analysis was further performed by MetaboAnalyst 4.03 (Chong et al., 2018).
Proteomics Analysis
The plasma of twenty-seven randomized healthy controls and thirty randomized PD patients were merged into three pooled samples for proteomics analysis. The details of the proteomics analysis have also been depicted previously (Dong et al., 2018a). Afterward, tandem mass spectrometry spectra were obtained and searched using the MASCOT engine 2.2 (Matrix Science, London, United Kingdom). The differentially expressed proteins were recognized by fold change values of greater than ±1.2 and p-values of less than 0.05. Gene ontology (GO) enrichment from cellular component, molecular function, and biological process, and Kyoto Encyclopedia of Genes and Genomes (KEGG) pathway enrichment analyses were performed by Fisher’s exact test, considering the whole quantified protein annotations as the background data set. The obtained p-values from enrichment analysis was further converted into q-value using Benjamini-Hochberg correction and a q-value less than 0.05 was considered significant (Hochberg and Benjamini, 1990).
Results
Results of the Metabolomics Analysis
Thirty-six PD patients and healthy controls were separately included in the metabolomics analysis. The clinical data of these participants are shown in Table 1. No significant differences were observed between these two groups, including the levels of hemoglobin A1C (HbA1C) and blood lipid, or the incidences of diabetes mellitus and hypercholesterolemia. The mean UPDRS score and Hoehn–Yahr score of these PD patients were 41.11 ± 3.72 and 2.26 ± 0.17, respectively.
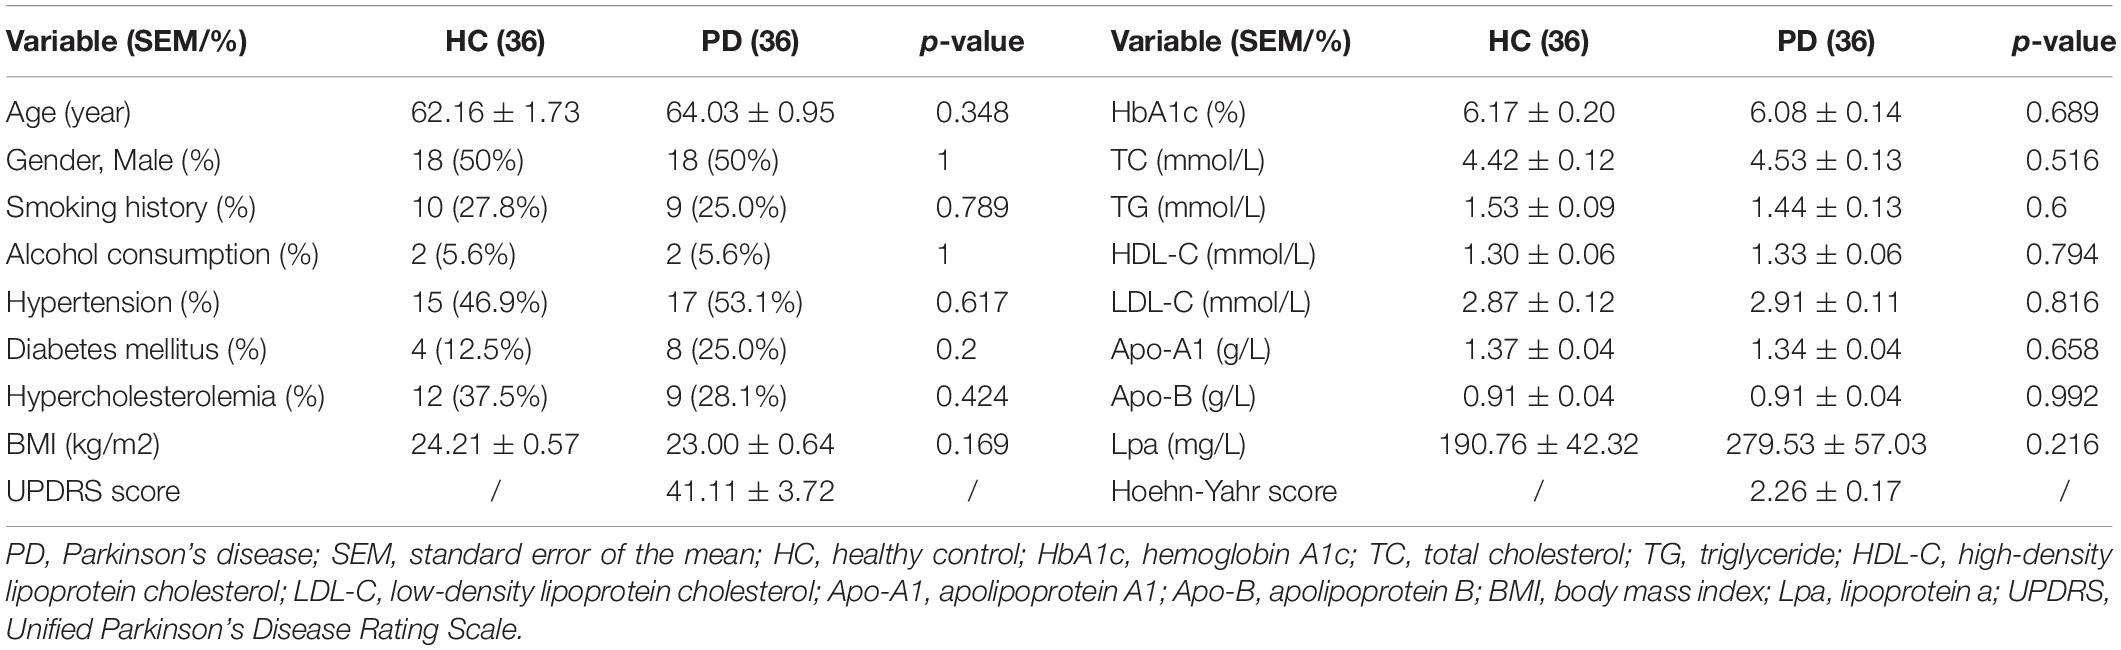
Table 1. Clinical data of PD patients and healthy controls included in the untargeted liquid chromatography-mass spectrometry-based metabolomics analysis.
After excluding internal standards, 6040 positive and 4363 negative peaks were detected in almost 98.81% of samples on average (Supplementary Table S1). Based on the above peaks, the PLS-DA score plot showed a significant difference between the PD and HC groups (R2X = 0.132, R2Y = 0.374, Q2 = 0.2) (Figure 1A). A permutation test with 200 iterations was performed and confirmed that the PLS-DA model was valid and not over-fitted because the original right R2 and Q2 values were observably higher than the corresponding permutated left values [R2 = (0.0, 0.746), Q2 = (0.0, -0.198)] (Figure 1B). According to the above results, eighty-three metabolites were differentially expressed between these two groups (Table 2). Of these, 63% were lipid and lipid-like molecules, 13% were organic acids and derivatives, 6% were phenylpropanoids and polyketides, 5% were organic oxygen compounds, 5% were organoheterocyclic compounds, 4% were benzenoids, 2% were nucleosides, nucleotides, and analogs, 1% was homogeneous non-metal compounds, and 1% was organosulfur compounds (Figure 1C). The lipid and lipid-like molecules were further categorized into sphingolipids (25%), glycerophospholipids (16%), glycerolipids (17%), fatty acyls (15%), prenol lipids (15%), and steroids and steroid derivatives (12%) (Figure 1D). These sphingolipids were ganglioside GD3 (d18:0/18:0), PS[15:0/20:4(8Z,11Z,14Z,17Z)], camellianin D, ceramide (d18:1/16:0), adrenorphin, ganglioside GD1a (d18:0/22:0), SM(d18:0/24:1(15Z)(OH)), thiamine(1+) diphosphate(1-), N-docosahexaenoyl phenylalanine, ganglioside GA2 (d18:1/12:0), SM(d18:0/22:0), glucosylceramide (d18:1/18:0), and AS 1–5.
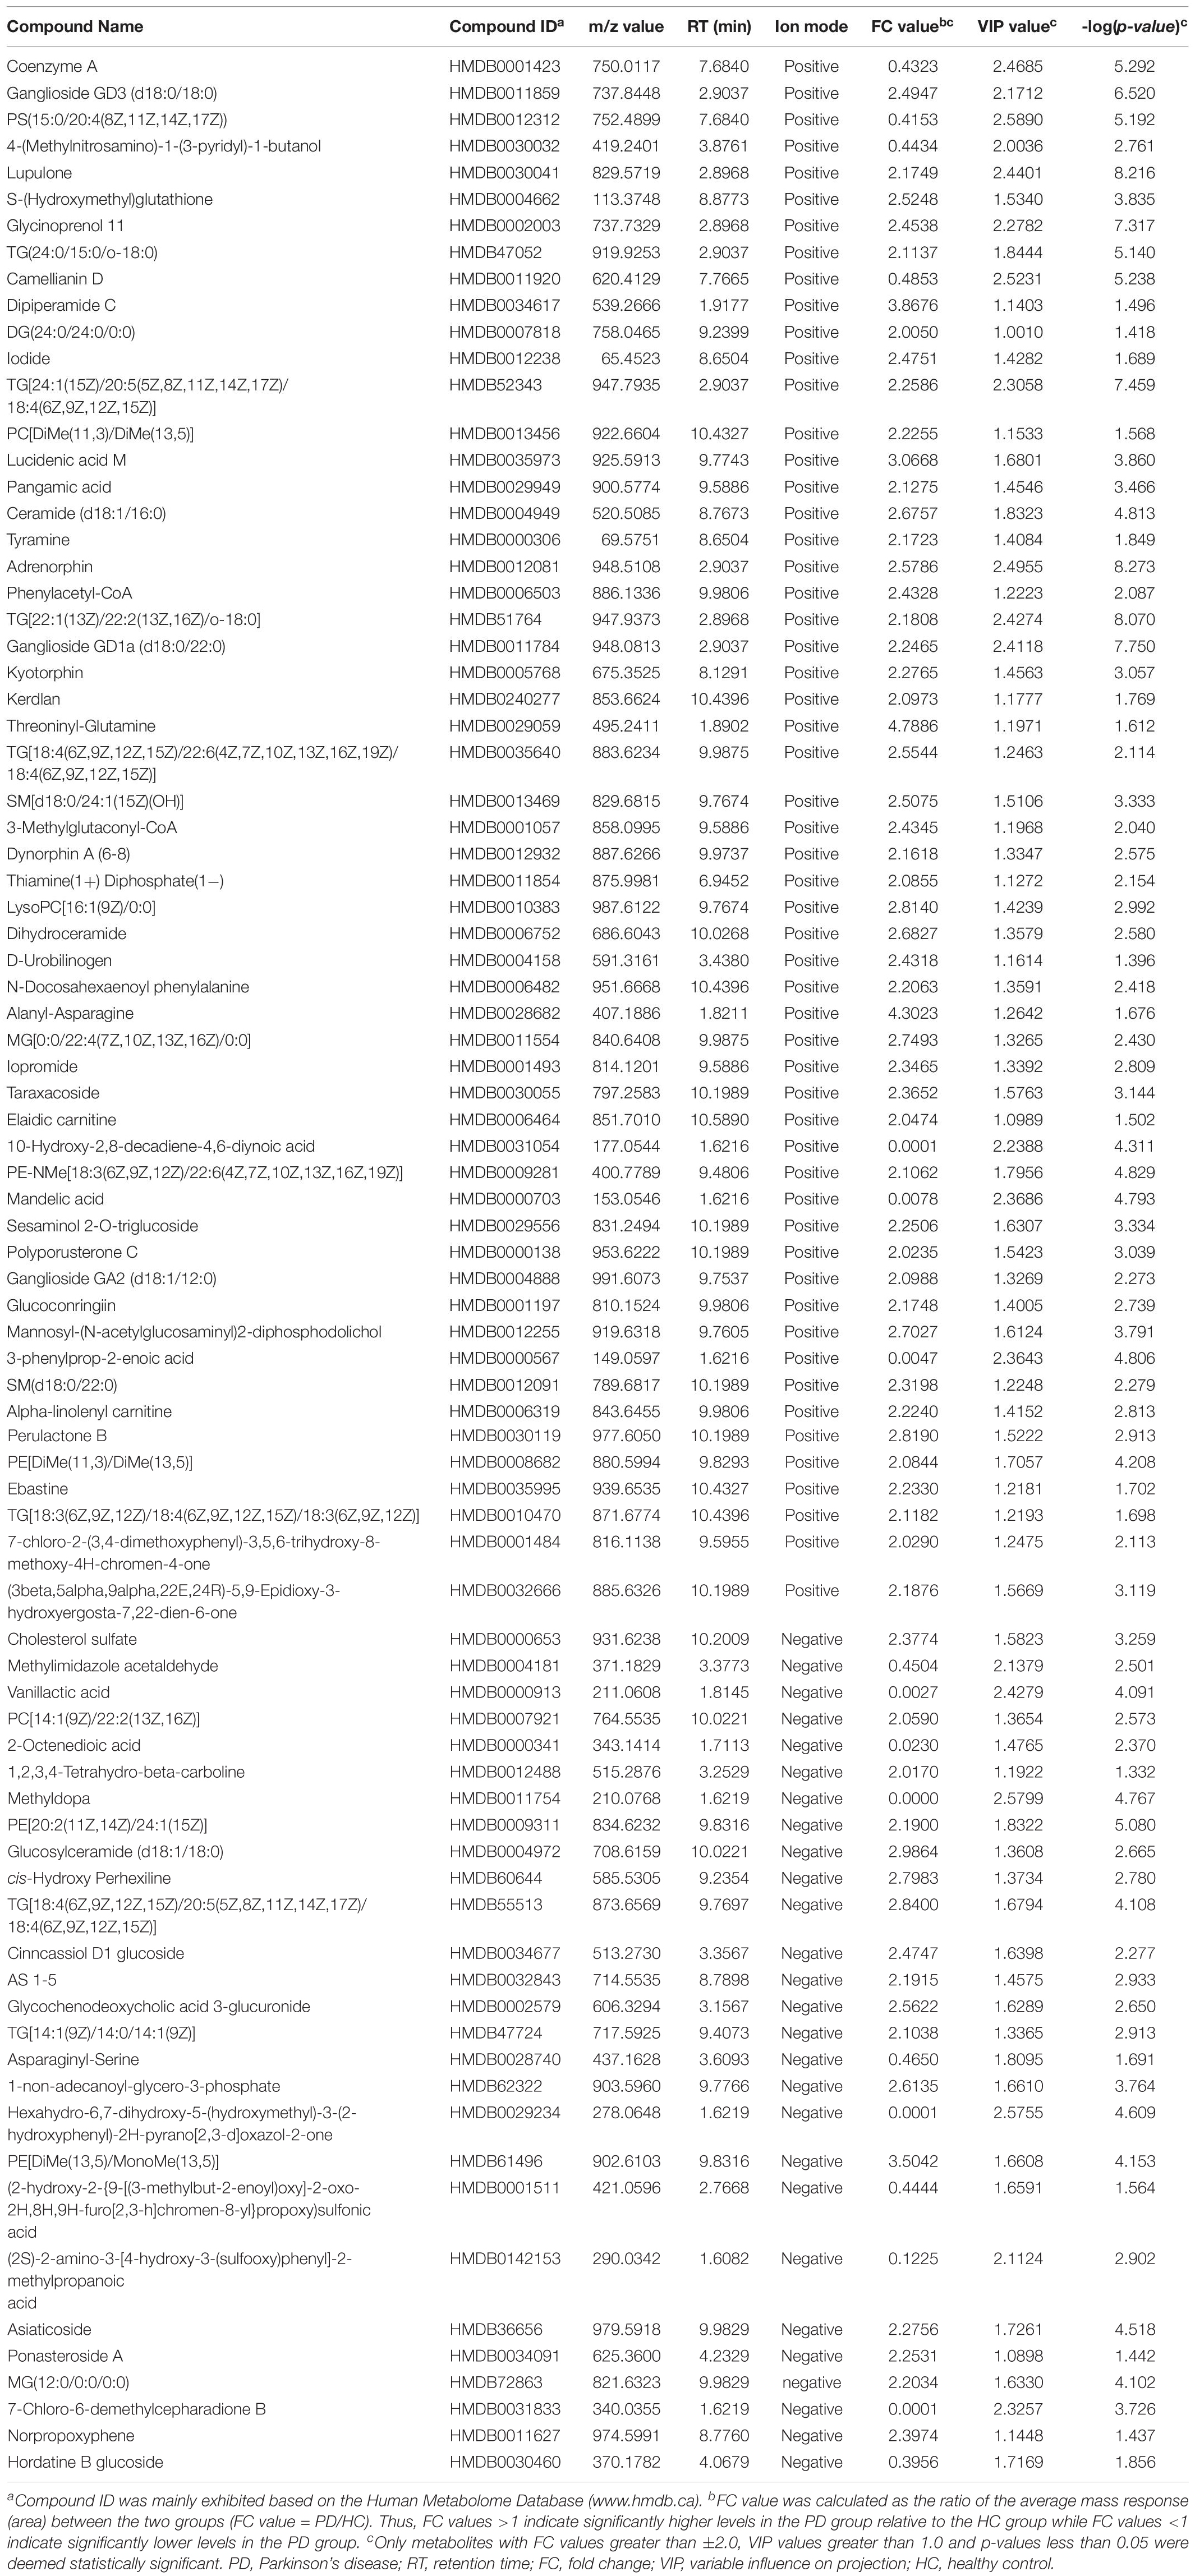
Table 2. Key differentially expressed metabolites identified by untargeted liquid chromatography-mass spectrometry-based metabolomics analysis between PD patients and healthy control.
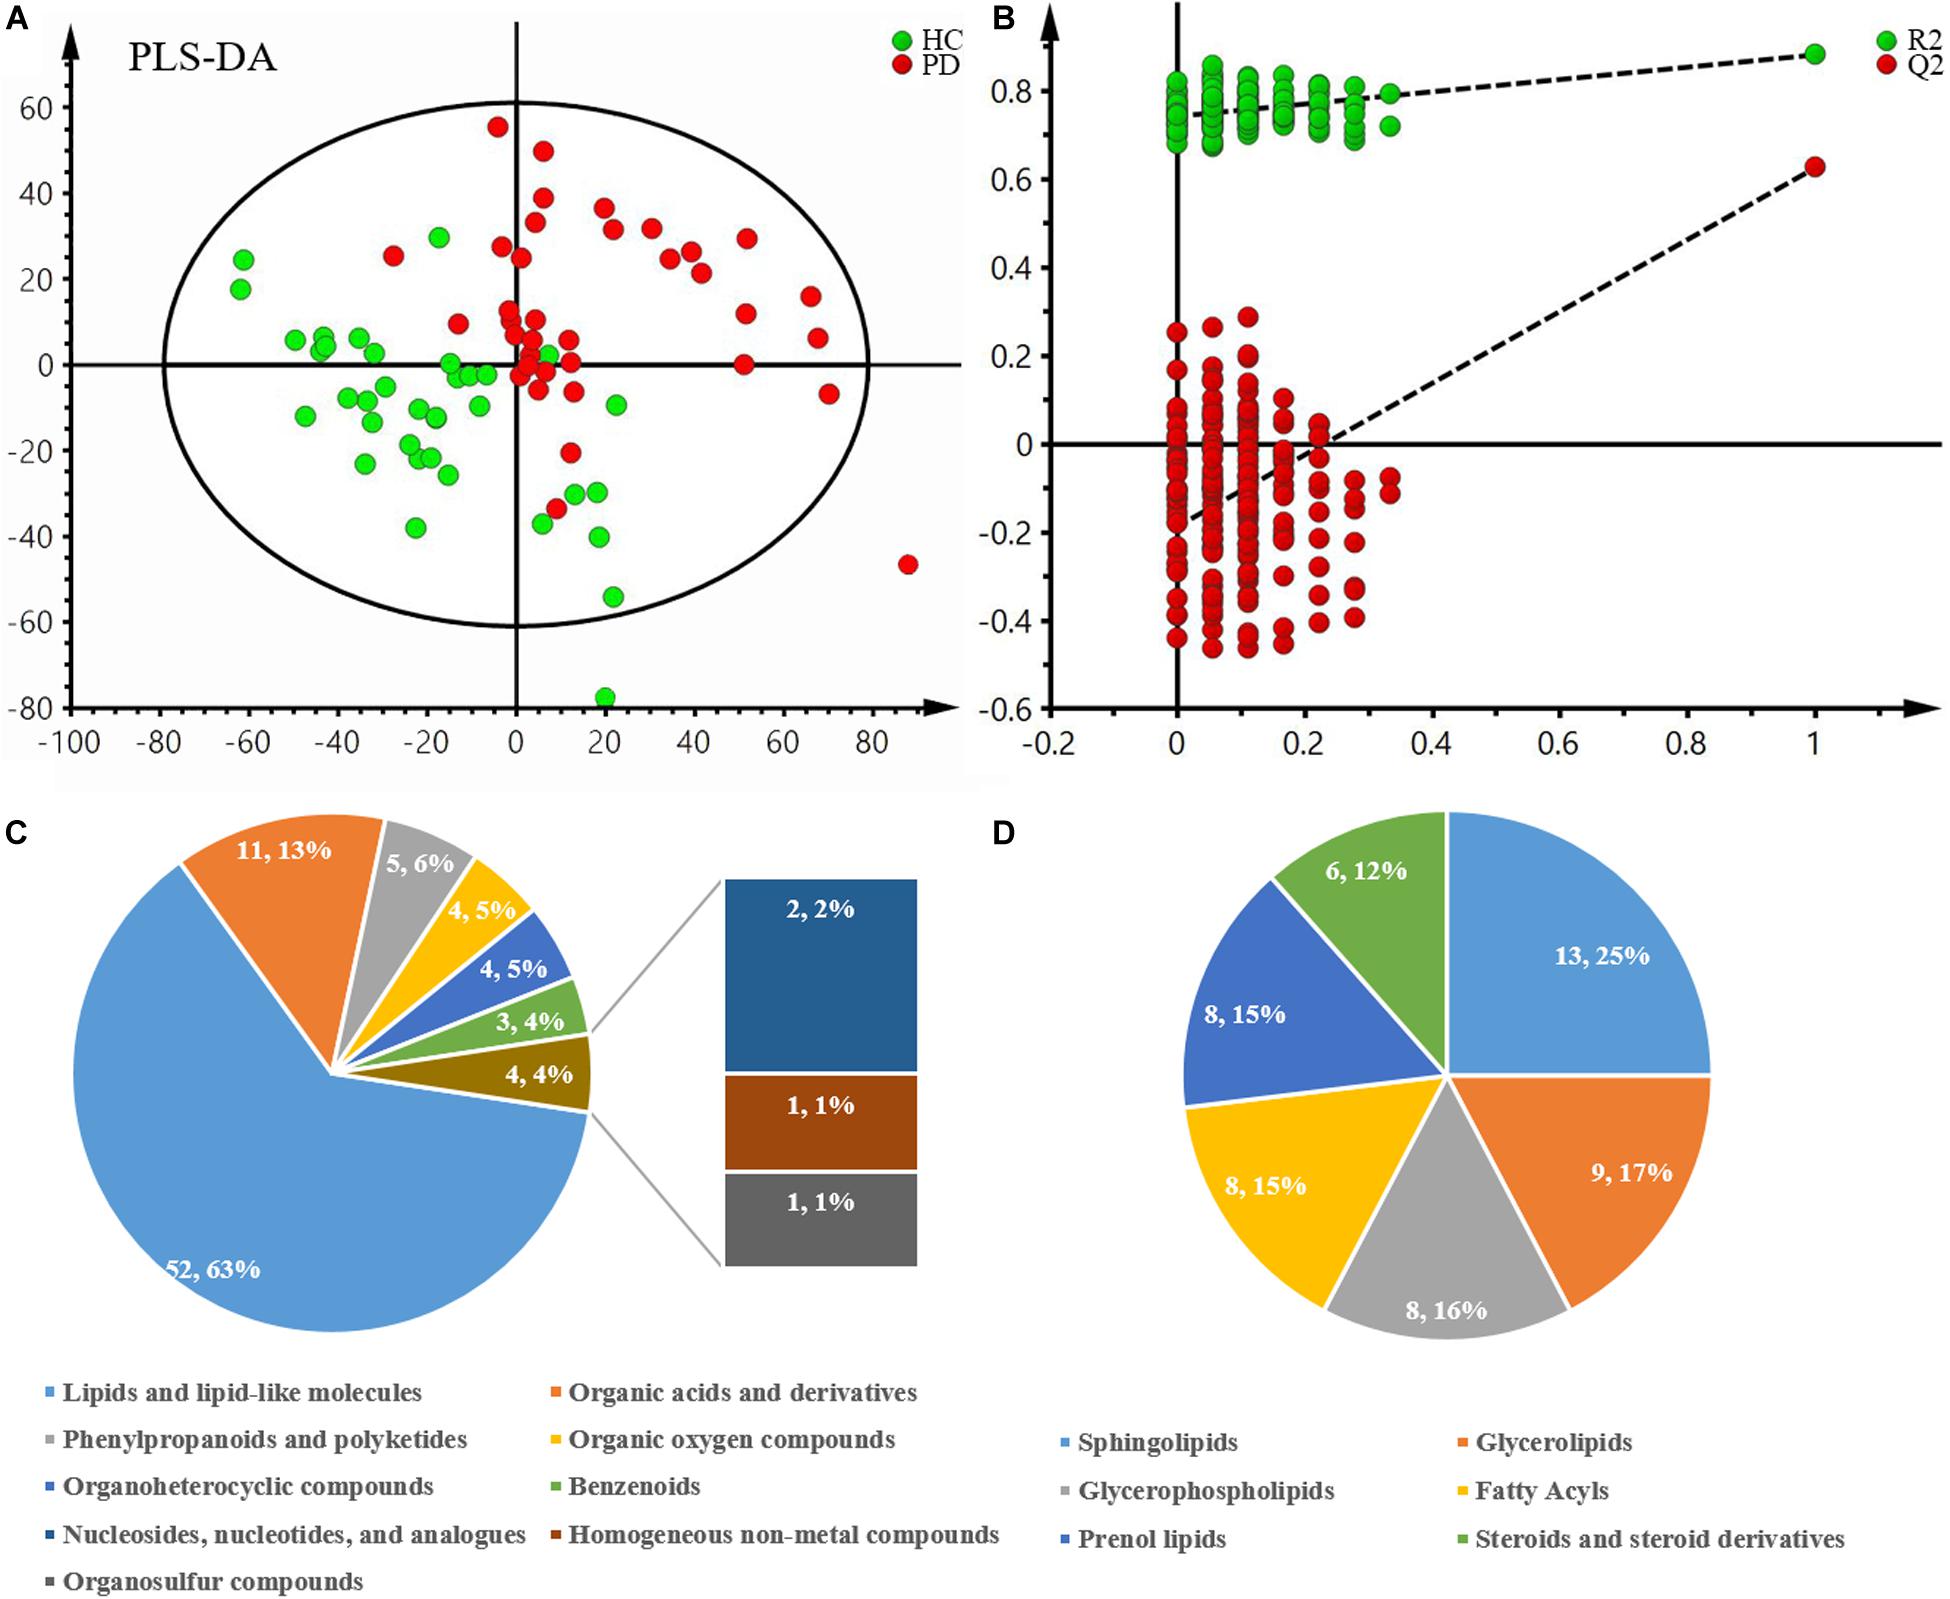
Figure 1. Multivariate statistical analysis of metabolomics and the classification of differentially expressed metabolites between PD patients and healthy controls. (A) PLS-DA score plot derived from liquid chromatography-mass spectrometry-based metabolomics analysis of PD patients and healthy controls. (B) Statistical validation of the PLS-DA model by permutation testing with 200 iterations. (C) Pie chart of the superclass of chemical taxonomy based on the annotations from Human Metabolome Database. (D) Pie chart of the further classification of lipids and lipid-like molecules. PD, Parkinson’s disease; HC, healthy control; PLS-DA, partial least squares-discriminant analysis.
The related metabolic pathway is shown in Figure 2A, where only the sphingolipid metabolism pathway is significantly enriched (pathway impact = 0.473, q-value = 0.004). All six metabolites involved in sphingolipid metabolism had significantly increased, indicating that the pathway is activated in PD patients (Figure 2B).
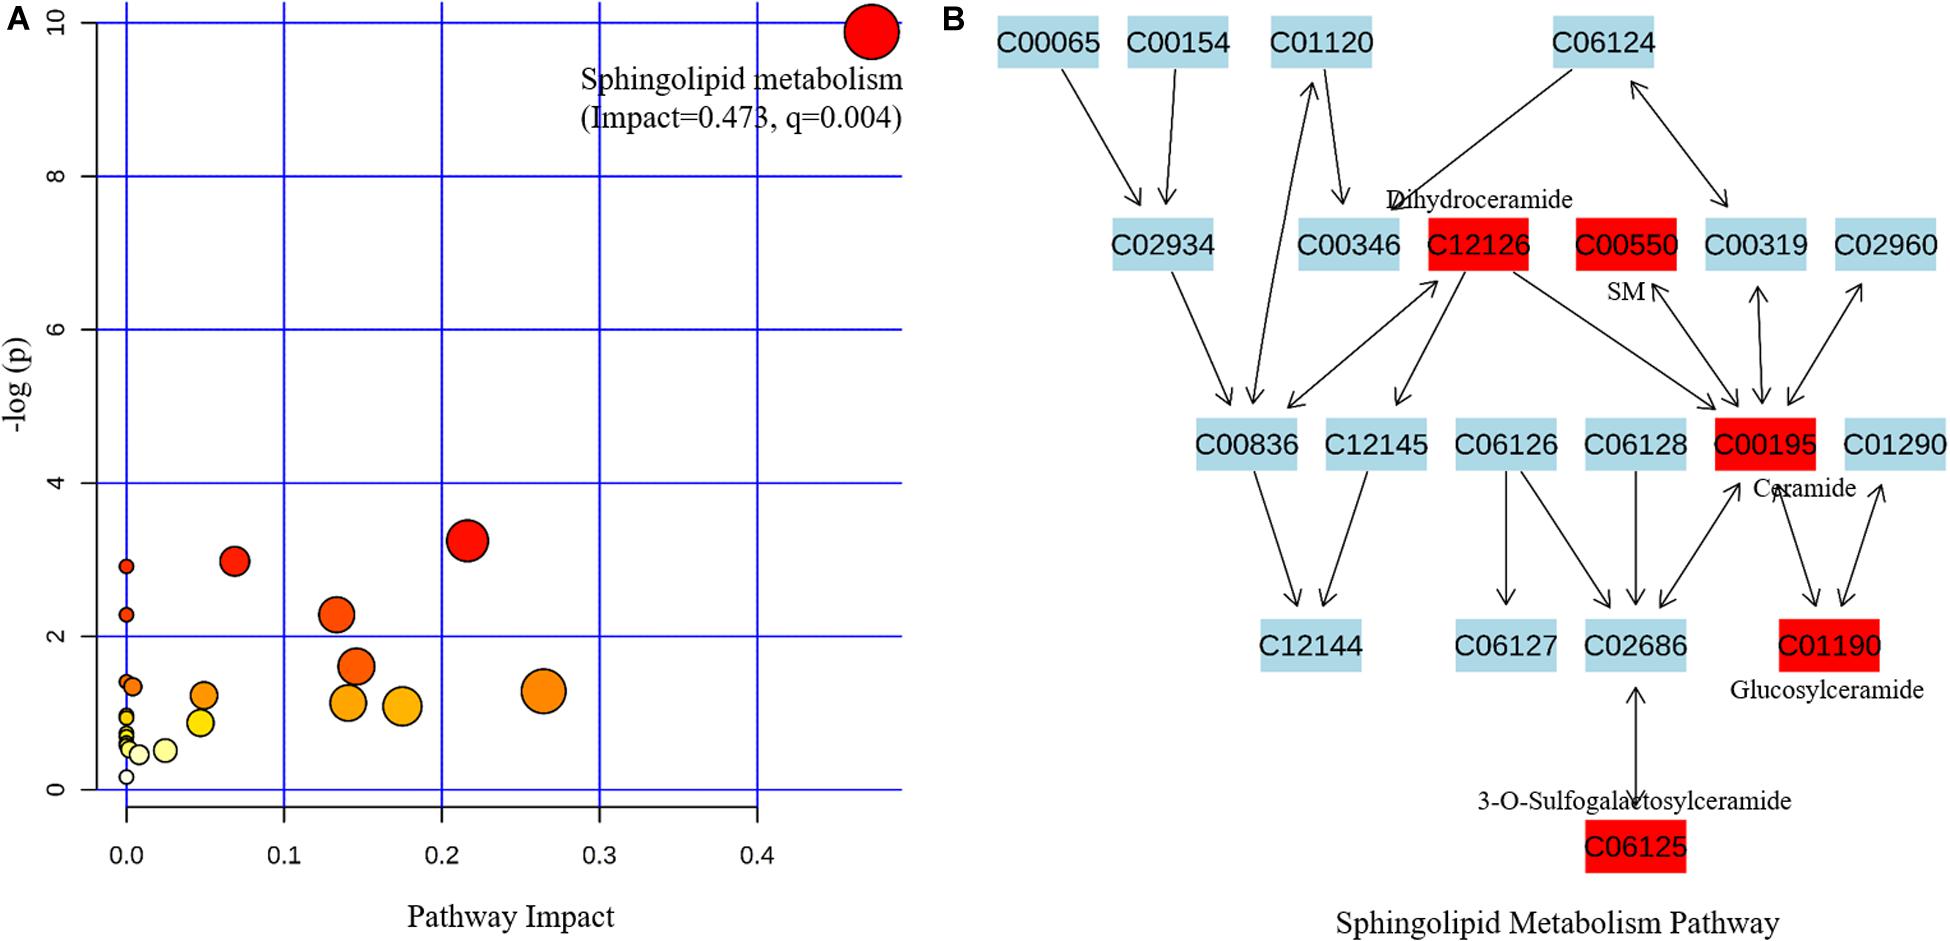
Figure 2. Metabolic pathway analysis based on the differentially expressed metabolites from the metabolomics data using MetaboAnalyst4.0. (A) Pathway analysis indicates sphingolipid metabolism is the only statistically enriched pathway. (B) In the sphingolipid metabolism pathway there are five differentially expressed metabolites involved, and all of them have increased in patients with Parkinson’s disease.
Results of the Proteomics Analysis
The clinical data of all the participants included in the proteomics analysis are exhibited in Table 3. No statistical differences can be observed in these data, indicating that the following comparison of the two groups was reasonable. A total of 912 proteins were identified in plasma and protein ratio distributions between the two groups, which are shown in Figure 3A. Forty differentially expressed proteins were recognized, with fifteen proteins increased and twenty-five decreased (Figure 3B). The details of these proteins were shown in Table 4 and the seven differentially expressed apolipoproteins (apolipoprotein C-I, apolipoprotein C-III, protein APOC4-APOC2, apolipoprotein C-IV, apolipoprotein B variant, apolipoprotein B, and apolipoprotein M) were all significantly decreased.
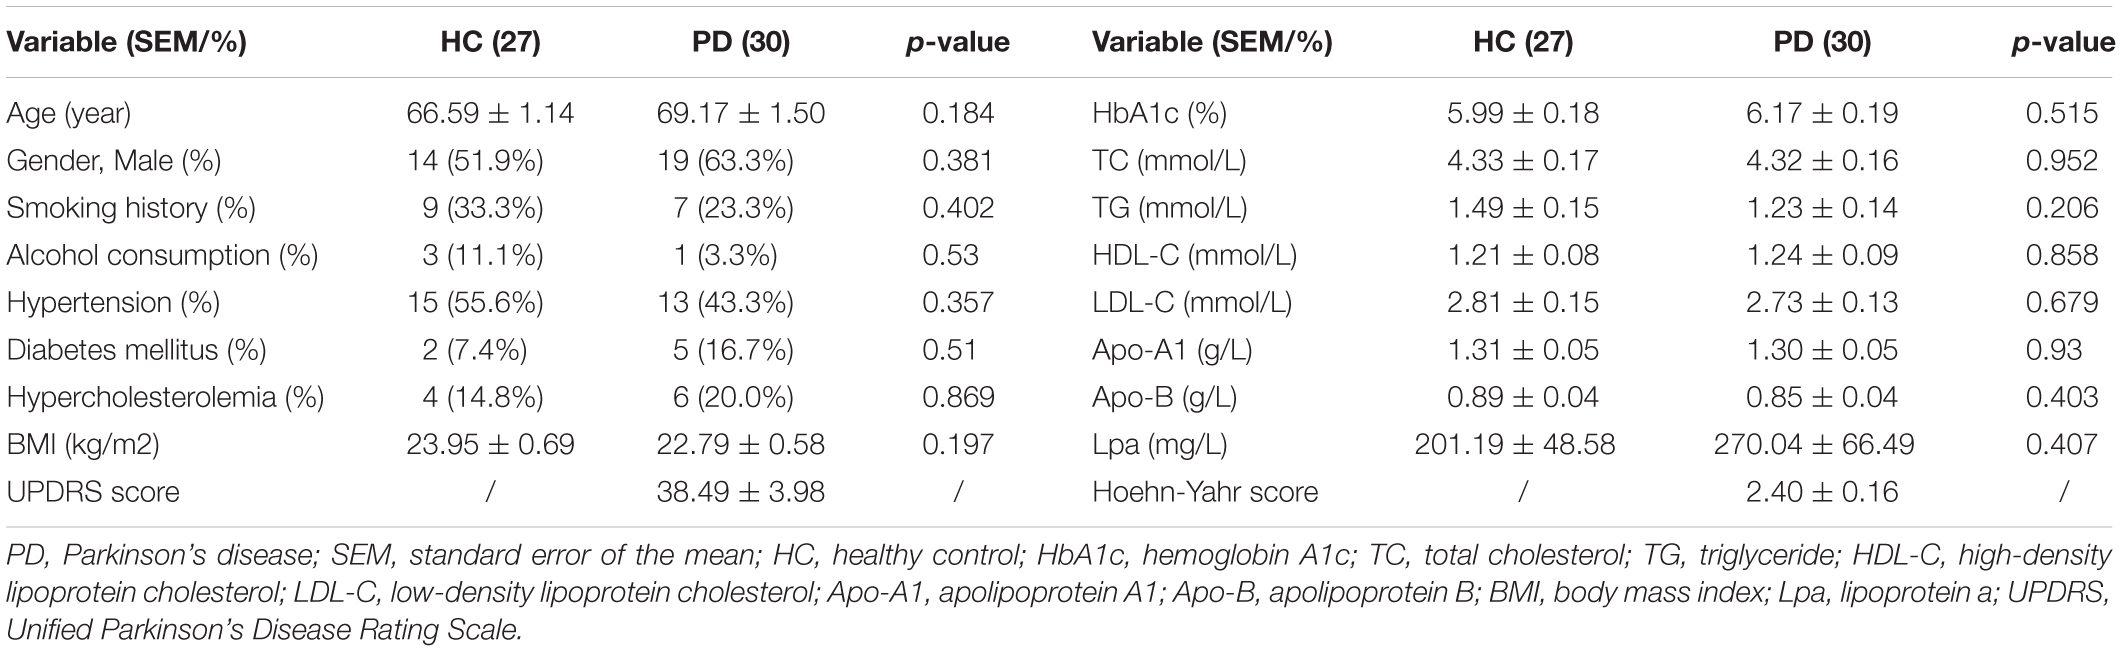
Table 3. Clinical data of PD patients and healthy controls included in the tandem mass tag-based proteomics analysis.
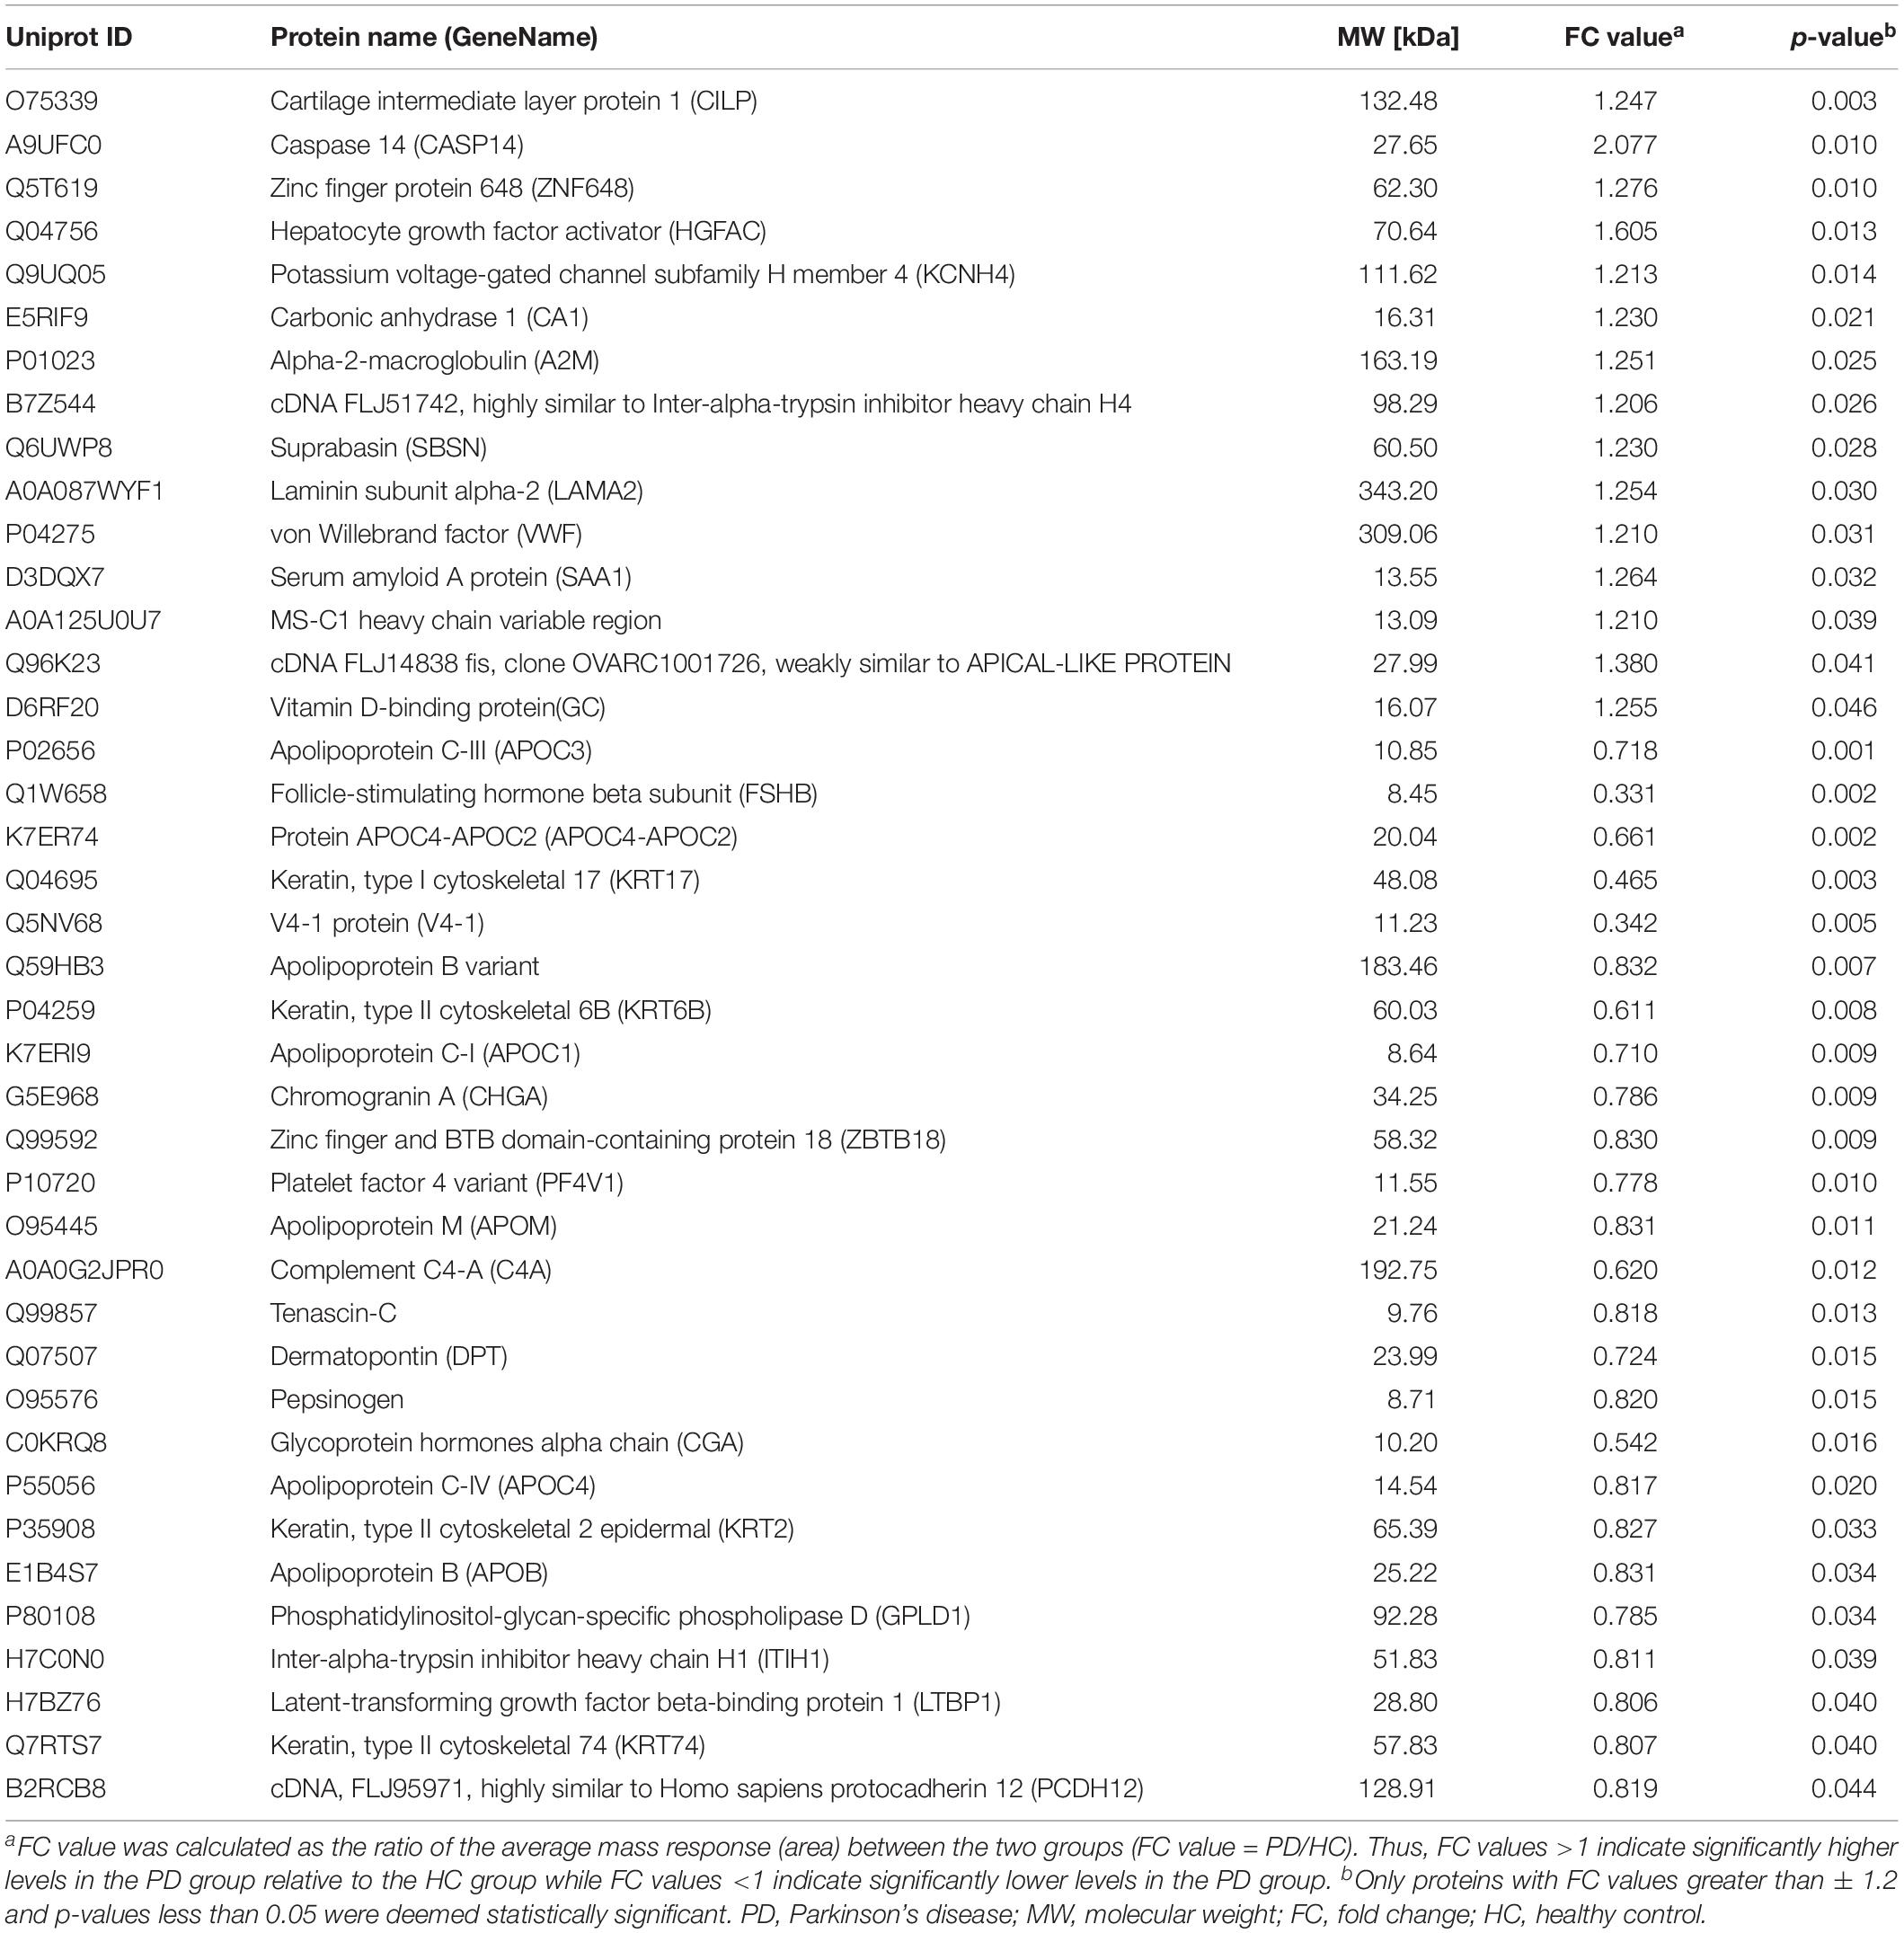
Table 4. Key differentially expressed proteins identified by tandem mass tag-based proteomics analysis between PD patients and healthy controls.
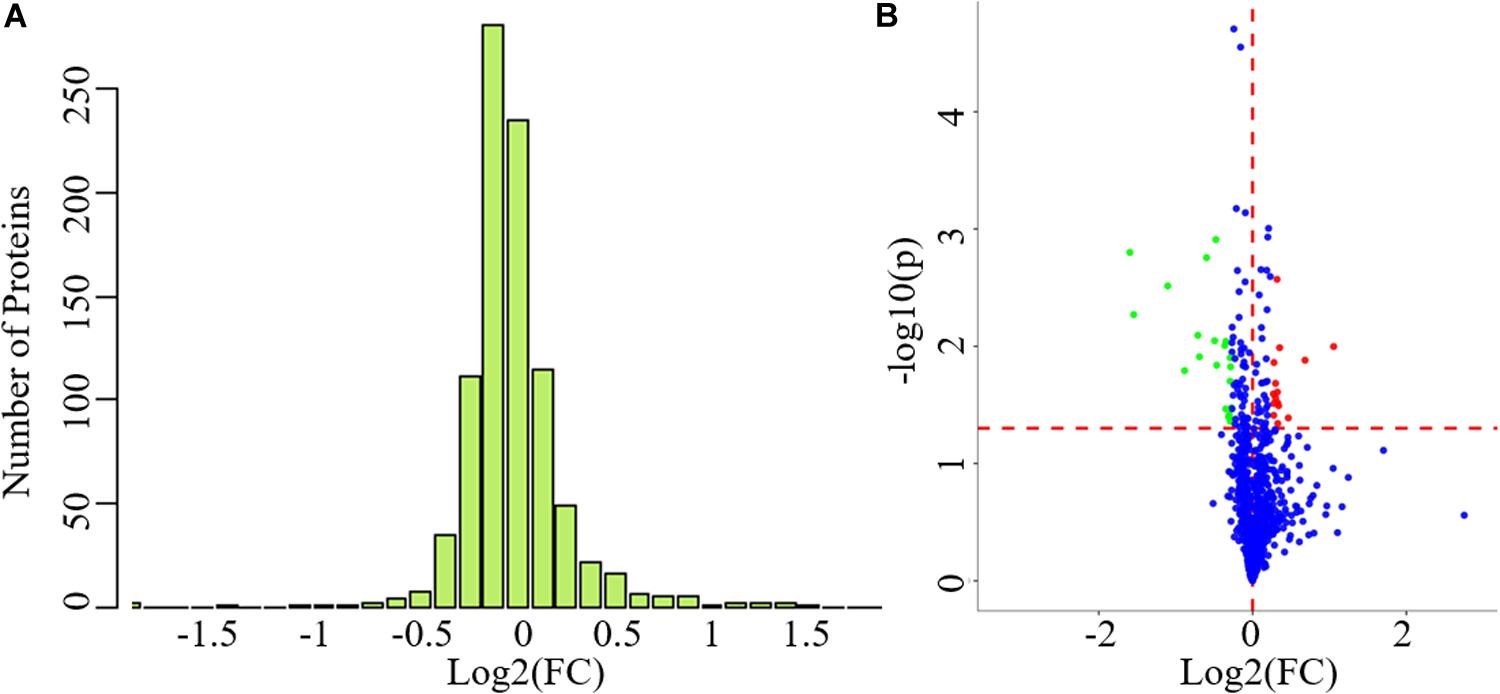
Figure 3. The exhibition of whole proteins detected in plasma and the differentially expressed proteins between PD patients and healthy controls. (A) Protein ratio distribution, (B) volcano plot showed FC values and p-values of all the identified proteins. Red dots represent increased differentially expressed proteins while green dots represent decreased proteins. FC value was calculated as the ratio of the average mass response area between the two groups (FC value = PD/HC). p-Value was calculated using Mann-Whitney U-test. PD, Parkinson’s disease; HC, healthy control; FC, fold change. Blue dots represent unchanged proteins. The horizonal red dashed lines indicate a p-value < 0.05 while the vertical red dashed lines indicate FC = 0.
There were 162, 25, and 22 GO terms significantly associated with biological processes, cellular components, and molecular function, respectively. The top 20 GO terms from GO enrichment analysis are shown in Figure 4 and Table 5. Five of the six top ranked GO terms from cellular components (very-low-density lipoprotein particle, triglyceride-rich lipoprotein particle, lipoprotein particle, plasma lipoprotein particle, and protein-lipid complex) were directly associated with lipids. The remaining top ranked GO term from cellular components was keratin filament. Eleven of the fourteen top ranked GO terms from biological processes were directly associated with lipid metabolism. These were regulation of very-low-density lipoprotein particle clearance, negative regulation of very-low-density lipoprotein particle clearance, regulation of the fatty acid biosynthetic process, regulation of lipoprotein particle clearance, regulation of the fatty acid metabolic process, negative regulation of lipoprotein particle clearance, the lipid metabolic process, protein–lipid complex remodeling, plasma lipoprotein particle remodeling, protein–lipid complex subunit organization, and plasma lipoprotein particle organization. The remaining three GO terms were negative regulation of receptor-mediated endocytosis, organic hydroxyl compound transport, and macromolecular complex remodeling. They were also indirectly associated with lipid metabolism because all of the involved proteins were lipoproteins.
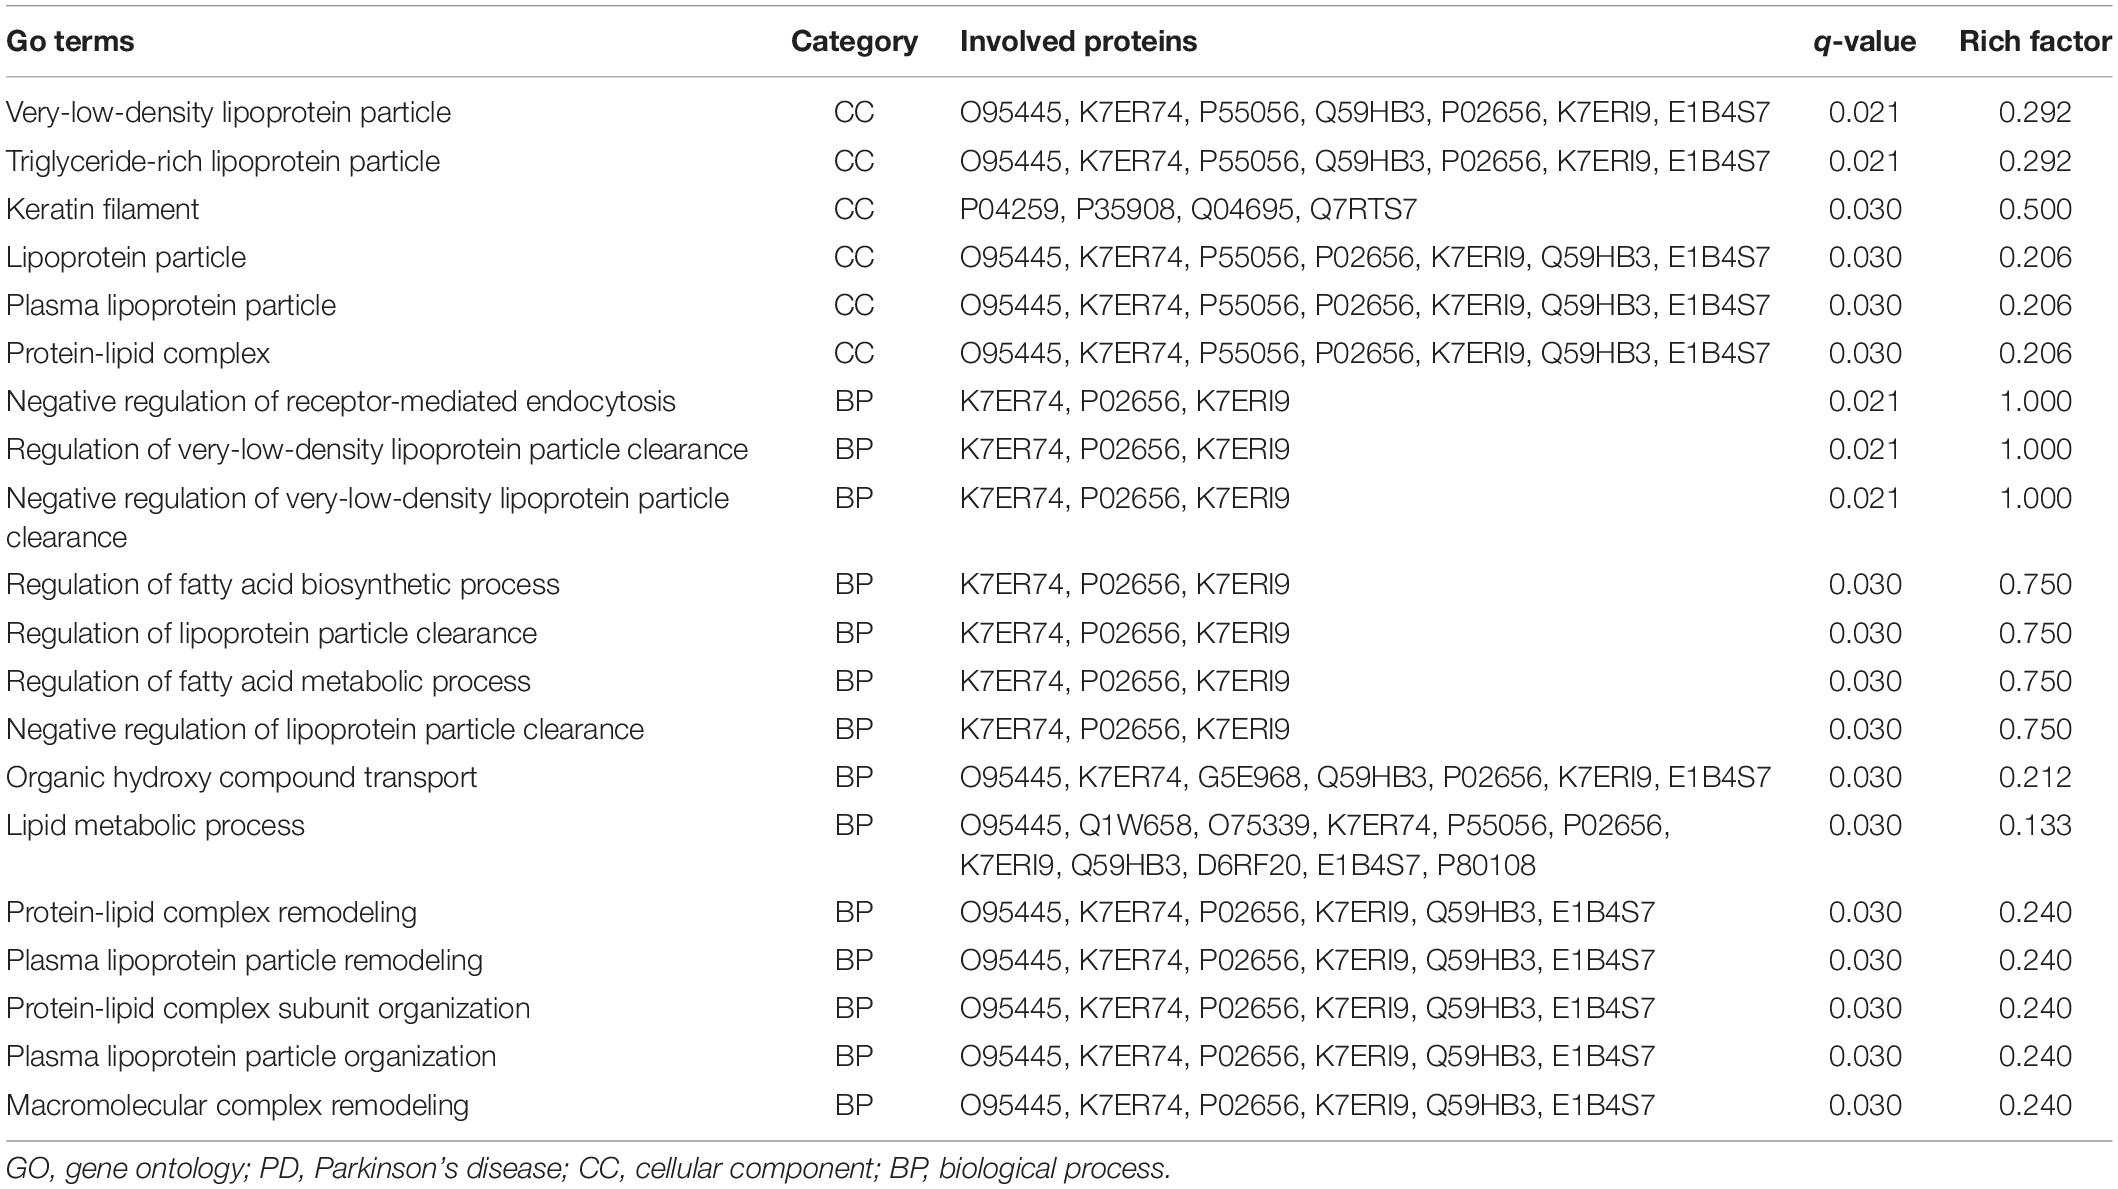
Table 5. The top 20 most enriched GO terms and involved proteins based on proteomics analysis between PD patients and healthy controls.
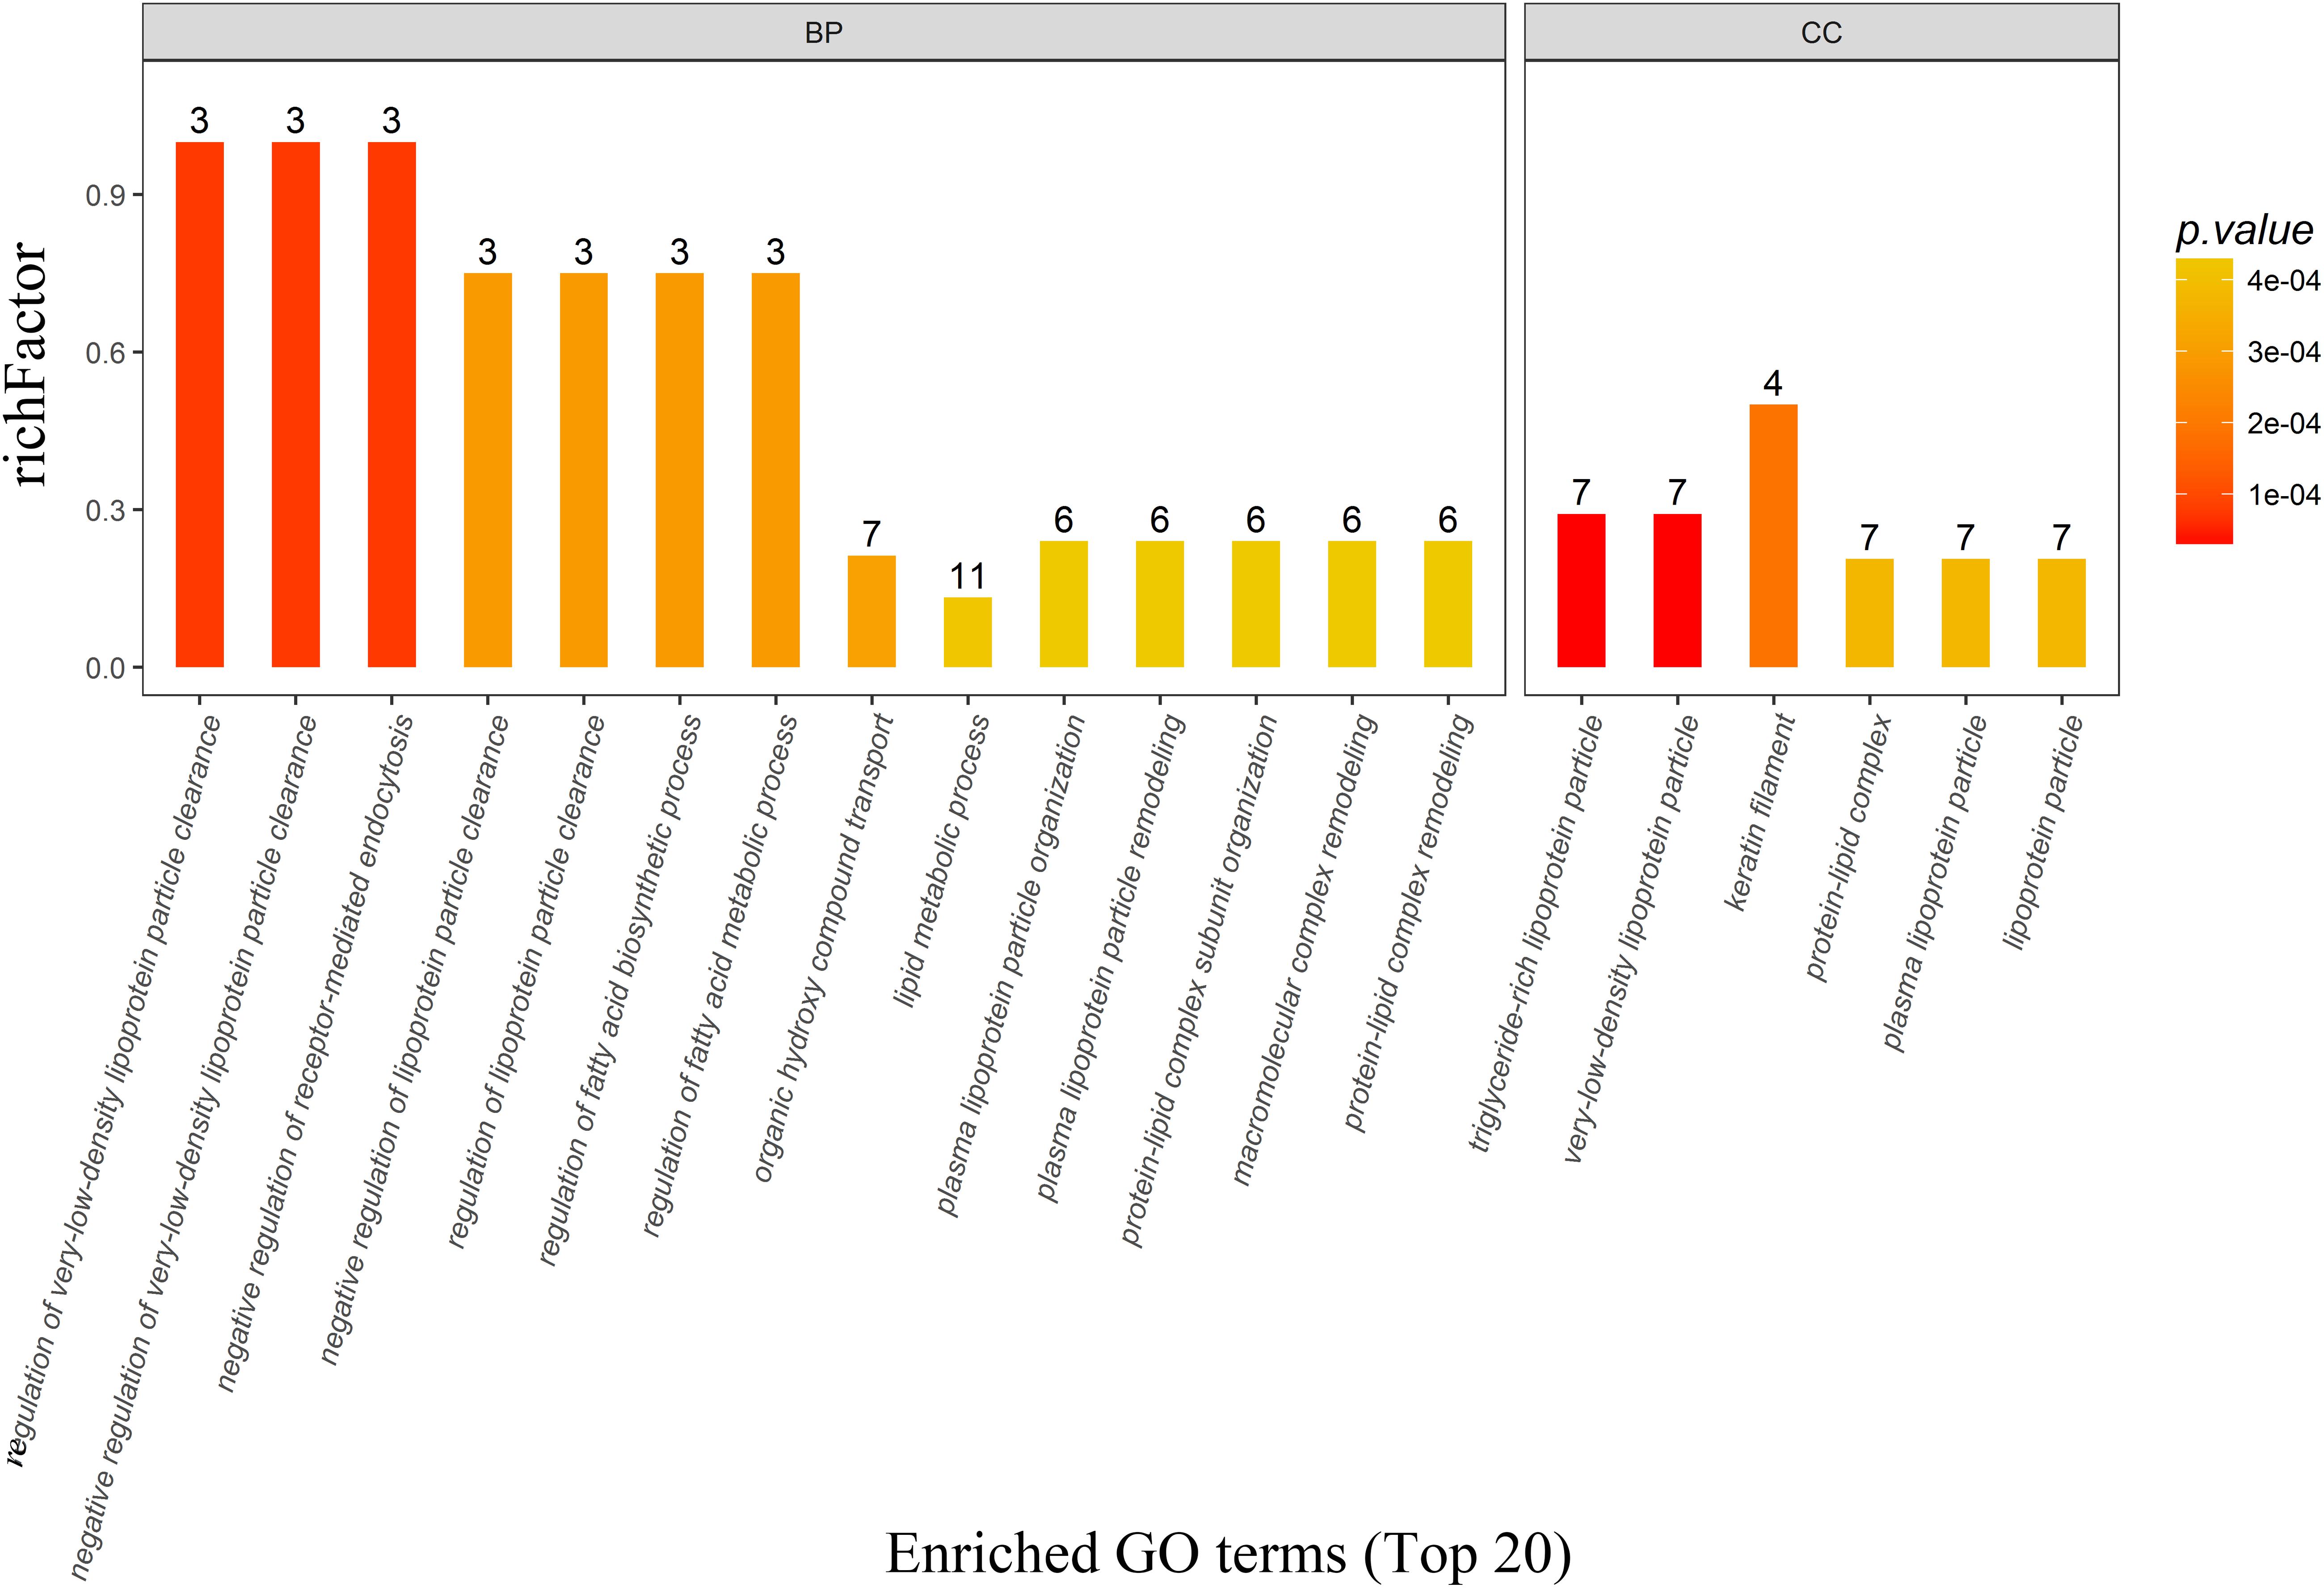
Figure 4. The top 20 most enriched GO terms based on proteomics analysis between PD patients and healthy controls. Five of the six top ranked GO terms from the cellular component and eleven of the 14 top ranked GO terms from the biological process were directly associated with lipid metabolism. BP, biological process; CC, cellular component; GO, gene ontology; PD, Parkinson’s disease.
These differentially expressed proteins were also mapped to KEGG pathways and enriched in five pathways with p-values less than 0.05 (Table 6), including ovarian steroidogenesis, the GnRH signaling pathway, neuroactive ligand–receptor interaction, glycosylphosphatidylinositol (GPI)-anchor biosynthesis, and regulation of lipolysis in adipocytes. However, no significant differences can be observed after being adjusted by Benjamini-Hochberg correction (q-value > 0.05), indicating that these results were unstable.
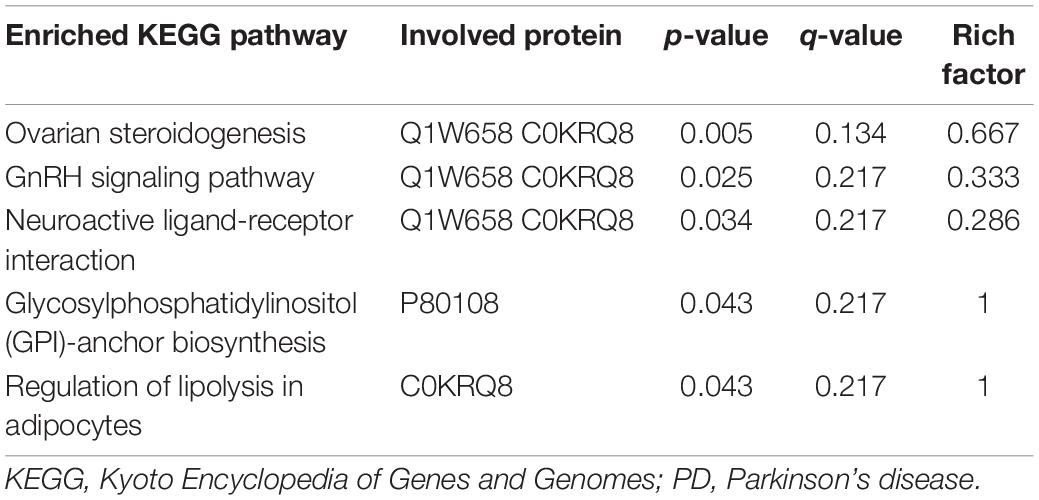
Table 6. Enriched KEGG pathways and involved proteins based on proteomics analysis between PD patients and healthy control.
Discussion
Systemic biology is the most useful way to overview the metabolic alterations of an organism in a pathological condition. Here, we have adopted an integrated metabolomics and proteomics analysis of plasma in PD patients to explore its potential pathogenesis for the first time. No significant differences were found in any of the clinical data between these two groups, suggesting the following omics analyses were reasonable.
Researchers from the United States performed the first metabolomics profiling of plasma in PD patients (Bogdanov et al., 2008). They identified altered levels of 8-hydroxy-2-deoxyguanosine, uric acid, and glutathione as potential blood biomarkers for PD patients without further pathway analysis. Other researchers also performed metabolomics analysis of cerebrospinal fluid (Lewitt et al., 2013) and urine (Luan et al., 2015) from PD patients, suggesting various perturbed metabolic pathways related to lipids, energy, fatty acids, bile acids, polyamine, and amino acids (Shao and Le, 2019). In this untargeted metabolomics analysis, significant metabolic differences were found between PD patients and healthy controls from the PLS-DA plot. Eighty-three differentially expressed metabolites were identified between the two groups, most of which were lipid and lipid-like molecules. The lipid and lipid-like molecules were further classified, and sphingolipids accounted for 25%. Furthermore, pathway analysis indicated that sphingolipid metabolism was the only significantly enriched metabolic pathway, and the pathway tended to be activated. Sphingolipids are a class of lipids containing a backbone of sphingoid bases and a set of aliphatic amino alcohols (e.g., ceramides, sphingomyelins, gangliosides, and cerebrosides). The involvement of sphingolipid metabolism was first reported in a yeast model of Parkinson’s disease (Lee et al., 2011). The Saccharomyces cerevisiae lipid elongase null mutants exhibited severe growth defects, accumulation of reactive oxygen species, aberrant protein trafficking, and a dramatic decrease in the survival of aged cells. α-Synuclein (α-syn) is a small soluble synaptic protein that is the major proteinaceous component of Lewy bodies, the pathological hallmark of Parkinson’s disease (Jo et al., 2004). It was reported that the toxicity of α-syn could be enhanced as a result of the disruption of ceramide-sphingolipid homeostasis in the endoplasmic reticulum (Lee et al., 2011). Whereas Gaucher disease-related sphingolipids (glucosylceramide, glucosylsphingosine, sphingosine, sphingosine-1-phosphate) are reported to induce α-syn aggregation, glucosylsphingosine can trigger the formation of oligomeric α-syn in human neurons (Taguchi et al., 2017). Autophagy can be impaired by the increased levels of glucosylceramide and sphingomyelin while also enhanced by the increased levels of ceramide (Indellicato and Trinchera, 2019). In total, the disruption of the sphingolipid metabolism leads to α-syn accumulation, influences the traffic of vesicles toward lysosomes, and affects autophagy. Mutations of glucocerebrosidase 1, an enzyme hydrolyzing glucocerebroside (a subclass of sphingolipids), are the most common genetic risk factor for PD, although the underlying biological processes are poorly understood (Gan-Or et al., 2008). Metabolomics analysis mainly focuses on small molecules (<1 KD), and in this research a proteomics analysis was further performed.
A lot of proteomics research has been conducted in PD patients, mainly from brain tissues (substantia nigra, thalamus, locus coeruleus, olfactory bulb, and cerebral cortex), biofluids (cerebrospinal fluid, tears, and blood) and subcellular structures (mitochondria) (Dixit et al., 2019). Most of this research referred to pathways involved in “mitochondrial dysfunction, oxidative stress, protein aggregation or degradation, autophagy, and inflammation”(Ren et al., 2015; Monti et al., 2018). Here, forty proteins were differentially expressed in PD patients from the plasma proteomics analysis and the levels of all the seven apolipoproteins (apolipoprotein C-I, apolipoprotein C-III, protein APOC4-APOC2, apolipoprotein C-IV, apolipoprotein B variant, apolipoprotein B, and apolipoprotein M) were significantly decreased. Another former study reported decreases of apolipoprotein AII and apolipoprotein E in Parkinson’s disease (Zhang et al., 2008). The decrease of apolipoprotein B-100 (Lehnert et al., 2012) and apolipoprotein A-I (Zhang et al., 2012) was also reported in some studies. There are a large number of lipids in the central nervous system, and about one-fourth of the total cholesterol has a function or is stored in the brain. These apolipoproteins can influence the deposition process of many proteins in neurodegenerative diseases, such as α-syn in PD (Zhang et al., 2012). According to the enriched GO analysis, five of the six top ranking GO terms from cellular components were directly associated with lipids, and eleven of the fourteen top ranking GO terms from biological processes were directly associated with lipid metabolism. Keratin filament from the cellular component is a part of the intermediate filament and constitutes the cytoskeleton while Lewy bodies are the accumulation of neurofilaments (intermediate filament) in Parkinson’s disease. The underlying pathogenesis needs further research to confirm. The remaining three GO terms from biological processes were also related with lipid metabolism, as all the involved proteins were lipoproteins. KEGG pathway analysis was performed with those differentially expressed proteins and it seemed to be enriched in five pathways. The GnRH signaling pathway and ovarian steroidogenesis directly regulate steroid hormones and participate in the production of steroids. These processes belong to neuroactive ligand–receptor interaction. Glycosylphosphatidylinositol (GPI)–anchor biosynthesis and regulation of lipolysis in adipocytes are direct detailed processes of lipid metabolism. However, the results were unstable after Benjamini-Hochberg correction, as no significant differences could be observed (q-value > 0.05).
Both sphingolipids and apolipoproteins participate in plasma lipid metabolism, and are mainly related with atherosclerotic diseases. A number of lipidomics studies have reported specific lipid alterations in the brain or plasma from PD patients, such as the composition alteration of lipid rafts in the frontal cortex (Alecu and Bennett, 2019). The interaction of α-syn and the synaptic membrane is thought to be critical in Parkinson’s disease and has been explored for many years (Kubo et al., 2005). It is reported that lipids and the ratio of lipids to proteins can regulate the aggregation propensity of α-syn (Galvagnion, 2017). α-Syn can interact with the lipid membrane, and that interaction further affects the oligomerization and aggregation of α-syn (Suzuki et al., 2018). The alteration of lipid chemical properties can also induce α-syn aggregation and affect the balance between functional and aberrant behavior of α-syn (Galvagnion et al., 2016). In addition, α-syn can bind to specific lipid molecules, and these lipid–protein conjugates can further help the transport of α-syn in the blood or across the blood-brain barrier (Emamzadeh and Allsop, 2017), enhance its interaction with synaptic membranes, and interfere with the catalytic activity of cytoplasmic and lysosomal lipases, thereby disrupting lipid metabolism (Alecu and Bennett, 2019). In the meantime, lipid dysregulation can also promote PD pathogenesis through oxidative stress and inflammation reaction. Apolipoprotein M can increase the level of circulating sphingosine 1-phosphate, activate the following signaling pathway, and induce inflammation reaction (Kurano et al., 2013). Platelet activating factors, a lipid proinflammatory mediator, play an important role in modulating progressive neurodegeneration in PD patients by intracellular trafficking of α-syn. Furthermore, there are a large number of genetic risk factors of PD involved in lipid metabolism, including PLA2G6 and SCARB2. These two genes are directly or indirectly involved in glycerophospholipid and sphingolipid metabolism (Alecu and Bennett, 2019). Mutations in the glucocerebrosidase 1 gene, which encodes a degrading enzyme for the glycolipid glucosylceramide, are regarded as strong risk factors for PD and dementia with Lewy bodies, and glucosylceramide has been confirmed to promote toxic conversion of α-syn. Moreover, pathological research has demonstrated the existence of α-syn in the brains of patients with lysosomal storage disorders, in which glycosphingolipids is found to be accumulated (Suzuki et al., 2018). In addition, α-syn can antagonize neurotrophic signaling of TrkB by repressing TrkB lipid raft distribution, decreasing its internalization, and reducing its axonal trafficking (Kang et al., 2017). The possible pathogenesis is that α-syn sequesters the early peroxidation products of fatty acids, thereby reducing the level of highly reactive lipid species (De Franceschi et al., 2017). All in all, dysregulated lipid metabolism is implicated in Parkinson’s disease, which might open a new therapeutic method for modifying Parkinson’s disease.
Conclusion
Integrated proteomics and metabolomics analysis reveals that Parkinson’s disease is associated with plasma lipid metabolic disturbance. The activated sphingolipid metabolism and decreased apolipoproteins are the probable potential pathogenesis for PD.
Data Availability Statement
The datasets presented in this study can be found in the supplementary materials (Supplementary Table S1) and online repository PeptideAtlas, with accession number PASS01568 (http://www.peptideatlas.org/PASS/PASS01568).
Ethics Statement
The studies involving human participants were reviewed and approved by the Ethics committee of the First Affiliated Hospital of Chongqing Medical University. The patients/participants provided their written informed consent to participate in this study.
Author Contributions
LH and Y-DW designed this study. LH, C-QL, QQ, C-CZ, and M-XD assessed the clinical data. LH, X-MX, and YL performed the experiments. M-XD, Y-LH, and G-HC wrote and revised the manuscript.
Funding
This study was funded by the Chongqing Health and Family Planning commission (No. 2017MSXM023) and the Fundamental Research Funds for the Central Universities (2042020kf0056).
Conflict of Interest
The authors declare that the research was conducted in the absence of any commercial or financial relationships that could be construed as a potential conflict of interest.
Supplementary Material
The Supplementary Material for this article can be found online at: https://www.frontiersin.org/articles/10.3389/fnmol.2020.00080/full#supplementary-material
TABLE S1 | The matrix of metabolomics data included in the paper.
Footnotes
References
Alecu, I., and Bennett, S. A. L. (2019). Dysregulated lipid metabolism and its role in α-Synucleinopathy in Parkinson’s disease. Front. Neurosci. 13:328. doi: 10.3389/fnins.2019.00328
Berardelli, A., Wenning, G. K., Antonini, A., Berg, D., Bloem, B. R., Bonifati, V., et al. (2013). EFNS/MDS-ES/ENS [corrected] recommendations for the diagnosis of Parkinson’s disease. Eur. J. Neurol. 20, 16–34. doi: 10.1111/ene.12022
Blauwendraat, C., Nalls, M. A., and Singleton, A. B. (2019). The genetic architecture of Parkinson’s disease. Lancet 19, 170–178.
Bogdanov, M., Matson, W. R., Wang, L., Matson, T., Saunders-Pullman, R., Bressman, S. S., et al. (2008). Metabolomic profiling to develop blood biomarkers for Parkinson’s disease. Brain 131, 389–396. doi: 10.1093/brain/awm304
Chong, J., Soufan, O., Li, C., Caraus, I., Li, S., Bourque, G., et al. (2018). MetaboAnalyst 4.0: towards more transparent and integrative metabolomics analysis. Nucleic Acids Res. 46, W486–W494.
Connolly, B. S., and Lang, A. E. (2014). Pharmacological treatment of Parkinson disease: a review. J. Am. Med. Assoc. 311, 1670–1683.
De Franceschi, G., Fecchio, C., Sharon, R., Schapira, A. H. V., Proukakis, C., Bellotti, V., et al. (2017). α-Synuclein structural features inhibit harmful polyunsaturated fatty acid oxidation, suggesting roles in neuroprotection. J. Biol. Chem. 292, 6927–6937. doi: 10.1074/jbc.m116.765149
Deng, H., Wang, P., and Jankovic, J. (2018). The genetics of Parkinson disease. Ageing Res. Rev. 42, 72–85.
Dixit, A., Mehta, R., and Singh, A. K. (2019). Proteomics in human Parkinson’s disease: present scenario and future directions. Cell Mol. Neurobiol. 39, 901–915. doi: 10.1007/s10571-019-00700-9
Dong, M. X., Hu, L., Huang, Y. J., Xu, X. M., Liu, Y., and Wei, Y. D. (2017a). Cerebrovascular risk factors for patients with cerebral watershed infarction: a case-control study based on computed tomography angiography in a population from Southwest China. Medicine 96:e7505. doi: 10.1097/md.0000000000007505
Dong, M. X., Xu, X. M., Hu, L., Liu, Y., Huang, Y. J., and Wei, Y. D. (2017b). Serum Butyrylcholinesterase activity: a biomarker for Parkinson’s disease and related dementia. Biomed. Res. Int. 2017:1524107.
Dong, M. X., Hu, Q. C., Shen, P., Pan, J. X., Wei, Y. D., Liu, Y. Y., et al. (2016). Recombinant tissue plasminogen activator induces neurological side effects independent on thrombolysis in mechanical animal models of focal cerebral infarction: a systematic review and meta-analysis. PLoS One 11:e0158848. doi: 10.1371/journal.pone.0158848
Dong, M. X., Feng, X., Xu, X. M., Hu, L., Liu, Y., Jia, S. Y., et al. (2018a). Integrated analysis reveals altered lipid and glucose metabolism and identifies NOTCH2 as a biomarker for Parkinson’s disease related depression. Front. Mol. Neurosci. 11:257. doi: 10.3389/fnmol.2018.00257
Dong, M.-X., Li, C.-M., Shen, P., Hu, Q.-C., Wei, Y.-D., Ren, Y.-F., et al. (2018b). Recombinant tissue plasminogen activator induces long-term anxiety-like behaviors via the ERK1/2-GAD1-GABA cascade in the hippocampus of a rat model. Neuropharmacology 128, 119–131. doi: 10.1016/j.neuropharm.2017.09.039
Dorsey, E. R., and Bloem, B. R. (2018). The parkinson pandemic-a call to action. JAMA Neurol. 75, 9–10.
Emamzadeh, F. N., and Allsop, D. (2017). α-Synuclein interacts with lipoproteins in plasma. J. Mol. Neurosci. 63, 165–172. doi: 10.1007/s12031-017-0967-0
Emamzadeh, F. N., and Surguchov, A. (2018). Parkinson’s disease: biomarkers, treatment, and risk factors. Front. Neurosci. 12:612. doi: 10.3389/fnins.2018.00612
Galvagnion, C. (2017). The role of lipids interacting with α-Synuclein in the pathogenesis of Parkinson’s disease. J. Parkinson’s Dis. 7, 433–450. doi: 10.3233/jpd-171103
Galvagnion, C., Brown, J. W., Ouberai, M. M., Flagmeier, P., Vendruscolo, M., Buell, A. K., et al. (2016). Chemical properties of lipids strongly affect the kinetics of the membrane-induced aggregation of α-synuclein. Proc. Natl. Acad. Sci. U.S.A. 113, 7065–7070. doi: 10.1073/pnas.1601899113
Gan-Or, Z., Giladi, N., Rozovski, U., Shifrin, C., Rosner, S., Gurevich, T., et al. (2008). Genotype-phenotype correlations between GBA mutations and Parkinson disease risk and onset. Neurology 70, 2277–2283. doi: 10.1212/01.wnl.0000304039.11891.29
Hochberg, Y., and Benjamini, Y. (1990). More powerful procedures for multiple significance testing. Stat. Med. 9, 811–818. doi: 10.1002/sim.4780090710
Hu, L., Dong, M. X., Zhao, H., Xu, G. H., and Qin, X. Y. (2016). Fibulin-5: a novel biomarker for evaluating severity and predicting prognosis in patients with acute intracerebral haemorrhage. Eur. J. Neurol. 23, 1195–1201. doi: 10.1111/ene.13013
Indellicato, R., and Trinchera, M. (2019). The link between Gaucher disease and Parkinson’s disease sheds light on old and novel disorders of sphingolipid metabolism. Int. J. Mol. Sci. 20:E3304.
Jo, E., Darabie, A. A., Han, K., Tandon, A., Fraser, P. E., and McLaurin, J. (2004). alpha-Synuclein-synaptosomal membrane interactions: implications for fibrillogenesis. Eur. J. Biochem. 271, 3180–3189. doi: 10.1111/j.1432-1033.2004.04250.x
Kang, S. S., Zhang, Z., Liu, X., Manfredsson, F. P., Benskey, M. J., Cao, X., et al. (2017). TrkB neurotrophic activities are blocked by α-synuclein, triggering dopaminergic cell death in Parkinson’s disease. Proc. Natl. Acad. Sci. U.S.A. 114, 10773–10778. doi: 10.1073/pnas.1713969114
Kubo, S., Nemani, V. M., Chalkley, R. J., Anthony, M. D., Hattori, N., Mizuno, Y., et al. (2005). A combinatorial code for the interaction of alpha-synuclein with membranes. J. Biol. Chem. 280, 31664–31672. doi: 10.1074/jbc.m504894200
Kurano, M., Tsukamoto, K., Ohkawa, R., Hara, M., Lino, J., Kageyama, Y., et al. (2013). Liver involvement in sphingosine 1-phosphate dynamism revealved by adenoviral hepatic overexpression of apolipoprotein M. Atherosclerosis 229, 102–109. doi: 10.1016/j.atherosclerosis.2013.04.024
Lee, Y. J., Wang, S., Slone, S. R., Yacoubian, T. A., and Witt, S. N. (2011). Defects in very long chain fatty acid synthesis enhance alpha-synuclein toxicity in a yeast model of Parkinson’s disease. PLoS One 6:e15946. doi: 10.1371/journal.pone.0015946
Lehnert, S., Jesse, S., Rist, W., Steinacker, P., Soininen, H., Herukka, S. K., et al. (2012). ITRAQ and multiple reaction monitoring as proteomic tools for biomarker search in cerebrospinal fluid of patients with Parkinson’s disease dementia. Exp. Neurol. 234, 499–505. doi: 10.1016/j.expneurol.2012.01.024
Lewitt, P. A., Li, J., Lu, M., Beach, T. G., Adler, C. H., and Guo, L. (2013). 3-hydroxykynurenine and other Parkinson’s disease biomarkers discovered by metabolomic analysis. Mov. Disord. 28, 1653–1660. doi: 10.1002/mds.25555
Luan, H., Liu, L. F., Meng, N., Tang, Z., Chua, K. K., Chen, L. L., et al. (2015). LC-MS-based urinary metabolite signatures in idiopathic Parkinson’s disease. J. Proteome Res. 14, 467–478. doi: 10.1021/pr500807t
Monti, C., Colugnat, I., Lopiano, L., Chio, A., and Alberio, T. (2018). Network analysis identifies disease-specific pathways for Parkinson’s disease. Mol. Neurobiol. 55, 370–381. doi: 10.1007/s12035-016-0326-0
Mostafa, I., Zhu, N., Yoo, M. J., Balmant, K. M., Misra, B. B., Dufresne, C., et al. (2016). New nodes and edges in the glucosinolate molecular network revealed by proteomics and metabolomics of Arabidopsis myb28/29 and cyp79B2/B3 glucosinolate mutants. J. Proteom. 138, 1–19. doi: 10.1016/j.jprot.2016.02.012
Ren, R., Sun, Y., Zhao, X., and Pu, X. (2015). Recent advances in biomarkers for Parkinson’s disease focusing on biochemicals, omics and neuroimaging. Clin. Chem. Lab. Med. 53, 1495–1506.
Shao, Y., and Le, W. (2019). Recent advances and perspectives of metabolomics-based investigations in Parkinson’s disease. Mol. Neurodegen. 14:3.
Sidransky, E., Nalls, M. A., Aasly, J. O., Aharon-Peretz, J., Annesi, G., Barbosa, E. R., et al. (2009). Multicenter analysis of glucocerebrosidase mutations in Parkinson’s disease. N. Engl. J. Med. 361, 1651–1661.
Suzuki, M., Sango, K., Wada, K., and Nagai, Y. (2018). Pathological role of lipid interaction with α-synuclein in Parkinson’s disease. Neurochem. Int. 119, 97–106. doi: 10.1016/j.neuint.2017.12.014
Taguchi, Y. V., Liu, J., Ruan, J., Pacheco, J., Zhang, X., Abbasi, J., et al. (2017). Glucosylsphingosine promotes α-Synuclein pathology in mutant GBA-associated Parkinson’s disease. J. Neurosci. 37, 9617–9631. doi: 10.1523/jneurosci.1525-17.2017
Trist, B. G., Hare, D. J., and Double, K. L. (2019). Oxidative stress in the aging substantia nigra and the etiology of Parkinson’s disease. Aging Cell 18:e13031.
Wei, Z., Li, X., Li, X., Liu, Q., and Cheng, Y. (2018). Oxidative stress in parkinson’s disease: a systematic review and meta-analysis. Front. Mol. Neurosci. 11:236. doi: 10.3389/fnmol.2018.00236
Zhang, J., Sokal, I., Peskind, E. R., Quinn, J. F., Jankovic, J., Kenney, C., et al. (2008). CSF multianalyte profile distinguishes Alzheimer and Parkinson diseases. Am. J. Clin. Pathol. 129, 526–529. doi: 10.1309/w01y0b808emeh12l
Zhang, X., Yin, X., Yu, H., Liu, X., Yang, F., Yao, J., et al. (2012). Quantitative proteomic analysis of serum proteins in patients with Parkinson’s disease using an isobaric tag for relative and absolute quantification labeling, two-dimensional liquid chromatography, and tandem mass spectrometry. Analyst 137, 490–495. doi: 10.1039/c1an15551b
Keywords: Parkinson’s disease, metabolomics, proteomics, lipid, sphingolipid metabolism, apolipoprotein
Citation: Hu L, Dong M-X, Huang Y-L, Lu C-Q, Qian Q, Zhang C-C, Xu X-M, Liu Y, Chen G-H and Wei Y-D (2020) Integrated Metabolomics and Proteomics Analysis Reveals Plasma Lipid Metabolic Disturbance in Patients With Parkinson’s Disease. Front. Mol. Neurosci. 13:80. doi: 10.3389/fnmol.2020.00080
Received: 16 December 2019; Accepted: 23 April 2020;
Published: 30 June 2020.
Edited by:
Andrei Surguchov, University of Kansas Medical Center, United StatesReviewed by:
Irina G. Sourgoutcheva, University of Kansas Medical Center, United StatesNawajes Mandal, The University of Tennessee Health Science Center (UTHSC), United States
Copyright © 2020 Hu, Dong, Huang, Lu, Qian, Zhang, Xu, Liu, Chen and Wei. This is an open-access article distributed under the terms of the Creative Commons Attribution License (CC BY). The use, distribution or reproduction in other forums is permitted, provided the original author(s) and the copyright owner(s) are credited and that the original publication in this journal is cited, in accordance with accepted academic practice. No use, distribution or reproduction is permitted which does not comply with these terms.
*Correspondence: You-Dong Wei, youdongwei1966@163.com
†These authors have contributed equally to this work