Identification of crucial inflammaging related risk factors in multiple sclerosis
 Mengchu Xu1†
  Huize Wang2†
  Siwei Ren1
  Bing Wang1 Wenyan Yang1 Ling Lv3 Xianzheng Sha1*
  Wenya Li3*
  Yin Wang1,4*
- 1Department of Biomedical Engineering, School of Intelligent Sciences, China Medical University, Shenyang, Liaoning, China
- 2Department of Nursing, First Affiliated Hospital of China Medical University, Shenyang, Liaoning, China
- 3Department of Thorax, The First Hospital of China Medical University, Shenyang, Liaoning, China
- 4Tumor Etiology and Screening Department of Cancer Institute and General Surgery, The First Affiliated Hospital of China Medical University, Shenyang, Liaoning, China
Background: Multiple sclerosis (MS) is an immune-mediated disease characterized by inflammatory demyelinating lesions in the central nervous system. Studies have shown that the inflammation is vital to both the onset and progression of MS, where aging plays a key role in it. However, the potential mechanisms on how aging-related inflammation (inflammaging) promotes MS have not been fully understood. Therefore, there is an urgent need to integrate the underlying mechanisms between inflammaging and MS, where meaningful prediction models are needed.
Methods: First, both aging and disease models were developed using machine learning methods, respectively. Then, an integrated inflammaging model was used to identify relative risk factors, by identifying essential “aging-inflammation-disease” triples. Finally, a series of bioinformatics analyses (including network analysis, enrichment analysis, sensitivity analysis, and pan-cancer analysis) were further used to explore the potential mechanisms between inflammaging and MS.
Results: A series of risk factors were identified, such as the protein homeostasis, cellular homeostasis, neurodevelopment and energy metabolism. The inflammaging indices were further validated in different cancer types. Therefore, various risk factors were integrated, and even both the theories of inflammaging and immunosenescence were further confirmed.
Conclusion: In conclusion, our study systematically investigated the potential relationships between inflammaging and MS through a series of computational approaches, and could present a novel thought for other aging-related diseases.
1 Introduction
Multiple sclerosis (MS) is an immune-mediated disease characterized by inflammatory demyelinating lesions in the central nervous system (CNS). MS is one of the major causes of disability (GBD 2016 Neurology Collaborators, 2019), leading to a heavy burden on families and society (Wang et al., 2023). It has been estimated that the number of people with MS increased to 2.8 million globally in 2020, 30% greater than that in 2013 (Walton et al., 2020). Therefore, it is imperative to study the underlying risk factors of MS.
There is substantial (i.e., epidemiological, pathological and clinical) evidence indicating that chronological age is as the factor mostly vital to MS (Graves et al., 2023), and even the development of MS is closely related to aging (Graves et al., 2023). For example, telomere abrasion is associated with disability and brain atrophy in MS patients (Krysko et al., 2019), and reproductive aging might also affect MS progression (Graves et al., 2018). Moreover, aging microglia create a chronic inflammatory microenvironment declining the normal function of remyelination (Neumann et al., 2019), and aging astrocytes are vital to impair synaptic plasticity and disturb the neuronal metabolic homeostasis (Correale and Farez, 2015; Oost et al., 2018). In short, there is growing evidence that aging promotes the development of MS.
MS is a chronic inflammatory disease closely relate to the aging process (where aging-related inflammation is often defined as inflammaging) (Xia et al., 2016; Cantuti-Castelvetri et al., 2022). The main pathological hallmark of MS was demyelinating plaque, which was also accompanied by chronic inflammation (Howe et al., 2007; Lemus et al., 2018). It has been reported that aging promoted neuroinflammation in MS and even led to a diminished ability of microglia responding to axonal deficits (Mestre et al., 2021). Moreover, senescent microglia were characterized by reduced migration and phagocytosis abilities, indicating that they were less efficient in removing myelin debris from damaged neurons in MS (Neumann et al., 2009). Furthermore, ongoing neuroinflammation was associated with neuronal death, which was vital to injure the neuronal health (Simkins et al., 2021). During inflammatory CNS episodes, several types of neurotoxic oxidation products were synthetized, thus leading to increased energy demands (Mahad et al., 2009; Haider et al., 2011). In conclusion, it could be speculated that the aging-related inflammation (inflammaging) was as one of the major risk factors in MS that needed to be explored more systematically.
Fortunately, with the development of artificial intelligence, many of the researches on MS utilized machine learning (ML), which allowed for the diagnosis and prognosis using real datasets (Aslam et al., 2022). In addition, ML techniques offered new insights in the diagnosis, characterization and prediction of disease progression (Jasperse and Barkhof, 2023). Several studies have shown that ML can recognize key markers associated with inflammation and aging (Mezzaroba et al., 2020; Zhou et al., 2023). Meanwhile, there was an urgent need to integrate key biomarkers and biological information (e.g., by mendelian randomization, MR) (Yuan et al., 2021; Li C. et al., 2022). In addition, gene co-expression network analysis could also identify highly correlated gene clusters and explore their potential molecular mechanisms in MS (Creanza et al., 2016; Gu et al., 2022). However, despite a large number of studies explaining the risk factors in MS, potential mechanisms of in MS based on inflammaging were still unclear and thus needed to be further explored at the system level.
To further explore the potential mechanisms involved in aging, inflammation and MS, a series of computational methods were integrated in this work (Figure 1): (1) Machine learning was used to identify aging and disease (MS) markers, respectively; (2) An integrated inflammaging model was used to explore the key relationship between inflammaging and MS, by identifying essential “aging-inflammation-disease” triples; (3) Network analysis, sensitivity analysis and enrichment analysis were used to study potential risk factors for multiple sclerosis; (4) Pan-cancer analysis was used to further validate relative biological functions in cancers based on “aging-inflammation-disease” triples. Ultimately, a series of underlying mechanisms of MS (i.e., protein homeostasis, cellular homeostasis, neurodevelopment, and energy metabolism) were integrated, which also provided key indicators for cancer. These results could also present a novel thought for other aging-relative experimental validations.
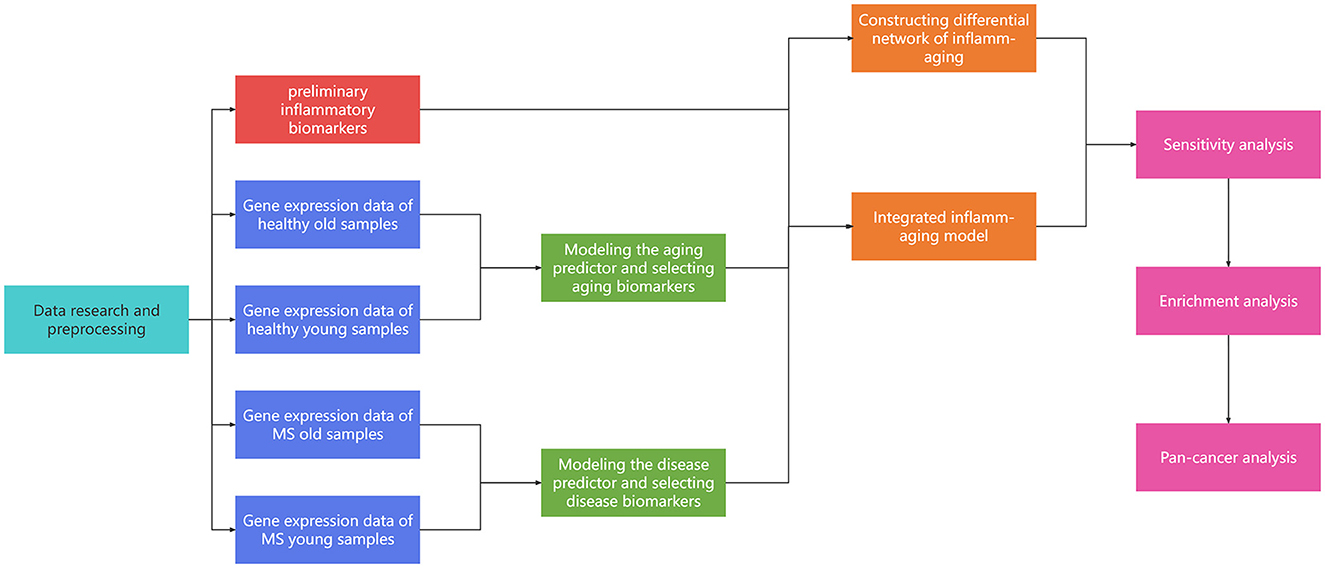
Figure 1. The workflow of our study.
2 Results
2.1 Modeling prediction models and identifying relative biomarkers
Gene expression profiles were obtained from the GEO database, including 445 samples (Supplementary Table S1) and 16,275 genes (Supplementary Table S2). These genes were ranked by the ReliefF algorithm, and then the aging predictor and disease predictor were modeled using the k-nearest neighbors (kNN; k = 9 with the correlation distance) algorithm and optimized by 10-fold cross-validation. The learning curves for the aging and disease models in the training dataset were shown in Figures 2A, B, where the models with the highest accuracy were selected (Table 1), including 70 aging markers and 19 disease markers (Supplementary Tables S3, S4). As a result, the accuracies of the aging model and the disease model in the test set were 0.8390 and 0.7233, respectively (Table 1). Furthermore, the areas under the curve (AUCs) for the aging and disease models in the test were 0.73672 and 0.64063 (Figures 2C, D), by summarizing the specificity (the accuracy for the normal old samples in the aging model, or for the MS samples in the disease model) and the sensitivity (the accuracy for the normal young samples in the aging model, or for the control samples in the disease model) based on the ReliefF ranking results (i.e., the first one gene expression, the first two genes, or the first three genes,..., the first 100 genes), respectively. In addition, the AUC of the ROC curves were 0.74382 and 0.84711 based on the aging and disease score, respectively (Figures 2E, F). Consequently, these results indicated that our predictors were with enough accuracies in both aging and disease models.
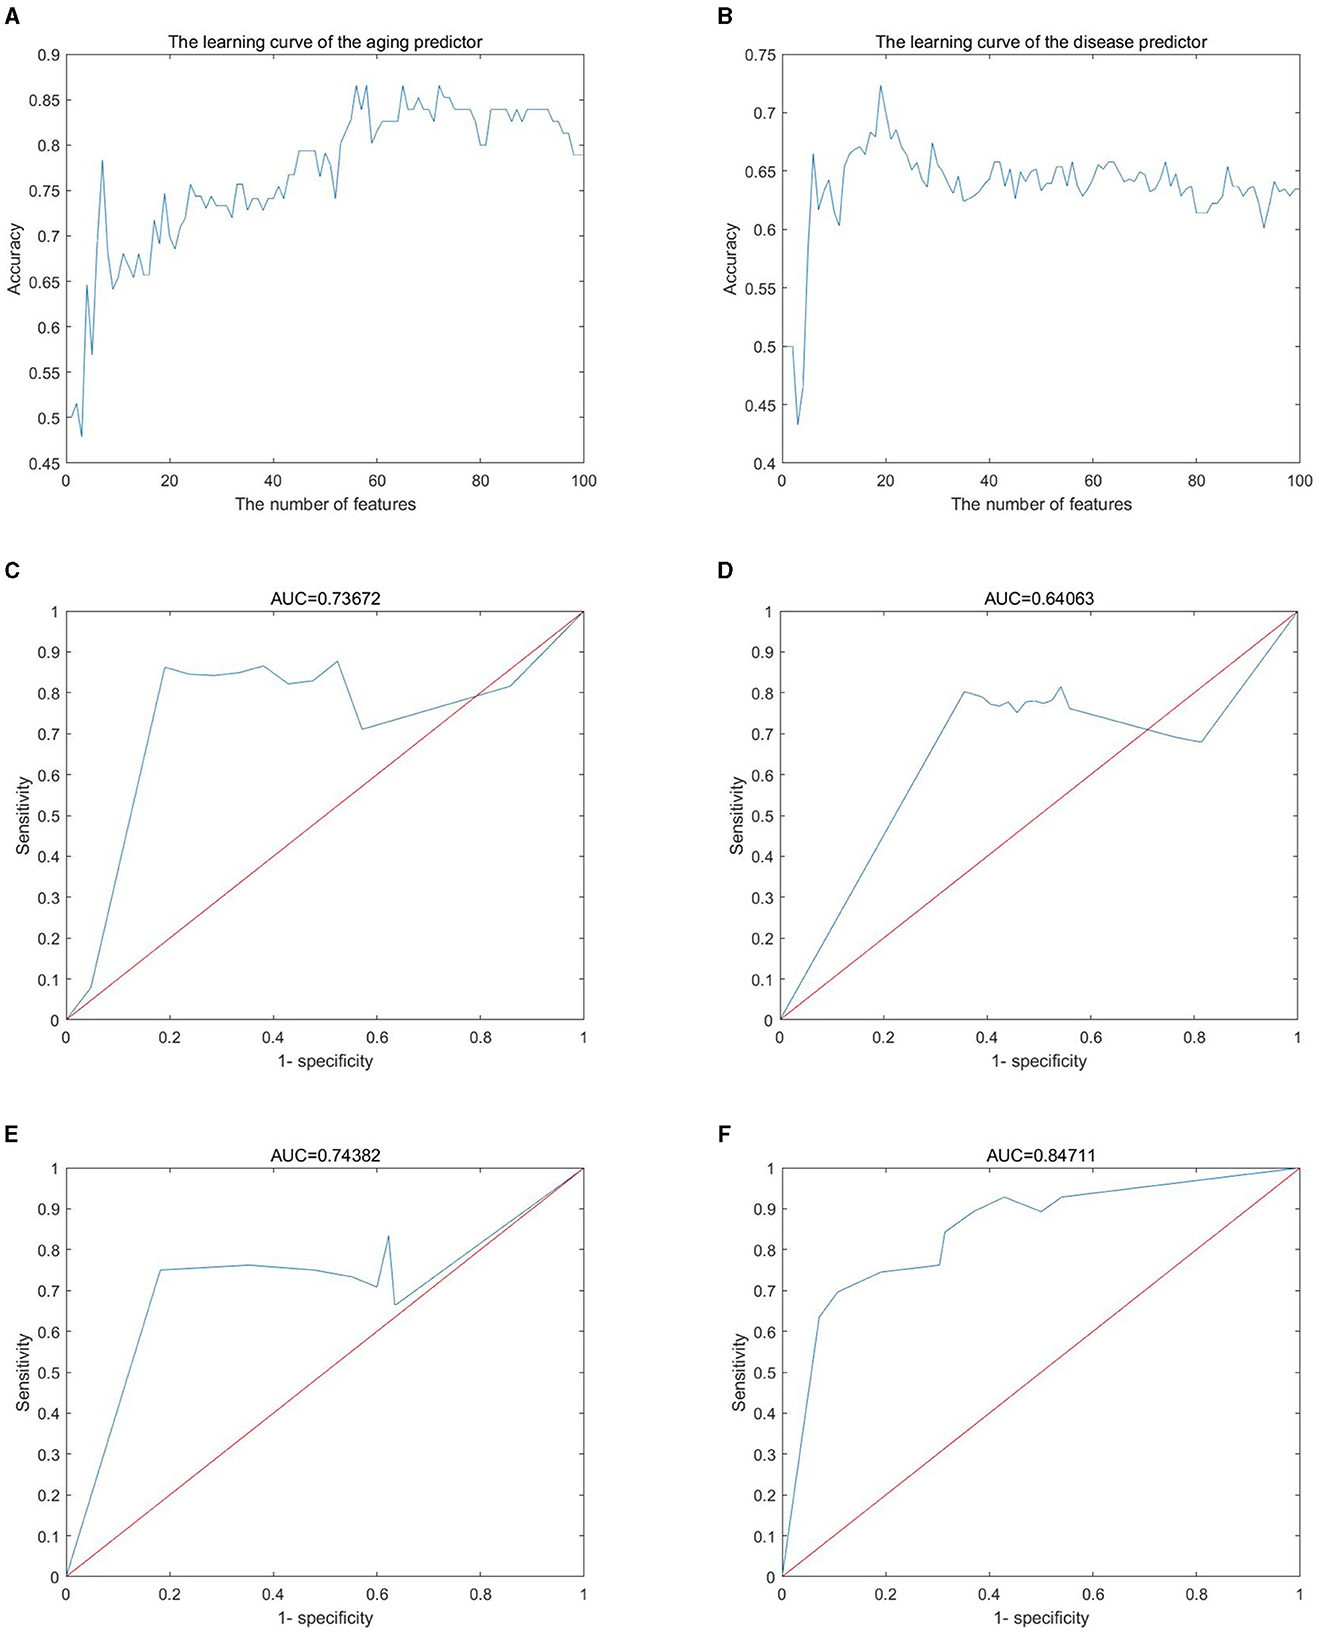
Figure 2. Machine learning results. (A, B) Learning curve for the training dataset; (C, D) sensitivity and specificity (similar to receiver operating characteristic) curves; (E, F) the ROC curve for the test dataset; (A, C, E) the aging model; (B, D, F) the disease (MS) model.
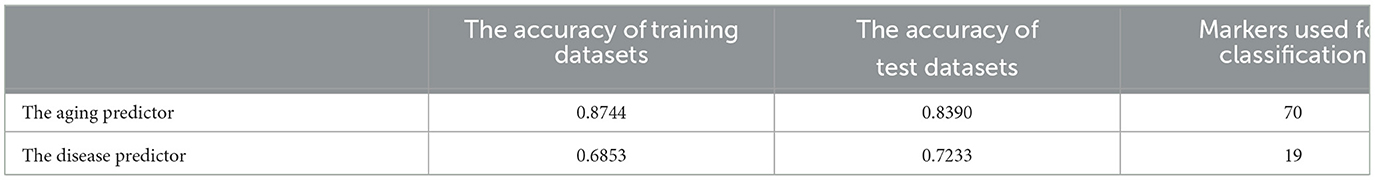
Table 1. The accuracy of the aging predictor model and disease predictor model.
Both aging and disease markers indicated important biological functions. For example, TSPAN6 (tetraspanin 6, ReliefF weight was 0.135) was the top aging marker. It had been reported that TSPAN6 was as a novel regulator of APP-CTF protein homeostasis that prevented APP-CTF degradation from the impairment in autolysosomal pathway (Guix et al., 2017). In addition, TSPAN6 was identified as a regulator of synaptic transmission and plasticity mechanisms, playing a key role in synaptic development and AMPAR transport (Salas et al., 2017; Becic et al., 2022). POM121L9P (POM121 transmembrane nucleoporin like 9 as a pseudogene, ReliefF weight 0.051) was the top disease marker. FNDC4 (Fibronectin type III structural domain-containing protein 4, ReliefF weight was 0.050) was the second top disease marker, and it have been shown to induce the AMP-activated protein kinase (AMPK) phosphorylation and heme oxygenase-1 (HO-1) expression in adipocytes, which in turn suppressed inflammation and endoplasmic reticulum stress (Lee et al., 2018). In short, these results indicated potential mechanisms (i.e., neurodevelopment and energy metabolism) between aging and MS.
2.2 Identifying essential relationships in MS by the integrated inflammaging model
An integrated inflammaging model was developed to explore the important relationships among aging, inflammation and MS (shown in Section 5.3). Table 2 (Chen and D'Mello, 2010; Wan, 2014; Maridas et al., 2017; Jatczak-Pawlik et al., 2020; Tong et al., 2020; Black et al., 2021; Correale, 2021; Fadul et al., 2021; Sehgal et al., 2021; Atiyah et al., 2023) demonstrated the top ten aging, inflammatory and disease markers, respectively. For example, BMP8A (bone morphogenetic protein 8a), the top aging marker, can achieve anti-adiposity by promoting fatty acid oxidation and inhibiting adipocyte differentiation (Zhong et al., 2023). Here, FNDC4 was also identified as the top disease marker in triples. IDO1 (indoleamine 2,3-dioxygenase 1) was the top inflammatory marker as a key determinant enzyme in the metabolism of L-tryptophan (Trp), shifting the process from serotonin production to kynurenine production (Correale, 2021). The roles of the kynurenine pathway included endogenous regulation of neuronal excitability, initiation of immune tolerance and synthesis of nicotinamide adenine dinucleotide (NAD), where NAD+ being a key molecule in a variety of biochemical processes (Mbongue et al., 2015; Zhong et al., 2023). In summary, the integrated inflammaging model revealed important relationships among aging, inflammation and MS.
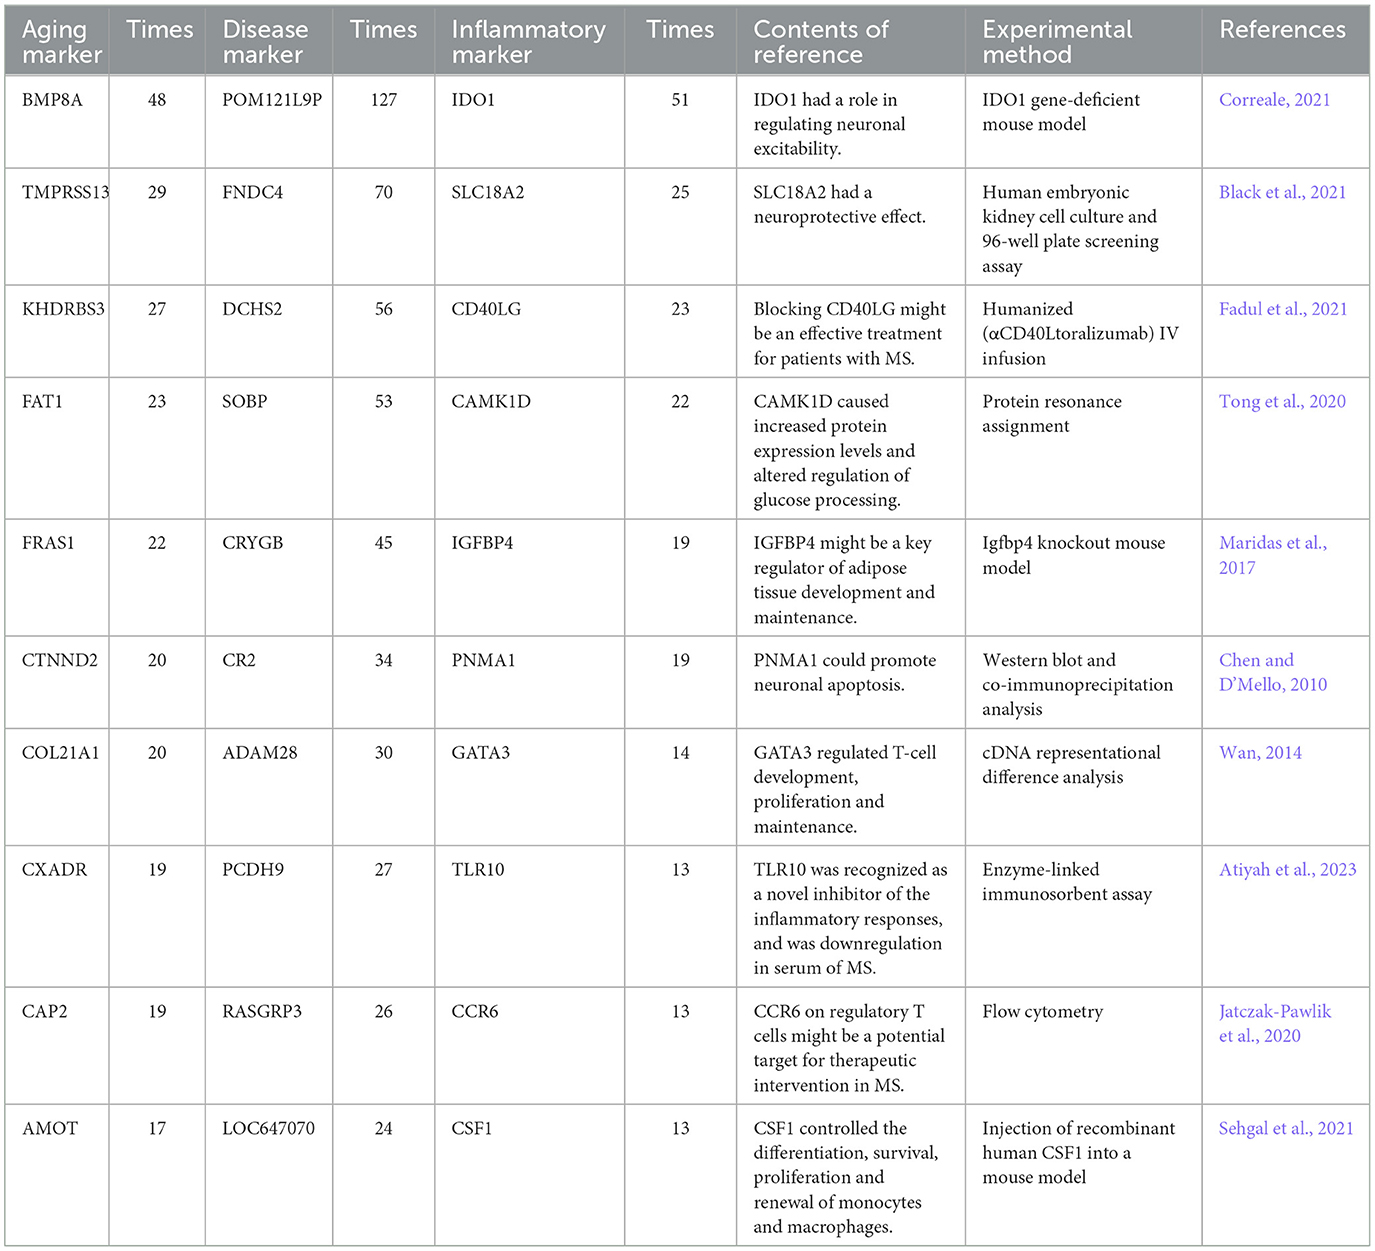
Table 2. The top ten aging, inflammatory, and disease markers from the integrated inflammaging model.
2.3 Sensitivity analysis revealed crucial relationships between inflammaging and MS
The Markov Chain Monte Carlo (MCMC) method was used to assess the sensitivity indices between inflammaging and MS. As a result, the 35 sensitive triples (by calculating the absolute difference frequency) were shown in Table 3 (Sarasin-Filipowicz et al., 2009; Chen and D'Mello, 2010; Bergbold and Lemberg, 2013; Liu et al., 2013; Malhotra et al., 2013; Wan, 2014; Charbit et al., 2015; Fusco et al., 2015; An et al., 2017; Arentsen et al., 2017; Maridas et al., 2017; Mathur et al., 2017; Xiao et al., 2019; Immler et al., 2020; Sato et al., 2020; Tong et al., 2020; Buhelt et al., 2021; Correale, 2021; Fadul et al., 2021; Ma et al., 2021; Peng et al., 2021; Bogacka et al., 2022; Franceschi et al., 2022; Hjæresen et al., 2022; Khurana and Goswami, 2022; Liu S. et al., 2022; Schebb et al., 2022; Watanabe et al., 2022; Saeidi et al., 2023). For example, the sensitive triple with maximum difference was “TMPRSS13-USP18-DCHS2” (the absolute difference value was 0.270469). TMPRSS13 (transmembrane serine protease 13) had an essential role in its zymogen autoactivation, proteolytic activity to ward the protein substrate prostasin and phosphorylation (Martin et al., 2021). USP18 (Ubiquitin-specific peptidase 18) was a deubiquitinating enzyme, and as a negative regulator of type I IFN (IFN-α and IFN-β) signaling pathway, where IFN-β was effective for treating MS (Sarasin-Filipowicz et al., 2009; Malhotra et al., 2013; Charbit et al., 2015). In short, USP18 was vital to MS pathogenesis (Malhotra et al., 2013). DCHS2 (dachsous cadherin-related 2) has been implicated in the regulations of planar cell polarity and cell movement (such as convergence-extension and cell migration) (Lodge et al., 2020).
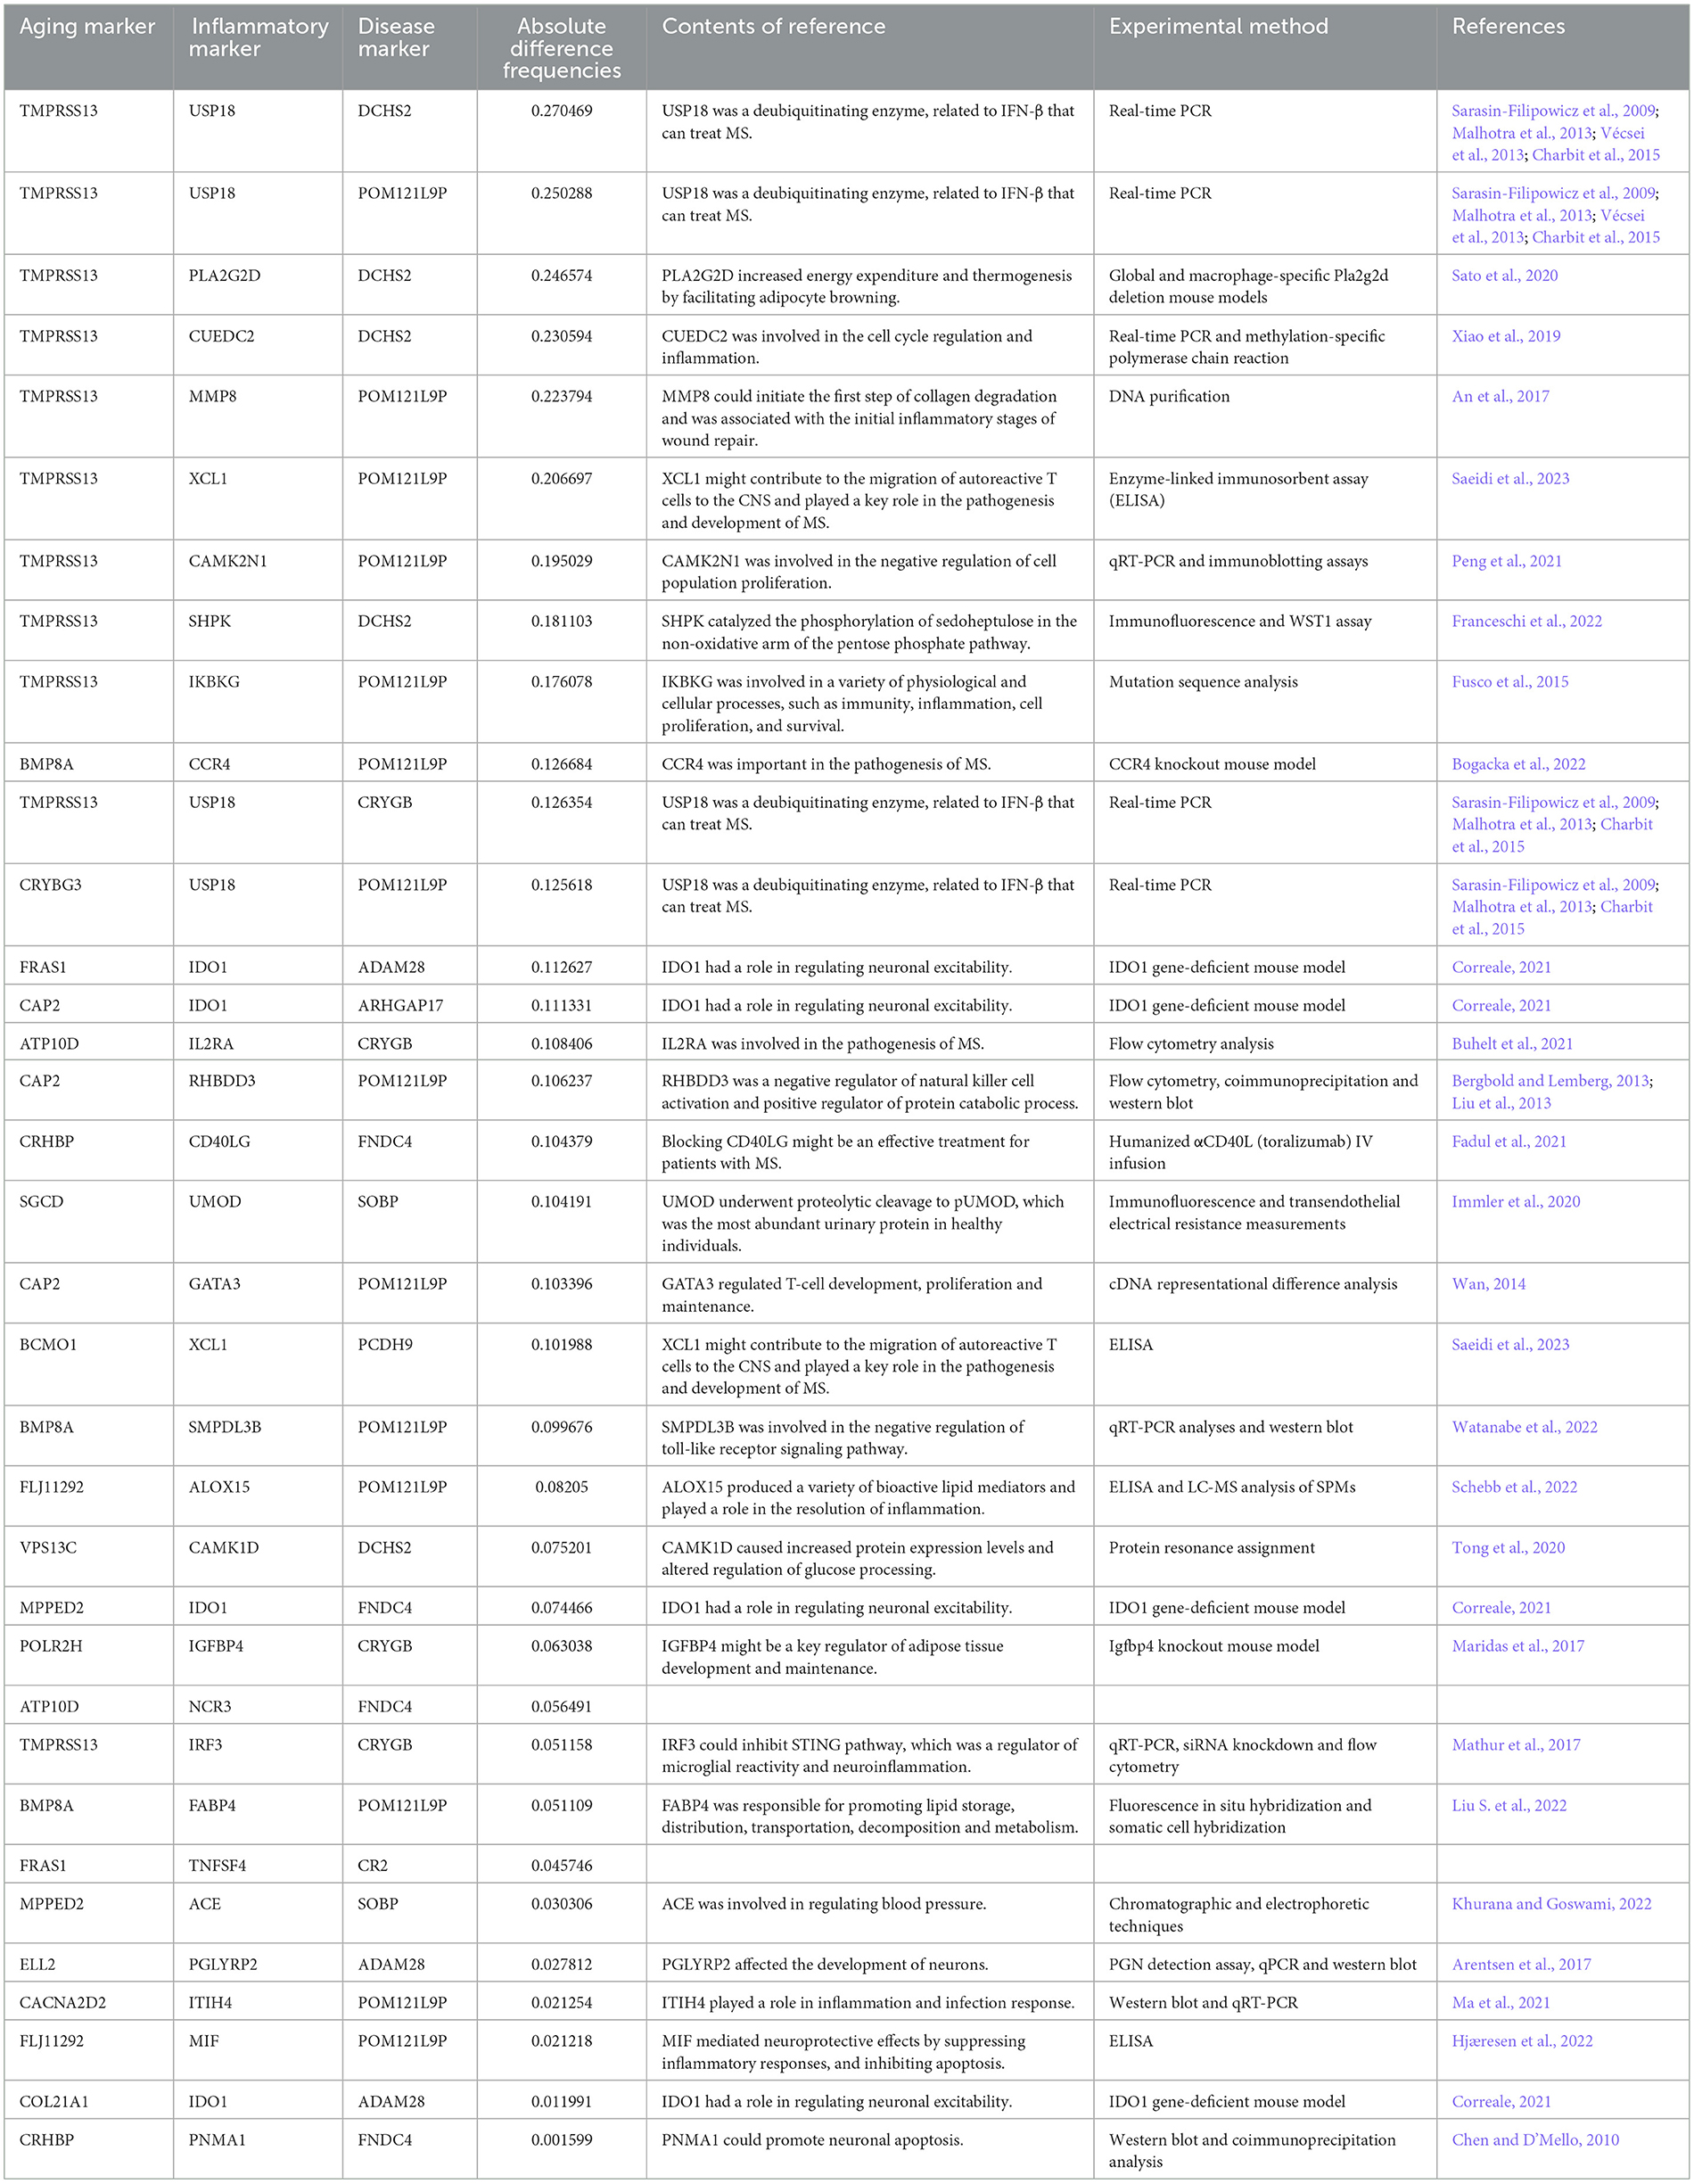
Table 3. Absolute difference frequencies for 35 triples in the sensitivity analysis.
The top sensitive (with occurring times) aging, inflammatory and disease markers were also shown in Table 4 (Sarasin-Filipowicz et al., 2009; Chen and D'Mello, 2010; Malhotra et al., 2013; Charbit et al., 2015; An et al., 2017; Arentsen et al., 2017; Lee et al., 2018; Xiao et al., 2019; Sato et al., 2020; Peng et al., 2021; Franceschi et al., 2022; Saeidi et al., 2023). For example, the top aging and inflammatory markers were also TMPRSS13 and USP18, respectively. POM121L9P was a pseudogene and the second disease marker was DCHS2. In summary, the sensitive analysis indicated that protein homeostasis and cellular homeostasis played important roles in the development of MS.
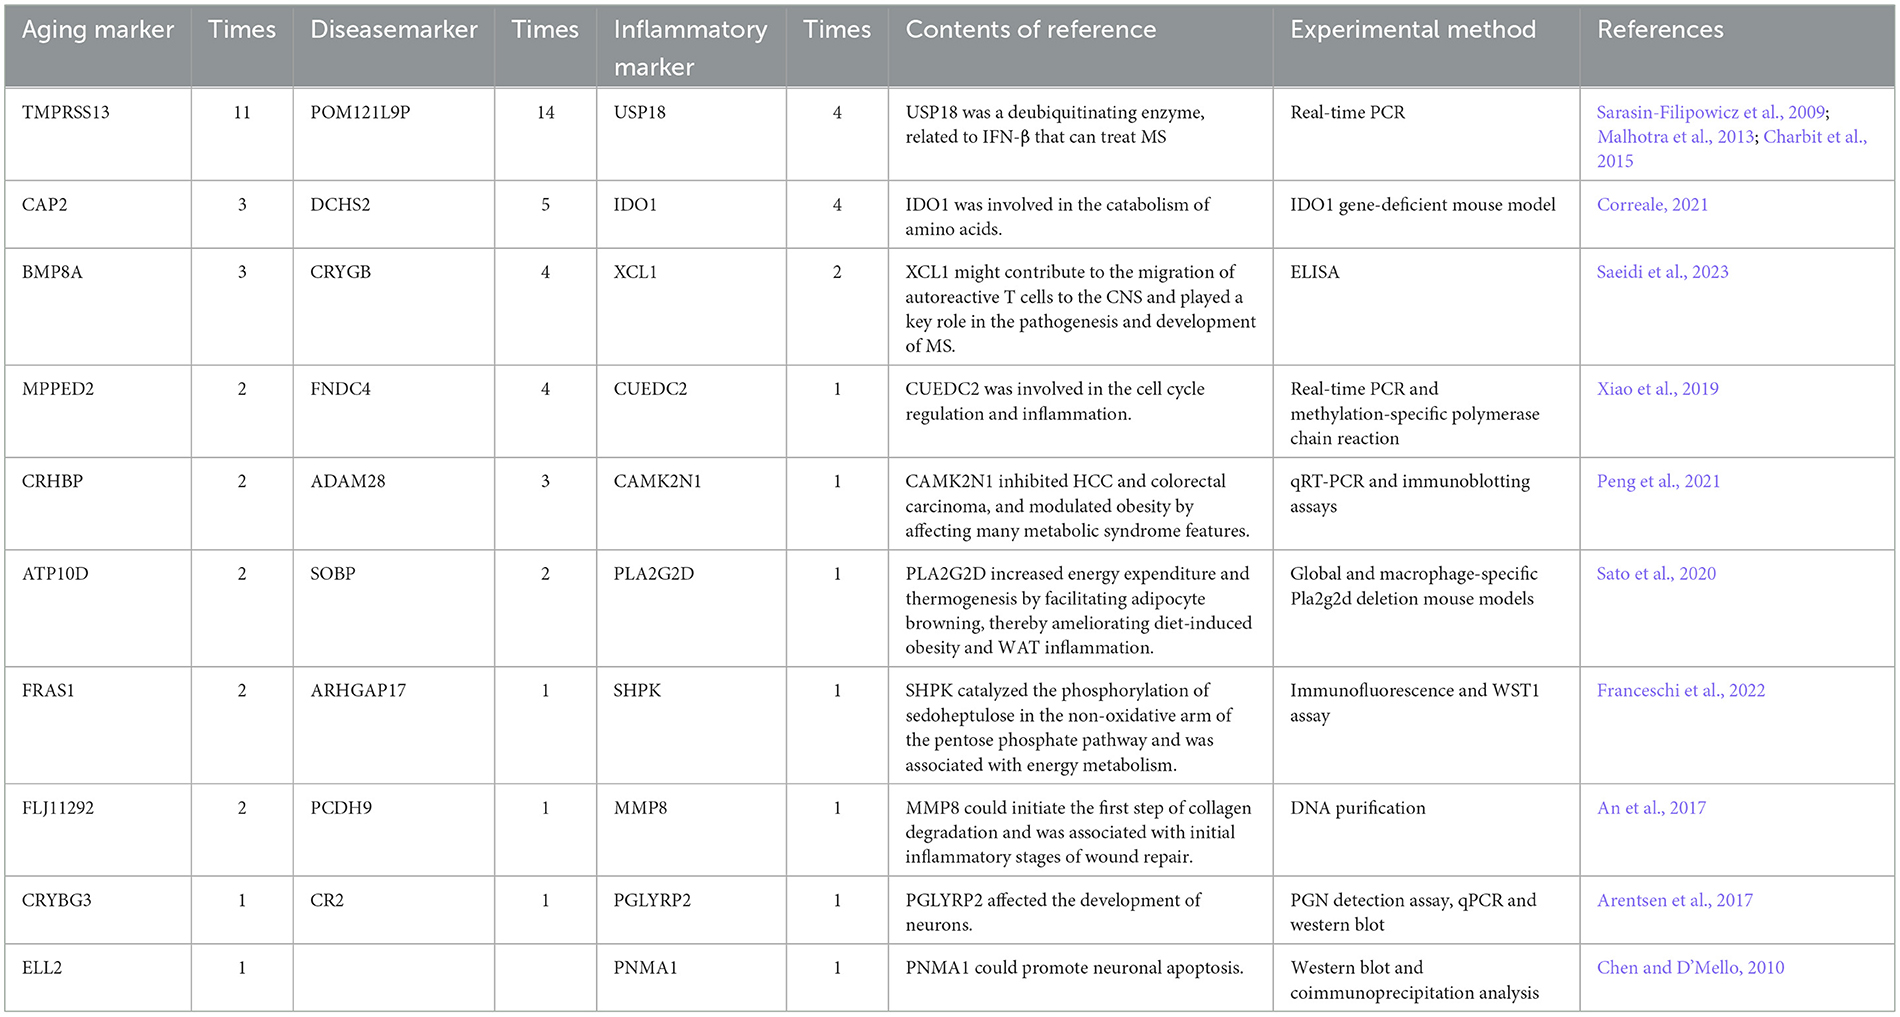
Table 4. Sensitivity analysis of the top 10 genes related to aging, disease, and inflammation.
2.4 Underlying inflammaging mechanisms by enrichment analysis
To further explore potential underlying mechanisms between inflammaging and MS, each shortest path between inflammatory and disease markers was obtained based on the Dijkstra algorithm, then the enrichment analysis was performed based on Kyoto Encyclopedia of Genes and Genomes (KEGG) pathway and Biological Process (BP) terms in Gene Ontology (GO). Because the starting point in each shortest path was a inflammatory marker, the enriched functions was analyzed by deleting the starting point, or analyzed other enriched functions excluding inflammation related function if containing the starting point.
The top ten KEGG pathways were shown in Table 5 (Lasky, 1991; Reichardt, 2006; Fujita et al., 2009; O'Callaghan et al., 2017; Conway, 2018; Gao et al., 2018; Kotelnikova et al., 2019; Plantone et al., 2019; Ten Bosch et al., 2021; Bahadoram et al., 2022; Bohmwald et al., 2022; Sen et al., 2022; Wu and Zhou, 2022; Chen et al., 2023; Liu et al., 2023; Touil et al., 2023; Guerra-Espinosa et al., 2024) and Figure 3 and Supplementary Figure S1 (without the starting point). For example, the KEGG pathway that was most enriched shortest paths was “B CELL RECEPTOR SIGNALING PATHWAY” (enriched 50 shortest paths, Figure 3A and Supplementary Figure S1A). BCR was critical for B cells to properly elicit an immune response (Tanaka and Baba, 2020). The KEGG pathway with minimum FDR was “ALDOSTERONE REGULATED SODIUM REABSORPTION” (FDR = 0.0902, Figure 3C and Supplementary Figure S1C), where sodium reabsorption occurred in the kidney (Franken et al., 2021). Sodium accumulation might play a critical role in both inflammatory and neurodegenerative processes in MS patients (Zostawa et al., 2017; Huhn et al., 2019). Furthermore, it has been shown that sodium accumulation leads to the release of calcium, which can exacerbate neurological disorders (Yang et al., 2015).
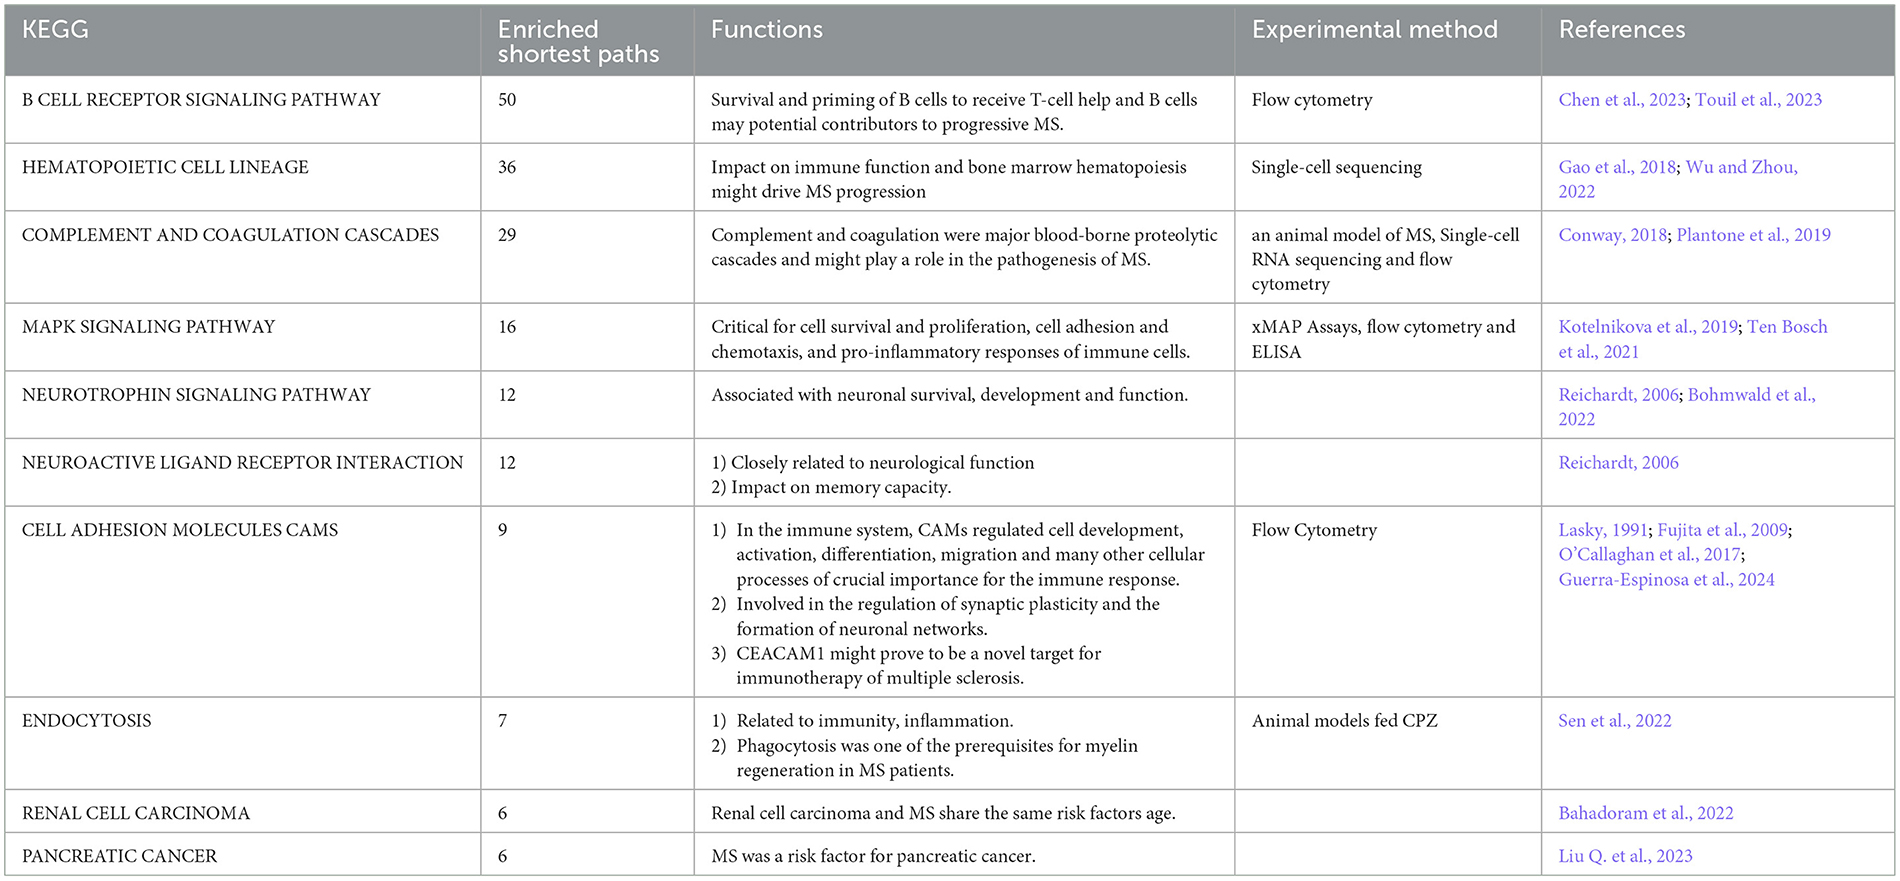
Table 5. Top 10 most enriched KEGG pathways.
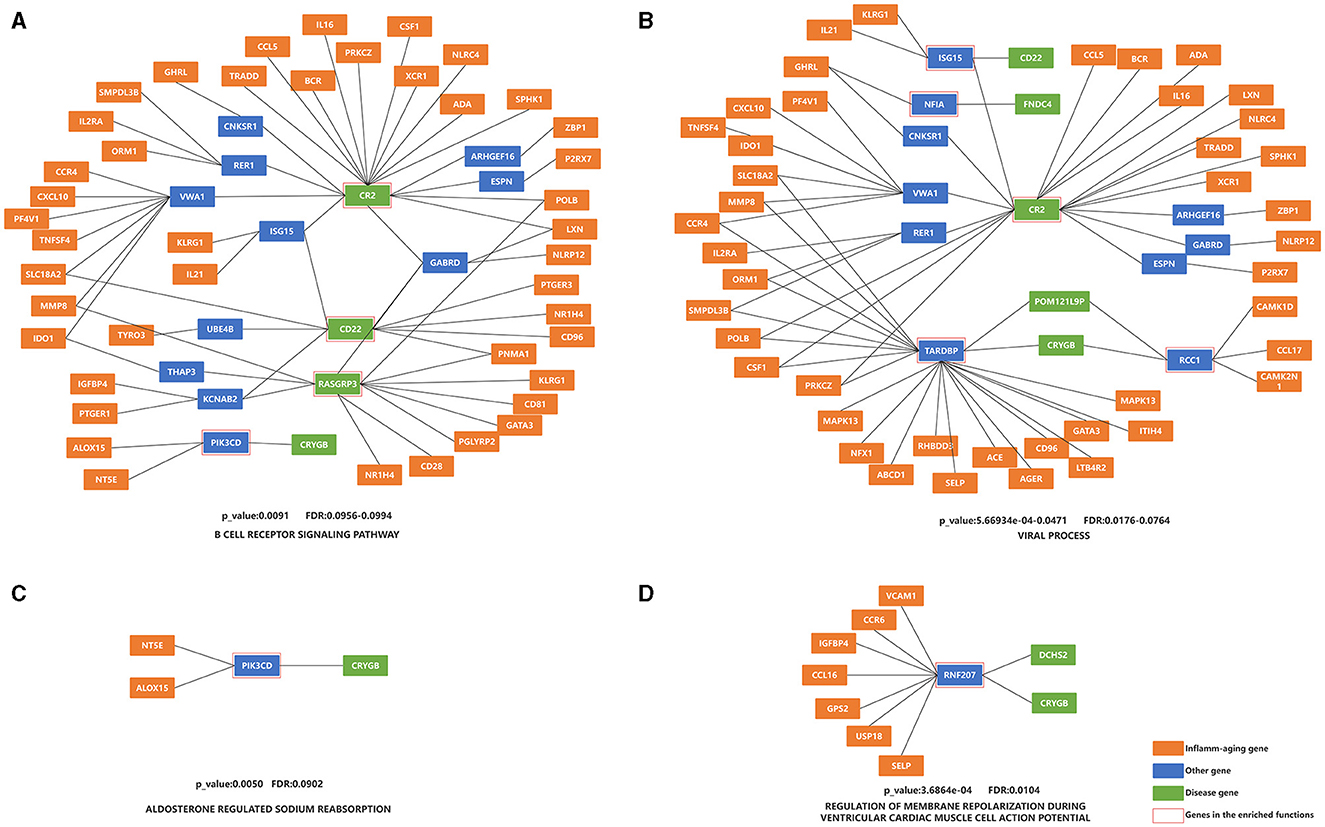
Figure 3. Enrichment analysis of the shortest paths of KEGG and BP, after combining overlap shortest paths. (A) KEGG with the most shortest enriched paths; (B) BP with the most shortest enriched paths; (C) KEGG with the minimum FDR; (D) BP with the minimum FDR. The orange nodes represent the inflammaging markers, the blue nodes represent the genes connecting inflammaging markers and disease markers, the green nodes represent the disease markers, and the genes in the red square frames coincide with those genes in the enriched functions.
The top ten BP terms were shown in Table 6 (Lasky, 1991; Rønn et al., 1998; Olivieri et al., 2003; Vély and Vivier, 2005; Suzuki and Takeichi, 2008; Shishido et al., 2012; Janssens et al., 2015; Yan et al., 2018; Nick, 2019; Bjornevik et al., 2023; Marzvanyan and Alhawaj, 2023; Soldan and Lieberman, 2023) and Figure 3 and Supplementary Figure S1 (without the starting point). For example, the BP term with the most enriched shortest paths was “VIRAL PROCESS” (GO: 0016032, enriched 53 shortest paths, Figure 3B and Supplementary Figure S1B). Some studies have shown that EBV is one of the primary causes of MS (Bjornevik et al., 2023), by affecting the cellular homeostasis (Sun et al., 2013). The BP term with minimum FDR was “REGULATION OF MEMBRANE REPOLARIZATION DURING VENTRICULAR CARDIAC MUSCLE CELL ACTION POTENTIAL” (GO:1905024, FDR = 0.0104, Figure 3D and Supplementary Figure S1D), which affected neurons, and thus MS, through action potentials (Mangold et al., 2017).
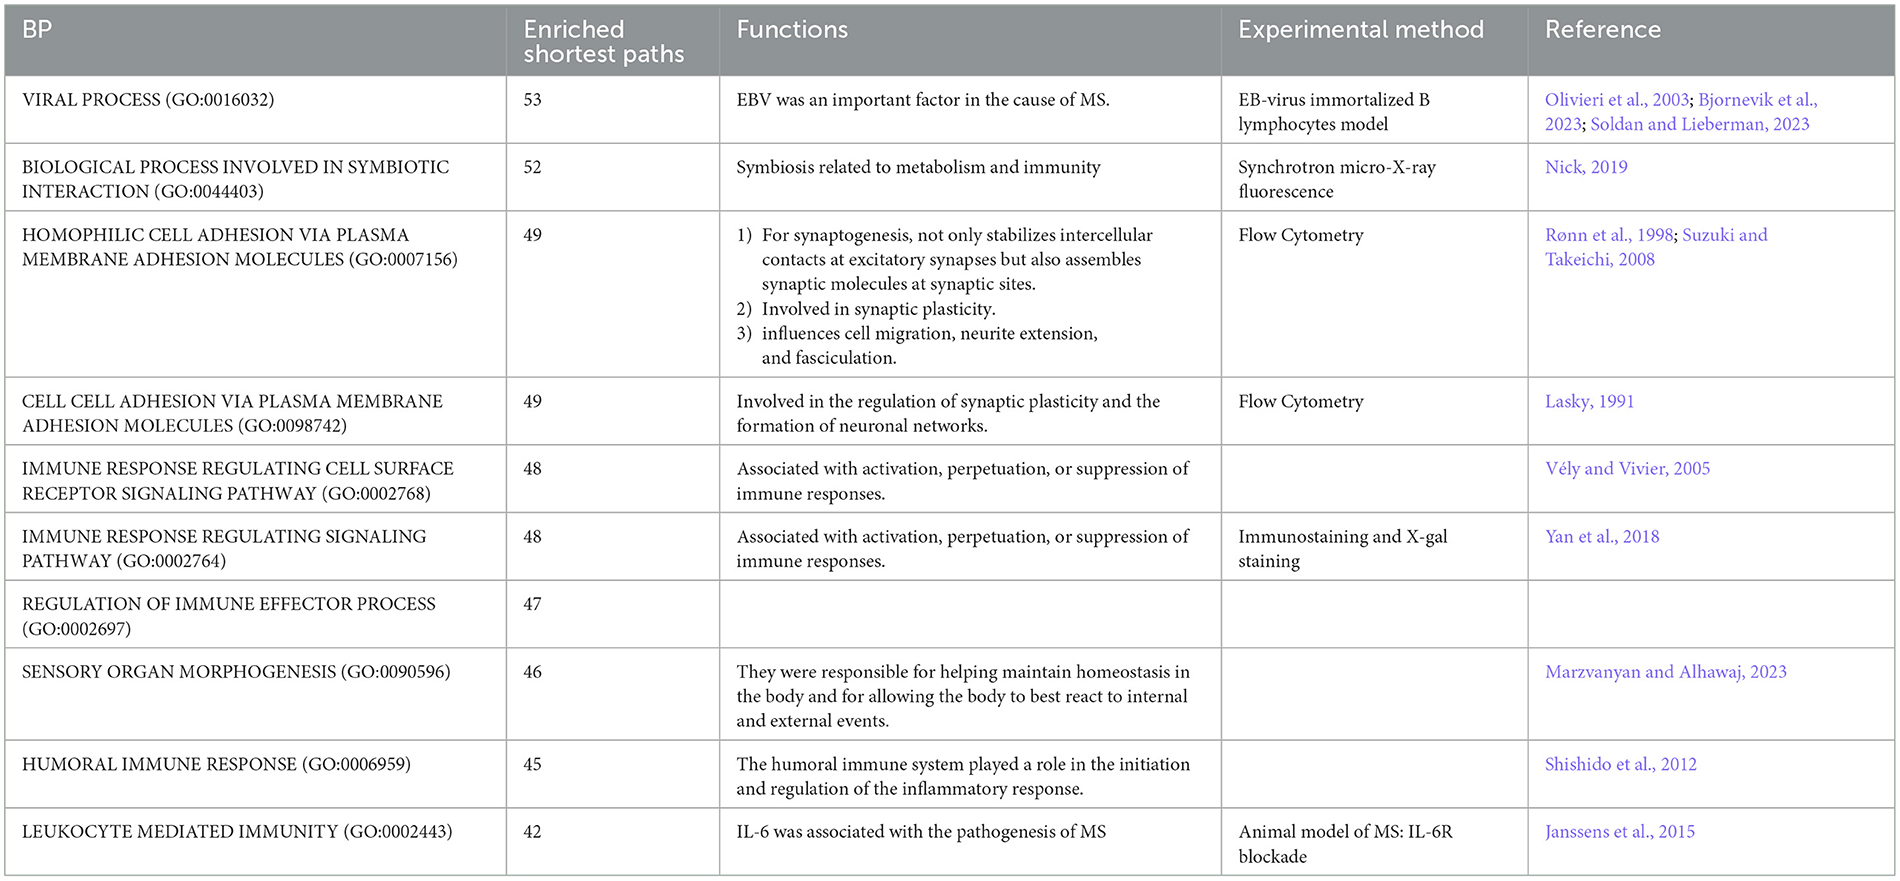
Table 6. Top 10 most enriched BP pathways.
The top ten KEGG pathways were shown in Supplementary Table S5 (containing the starting point) (Lasky, 1991; Reichardt, 2006; Allen et al., 2007; O'Callaghan et al., 2017; Conway, 2018; Gao et al., 2018; Kotelnikova et al., 2019; Plantone et al., 2019; Cui et al., 2020; Amoriello et al., 2021; Balkan and Bilge, 2021; Wu and Zhou, 2022; Chen et al., 2023; Leonard and Lin, 2023; Suptela and Marriott, 2023; Touil et al., 2023; Guerra-Espinosa et al., 2024). For example, one enriched pathway was “COMPLEMENT AND COAGULATION CASCADES,” where complement and coagulation were major blood-borne proteolytic cascades (Conway, 2018). Another crucial enriched pathway was “MAPK SIGNALING PATHWAY,” which was critical for cell survival, proliferation, adhesion and chemotaxis, as well as pro-inflammatory responses of immune cells (Kotelnikova et al., 2019). In addition, studies have shown that microglia with overactive MAPK interfere with local oligodendrocytes, leading to localized regional demyelination (a hallmark of MS) (Ten Bosch et al., 2021). The KEGG pathway with minimum FDR (Supplementary Table S6) was “NICOTINATE AND NICOTINAMIDE METABOLISM” (FDR = 0.001626), which produced the biologically active coenzymes, nicotinamide adenine dinucleotide (NAD), and its phosphate analog, the nicotinamide adenine dinucleotide phosphate (NADP) (Gasperi et al., 2019). Moreover, nicotinamide had been implicated in the development, survival and other function of neurons in the CNS, with both neuronal death and neuroprotection (Fricker et al., 2018). The top ten BP terms were shown in Supplementary Table S7 (Holman et al., 2011; Shishido et al., 2012; Zevini et al., 2017; Díaz et al., 2019; Silk and Margolin, 2019; Liu et al., 2022a,b; Huang et al., 2023) and the top ten BP terms with minimum FDR were shown in Supplementary Table S8 (containing the starting point). There were some BP terms connected to the microglia cell, which closely related to remyelination (Lloyd et al., 2019).
In summary, the enrichment analysis revealed various risk factors in MS, such as inflammation, neurodevelopment and cellular homeostasis.
2.5 Network markers identified potential risk markers
Network markers were identified by calculating the betweeness of the shortest path for each “inflammation-disease” pair, where the top 10 markers were shown in Table 7. For example, the top network marker (with the maximum betweeness and significant permutation result) was TARDBP (Transactive response DNA binding protein), where the relative network modules (including all the related shortest paths) were shown in Figure 4. It has been reported that TARDBP encoded the intranuclear protein TDP-43 (Transactive response DNA binding protein of 43 kDa) that played a role in the cellular stress response (Higashi et al., 2013). Stress granules were cytoplasmic foci that respond to cellular stress, and TDP-43 bound to ribosomes in stress granules, temporarily halting translation and promoting cytoprotective protein synthesis (Higashi et al., 2013; Baradaran-Heravi et al., 2020; Meneses et al., 2021). In addition, TARDBP was a risk factor for amyotrophic lateral sclerosis, frontotemporal dementia, and Alzheimer's disease, exacerbating cognitive impairment (Manohar et al., 2009; Meneses et al., 2021). In short, potential crucial risk markers were further identified by network analysis.
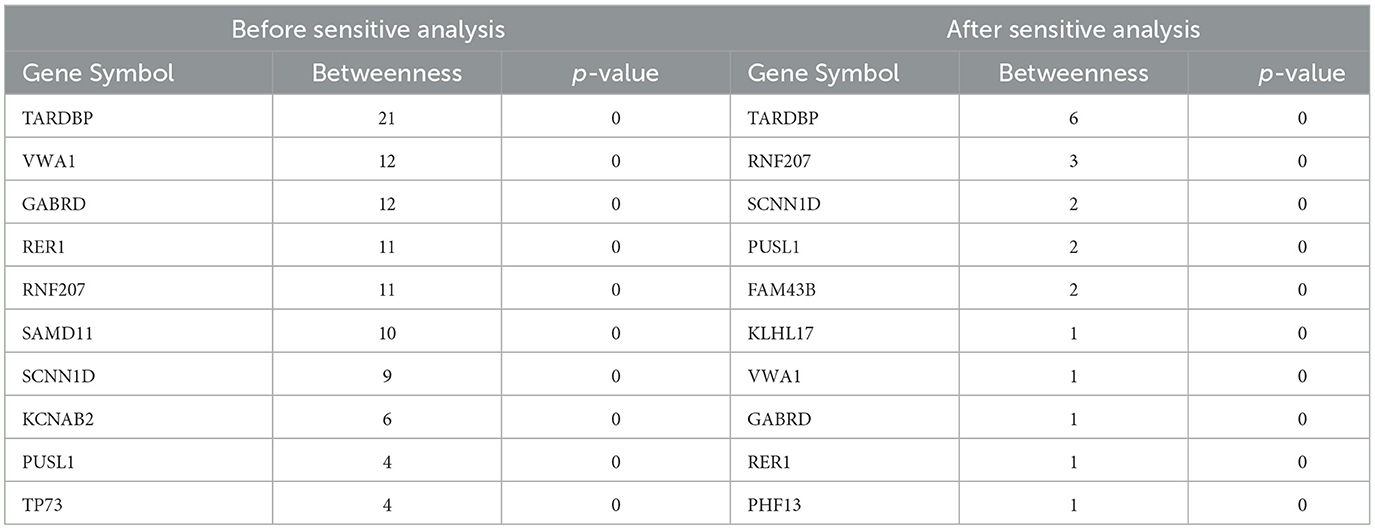
Table 7. Top 10 genes with the highest betweenesses.
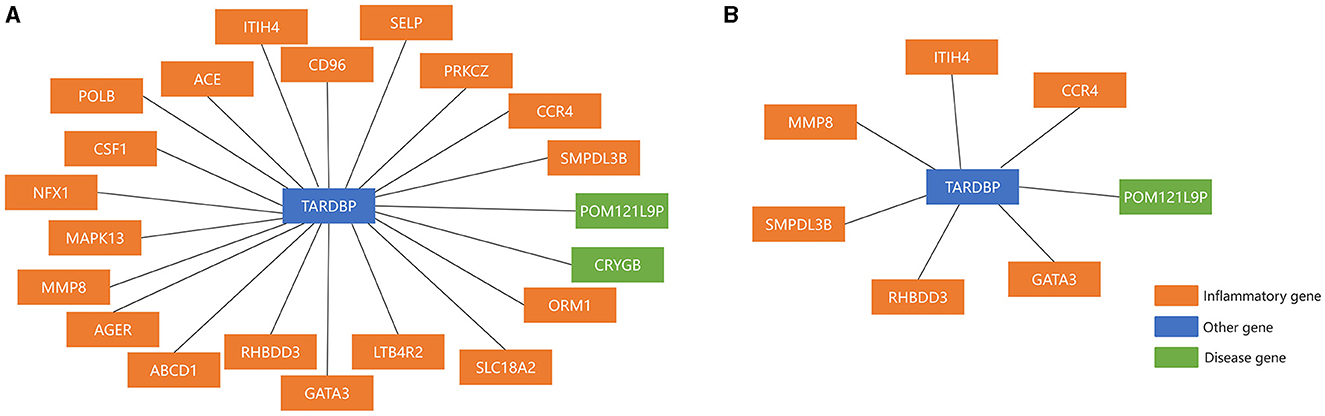
Figure 4. The top Network marker with the maximum betweeness. (A) Before sensitivity analysis; (B) after sensitivity analysis.
2.6 Pan-cancer analysis further validated the mechanism of inflammaging in MS
Pan-cancer analysis was used to further validate the relevant functions of “aging-inflammation-disease” triples. For example, the markers in triples were used to assess the survival indices across different cancer types. There were 9 out of 16 cancer types with significant results (including BLCA, HNSC, KIRC, KIRP, LIHC, LUAD, LUSC, READ and UCEC, shown in Figure 5). These results suggested that inflammaging markers could also be used as relative risk factors for cancer.
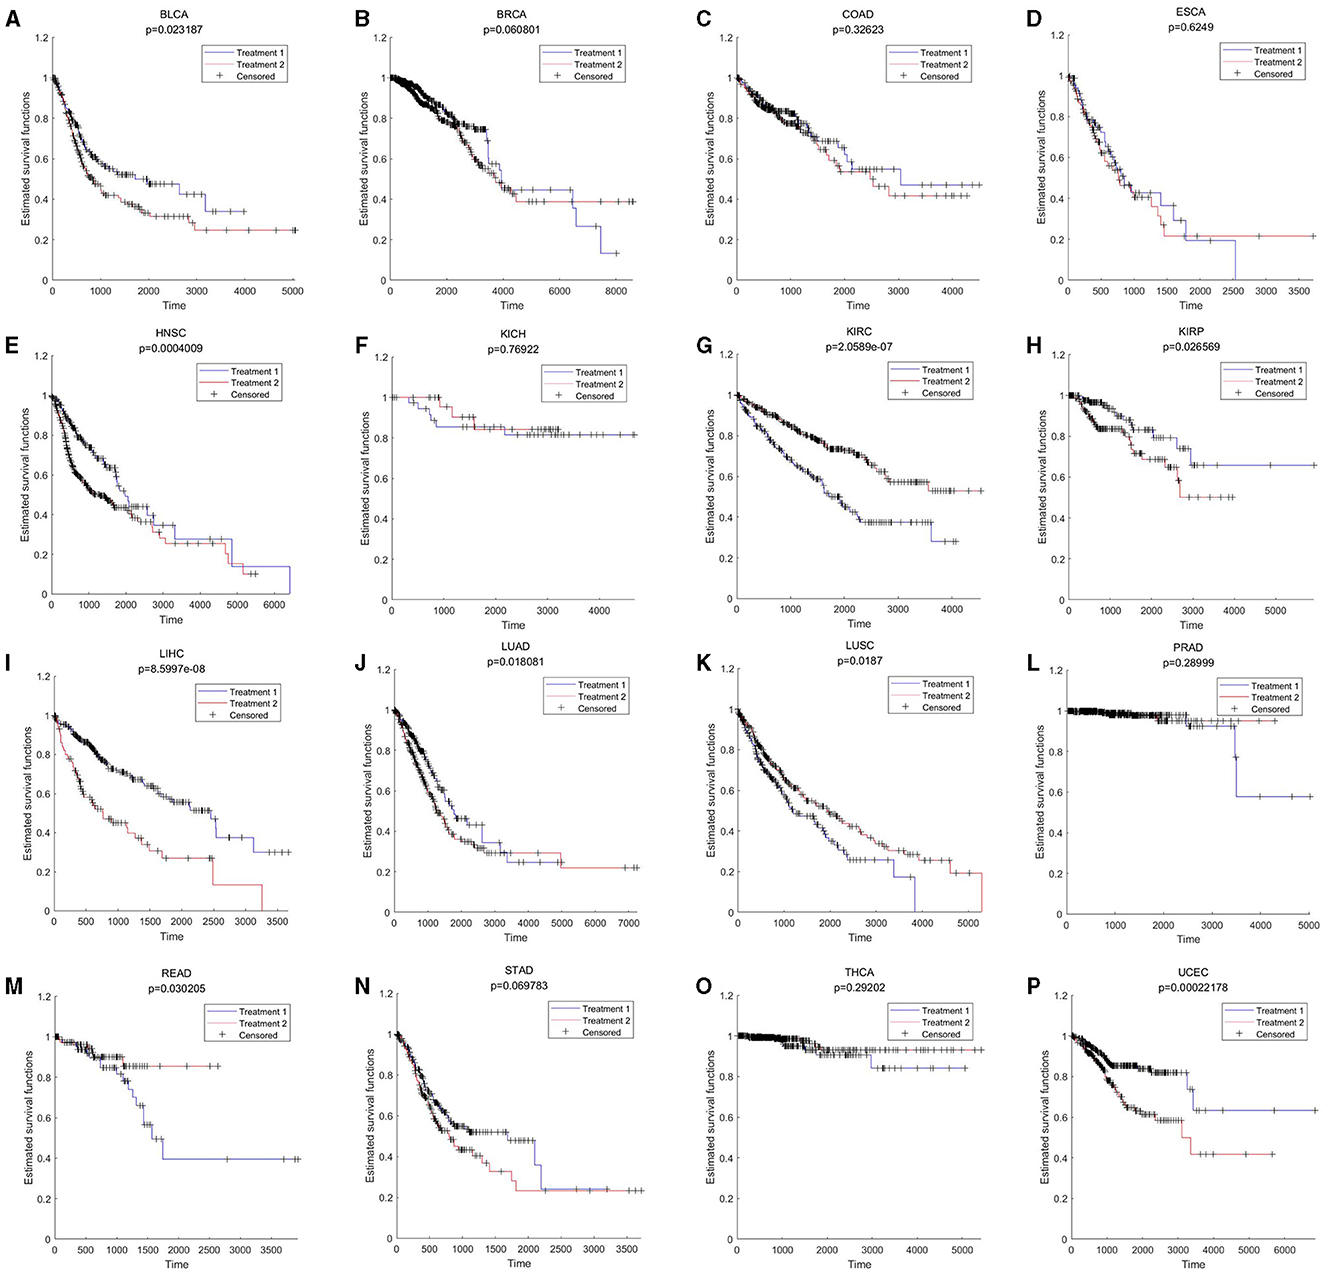
Figure 5. Survival results across different cancer types. BLCA, KICH, KIRC, PRAD, READ, STAD, THCA, and UCEC are based on aging markers; BRCA, COAD, ESCA, HNSC, KIRP, LIHC, LUAD, and LUSC are based on gene the whole differential co-expression pattern (by using Equations 9, 10 in Section 5.3). (A) BLCA; (B) BRCA; (C) COAD; (D) ESCA; (E) HNSC; (F) KICH; (G) KIRC; (H) KIRP; (I) LIHC; (J) LUAD; (K) LUSC; (L) PRAD; (M) READ; (N) STAD; (O) THCA; and (P) UCEC.
In addition, based on enrichment analysis, both the commonality and specificity across 16 cancer types were further investigated. The top 10 common KEGG pathways were shown in Figure 6A, with the highest enrichment score of “CALCIUM SIGNALING PATHWAY.” A growing body of research suggested that calcium homeostasis contributed to well-known cancer-causing signals. Many studies had emphasized that calcium signaling contributed to the progression of several cancer types (e.g., glioma, prostate, and breast) through the activation of STAT3 (Wu et al., 2021). Meanwhile, calcium channels played an important role in the excitation and propagation of neuronal action potentials (Pourtavakoli and Ghafouri-Fard, 2022). The top 10 common BP terms were shown in Figure 6B, with the highest enrichment scoring of “NERVOUS SYSTEM PROCESS” (GO:0050877), indicating the key role of the nervous system in cancer (Hanahan and Monje, 2023). Supplementary Table S9 (Peterson et al., 2020; Feng et al., 2021; Glorieux and Buc Calderon, 2021; Hou et al., 2021; Naghshi et al., 2021) and Supplementary Table S10 (Martens and Mithöfer, 2005; Turner and Grose, 2010; Menezes et al., 2018; Arneson and Doles, 2019; Przygodzka et al., 2019; Keough and Monje, 2022; Ohkuni et al., 2022; Libretti and Aeddula, 2023; Lustberg et al., 2023) summarized the specific enrichment results in each cancer, indicating that a series of risk factors (such as neurodevelopment and cellular homeostasis) were also crucial to cancer.
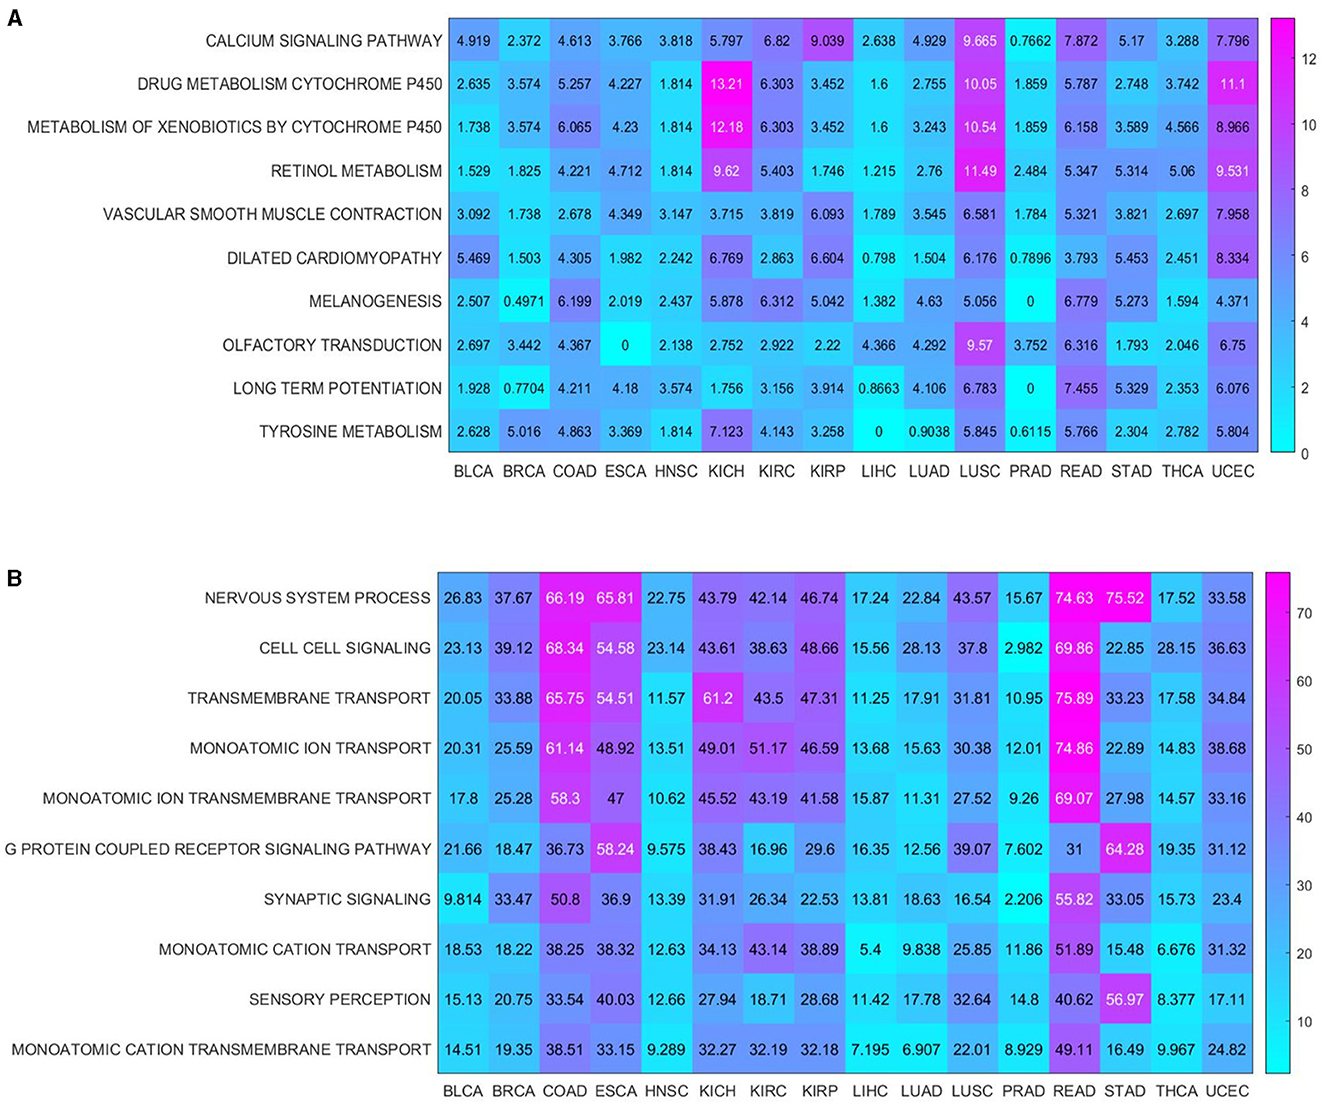
Figure 6. Enrichment analysis shared by cancers. (A) KEGG pathways enriched in 16 cancers; (B) BP terms enriched in 16 cancers.
In summary, our findings highlighted a series of key functions associated with inflammaging that could also be used to investigate potential mechanisms in cancer.
3 Discussion
The inflammatory response plays a crucial role in MS. However, the important relationships among aging, inflammation and MS remain to be further explored in depth. In this paper, a series of computational methods were used to explore these relationships and relative mechanisms in MS. First, both aging and disease predictors were modeled to identify relative aging and disease markers, respectively. Then, an integrated inflammaging model was developed to find important “aging-inflammation-disease” triples. Further, the potential mechanisms between inflammation and MS were investigated using network analysis, sensitivity analysis, enrichment analysis and pan-cancer analysis. In short, various risk factors in MS were integrated at system level.
Our findings emphasized that protein homeostasis was vital to the MS development. For example, the disease marker FNDC4, could lead to AMP-activated protein kinase (AMPK) phosphorylation (Lee et al., 2018). Moreover, in the MCMC (Table 3), the most sensitive marker of aging was TMPRSS13, playing a key role in proteolytic activity and phosphorylation (Martin et al., 2021). In the enrichment analysis, the KEGG pathway was “COMPLEMENT AND COAGULATION CASCADES,” which was associated with protein catabolism (Conway, 2018). In summary, our results also confirmed that the protein homeostasis played an important role in MS by interacting with the immune system, even accelerating the progression of MS (Negrotto and Correale, 2017).
The cellular homeostasis was also highlighted in this work. For example, the top network marker was TARDBP (Figure 4), which encoded the intranuclear protein TDP-43 that played a role in the cellular stress response (Higashi et al., 2013). Moreover, in MCMC (Table 3), the inflammatory marker CUEDC2 was involved in the cell cycle regulation (Xiao et al., 2019). According to the enrichment analysis, one of the most enriched KEGG pathways was “MAPK SIGNALING PATHWAY.” The MAPK pathway is associated with cell proliferation, differentiation, migration, senescence, and apoptosis (Sun et al., 2015). Furthermore, lytic cell death pathways (such as pyroptosis, necroptosis, ferroptosis, and PANoptosis) are closely related to neuroinflammation and even exacerbate MS (Lee et al., 2023). This demonstrated the key role of cellular homeostasis in MS.
Neurodevelopment played an important role in the development of MS. For example, the top aging marker TSPAN6 was a regulator of synaptic transmission and plasticity mechanisms (Salas et al., 2017). The inflammaging model had identified a series of inflammatory markers associated with neuronal formation in MS (Table 2): DO1 had a role in regulating neuronal excitability (Correale, 2021); SLC18A2 was neuroprotective and PNMA1 promoted neuronal apoptosis (Chen and D'Mello, 2010; Black et al., 2021). In the enrichment analysis, the KEGG pathways “NEUROTROPHIN SIGNALING PATHWAY” and “NEUROACTIVE LIGAND RECEPTOR INTERACTION” also highlighted the neurodevelopment (Reichardt, 2006; Bohmwald et al., 2022). MS is a wellknown neuroinflammatory disease, where neuronal damage is vital to the progression of MS lesions (Schirmer et al., 2019). In sum, our results highlighted the neurodevelopment in MS.
The energy metabolism was also involved in the development of MS. For example, in the integrated inflammaging model (Table 2), the aging marker BMP8A, enabled anti-adiposity by promoting fatty acid oxidation and inhibiting adipocyte differentiation (Zhong et al., 2023); the inflammatory marker IGFBP4 was an important regulator of adipose tissue development (Maridas et al., 2017). In addition, in MCMC (Table 4), the inflammation marker SHPK catalyzed the phosphorylation of sedoheptulose in the non-oxidative arm of the pentose phosphate pathway (Franceschi et al., 2022). Furthermore, in the enrichment analysis (Supplementary Table S6), the KEGG pathway with minimum FDR was “NICOTINATE AND NICOTINAMIDE METABOLISM” (FDR = 0.001626), which produced the biologically active coenzymes NAD (its phosphate analog was the NADP) (Gasperi et al., 2019). There was also a series of pathogenesis in MS along with the energy failure of the CNS (Park and Choi, 2020). These results suggested that energy metabolism was closely related to the MS progression.
It has been well known that MS is a chronic inflammatory disease, which is closely related to the aging process. Herein various risk factors for MS were explored based on aging-related inflammation (inflammaging). In this work, a series of computational methods were used to investigate potential molecular mechanisms in MS. An inflammaging model was constructed to obtain the “aging-inflammation-disease” triples, and then crucial inflammaging characteristics in MS were identified. In addition, these results could also indicate further the relative experimental validations. In short, the complex mechanisms in MS could be further studied by exploring key inflammaging indices, where various risk factors were integrated at system level.
Stridently, the identified inflammaging characteristics in MS (i.e., the inflammaging markers, enriched KEGG pathways or BP terms, shown in Tables 2–6) have been validated by a series of relative experiment results. For example, inflammaging could alter the transport capacity of B cells, making them more sensitive to cytokines and pro-inflammatory molecules, which were overproduced in the elderly (Bulati et al., 2014). Recently, using the flow cytometry, it has been demonstrated that the combination of pro-inflammatory interleukin-21 (IL-21) and B-cell receptor (BCR) stimulation enabled B cells to produce/secrete the active form of the cytotoxic serine protease granzyme B (GrB), which might exacerbate the MS progression (Niland et al., 2010; Bulati et al., 2014). Further, the coagulation pathway was also identified in this work, and even confirmed by other experimental results of MS (by using animal models, single-cell RNA sequencing, or flow cytometry). It has been reported that the coagulation cascade increased neuroinflammation during the aging process, thus interacting with a series of physiological factors such as neuronal deficits, oxidation, or dysfunction of the endoplasmic reticulum and mitochondria, which in turn contributed to the onset of MS (Conway, 2018; Plantone et al., 2019). In addition, Enzyme-linked immunosorbent assay (ELISA) indicated that “Bovine serum albumin (BSA)-advanced glycation end (AGE)” enhanced IL-6 expression through MAPK-ERK action (MAPK-ERK and MyD88 transduced NF-κB signaling pathways), and studies (both in vitro and in vivo) have demonstrated that IL-6 played a crucial role in regulating the immune response in MS (Janssens et al., 2015; Shen et al., 2019). The EBV infection have also been reported to increase the risk of developing MS approximately 32-fold (Bjornevik et al., 2022). EBV infected of B cells and T cells, leading to infected B cells infiltrated of the CNS and T cell exhaustion, where CD8 T cell deficiency contributed to the decreased CD8 T cell response to EBV-infected B cells and with functional declined in aged MS patients (Pender et al., 2012; Soldan and Lieberman, 2023). Note worthily, the perpetuation of “forbidden” autoreactive B-cell clone by EBV immortalization have been suggested as a potential mechanism for triggering MS (Pender, 2011). For example, in the context of inflammaging and immunosenescence, EB-virus immortalized B lymphocytes model have been shown to produce higher levels of IL-6, which was associated with the pathogenesis of MS (Olivieri et al., 2003; Janssens et al., 2015). In short, a series of key risk factors in MS were identified based on inflammaging, and even could be confirmed by relative experiments.
Studies had shown that the risk of cancer was increased in people with MS (Ragonese et al., 2017; Bosco-Lévy et al., 2022). It was well known that MS and cancer shared a series of common risk factors such as immunity, inflammation, cellular homeostasis, neurodevelopment, and protein homeostasis (Davidson et al., 2017; Przygodzka et al., 2019; Singh et al., 2019; Miller and Thorburn, 2021). Our findings also demonstrated that inflammation, neurodevelopment and cellular homeostasis were common risk factors in cancer [Figure 6B, i.e., “NERVOUS SYSTEM PROCESS” (GO:0050877), “SYNAPTIC SIGNALING” (GO:0099536) and “CELL CELL SIGNALING” (GO:0007267)]. Additionally, the key roles of inflammaging markers in different cancer types were further confirmed by survival analysis. Inflammation was increasingly recognized as an important factor impairing normal functions in CNS, which in turn affected both cancer and MS (Deverman and Patterson, 2009; Jiang et al., 2018). In addition, chronic inflammation disrupted the cellular homeostasis, which played an important role in the development of both MS and cancer (Kotas and Medzhitov, 2015). In short, various risk factors associated with inflammaging had also been demonstrated in cancer.
As with other research articles on MS (Denissen et al., 2021; Aslam et al., 2022) and other neurodegenerative diseases [e.g., Alzheimer's disease (Chang et al., 2021; Li J. et al., 2022) and Parkinson's disease (Boutet et al., 2021; Oliveira et al., 2023)], machine learning was utilized to build high accuracy models or predictive biomarkers, which were then subjected to enrichment analysis network analysis and so on. In addition, our study identified an integrative model based on machine learning to further explore the underlying mechanisms of MS in the context of inflammaging. As a result, a series of relative key risk factors were summarized at system level, and even validated across different cancer types. These results indicated that our results were with enough reliability and accuracy.
According to the inflammaging theory, the chronic inflammation was accumulated during the aging process, along with a series of dysregulated pathways (Fang et al., 2018). In addition, the immunosenescence was also accompanied with a series of molecular dysfunctions in both innate and adaptive immune systems, and even interacted with aging (Rodrigues et al., 2021; Liu et al., 2023). Both inflammation and aging were wellknown to affect microglia and astrocytes, which in turn impaired normal neurons (Neumann et al., 2019; Kwon and Koh, 2020; Diaz-Castro et al., 2021). Inflammation also affects the protein metabolism and cellular homeostasis (Antonangeli et al., 2021; Cibrian et al., 2022). In addition, these risk factors interplayed with each other to promote the development of MS. For example, dysregulations in cellular homeostasis can interact with the protein homeostasis, energy metabolism, etc., which in turn aggravated the MS progression (Huang et al., 2022). With the help of the integrated inflammaging model, our study highlighted a series of risk factors closely related to inflammaging in MS, such as protein homeostasis, cellular homeostasis, neurodevelopment and energy metabolism. These results also further confirmed both the theories of inflammaging and immunosenescence (Figure 7). In short, we integrated the potential mechanisms of MS in the context of inflammaging (Figure 7).
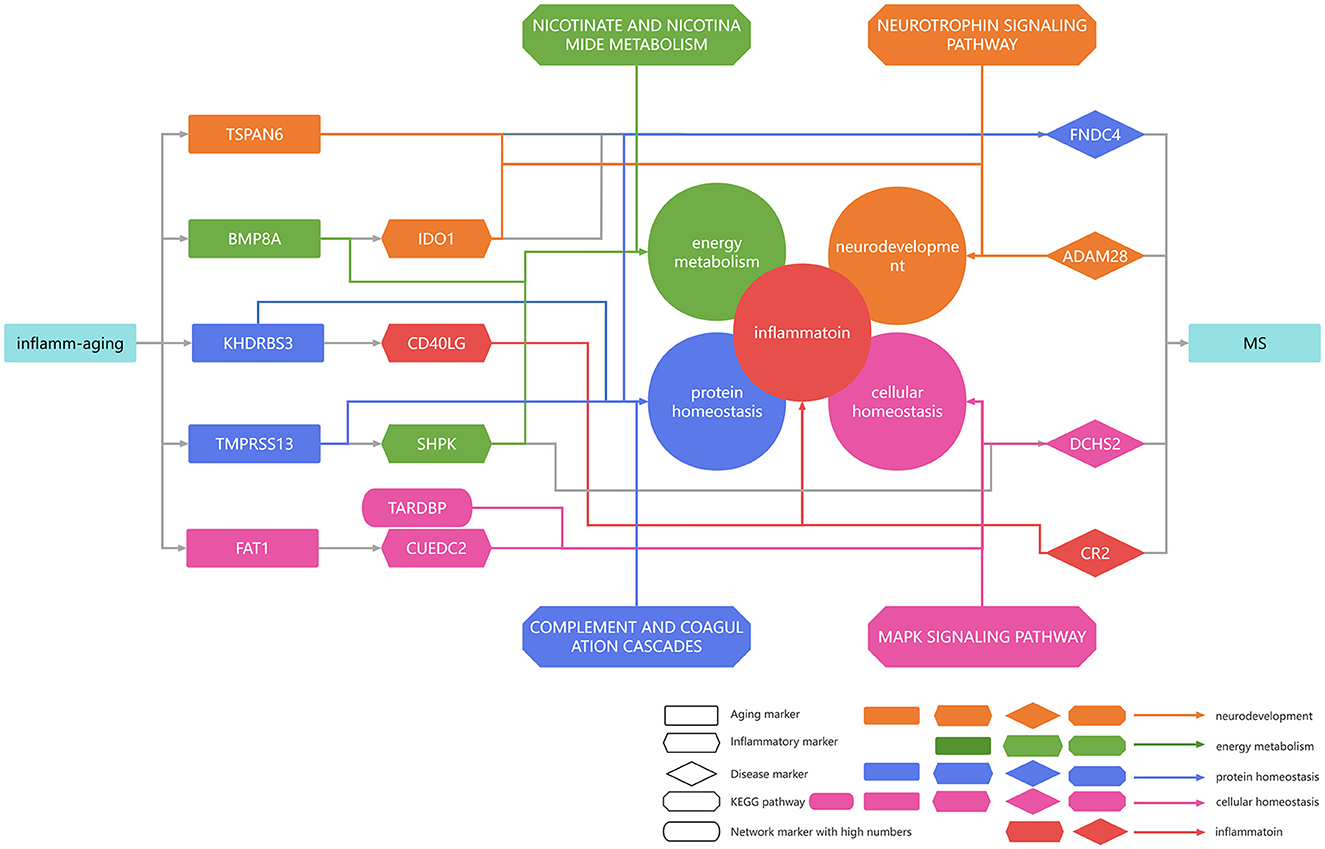
Figure 7. Summarized mechanisms in multiple sclerosis in the context of inflammaging. Rectangular genes represent aging markers, diamond genes represent disease markers, rhombic genes represent disease markers, and oval genes represent high median network markers. Orange arrows indicate that the gene was associated with neurodevelopment, green arrows indicate that the gene was associated with energy metabolism, blue arrows indicate that the gene was associated with protein homeostasis, pink arrows indicate that the gene was associated with cellular homeostasis, and red arrows indicate that the gene was associated with inflammation.
Despite the exploration of the underlying mechanisms in MS based on the inflammaging, there were still shortcomings as follows: (1) This paper only used 445 samples of microarray profiles, where the single-cell profiles should investigated in further analysis; (2) The biological experiments were still vital to performed to further validate relative conclusions in human cell line, if with proper permissions; (3) The potential mechanisms of MS were identified only based on inflammaging, without considering other key risk factors (e.g., oxidative stress or neuroendocrine). After all, a series of investigations were still needed to further explore underlying mechanisms in MS (or other neuroinflammatory diseases), where our work presented a novel thought to study relative molecular mechanisms.
4 Conclusion
In this study, machine learning was used to construct models for predicting aging and disease (MS) and to identify relative biomarkers. The important relationship between inflammaging and MS was further explored by building the integrated inflammaging model. Relative inflammaging characteristics in MS patients were investigated holistically through sensitivity, enrichment, network and pan-cancer analyses. In summary, our study integrated protein homeostasis, cellular homeostasis, neurodevelopment and energy metabolism as risk factors in MS based on inflammaging indices, also presenting a novel thought to other aging-related diseases.
5 Materials and methods
5.1 Data and preprocessing
The gene expression data were downloaded from the Gene Expression Omnibus (GEO) database (https://www.ncbi.nlm.nih.gov/geo/), including GSE190847, GSE131281, GSE126802, GSE108000, GSE78244, GSE37750, GSE62584, GSE41890, and GSE14895. These datasets were from eight different microarray platforms: GPL23126, GPL10558, GPL13497, GPL17077, GPL570, GPL571, GPL6244, and GPL96.
The gene expression profiles were processed as follows:
(1) Only the samples with both the age and phenotype indices (MS or control) were retained; otherwise, they were excluded.
(2) The gene expression matrix for each dataset was integrated by summarizing the probe number within the gene symbol.
(3) The total data matrix was integrated, and the missing gene expression values were filled with values of 0.
(4) Data processing was performed on the summary matrix to remove genes with ≥30% missing values.
(5) The gene expression matrix was logarithmically transformed if it contained outliers.
(6) Based on the mean and standard deviation of gene expression for the control individuals, z-score normalization was performed for both the MS and control samples.
(7) The singular value decomposition (SVD) method was performed to eliminate the inter sample variation based on the top three principal components of the control samples.
(8) The z-score was then utilized to normalize all samples based on the mean and the standard deviation of the control samples.
(9) The gene expression profiles were further transformed using the hyperbolic tangent (Tanh) method, so that it takes values between −1 and 1.
(10) The training set and the test set were randomly divided at a ratio of approximately 2:1.
As a result, a total of 445 samples were obtained (Supplementary Table S1), including 66 samples of healthy aged people (aged ≥ 50 years, 45 training datasets +21 test datasets), 118 samples of healthy young people (aged <50, 80 + 38), 94 samples of MS aged people (aged ≥ 50, 65 + 29) and 167 samples of MS young people (aged <50, 115 + 52), containing 16,275 gene symbols (Supplementary Table S2). Further, comparison results based on the inter-sample normalization step (i.e., z-score, SVD, and another z-score) have been show in Supplementary Figure S2, including boxplots and scatter plots. These results indicated that the normalization could treat relative profiles from different platforms with enough efficiencies, indicating that the profiles were clustered with each dataset before the normalization, comparable after the normalization, and even distinguishable between different phenotypes (i.e., MS or control) if combining with machine learning methods.
We also obtained paired gene expression (RNAseq) profiles (“Batch effects normalized mRNA data”) and clinical data from the TCGA database through the xena platform (https://xenabrowser.net/hub/). Cancer types with ≥10 adjacent normal samples were retained. There were 16 cancer types included in this study: BLCA (408 cancer samples and 19 adjacent normal samples), BRCA (1,102 + 113), COAD (451 + 41), ESCA (185 + 11), HNSC (522 + 44), KICH (66 + 25), KIRC (534 + 72), KIRP (291 + 32), LIHC (373 + 50), LUAD (517 + 59), LUSC (504 + 51), PRAD (498 + 52), READ (160 + 10), STAD (414 + 35), THCA (513 + 59), and UCEC (533 + 22). Genes with ≥30% missing values were deleted.
5.2 Modeling the aging model and disease model
The ReliefF algorithm was used to select key features, and then the first 100 models were studied to train the predictors. The optimal model was selected by 10-fold cross-validation. To verify the accuracy of the aging predictor, the selected model was verified in the test dataset.
(1) In the aging model, the normal aged group (age ≥ 50) was labeled 1, and the young healthy group (age <50) was labeled 0; in the disease model, the MS group was labeled 1, and the control group was labeled 0.
(2) The ReliefF algorithm was used to sort 16,275 genes for the aging and disease models;
(3) The predictor of the model was used to select the key markers with the help of the k-nearest neighbors (kNN, k = 9, correlation) algorithm. The model with the highest accuracy was also selected with the help of 10-fold cross-validation, where the identified features were considered aging markers and disease markers.
As a result, the optimal k-nearest neighbor (kNN, k = 9, correlation) algorithm was used, and a total of 70 aging markers and 19 disease markers were identified. In addition, these markers could be summarized as the aging score and disease score for further analyses (i.e., comparison in Section 5.1 or sensitive analysis in Section 5.4).
As a result, the ROC curve could be designed based on the aging and disease score, respectively.
5.3 Identifying essential relationships in MS by integrating inflammaging models
An integrated inflammaging model was built to identify the essential relationships among aging, inflammation and MS. The computational pipeline used was MR, although it was not as rigorous as MR (Burgess et al., 2020, 2023).
In this model, the aging-related inflammatory markers were considered inflammaging markers, where candidate aging/disease markers were identified in Section 5.2 to be further select relate to these inflammaging markers. Ultimately, the essential relationships among aging, inflammation, and disease (MS) markers were identified as key “aging-inflammation-disease” triples in MS.
Here, the aging markers were used as the auxiliary variables (similar to the instrumental variables in MR), and the inflammatory markers were used as the candidate risk factors. Then, inflammatory (“inflammaging”) markers were identified as the risk factors, and disease markers were used as the outcome variables. That is, the integrated inflammaging model aimed to explore the essential relationships among aging, inflammation and disease markers in MS. The objectives of the “aging-inflammation-disease” triples were as follows:
(1) There was a correlation between the aging marker and the inflammatory marker.
(2) There was a correlation between the inflammatory marker and the disease (MS) marker.
(3) There was a correlation between the aging marker and the disease (MS) marker.
(4) There was a strong correlation between the aging marker and the disease marker, if through the inflammatory marker.
The methodological steps of the model were as follows:
(1) The inflammatory markers used as candidate risk factors were obtained through the Gene Set Enrichment Analysis (GSEA) platform based on the biological process (BP) of gene ontology (GO) (http://www.gsea-msigdb.org/gsea/downloads.jsp, version 2023.1, with “INFLAMMATORY” as keywords). As a result, 745 candidate inflammatory markers were selected.
(2) The correlation (differential co-expression) pattern was used to select aging markers that strongly correlated with candidate inflammatory markers with the help of the Kruskal–Wallis test. Here, the differential co-expression was calculated as follows:
where the phenotype could be defined as 1 (MS) or 0 (control).
Furthermore, both a p-value < 0.05 and a Benjamini–Hochberg false discovery rate (FDR) < 0.1 were used to select strongly correlated aging markers.
(3) The correlation (differential co-expression) was used to select inflammatory markers that strongly correlated with disease markers with the help of the Kruskal–Wallis test. Here, the differential co-expression was calculated as follows:
where the phenotype could be defined as 1 (MS) or 0 (control).
Furthermore, both a p-value < 0.05 and a Benjamini–Hochberg false discovery rate (FDR) < 0.1 were used to select strongly correlated inflammatory markers.
(4) The correlation (differential co-expression) was used to select disease markers that strongly correlated with aging markers with the help of the Kruskal–Wallis test. Here, the differential co-expression was calculated as follows:
where the phenotype could be defined as 1 (MS) or 0 (control).
Furthermore, both a p-value < 0.05 and a Benjamini–Hochberg false discovery rate (FDR) < 0.1 were used to select strongly correlated disease markers.
(5) To filter out the effect of horizontal pleiotropy, the aging–disease relationship was further examined by comparing the correlation between each aging marker and disease marker through the inflammatory marker or otherwise. Here, steps ①-③ were used to calculate the correlations between auxiliary variables and outcome variables without the background of the risk factor, and step ④ was used to calculate the correlations between auxiliary variables and outcome variables with the context of the risk factor.
① The residual of each disease marker (“residual A”) was calculated based on the inflammatory marker:
where b1 was the regression coefficient.
② The residual of each aging marker (“residual B”) was calculated based on the inflammatory marker:
where b2 was the regression coefficient.
③ The abovementioned two residuals were further compared, and the residual of the disease marker was calculated (as “residual C”):
where b3 was the regression coefficient.
④ The residual disease marker (“residual D”) was calculated based on the aging marker.
⑤ The difference (between “residual C” and “residual D”) between the MS and control subgroups was tested using the Kruskal–Wallis test (P < 0.05 and FDR < 0.1).
Finally, the essential relationships among aging markers, inflammatory markers and disease markers were determined. Thus, 5,599 “aging-inflammation-disease” triplets were identified, including 65 aging markers, 107 inflammatory markers (as the 107 inflammaging markers) and 19 disease markers. Thus, these 107 inflammatory markers were used as inflammaging markers (risk factors), and 19 disease markers were also used to discriminate the MS phenotype.
In addition, the whole differential co-expression pattern among aging, inflammation and disease markers could be calculated based on these triples.
where i and j was the i-th inflammation marker and the j-th aging marker, corr was the Pearson's correlation coefficient, and the phenotype could be defined as 1 (MS) or 0 (control). The differential co-expression of a inflammation marker was summarized based the related aging markers in the triples.
where k and i was the k-th disease marker and the i-th inflammation marker, corr was the Pearson's correlation coefficient, and the phenotype could be defined as 1 (MS) or 0 (control). The differential co-expression of a disease marker was summarized based the related inflammation markers in the triples.
5.4 Sensitivity analysis using the MCMC method
To further explore crucial relationships among aging, inflammation and MS, sensitivity analysis was performed based on the Markov Chain Monte Carlo (MCMC) method, where “aging-inflammation-disease” triples were further evaluated as a candidate relationship. The MCMC method was used to sample certain posterior distributions in a high-dimensional space based on a given probabilistic background. The key step of MCMC was to construct a Markov chain whose equilibrium distribution was equal to the target probability distribution. The steps were as follows:
(1) Constructing the transfer cores of the ergodic Markov chain. The prior distribution of each parameter was normally distributed based on all identified markers in each group (i.e., MS or control), respectively.
(2) Simulate the chains until equilibrium was reached. The Metropolis–Hastings sampling method was used to determine whether the new sample (θ *) was acceptable based on the α value.
where P (θn | X) and P (θ*| X) were the posterior probability of the nth accepted sample, the new sample q (θn → θ*) was the transition probability from the nth accepted sample to the new sample, and q (θ* → θn) was the transition probability from the new sample to the n-th accepted sample.
In this work, the disease score was used to evaluate the simulated samples, with 1,000 random samples used as candidate samples for each group (i.e., MS or control). The disease score was calculated by comparing the distance between normal and MS training samples based on the 19 disease markers identified by the integrated inflammaging model, by using the Equation (2).
(3) Performing the global sensitivity analysis
The correlation index was used to evaluate each of the “aging-inflammation-disease” triples in the accepted samples (both MS and control):
Therefore, the correlation indices were calculated for each “aging-inflammation-disease” triple for all accepted samples. Then, the Kruskal–Wallis test was used to evaluate each correlation index in each “aging-inflammation-disease” triple, where p-value < 0.05 and FDR < 0.1 were set as the threshold. Finally, a total of 35 “aging-inflammation-disease” triples were identified as sensitive relationships, including 16 aging markers, 28 inflammatory markers, and 9 disease markers.
5.5 Constructing the differential co-expression network
To further reveal potential mechanisms between “inflammaging” and MS, a differential co-expression network was constructed via the following steps:
(1) The Pearson correlation coefficient for each pair of genes was calculated based on the MS and control groups.
(2) The Benjamini–Hochberg FDR method was used to adjust the p-values of the correlation coefficients.
(3) The relationship between each gene pair was retained if the coefficient value in MS had the opposite sign (i.e., + or –) to that in the control, as well as if p < 0.05 and FDR < 0.1.
(4) The shortest path between each pair of inflammaging and disease markers was selected based on the differential co-expression network using the Dijkstra algorithm.
5.6 Enrichment analysis
The gene functions were further explored by enrichment analysis of the shortest pathway. Gene Ontology (GO) terms and KEGG pathways for the GSEA platform were obtained from gene set enrichment analysis (http://software.broadinstitute.org/gsea/downloads.jsp, version 2023.1). The hypergeometric distribution was used to test the degree of enrichment of the GO BP and KEGG pathways. Hypergeometric test formula:
where N was the total number of genes in the gene set, M was the number of known genes (such as the KEGG pathway or BP terms), which was the number of genes identified in each shortest pathway, and k was the number of common genes between known genes and candidate genes identified in each “inflammation-disease” shortest pathway. The p-value of each path was controlled using the Benjamin–Hochberg method. Finally, pathways with p < 0.05 and FDR < 0.1 were retained.
5.7 Identifying network markers
The subnetwork with the shortest pathways among the selected “inflammation-disease” pairs was constructed, and genes in the subnetwork were sorted by their betweennesses in descending order. To test whether the top betweenness genes were hubs in the background network, we ran a permutation to count the occurrence time of the top genes in the shortest paths between randomly selected genes (containing the same numbers of “inflammation-disease” triples, based on the identified “aging-inflammation-disease” triples) when they had greater betweennesses than those in our study. We repeated this process 1,000 times, and the p-value was calculated as the proportion of occurrence times of the top betweenness genes in 1,000 permutations.
5.8 Pan-cancer analysis
The survival analysis was performed based on the inflammaging markers (identified by the integrated inflammaging model in Section 5.3) for each cancer using the Kaplan–Meier method. The first principal component of the triples set of key markers for each cancer was taken, and then they were categorized into two groups based on the mean values. Then, the Kaplan–Meier method was used to evaluate the survival difference between these two groups, and the significance was estimated by the log-rank test. A p-value < 0.05 was considered statistically significant.
Genes were considered differentially expressed if they satisfied the following criteria:
(1) Fold change > 2;
(2) p-value < 0.05 according to the Kruskal–Wallis test;
(3) Benjamin-Hochberg false discovery rate (FDR) < 0.1.
Then, the differential expression networks were constructed for each cancer, where the details were also the same as Section 5.5. As a result, each shortest pathway was selected from each pair of inflammaging markers and differentially expressed genes (as disease markers in cancer) using the Dijkstra algorithm. Furthermore, the enrichment analysis was performed in each cancer (p < 0.05 and FDR < 0.1).
Data availability statement
The original contributions presented in the study are included in the article/Supplementary material, further inquiries can be directed to the corresponding authors.
Author contributions
MX: Conceptualization, Data curation, Formal analysis, Investigation, Methodology, Software, Validation, Visualization, Writing – original draft. HW: Conceptualization, Investigation, Software, Visualization, Writing – original draft. SR: Data curation, Formal analysis, Methodology, Validation, Writing – original draft. BW: Investigation, Validation, Visualization, Writing – review & editing. WY: Investigation, Validation, Visualization, Writing – review & editing. LL: Investigation, Validation, Visualization, Writing – original draft. XS: Conceptualization, Funding acquisition, Investigation, Project administration, Supervision, Writing – review & editing. WL: Conceptualization, Funding acquisition, Investigation, Project administration, Supervision, Writing – review & editing. YW: Conceptualization, Funding acquisition, Investigation, Methodology, Supervision, Validation, Writing – review & editing.
Funding
The author(s) declare financial support was received for the research, authorship, and/or publication of this article. This work was supported by the National Key R&D Program of China: BTIT (Grant No. 2022YFF1202803 to XS), the Natural Science Foundation of Liaoning Province of China (2023JH2/20200080 to YW), the Shanghai Municipal Health Commission and Collaborative Innovation Cluster Project (No. 2019CXJQ02), the National Key R&D Program of China (No. 2018YFA0107800), the National Natural Science Foundation of China (Nos. 81974010 and 31870829), and the Provincial Natural Science Foundation of Hunan Province (No. 2021JJ40963). The funders had no role in the study design, data collection and analysis, decision to publish, or preparation of the manuscript.
Conflict of interest
The authors declare that the research was conducted in the absence of any commercial or financial relationships that could be construed as a potential conflict of interest.
Publisher's note
All claims expressed in this article are solely those of the authors and do not necessarily represent those of their affiliated organizations, or those of the publisher, the editors and the reviewers. Any product that may be evaluated in this article, or claim that may be made by its manufacturer, is not guaranteed or endorsed by the publisher.
Supplementary material
The Supplementary Material for this article can be found online at: https://www.frontiersin.org/articles/10.3389/fnmol.2024.1398665/full#supplementary-material
Supplementary Figure S1. Enrichment analysis of the shortest paths of KEGG and BP, before combining overlap shortest paths. (A) KEGG with the most shortest enriched paths; (B) BP with the most shortest enriched paths; (C) KEGG with the minimum FDR; (D) BP with the minimum FDR. The orange nodes represent the inflammaging markers, the blue nodes represent the genes connecting inflammaging markers and disease markers, the green nodes represent the disease markers, and the genes in the red square frames coincide with those genes in the enriched functions.
Supplementary Figure S2. Comparison results based on the inter-sample normalization step. (A, B) The boxplot of the control samples in each dataset, based on the first principal component; (C, D) the scatter plot in each dataset, based on the first two principal component; (E, F) the scatter plot in each dataset, based on the aging score and diease score; (A, C, E) before the normalization; (B, D, F) after the normalization.
Supplementary Table S1. Detailed datasets used in this work.
Supplementary Table S2. Gene symbols used in this work.
Supplementary Table S3. ReliefF ranking of aging markers.
Supplementary Table S4. ReliefF ranking of disease markers.
Supplementary Table S5. Top 10 most enriched KEGG pathways containing inflammatory markers.
Supplementary Table S6. The top 10 KEGG pathways with minimum FDR containing inflammatory markers.
Supplementary Table S7. Top 10 most enriched BP terms containing inflammatory markers.
Supplementary Table S8. The top ten BP terms with minimum FDR containing inflammatory markers.
Supplementary Table S9. KEGG pathways in each cancer with minimum FDR.
Supplementary Table S10. BP terms in each cancer with minimum FDR.
References
Allen, S. J., Crown, S. E., and Handel, T. M. (2007). Chemokine: receptor structure, interactions, and antagonism. Annu. Rev. Immunol. 25, 787–820. doi: 10.1146/annurev.immunol.24.021605.090529
Amoriello, R., Mariottini, A., and Ballerini, C. (2021). Immunosenescence and autoimmunity: exploiting the t-cell receptor repertoire to investigate the impact of aging on multiple sclerosis. Front. Immunol. 12, 799380. doi: 10.3389/fimmu.2021.799380
An, F., Du, J., Cao, Y., Shi, J., Guo, Y., Jin, T., et al. (2017). MMP8 polymorphism is associated with susceptibility to osteonecrosis of the femoral head in a Chinese Han population. Oncotarget. 8, 21561–6. doi: 10.18632/oncotarget.15371
Antonangeli, F., Grimsholm, O., Rossi, M. N., and Velotti, F. (2021). Editorial: Cellular stress and inflammation: how the immune system drives tissue homeostasis. Front. Immunol. 12:668876. doi: 10.3389/978-2-88966-753-6
Arentsen, T., Qian, Y., Gkotzis, S., Femenia, T., Wang, T., Udekwu, K., et al. (2017). The bacterial peptidoglycan-sensing molecule Pglyrp2 modulates brain development and behavior. Mol. Psychiatry. 22, 257–66. doi: 10.1038/mp.2016.182
Arneson, P. C., and Doles, J. D. (2019). Impaired muscle regeneration in cancer-associated cachexia. Trends in cancer. 5, 579–82. doi: 10.1016/j.trecan.2019.07.010
Aslam, N., Khan, I. U., Bashamakh, A., Alghool, F. A., Aboulnour, M., Alsuwayan, N. M., et al. (2022). Multiple sclerosis diagnosis using machine learning and deep learning: challenges and opportunities. Sensors. 22:7856. doi: 10.3390/s22207856
Atiyah, N. S., Fadhil, H. Y., and Ad'hiah, A. H. (2023). Toll-like receptor 10 is down-regulated in serum of patients with relapsing-remitting multiple sclerosis but not associated with Epstein-Barr virus. J. Neurovirol. 29, 203–210. doi: 10.1007/s13365-023-01124-4
Bahadoram, S., Davoodi, M., Hassanzadeh, S., Bahadoram, M., Barahman, M., Mafakher, L., et al. (2022). Renal cell carcinoma: an overview of the epidemiology, diagnosis, and treatment. Giorn Italiano Nefrol. 39:2022.
Balkan, E., and Bilge, N. (2021). Expression levels of IL-17/IL-23 cytokine-targeting microRNAs 20, 21, 26, 155, and Let-7 in patients with relapsing-remitting multiple sclerosis. Neurol. Res. 43, 778–83. doi: 10.1080/01616412.2021.1935099
Baradaran-Heravi, Y., Van Broeckhoven, C., and van der Zee, J. (2020). Stress granule mediated protein aggregation and underlying gene defects in the FTD-ALS spectrum. Neurobiol. Dis. 134, 104639. doi: 10.1016/j.nbd.2019.104639
Becic, A., Leifeld, J., Shaukat, J., and Hollmann, M. (2022). Tetraspanins as potential modulators of glutamatergic synaptic function. Front. Mol. Neurosci. 14:801882. doi: 10.3389/fnmol.2021.801882
Bergbold, N., and Lemberg, M. K. (2013). Emerging role of rhomboid family proteins in mammalian biology and disease. Biochim. Biophys. Acta. 1828, 2840–8. doi: 10.1016/j.bbamem.2013.03.025
Bjornevik, K., Cortese, M., Healy, B. C., Kuhle, J., Mina, M. J., Leng, Y., et al. (2022). Longitudinal analysis reveals high prevalence of Epstein-Barr virus associated with multiple sclerosis. Science 375, 296–301. doi: 10.1126/science.abj8222
Bjornevik, K., Münz, C., Cohen, J. I., and Ascherio, A. (2023). Epstein-Barr virus as a leading cause of multiple sclerosis: mechanisms and implications. Nat. Rev. Neurol. 19, 160–71. doi: 10.1038/s41582-023-00775-5
Black, C. A., Bucher, M. L., Bradner, J. M., Jonas, L., Igarza, K., Miller, G. W., et al. (2021). Assessing vesicular monoamine transport and toxicity using fluorescent false neurotransmitters. Chem. Res. Toxicol. 34, 1256–64. doi: 10.1021/acs.chemrestox.0c00380
Bogacka, J., Pawlik, K., Ciapała, K., Ciechanowska, A., and Mika, J. C. C. (2022). Chemokine Receptor 4 (CCR4) as a possible new target for therapy. Int. J. Mol. Sci. 23:15638. doi: 10.3390/ijms232415638
Bohmwald, K., Andrade, C. A., Mora, V. P., Muñoz, J. T., Ramírez, R., Rojas, M. F., et al. (2022). Neurotrophin signaling impairment by viral infections in the central nervous system. Int. J. Mol. Sci. 23:5817. doi: 10.3390/ijms23105817
Bosco-Lévy, P., Foch, C., Grelaud, A. Sabidó, M., Lacueille, C., Jové, J., et al. (2022). Incidence and risk of cancer among multiple sclerosis patients: a matched population-based cohort study. Eur. J. Neurol. 29, 1091–1099. doi: 10.1111/ene.15226
Boutet, A., Madhavan, R., Elias, G. J. B., Joel, S. E., Gramer, R., Ranjan, M., et al. (2021). Predicting optimal deep brain stimulation parameters for Parkinson's disease using functional MRI and machine learning. Nat. Commun. 12:3043. doi: 10.1038/s41467-021-23311-9
Buhelt, S., Laigaard, H. M., von Essen, M. R., Ullum, H., Oturai, A., Sellebjerg, F., et al. (2021). IL2RA methylation and gene expression in relation to the multiple sclerosis-associated gene variant rs2104286 and soluble IL-2Rα in CD8+ T cells. Front. Immunol. 12:676141. doi: 10.3389/fimmu.2021.676141
Bulati, M., Buffa, S., Martorana, A., Candore, G., Lio, D., Caruso, C., et al. (2014). Trafficking phenotype and production of granzyme B by double negative B cells (IgG (+)IgD (-)CD27 (-)) in the elderly. Exp. Gerontol. 54, 123–129. doi: 10.1016/j.exger.2013.12.011
Burgess, S., Davey Smith, G., Davies, N. M., Dudbridge, F., Gill, D., Glymour, M. M., et al. (2023). Guidelines for performing Mendelian randomization investigations: update for summer 2023. Wellcome Open Res. 4:186. doi: 10.12688/wellcomeopenres.15555.3
Burgess, S., Foley, C. N., Allara, E., Staley, J. R., and Howson, J. M. M. (2020). A robust and efficient method for Mendelian randomization with hundreds of genetic variants. Nat. Commun. 11:376. doi: 10.1038/s41467-019-14156-4
Cantuti-Castelvetri, L., Gokce, O., and Simons, M. (2022). Reparative inflammation in multiple sclerosis. Seminars Immunol. 59:101630. doi: 10.1016/j.smim.2022.101630
Chang, C. H., Lin, C. H., and Lane, H. Y. (2021). Machine learning and novel biomarkers for the diagnosis of Alzheimer's disease. Int. J. Molec. Sci. 22:2761. doi: 10.3390/ijms22052761
Charbit, H., Benis, A., Geyshis, B., Karussis, D., Petrou, P., Vaknin-Dembinsky, A., et al. (2015). Sex-specific prediction of interferon beta therapy response in relapsing-remitting multiple sclerosis. J. Clin. Neurosci. 22, 986–989. doi: 10.1016/j.jocn.2014.11.027
Chen, H. L., and D'Mello, S. R. (2010). Induction of neuronal cell death by paraneoplastic Ma1 antigen. J. Neurosci. Res. 88, 3508–3519. doi: 10.1002/jnr.22506
Chen, S. T., Oliveira, T. Y., Gazumyan, A., Cipolla, M., and Nussenzweig, M. C. (2023). B cell receptor signaling in germinal centers prolongs survival and primes B cells for selection. Immunity 56, 547–561.e7. doi: 10.1016/j.immuni.2023.02.003
Cibrian, D., Baixauli, F., and Palacin, M. (2022). Editorial: Amino acid transport and metabolism during homeostasis and inflammation. Front. Immunol. 12, 833258. doi: 10.3389/fimmu.2021.833258
Conway, E. M. (2018). Complement-coagulation connections. Blood Coagul. Fibrinol. 29, 243–51. doi: 10.1097/MBC.0000000000000720
Correale, J. (2021). Immunosuppressive amino-acid catabolizing enzymes in multiple sclerosis. Front. Immunol. 11:600428. doi: 10.3389/fimmu.2020.600428
Correale, J., and Farez, M. F. (2015). The role of astrocytes in multiple sclerosis progression. Front. Neurol. 6:180. doi: 10.3389/fneur.2015.00180
Creanza, T. M., Liguori, M., Liuni, S., Nuzziello, N., and Ancona, N. (2016). Meta-analysis of differential connectivity in gene co-expression networks in multiple sclerosis. Int. J. Mol. Sci. 17:936. doi: 10.3390/ijms17060936
Cui, L. Y., Chu, S. F., and Chen, N. H. (2020). The role of chemokines and chemokine receptors in multiple sclerosis. Int. Immunopharmacol. 83:106314. doi: 10.1016/j.intimp.2020.106314
Davidson, S. M., Jonas, O., Keibler, M. A., Hou, H. W., Luengo, A., Mayers, J. R., et al. (2017). Direct evidence for cancer-cell-autonomous extracellular protein catabolism in pancreatic tumors. Nat. Med. 23, 235–241. doi: 10.1038/nm.4256
Denissen, S., Chén, O. Y., De Mey, J., De Vos, M., Van Schependom, J., Sima, D. M., et al. (2021). Towards multimodal machine learning prediction of individual cognitive evolution in multiple sclerosis. J. Pers. Med. 11:1349. doi: 10.3390/jpm11121349
Deverman, B. E., and Patterson, P. H. (2009). Cytokines and CNS development. Neuron. 64, 61–78. doi: 10.1016/j.neuron.2009.09.002
Díaz, C., Zarco, L. A., and Rivera, D. M. (2019). Highly active multiple sclerosis: an update. Mult. Scler. Relat. Disord. 30, 215–224. doi: 10.1016/j.msard.2019.01.039
Diaz-Castro, B., Bernstein, A. M., Coppola, G., Sofroniew, M. V., and Khakh, B. S. (2021). Molecular and functional properties of cortical astrocytes during peripherally induced neuroinflammation. Cell Rep. 36:109508. doi: 10.1016/j.celrep.2021.109508
Fadul, C. E., Mao-Draayer, Y., Ryan, K. A., Noelle, R. J., Wishart, H. A., Channon, J. Y., et al. (2021). Safety and immune effects of blocking CD40 ligand in multiple sclerosis. Neurol. Neuroimmunol. Neuroinflam. 8:e1096. doi: 10.1212/NXI.0000000000001096
Fang, C., Xu, H., Guo, S., Mertens-Talcott, S. U., and Sun, Y. (2018). Ghrelin signaling in immunometabolism and inflammaging. Adv. Exp. Med. Biol. 1090, 165–182. doi: 10.1007/978-981-13-1286-1_9
Feng, L. R., Barb, J. J., Regan, J., and Saligan, L. N. (2021). Plasma metabolomic profile associated with fatigue in cancer patients. Cancer Med. 10, 1623–33. doi: 10.1002/cam4.3749
Franceschi, S., Lessi, F., Morelli, M., Menicagli, M., Pasqualetti, F., Aretini, P., et al. (2022). Sedoheptulose Kinase SHPK expression in glioblastoma: emerging role of the nonoxidative pentose phosphate pathway in tumor proliferation. Int. J. Mol. Sci. 23:5978. doi: 10.3390/ijms23115978
Franken, G. A. C., Adella, A., Bindels, R. J. M., and de Baaij, J. H. F. (2021). Mechanisms coupling sodium and magnesium reabsorption in the distal convoluted tubule of the kidney. Acta Physiol. 231:e13528. doi: 10.1111/apha.13528
Fricker, R. A., Green, E. L., Jenkins, S. I., and Griffin, S. M. (2018). The influence of nicotinamide on health and disease in the central nervous system. Int. J. Tryptophan Res. 11:1178646918776658. doi: 10.1177/1178646918776658
Fujita, M., Otsuka, T., Mizuno, M., Tomi, C., Yamamura, T., Miyake, S., et al. (2009). Carcinoembryonic antigen-related cell adhesion molecule 1 modulates experimental autoimmune encephalomyelitis via an iNKT cell-dependent mechanism. Am. J. Pathol. 175, 1116–1123. doi: 10.2353/ajpath.2009.090265
Fusco, F., Pescatore, A., Conte, M. I., Mirabelli, P., Paciolla, M., Esposito, E., et al. (2015). EDA-ID and IP, two faces of the same coin: how the same IKBKG/NEMO mutation affecting the NF-κB pathway can cause immunodeficiency and/or inflammation. Int. Rev. Immunol. 34, 445–459. doi: 10.3109/08830185.2015.1055331
Gao, X., Xu, C., Asada, N., and Frenette, P. S. (2018). The hematopoietic stem cell niche: from embryo to adult. Development 145:dev139691. doi: 10.1242/dev.139691
Gasperi, V., Sibilano, M., Savini, I., and Catani, M. V. (2019). Niacin in the central nervous system: an update of biological aspects and clinical applications. Int. J. Mol. Sci. 20:974. doi: 10.3390/ijms20040974
GBD 2016 Neurology Collaborators (2019). Global, regional, and national burden of neurological disorders, 1990-2016: a systematic analysis for the Global Burden of Disease Study 2016. Lancet Neurol. 18, 459–480.
Glorieux, C., and Buc Calderon, P. (2021). Vitamin C (Ascorbate) and redox topics in cancer. Antioxid. Redox Signal. 35, 1157–1175. doi: 10.1089/ars.2020.8233
Graves, J. S., Henry, R. G., Cree, B. A. C., Lambert-Messerlian, G., Greenblatt, R. M., Waubant, E., et al. (2018). Ovarian aging is associated with gray matter volume and disability in women with MS. Neurology. 90, e254–60. doi: 10.1212/WNL.0000000000004843
Graves, J. S., Krysko, K. M., Hua, L. H., Absinta, M., Franklin, R. J. M., Segal, B. M., et al. (2023). Ageing and multiple sclerosis. Lancet Neurol. 22, 66–77. doi: 10.1016/S1474-4422(22)00184-3
Gu, S. C., Yuan, C. X., and Gu, C. (2022). Identification of ferroptosis-related gene signatures associated with multiple sclerosis using weighted gene co-expression network analysis. Medicine 101:e31802. doi: 10.1097/MD.0000000000031802
Guerra-Espinosa, C., Jiménez-Fernández, M., Sánchez-Madrid, F., and Serrador, J. M. (2024). ICAMs in immunity, intercellular adhesion and communication. Cells 13:339. doi: 10.3390/cells13040339
Guix, F. X., Sannerud, R., Berditchevski, F., Arranz, A. M., Horré, K., Snellinx, A., et al. (2017). Tetraspanin 6: a pivotal protein of the multiple vesicular body determining exosome release and lysosomal degradation of amyloid precursor protein fragments. Molec. Neurodegener. 12:25. doi: 10.1186/s13024-017-0165-0
Haider, L., Fischer, M. T., Frischer, J. M., Bauer, J., Höftberger, R., Botond, G., et al. (2011). Oxidative damage in multiple sclerosis lesions. Brain 134, 1914–1924. doi: 10.1093/brain/awr128
Hanahan, D., and Monje, M. (2023). Cancer hallmarks intersect with neuroscience in the tumor microenvironment. Cancer Cell. 41, 573–80. doi: 10.1016/j.ccell.2023.02.012
Higashi, S., Kabuta, T., Nagai, Y., Tsuchiya, Y., Akiyama, H., Wada, K., et al. (2013). TDP-43 associates with stalled ribosomes and contributes to cell survival during cellular stress. J. Neurochem. 126, 288–300. doi: 10.1111/jnc.12194
Hjæresen, S., Sejbaek, T., Axelsson, M., Mortensen, S. K., Vinsløv-Jensen, H., Pihl-Jensen, G., et al. (2022). MIF in the cerebrospinal fluid is decreased during relapsing-remitting while increased in secondary progressive multiple sclerosis. J. Neurol. Sci. 439, 120320. doi: 10.1016/j.jns.2022.120320
Holman, D. W., Klein, R. S., and Ransohoff, R. M. (2011). The blood-brain barrier, chemokines and multiple sclerosis. Biochim. Biophys. Acta. 1812, 220–30. doi: 10.1016/j.bbadis.2010.07.019
Hou, X., Hu, J., Zhao, X., Wei, Q., Zhao, R., Li, M., et al. (2021). Taurine attenuates the hypotaurine-induced progression of CRC via ERK/RSK signaling. Front. Cell Dev. Biol. 9:631163. doi: 10.3389/fcell.2021.631163
Howe, C. L., Adelson, J. D., and Rodriguez, M. (2007). Absence of perforin expression confers axonal protection despite demyelination. Neurobiol. Dis. 25, 354–359. doi: 10.1016/j.nbd.2006.10.001
Huang, J., Meng, P., Wang, C., Zhang, Y., and Zhou, L. (2022). The relevance of organelle interactions in cellular senescence. Theranostics 12, 2445–2464. doi: 10.7150/thno.70588
Huang, L., Sun, F., Liu, Z., Jin, W., Zhang, Y., Chen, J., et al. (2023). Probing the potential of defense response-associated genes for predicting the progression, prognosis, and immune microenvironment of osteosarcoma. Cancers. 15:2405. doi: 10.3390/cancers15082405
Huhn, K., Engelhorn, T., Linker, R. A., and Nagel, A. M. (2019). Potential of sodium MRI as a biomarker for neurodegeneration and neuroinflammation in multiple sclerosis. Front. Neurol. 10:84. doi: 10.3389/fneur.2019.00084
Immler, R., Lange-Sperandio, B., Steffen, T., Beck, H., Rohwedder, I., Roth, J., et al. (2020). Extratubular polymerized uromodulin induces leukocyte recruitment and inflammation in vivo. Front. Immunol. 11:588245. doi: 10.3389/fimmu.2020.588245
Janssens, K., Slaets, H., and Hellings, N. (2015). Immunomodulatory properties of the IL-6 cytokine family in multiple sclerosis. Ann. N Y. Acad. Sci. 1351, 52–60. doi: 10.1111/nyas.12821
Jasperse, B., and Barkhof, F. (2023). “Machine learning in multiple sclerosis,” in Machine Learning for Brain Disorders, ed. O. Colliot (Totowa, NJ: Humana), 899–919. doi: 10.1007/978-1-0716-3195-9_28
Jatczak-Pawlik, I., Wolinski, P., KsiAŻek-Winiarek, D., Pietruczuk, M., and Glabinski, A. (2020). CCR6 blockade on regulatory T cells ameliorates experimental model of multiple sclerosis. Central-Eur. J. Immunol. 45, 256–266. doi: 10.5114/ceji.2020.101241
Jiang, N. M., Cowan, M., Moonah, S. N., and Petri, W. A. Jr. (2018). The impact of systemic inflammation on neurodevelopment. Trends Mol. Med. 24, 794–804. doi: 10.1016/j.molmed.2018.06.008
Keough, M. B., and Monje, M. (2022). Neural signaling in cancer. Annu. Rev. Neurosci. 45, 199–221. doi: 10.1146/annurev-neuro-111020-092702
Khurana, V., and Goswami, B. (2022). Angiotensin converting enzyme (ACE). Clin. Chim. Acta 524, 113–22. doi: 10.1016/j.cca.2021.10.029
Kotas, M. E., and Medzhitov, R. (2015). Homeostasis, inflammation, and disease susceptibility. Cell 160, 816–27. doi: 10.1016/j.cell.2015.02.010
Kotelnikova, E., Kiani, N. A., Messinis, D., Pertsovskaya, I., Pliaka, V., Bernardo-Faura, M., et al. (2019). MAPK pathway and B cells overactivation in multiple sclerosis revealed by phosphoproteomics and genomic analysis. Proc. Natl. Acad. Sci. U S A. 116, 9671–6. doi: 10.1073/pnas.1818347116
Krysko K. M. Henry R. G. Cree B. A. C. Lin J. University of California San Francisco MS-EPIC Team, Caillier, S. . (2019). Telomere length is associated with disability progression in multiple sclerosis. Ann. Neurol. 86, 671–682. doi: 10.1002/ana.25592
Kwon, H. S., and Koh, S. H. (2020). Neuroinflammation in neurodegenerative disorders: the roles of microglia and astrocytes. Transl Neurodegener. 9:42. doi: 10.1186/s40035-020-00221-2
Lasky, L. A. (1991). Lectin cell adhesion molecules (LEC-CAMs): a new family of cell adhesion proteins involved with inflammation. J. Cell Biochem. 45, 139–46. doi: 10.1002/jcb.240450204
Lee, E., Song, C. H., Bae, S. J., Ha, K. T., and Karki, R. (2023). Regulated cell death pathways and their roles in homeostasis, infection, inflammation, and tumorigenesis. Exper. Molec. Med. 55, 1632–1643. doi: 10.1038/s12276-023-01069-y
Lee, W., Yun, S., Choi, G. H., and Jung, T. W. (2018). Fibronectin Type III Domain Containing 4 attenuates hyperlipidemia-induced insulin resistance via suppression of inflammation and ER stress through HO-1 expression in adipocytes. Biochem. Biophys. Res. Commun. 502, 129–136. doi: 10.1016/j.bbrc.2018.05.133
Lemus, H. N., Warrington, A. E., and Rodriguez, M. (2018). Multiple sclerosis: mechanisms of disease and strategies for myelin and axonal repair. Neurol. Clin. 36, 1–11. doi: 10.1016/j.ncl.2017.08.002
Leonard, W. J., and Lin, J. X. (2023). Strategies to therapeutically modulate cytokine action. Nat. Rev. Drug. Disc. 22, 827–854. doi: 10.1038/s41573-023-00746-x
Li, C., Lin, J., Yang, T., Xiao, Y., Jiang, Q., Shang, H., et al. (2022). Physical activity and risk of multiple sclerosis: a Mendelian randomization study. Front. Immunol. 13:872126. doi: 10.3389/fimmu.2022.872126
Li, J., Zhang, Y., Lu, T., Liang, R., Wu, Z., Liu, M., et al. (2022). Identification of diagnostic genes for both Alzheimer's disease and Metabolic syndrome by the machine learning algorithm. Front. Immunol. 13:1037318. doi: 10.3389/fimmu.2022.1037318
Libretti, S., and Aeddula, N. R. (2023). Embryology, Genitourinary. New York: StatPearls Publishing.
Liu, J., Liu, S., Xia, M., Xu, S., Wang, C., Bao, Y., et al. (2013). Rhomboid domain-containing protein 3 is a negative regulator of TLR3-triggered natural killer cell activation. Proc. Natl. Acad. Sci. U S A. 110, 7814–9. doi: 10.1073/pnas.1220466110
Liu, Q., Kang, J., Yin, Y., Zhang, J., Lian, Q., Zhou, F., et al. (2023). Association between multiple sclerosis and cancer risk: an extensive review/meta and Mendelian randomization analyses. Mult. Scler. Relat. Disord. 76:104798. doi: 10.1016/j.msard.2023.104798
Liu, R., Du, S., Zhao, L., Jain, S., Sahay, K., Rizvanov, A., et al. (2022a). Autoreactive lymphocytes in multiple sclerosis: pathogenesis and treatment target. Front. Immunol. 13:996469. doi: 10.3389/fimmu.2022.996469
Liu, R., Qin, S., and Li, W. (2022b). Phycocyanin anti-inflammatory effect and mechanism. Biomed. Pharmacother. 153:113362. doi: 10.1016/j.biopha.2022.113362
Liu, S., Wu, D., Fan, Z., Yang, J., Li, Y., Meng, Y., et al. (2022). FABP4 in obesity-associated carcinogenesis: Novel insights into mechanisms and therapeutic implications. Front. Molec. Biosci. 9:973955. doi: 10.3389/fmolb.2022.973955
Liu, Z., Liang, Q., Ren, Y., Guo, C., Ge, X., Wang, L., et al. (2023). Immunosenescence: molecular mechanisms and diseases. Sign. Transduct. Targ. Ther. 8:200. doi: 10.1038/s41392-023-01451-2
Lloyd, A. F., Davies, C. L., Holloway, R. K., Labrak, Y., Ireland, G., Carradori, D., et al. (2019). Central nervous system regeneration is driven by microglia necroptosis and repopulation. Nat. Neurosci. 22, 1046–1052. doi: 10.1038/s41593-019-0418-z
Lodge, E. J., Xekouki, P., Silva, T. S., Kochi, C., Longui, C. A., Faucz, F. R., et al. (2020). Requirement of FAT and DCHS protocadherins during hypothalamic-pituitary development. JCI Insight 5:e134310. doi: 10.1172/jci.insight.134310
Lustberg, M., Wu, X., Fernández-Martínez, J. L., de Andrés-Galiana, E. J., Philips, S., Leibowitz, J., et al. (2023). Leveraging GWAS data derived from a large cooperative group trial to assess the risk of taxane-induced peripheral neuropathy (TIPN) in patients being treated for breast cancer: part 2-functional implications of a SNP cluster associated with TIPN risk in patients being treated for breast cancer. Supp. Care Cancer. 31:178. doi: 10.1007/s00520-023-07595-9
Ma, Y., Li, R., Wang, J., Jiang, W., Yuan, X., Cui, J., et al. (2021). ITIH4, as an inflammation biomarker, mainly increases in bacterial bloodstream infection. Cytokine 138:155377. doi: 10.1016/j.cyto.2020.155377
Mahad, D. J., Ziabreva, I., Campbell, G., Lax, N., White, K., Hanson, P. S., et al. (2009). Mitochondrial changes within axons in multiple sclerosis. Brain 132, 1161–1174. doi: 10.1093/brain/awp046
Malhotra, S., Morcillo-Suárez, C., Nurtdinov, R., Rio, J., Sarro, E., Moreno, M., et al. (2013). Roles of the ubiquitin peptidase USP18 in multiple sclerosis and the response to interferon-β treatment. Eur. J. Neurol. 20, 1390–1397. doi: 10.1111/ene.12193
Mangold, K. E., Brumback, B. D., Angsutararux, P., Voelker, T. L., Zhu, W., Kang, P. W., et al. (2017). Mechanisms and models of cardiac sodium channel inactivation. Channels 11, 517–533. doi: 10.1080/19336950.2017.1369637
Manohar, V., Crowley, L., and Sreedharan, J. (2009). “TARDBP-related amyotrophic lateral sclerosis-frontotemporal dementia,” in GeneReviews®, ed. M. P. Adam (Seattle: University of Washington).
Maridas, D. E., DeMambro, V. E., Le, P. T., Mohan, S., and Rosen, C. J. (2017). IGFBP4 is required for adipogenesis and influences the distribution of adipose depots. Endocrinology 158, 3488–500. doi: 10.1210/en.2017-00248
Martens, S., and Mithöfer, A. (2005). Flavones and flavone synthases. Phytochemistry 66, 2399–407. doi: 10.1016/j.phytochem.2005.07.013
Martin, C. E., Murray, A. S., Sala-Hamrick, K. E., Mackinder, J. R., Harrison, E. C., Lundgren, J. G., et al. (2021). Posttranslational modifications of serine protease TMPRSS13 regulate zymogen activation, proteolytic activity, and cell surface localization. J. Biol. Chem. 297, 101227. doi: 10.1016/j.jbc.2021.101227
Marzvanyan, A., and Alhawaj, A. F. (2023). Physiology, Sensory Receptors. New York: StatPearls Publishing.
Mathur, V., Burai, R., Vest, R. T., Bonanno, L. N., Lehallier, B., Zardeneta, M. E., et al. (2017). Activation of the STING-dependent type I interferon response reduces microglial reactivity and neuroinflammation. Neuron 96, 1290–1302.e6. doi: 10.1016/j.neuron.2017.11.032
Mbongue, J. C., Nicholas, D. A., Torrez, T. W., Kim, N. S., Firek, A. F., Langridge, W. H., et al. (2015). The role of indoleamine 2, 3-dioxygenase in immune suppression and autoimmunity. Vaccines 3, 703–729. doi: 10.3390/vaccines3030703
Meneses, A., Koga, S., O'Leary, J., Dickson, D. W., Bu, G., Zhao, N., et al. (2021). TDP-43 pathology in Alzheimer's disease. Mol. Neurodegener. 16:84. doi: 10.1186/s13024-021-00503-x
Menezes, M. R., Balzeau, J., and Hagan, J. P. (2018). 3′ RNA uridylation in epitranscriptomics, gene regulation, and disease. Front. Molec. Biosci. 5:61. doi: 10.3389/fmolb.2018.00061
Mestre, L., Alonso, G., Feliú, A., Mecha, M., Martín, C., Villar, L. M., et al. (2021). Aging and neuroinflammation: changes in immune cell responses, axon integrity, and motor function in a viral model of progressive multiple sclerosis. Aging Cell 20:e13440. doi: 10.1111/acel.13440
Mezzaroba, L., Simão, A. N. C., Oliveira, S. R., Flauzino, T., Alfieri, D. F., de Carvalho Jennings Pereira, W. L., et al. (2020). Antioxidant and anti-inflammatory diagnostic biomarkers in multiple sclerosis: a machine learning study. Mol. Neurobiol. 57, 2167–2178. doi: 10.1007/s12035-019-01856-7
Miller, D. R., and Thorburn, A. (2021). Autophagy and organelle homeostasis in cancer. Dev. Cell. 56, 906–918. doi: 10.1016/j.devcel.2021.02.010
Naghshi, S., Aune, D., Beyene, J., Mobarak, S., Asadi, M., Sadeghi, O., et al. (2021). Dietary intake and biomarkers of alpha linolenic acid and risk of all cause, cardiovascular, and cancer mortality: systematic review and dose-response meta-analysis of cohort studies. BMJ 375:n2213. doi: 10.1136/bmj.n2213
Negrotto, L., and Correale, J. (2017). Amino acid catabolism in multiple sclerosis affects immune homeostasis. J. Immunol. 198, 1900–1909. doi: 10.4049/jimmunol.1601139
Neumann, B., Segel, M., Chalut, K. J., and Franklin, R. J. (2019). Remyelination and ageing: reversing the ravages of time. Mult. Scler. 25, 1835–1841. doi: 10.1177/1352458519884006
Neumann, H., Kotter, M. R., and Franklin, R. J. (2009). Debris clearance by microglia: an essential link between degeneration and regeneration. Brain 132, 288–295. doi: 10.1093/brain/awn109
Niland, B., Miklossy, G., Banki, K., Biddison, W. E., Casciola-Rosen, L., Rosen, A., et al. (2010). Cleavage of transaldolase by granzyme B causes the loss of enzymatic activity with retention of antigenicity for multiple sclerosis patients. J. Immunol. 184, 4025–4032. doi: 10.4049/jimmunol.0804174
O'Callaghan, E. K., Ballester Roig, M. N., and Mongrain, V. (2017). Cell adhesion molecules and sleep. Neurosci. Res. 116, 29–38. doi: 10.1016/j.neures.2016.11.001
Ohkuni, K., Gliford, L., Au, W. C., Suva, E., Kaiser, P., Basrai, M. A., et al. (2022). Cdc48Ufd1/Npl4 segregase removes mislocalized centromeric histone H3 variant CENP-A from non-centromeric chromatin. Nucleic. Acids Res. 50, 3276–3291. doi: 10.1093/nar/gkac135
Oliveira, A. M., Coelho, L., Carvalho, E., Ferreira-Pinto, M. J., Vaz, R., Aguiar, P., et al. (2023). Machine learning for adaptive deep brain stimulation in Parkinson's disease: closing the loop. J. Neurol. 270, 5313–5326. doi: 10.1007/s00415-023-11873-1
Olivieri, F., Bonafè, M., Giovagnetti, S., Stecconi, R., Cardelli, M., Cavallone, L., et al. (2003). In vitro IL-6 production by EBV-immortalized B lymphocytes from young and elderly people genotyped for−174 C/G polymorphism in IL-6 gene: a model to study the genetic basis of inflammaging. Mechan. Ageing Dev. 124, 549–553. doi: 10.1016/S0047-6374(03)00035-6
Oost, W., Talma, N., Meilof, J. F., and Laman, J. D. (2018). Targeting senescence to delay progression of multiple sclerosis. J. Molec. Med. 96, 1153–1166. doi: 10.1007/s00109-018-1686-x
Park, S. J., and Choi, J. W. (2020). Brain energy metabolism and multiple sclerosis: progress and prospects. Arch. Pharm. Res. 43, 1017–1030. doi: 10.1007/s12272-020-01278-3
Pender, M. P. (2011). The essential role of Epstein-Barr virus in the pathogenesis of multiple sclerosis. Neuroscientist 17, 351–367. doi: 10.1177/1073858410381531
Pender, M. P., Csurhes, P. A., Pfluger, C. M., and Burrows, S. R. (2012). CD8 T cell deficiency impairs control of Epstein–Barr virus and worsens with age in multiple sclerosis. J. Neurol. Neurosurg. Psychiat. 83, 353–354. doi: 10.1136/jnnp-2011-300213
Peng, J. M., Tseng, R. H., Shih, T. C., and Hsieh, S. Y. (2021). CAMK2N1 suppresses hepatoma growth through inhibiting E2F1-mediated cell-cycle signaling. Cancer Lett. 497, 66–76. doi: 10.1016/j.canlet.2020.10.017
Peterson, C. T., Rodionov, D. A., Osterman, A. L., and Peterson, S. N. B. (2020). Vitamins and their role in immune regulation and cancer. Nutrients 12:3380. doi: 10.3390/nu12113380
Plantone, D., Inglese, M., Salvetti, M., and Koudriavtseva, T. A. (2019). Perspective of coagulation dysfunction in multiple sclerosis and in experimental allergic encephalomyelitis. Front. Neurol. 9:1175. doi: 10.3389/fneur.2018.01175
Pourtavakoli, A., and Ghafouri-Fard, S. (2022). Calcium signaling in neurodevelopment and pathophysiology of autism spectrum disorders. Mol. Biol. Rep. 49, 10811–10823. doi: 10.1007/s11033-022-07775-6
Przygodzka, P., Papiewska-Pajak, I., Bogusz-Koziarska, H., Sochacka, E., Boncela, J., Kowalska, M. A., et al. (2019). Regulation of miRNAs by Snail during epithelial-to-mesenchymal transition in HT29 colon cancer cells. Sci. Rep. 9:2165. doi: 10.1038/s41598-019-39200-7
Ragonese, P., Aridon, P., Vazzoler, G., Mazzola, M. A., Lo Re, V., Lo Re, M., et al. (2017). Association between multiple sclerosis, cancer risk, and immunosuppressant treatment: a cohort study. BMC Neurol. 17:155. doi: 10.1186/s12883-017-0932-0
Reichardt, L. F. (2006). Neurotrophin-regulated signalling pathways. Philos. Trans. R. Soc. London B. Biol. Sci. 361, 1545–1564. doi: 10.1098/rstb.2006.1894
Rodrigues, L. P., Teixeira, V. R., Alencar-Silva, T., Simonassi-Paiva, B., Pereira, R. W., Pogue, R., et al. (2021). Hallmarks of aging and immunosenescence: connecting the dots. Cytok. Growth Factor Rev. 59, 9–21. doi: 10.1016/j.cytogfr.2021.01.006
Rønn, L. C., Hartz, B. P., and Bock, E. (1998). The neural cell adhesion molecule (NCAM) in development and plasticity of the nervous system. Exper. Gerontol. 33, 853–864. doi: 10.1016/S0531-5565(98)00040-0
Saeidi, M., Vahidi, Z., Nahayati, M. A., Rezaiyan, M. K., Zemorshidi, F., Mahdifar, M., et al. (2023). XCL1, a serum biomarker in neurological diseases; HTLV-1-associated myelopathy and multiple sclerosis. Microb. Pathog. 174:105962. doi: 10.1016/j.micpath.2022.105962
Salas, I. H., Callaerts-Vegh, Z., Arranz, A. M., Guix, F. X., D'Hooge, R., Esteban, J. A., et al. (2017). Tetraspanin 6: a novel regulator of hippocampal synaptic transmission and long term plasticity. PLoS ONE 12:e0171968. doi: 10.1371/journal.pone.0171968
Sarasin-Filipowicz, M., Wang, X., Yan, M., Duong, F. H., Poli, V., Hilton, D. J., et al. (2009). Alpha interferon induces long-lasting refractoriness of JAK-STAT signaling in the mouse liver through induction of USP18/UBP43. Mol. Cell Biol. 29, 4841–51. doi: 10.1128/MCB.00224-09
Sato, H., Taketomi, Y., Miki, Y., Murase, R., Yamamoto, K., Murakami, M., et al. (2020). Secreted phospholipase PLA2G2D contributes to metabolic health by mobilizing ω3 polyunsaturated fatty acids in WAT. Cell Rep. 31:107579. doi: 10.1016/j.celrep.2020.107579
Schebb, N. H., Kühn, H., Kahnt, A. S., Rund, K. M., O'Donnell, V. B., Flamand, N., et al. (2022). Formation. signaling and occurrence of specialized pro-resolving lipid mediators-what is the evidence so far? Front. Pharmacol. 13:838782. doi: 10.3389/fphar.2022.838782
Schirmer, L., Velmeshev, D., Holmqvist, S., Kaufmann, M., Werneburg, S., Jung, D., et al. (2019). Neuronal vulnerability and multilineage diversity in multiple sclerosis. Nature 573, 75–82. doi: 10.1038/s41586-019-1404-z
Sehgal, A., Irvine, K. M., and Hume, D. A. (2021). Functions of macrophage colony-stimulating factor (CSF1) in development, homeostasis, and tissue repair. Semin. Immunol. 54:101509. doi: 10.1016/j.smim.2021.101509
Sen, M. K., Mahns, D. A., Coorssen, J. R., and Shortland, P. J. (2022). The roles of microglia and astrocytes in phagocytosis and myelination: Insights from the cuprizone model of multiple sclerosis. Glia 70, 1215–50. doi: 10.1002/glia.24148
Shen, C. Y., Wu, C. H., Lu, C. H., Kuo, Y. M., Li, K. J., Hsieh, S. C., et al. (2019). Advanced glycation end products of bovine serum albumin suppressed Th1/Th2 cytokine but enhanced monocyte IL-6 gene expression via MAPK-ERK and MyD88 transduced NF-κB p50 signaling pathways. Molecules 24:2461. doi: 10.3390/molecules24132461
Shishido, S. N., Varahan, S., Yuan, K., Li, X., and Fleming, S. D. (2012). Humoral innate immune response and disease. Clin. Immunol. 144, 142–158. doi: 10.1016/j.clim.2012.06.002
Silk, A. W., and Margolin, K. (2019). Cytokine therapy. Hematol. Oncol. Clin. North Am. 33, 261–74. doi: 10.1016/j.hoc.2018.12.004
Simkins, T. J., Duncan, G. J., and Bourdette, D. (2021). Chronic demyelination and axonal degeneration in multiple sclerosis: pathogenesis and therapeutic implications. Curr. Neurol. Neurosci. Rep. 21:26. doi: 10.1007/s11910-021-01110-5
Singh, N., Baby, D., Rajguru, J. P., Patil, P. B., Thakkannavar, S. S., Pujari, V. B., et al. (2019). Inflammation and cancer. Ann. Afr. Med. 18, 121–6. doi: 10.4103/aam.aam_56_18
Soldan, S. S., and Lieberman, P. M. (2023). Epstein-Barr virus and multiple sclerosis. Nat. Rev. Microbiol. 21, 51–64. doi: 10.1038/s41579-022-00770-5
Sun, E., He, J., and Zhuang, X. (2013). Live cell imaging of viral entry. Curr. Opin. Virol. 3, 34–43. doi: 10.1016/j.coviro.2013.01.005
Sun, Y., Liu, W. Z., Liu, T., Feng, X., Yang, N., Zhou, H. F., et al. (2015). Signaling pathway of MAPK/ERK in cell proliferation, differentiation, migration, senescence and apoptosis. J. Recept. Signal Transduct. Res. 35, 600–604. doi: 10.3109/10799893.2015.1030412
Suptela, A. J., and Marriott, I. (2023). Cytosolic DNA sensors and glial responses to endogenous DNA. Front. Immunol. 14:1130172. doi: 10.3389/fimmu.2023.1130172
Suzuki, S. C., and Takeichi, M. (2008). Cadherins in neuronal morphogenesis and function. Dev. Growth Differ. 50, S119–S130. doi: 10.1111/j.1440-169X.2008.01002.x
Tanaka, S., and Baba, Y. B. (2020). Cell receptor signaling. Adv. Exp. Med. Biol. 1254, 23–36. doi: 10.1007/978-981-15-3532-1_2
Ten Bosch, G. J. A., Bolk, J., 't Hart, B. A., and Laman, J. D. (2021). Multiple sclerosis is linked to MAPKERK overactivity in microglia. J. Molec. Med. 99, 1033–1042. doi: 10.1007/s00109-021-02080-4
Tong, M. H. G., Jeeves, M., Rajesh, S., Ludwig, C., Lenoir, M., Kumar, J., et al. (2020). Backbone resonance assignments of the catalytic and regulatory domains of Ca2+/calmodulin-dependent protein kinase 1D. Biomol. NMR Assign. 14, 221–5. doi: 10.1007/s12104-020-09950-x
Touil, H., Li, R., Zuroff, L., Moore, C. S., Healy, L., Cignarella, F., et al. (2023). Cross-talk between B cells, microglia and macrophages, and implications to central nervous system compartmentalized inflammation and progressive multiple sclerosis. EBioMedicine 96:104789. doi: 10.1016/j.ebiom.2023.104789
Turner, N., and Grose, R. (2010). Fibroblast growth factor signalling: from development to cancer. Nat. Rev. Cancer. 10, 116–29. doi: 10.1038/nrc2780
Vécsei, L., Szalárdy, L., Fülöp, F., and Toldi, J. (2013). Kynurenines in the CNS: recent advances and new questions. Nat. Rev. Drug Disc. 12, 64–82. doi: 10.1038/nrd3793
Vély, F., and Vivier, E. (2005). (2005). Natural killer cell receptor signaling pathway. Science's STKE 292:cm6. doi: 10.1126/stke.2922005cm6
Walton, C., King, R., Rechtman, L., Kaye, W., Leray, E., Marrie, R. A., et al. (2020). Rising prevalence of multiple sclerosis worldwide: insights from the Atlas of MS, third edition. Mult. Scler. 26, 1816–1821. doi: 10.1177/1352458520970841
Wan, Y. Y. (2014). GATA3: a master of many trades in immune regulation. Trends Immunol. 35, 233–42. doi: 10.1016/j.it.2014.04.002
Wang, M., Liu, C., Zou, M., Niu, Z., Zhu, J., Jin, T., et al. (2023). Recent progress in epidemiology, clinical features, and therapy of multiple sclerosis in China. Ther. Adv. Neurol. Disord. 16:17562864231193816. doi: 10.1177/17562864231193816
Watanabe, S., Hidenori, U., Hashimoto, S., Riko, S., Aizawa, T., Tsugawa, K., et al. (2022). Sphingomyelin phosphodiesterase acid-like 3b is essential for toll-like receptor 3 signaling in human podocytes. J. Membr. Biol. 255, 117–22. doi: 10.1007/s00232-021-00206-w
Wu, L., Lian, W., and Zhao, L. (2021). Calcium signaling in cancer progression and therapy. FEBS J. 288, 6187–205. doi: 10.1111/febs.16133
Wu, Z., and Zhou, X. (2022). Hematopoietic anomalies fuels multiple sclerosis. Life Med. 1, 52–4. doi: 10.1093/lifemedi/lnac019
Xia, S., Zhang, X., Zheng, S., Khanabdali, R., Kalionis, B., Wu, J., et al. (2016). An update on inflammaging: mechanisms, prevention, and treatment. J. Immunol. Res. 2016:8426874. doi: 10.1155/2016/8426874
Xiao, J. B., Leng, A. M., Zhang, Y. Q., Wen, Z., He, J., Ye, G. N., et al. (2019). CUEDC2: multifunctional roles in carcinogenesis. Front. Biosci. 24, 935–946. doi: 10.2741/4759
Yan, Z., Gibson, S. A., Buckley, J. A., Qin, H., and Benveniste, E. N. (2018). Role of the JAK/STAT signaling pathway in regulation of innate immunity in neuroinflammatory diseases. Clin. Immunol. 189, 4–13. doi: 10.1016/j.clim.2016.09.014
Yang, C., Hao, Z., Zhang, L., Zeng, L., and Wen, J. (2015). Sodium channel blockers for neuroprotection in multiple sclerosis. Cochr. Datab. System. Rev. 10:CD010422. doi: 10.1002/14651858.CD010422.pub2
Yuan, S., Xiong, Y., and Larsson, S. C. (2021). An atlas on risk factors for multiple sclerosis: a Mendelian randomization study. J. Neurol. 268, 114–24. doi: 10.1007/s00415-020-10119-8
Zevini, A., Olagnier, D., and Hiscott, J. (2017). Crosstalk between cytoplasmic RIG-I and STING sensing pathways. Trends Immunol. 38, 194–205. doi: 10.1016/j.it.2016.12.004
Zhong, S., Chen, L., Li, X., Wang, X., Ji, G., Sun, C., et al. (2023). Bmp8a deletion leads to obesity through regulation of lipid metabolism and adipocyte differentiation. Commun. Biol. 6:824. doi: 10.1038/s42003-023-05194-2
Zhou, J., Huang, J., Li, Z., Song, Q., Yang, Z., Wang, L., et al. (2023). Identification of aging-related biomarkers and immune infiltration characteristics in osteoarthritis based on bioinformatics analysis and machine learning. Front. Immunol. 14:1168780. doi: 10.3389/fimmu.2023.1168780
Keywords: inflammaging, multiple sclerosis, machine learning, network analysis, pan-cancer analysis
Citation: Xu M, Wang H, Ren S, Wang B, Yang W, Lv L, Sha X, Li W and Wang Y (2024) Identification of crucial inflammaging related risk factors in multiple sclerosis. Front. Mol. Neurosci. 17:1398665. doi: 10.3389/fnmol.2024.1398665
Received: 10 March 2024; Accepted: 30 April 2024;
Published: 21 May 2024.
Edited by:
Debora Giunti, University of Genoa, ItalyReviewed by:
Debolina D. Biswas, Duke University, United StatesGabriela Coronel Vargas, Ospedale Policlinico San Martino, Italy
Copyright © 2024 Xu, Wang, Ren, Wang, Yang, Lv, Sha, Li and Wang. This is an open-access article distributed under the terms of the Creative Commons Attribution License (CC BY). The use, distribution or reproduction in other forums is permitted, provided the original author(s) and the copyright owner(s) are credited and that the original publication in this journal is cited, in accordance with accepted academic practice. No use, distribution or reproduction is permitted which does not comply with these terms.
*Correspondence: Xianzheng Sha, xzsha@cmu.edu.cn; Wenya Li, saint5288@hotmail.com; Yin Wang, chinawangyin@foxmail.com
†These authors have contributed equally to this work