Connectivity concordance mapping: a new tool for model-free analysis of fMRI data of the human brain
- 1 Max Planck Institute for Human Cognitive and Brain Sciences, Leipzig, Germany
- 2 Mind and Brain Institute and Berlin School of Mind and Brain, Berlin, Germany
- 3 Center for Stroke Research, Charité – Universitätsmedizin, Berlin, Germany
Functional magnetic resonance data acquired in a task-absent condition (“resting state”) require new data analysis techniques that do not depend on an activation model. Here, we propose a new analysis method called Connectivity Concordance Mapping (CCM). The main idea is to assign a label to each voxel based on the reproducibility of its whole-brain pattern of connectivity. Specifically, we compute the correlations of time courses of each voxel with every other voxel for each measurement. Voxels whose correlation pattern is consistent across measurements receive high values. The result of a CCM analysis is thus a voxel-wise map of concordance values. Regions of high inter-subject concordance can be assumed to be functionally consistent, and may thus be of specific interest for further analysis. Here we present two fMRI studies to demonstrate the possible applications of the algorithm. The first is a eyes-open/eyes-closed paradigm designed to highlight the potential of the method in a relatively simple domain. The second study is a longitudinal repeated measurement of a patient following stroke. Longitudinal clinical studies such as this may represent the most interesting domain of applications for this algorithm.
Introduction
In recent years, spontaneous blood oxygen level dependent (BOLD) fluctuations have gained interest in the field of neuroscience. The popularity of intrinsic brain activity, often operationalized as “resting state” functional magnetic resonance imaging (fMRI), is in large part due to its use in mapping functional connectivity. Such connectivity maps are based on the intrinsic correlation between distributed brain regions. They have been shown to replicate the spatial extent of task-related functional systems without needing an overt task (e.g., Biswal et al., 1995), and are highly reproducible across individuals (Damoiseaux et al., 2006), time (Shehzad et al., 2009), and sites (Biswal et al., 2010). These features make intrinsic functional connectivity a particularly promising approach to describing functional brain organization across various populations and brain states. However, truly data-driven exploratory analytic techniques are still needed in the field.
The growing interest in functional connectivity is closely related to resting state fMRI (rs-fMRI). One of the most important points in favor of rs-fMRI is its attractiveness for clinical applications (Fox and Greicius, 2010). In patients, using resting state fMRI is advantageous mainly due to the lack of task involvement. Some patients are unable to perform certain tasks, or rather have different performance level, which could influence the results. In addition, rs-fMRI is relatively easy to carry out and is less time consuming, which makes it ideal for the clinical population.
As a result, there is an increased demand for simple analysis methods that require little manual intervention. Such methods cannot draw on information of any experimental design and should be as parameter-free as possible. The earliest, and most commonly used analysis of spontaneous BOLD fluctuations involves defining a region-of-interest, or “seed region,” and correlating it with all other voxels in the brain. Although the “seed-based” functional connectivity is intuitive and straightforward in its results, the main disadvantage is the requirement of an a priori hypothesis as to the location of the seed (Biswal et al., 1995; Fox et al., 2006; Margulies et al., 2007). In contrast, independent component analysis (ICA) has gained wide popularity as a data-driven technique that distinguishes functional brain networks (Beckmann et al., 2005; Damoiseaux et al., 2006; De Luca et al., 2006; Smith et al., 2009). Nonetheless, a posteriori decisions are required to determine which components are functionally relevant. (For reviews of issues relating to these methodologies, see: Cole et al., 2010; Margulies et al., 2010.) These are both limiting factors for an analysis that allows discovery-based investigation of functional brain organization (Biswal et al., 2010).
Graph-based measures have gained interest recently (Bullmore and Sporns, 2009; Buckner, 2010; Sporns, 2010). Some of these approaches are computationally very complex and require a reduction in the number of “nodes” in the brain through the use of anatomically (Tzourio-Mazoyer et al., 2002) and functionally defined (Craddock et al., 2011) parcelation units. Centrality-based methods (Buckner, 2010; Lohmann et al., 2010) detect “hubs” as special features of networks, but may fail to find other relevant features.
Here, we propose a new method of fMRI data analysis called “Connectivity Concordance Mapping (CCM).” The aim of CCM is to express the reproducibility of functional connectivity patterns in the whole brain. Specifically, we compute the correlations of time courses of each voxel with every other voxel in each dataset. Voxels whose correlation pattern is consistent across datasets receive high values. Consistency is measured using Kendall’s W (Kendall and Babington Smith, 1939). The result of a CCM analysis is a voxel-wise map of concordance values. Regions of high concordance can be assumed to be functionally consistent, and may thus be of specific interest for further analysis, such as a seed-based analysis. Concordance can be measured between subjects (i.e., inter-subject consistency), or in the same subject between different time points (i.e., longitudinal dataset). Here we present an example for each one of these scenarios. Longitudinal studies are of particular interest in clinical environments where it is often important to monitor the progression of a disease, or the effectiveness of a treatment.
In the context of fMRI experiments, concordance has been used to assess reproducibility (e.g., Lange et al., 1999; Shehzad et al., 2009; Biswal et al., 2010) or regional homogeneity (Zang et al., 2004; Liu et al., 2010, see also Hasson et al., 2009) for a review about reproducibility of activation patterns. The novelty of the present approach is that concordance can be used as a tool for whole-brain mapping at the voxel level. Our method is closely related to another approach recently proposed by Shehzad et al. (2011) called MDMR. MDMR calculates the main effect of how much patterns of connectivity are predicted by a phenotypic and possibly continuous variable. In contrast, we are primarily interested in assessing concordance in connectivity between groups of subjects or across longitudinal repeated measurements. Another difference is that we propose to use Kendall’s W as a concordance measure whereas Shezad et al. use linear correlation. As will be discussed in the following section, for the types of application we have in mind here, concordance is often better suited than correlation.
Materials and Methods
Algorithm
We define a region-of-interest (ROI) containing n voxels to which all subsequent analysis steps are restricted. In the experiments reported in this study, the ROIs covered the entire cerebrum and consisted of n ≈ 50,000 voxels.
We assume that m fMRI data sets exist and are geometrically aligned to some common geometrical reference frame. These data sets may for instance be acquired from different subjects participating in the same study or from one subject undergoing repeated measurements in a longitudinal study. We are interested in the concordance of these data sets with respect to their connectivity pattern.
For each data set k = 1,…, m and each voxel address i = 1,…, n we obtain a connectivity vector  whose entries
  contain a pairwise similarity measure between the time courses of voxels i and j. Several similarity measures may be used for this purpose. In this study, we use Pearson’s linear correlation coefficient defined as:
with xt, yt, t = 1,…, T time series in two voxels, and their  temporal means. Other similarity metrics such as wavelet coherence or spectral coherence may be used as well. Here, we are interested in the concordance of the connectivity vectors
  across the multiple measurements k = 1,…, m. This concordance value is used to label voxel i.
Several concordance measures are known, and are discussed in a large body of literature (e.g., Shrout and Fleiss, 1979; Lin, 1989; Barnhart et al., 2002). Here, we propose to use Kendall’s W (Kendall and Babington Smith, 1939; Legendre, 2005) as a measure of concordance. It yields values between 0 and 1 with “1” denoting complete agreement and “0” complete disagreement. Its main advantage over other concordance measures is its ease of use and the fact that it does not presuppose Gaussianity of the data. This is particularly important when connectivity measures other than linear correlation are used.
Kendall’s W is defined as follows.
Let  k = 1,…, m be m connectivity vectors in voxel i as defined above. Suppose for instance, that the m different data sets correspond to m different “raters” who are asked to rank each voxel j according to the strength of its correlation with the current voxel i. As a first step, we perform a ranking such that rjk denotes the j-th rank among the n entries of vector
  The total rank given to each voxel j by those raters is
The mean values of these total ranks is

and the sum of squared deviations is
If the fictitious raters disagree, their ranking should be approximately random so that the sum of their ranks is about equal and their deviation S low, while a high value of S indicates good agreement. Thus, with some normalization terms, Kendall’s W can be defined as

For comparison, we also tested the “Overall Concordance Correlation Coefficient (OCCC)” (Barnhart et al., 2002) defined as
with sj, j = 1,…, m observation vectors which in our case correspond to the correlation maps described above, and s. j, s..,  and Cjk as sample means, overall mean, variances and covariances, respectively. Note that in contrast to Kendall’s W, OCCC presupposes Gaussianity of the data. For further detail see Barnhart et al. (2002).
One should note that concordance differs from correlation in several aspects. Most importantly, linear correlation is based on a subtraction of the mean. Therefore, when using correlation instead of concordance one could imagine two connectivity maps that show the same pattern, where in one map correlations are generally much lower. In such a situation, using Pearson’s correlation the consistency between the two maps would be rated high whereas Kendall’s W would give a low mark. In many applications, one would like to distinguish those two cases. In clinical applications for instance, it may be important to monitor global changes in connectivity which would not be possible using correlation instead of concordance.
Experiment 1
As an illustration of the CCM pattern during “resting state” condition in healthy controls, we applied CCM to two resting state paradigms: eyes-open and eyes-closed. Functional magnetic resonance imaging (fMRI) data were obtained in a 30.4 min (800 volumes) resting state scan using a Siemens Tim Trio 3T scanner at the University Hospital Charite in Berlin, Germany for 7 healthy subjects. Three-dimensional functional images using blood oxygen level dependent (BOLD) contrast were obtained with a gradient echo planar imaging (EPI) sequence (TR = 2300 ms, TE = 30 ms, 30 slices; voxel size: 3.125 mm × 3.125 mm × 4 mm, flip angle 90°). The scan was comprised of four blocks of 7.6 min each. The experiment was approved by the local ethics committee. In two of the four blocks subjects were instructed to keep their eyes-open, in the other two blocks eyes were closed, with no overt task being imposed. No fixation cross was presented. The order of the two conditions was randomized across subjects. For the present study, we analyzed the first eyes-open/eyes-closed block (each condition lasting 200 volume). Data were preprocessed using the software package Lipsia (Lohmann et al., 2001). Preprocessing of functional data included slice-scan time and motion correction, alignment to a functional template of MNI space (resampling to an isotropic voxel grid with a resolution of 3 mm3), band pass filtering (0.011–0.166 Hz) and spatial smoothing of 7 mm FWHM. Global signal was not removed.
For the purpose of CCM analysis a region-of-interest was manually defined. The mask contained 47,872 voxels covering the entire cerebrum (see Figure A1 in Appendix). CCM was computed in two ways: (1) inter-subject CCM for each one of the conditions separately (i.e. eyes-open/eyes-closed). Each condition was computed based on time series from the 7 subjects. (2) Intra-subject CCM was computed for each subject’s eyes-closed and eyes-open scan and was later averaged across subjects (n = 7).
Experiment 2
As an illustration of the potential usefulness of CCM in clinical data, we applied CCM to a longitudinal data set acquired in a patient following lacunar stroke. fMRI data were obtained in a 5.75 min (150 volumes) resting state scan using a Siemens Tim Trio 3T scanner at the University Hospital Charite in Berlin, Germany. The patient was instructed to lie still and keep the eyes-open for the duration of the scan, with no overt task being imposed. The patient was scanned at four time points: day 1, day 27, day 94, and day 199 following the stroke (corresponding to t1, t2, t3, and t4; day 0 represents the day of the stroke). Three-dimensional functional images using BOLD contrast were obtained with a EPI sequence (TR = 2300 ms, TE = 30 ms, 30 slices; voxel size: 3.125 mm × 3.125 mm × 4 mm, flip angle 90°). T1-weighted anatomical images were acquired using a 3D MPRAGE sequence (TR = 1900 ms, TE = 2.52 ms, TI = 900 ms, 192 slices, voxel size: 1 mm × 1 mm × 1 mm, flip angle 9°). Diffusion Weighted imaging was acquired in t1 for the purpose of lesion localization. Data were preprocessed using the software package Lipsia (Lohmann et al., 2001). Preprocessing included slice-scan time and motion correction, alignment to an anatomical MNI template based on the T1-MPRAGE image acquired at t3 (resampling to an isotropic voxel grid with a resolution of 3 mm3), band pass filtering (0.0125–0.166 Hz) and spatial smoothing of 6 mm FWHM. Global signal was not removed. For the purpose of CCM analysis a region-of-interest was manually defined. The mask contained 50,199 voxels covering the entire cerebrum and parts of the cerebellum. Ventricles were manually excluded from the mask (see Figure A2 in Appendix). An independent radiologist determined stroke location. Stroke was localized to left thalamus and left occipital cortex due to posterior cerebral artery infarct (see Figure 4). The ethics committee of the Faculty of Medicine at the Charite University, Berlin, Germany, approved the experiment. Written informed consent was obtained from the patient. CCM was computed for all four time points (i.e., t1–t4) and for pairs of consecutive time points (i.e., t1 and t2, t2 and t3, t3 and t4), in order to trace changes in the connectivity pattern over shorter time points as well. As a second level of analysis, linear correlation based on a seed was computed for each one of the time points. A seed voxel was defined in the left thalamus based on a local maximum of CCM value. A comparison between two time points was done by a subtraction of the corresponding functional connectivity maps.
Results
Experiment 1
In order to explore the typical pattern of CCM during common resting state paradigms, CCM was computed for 7 subjects in the two resting states of experiment 1. Figure 1 depicts the CCM inter-subjects’ results using Kendall’s W as a concordance measure. In both states, most of the cortical gray matter is concordant including the thalamus subcortically. Areas that demonstrate high concordance include the visual, auditory and sensory-motor networks. Additionally, areas which are known to be part of the task negative network, also known as the “default mode network” (Gusnard et al., 2001), such as posterior cingulate cortex, inferior parietal lobule and middle frontal gyrus are concordant but to a lesser extent than primary regions regions. Lateral areas of the prefrontal cortex are less concordant than the rest of the brain. For comparison, Figure 2 shows the same data analyzed using the Overall Concordance Correlation Coefficient (OCCC; Barnhart et al., 2002). Note that the results appear quite similar. The Pearson correlation between the maps of Figure 1 compared to Figure 2 was 0.94 for the eyes-closed condition, and 0.91 for the eyes-open condition.
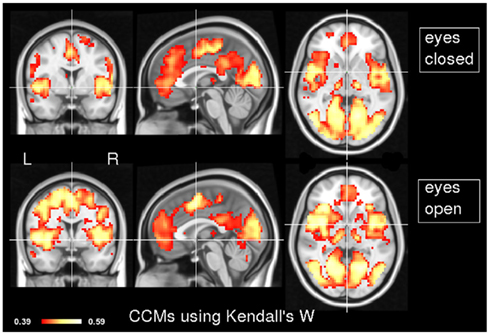
Figure 1. Inter-subject CCM using Kendall’s W. CCM has been calculated for eyes-closed (top) and eyes-open (bottom), n = 7 subjects in each condition. MNI coordinates of slice positions are (0, 0, 0). The concordance measure was Kendall’s W.
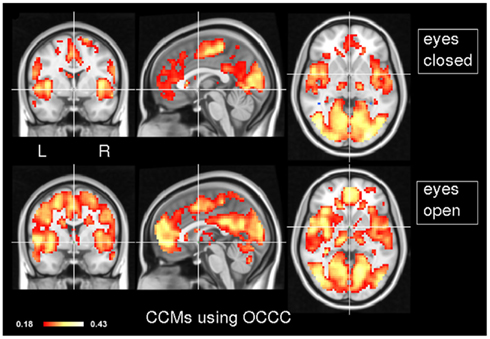
Figure 2. Inter-subject CCM using OCCC. As in Figure 1, CCM has been calculated for eyes-closed (top) and eyes-open (bottom), n = 7 subjects in each condition. MNI coordinates of slice positions are (0, 0, 0). For comparison, the concordance measure was OCCC.
In order to test the concordance between the two states, we applied CCM to the eyes-open and eyes-closed datasets in the same subject (within-subject CCM) and computed an average of the resulting maps. As can be seen in Figure 3, most of the areas of high concordance are similar to the spatial pattern of CCM in the inter-subject CCM, with the exception of primary visual cortex (V1) which is notably smaller in concordance.
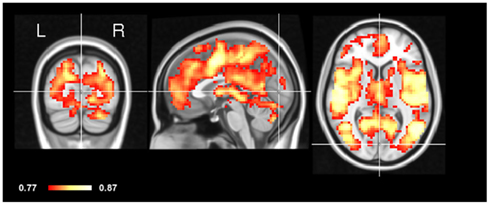
Figure 3. Intra-subject CCM eyes-open and eyes-closed. The concordance of eyes-open and eyes-closed scans was assessed within each subject separately yielding an individual CCM per subject. These CCMs were then averaged. Note that early visual cortex (V1) shows relatively low concordance compared to other brain regions. Crosshair is positioned in the Calcarine sulcus.
Experiment 2
In order to explore the potential applicability of CCM to clinical data sets, concordance was measured in a patient following stroke in a longitudinal manner. Figure 4 depicts the location of the stroke on a diffusion weighted image acquired one day after stroke. The lesion was restricted to left thalamus and an additional lesion in the left occipital cortex. As a first step of the analysis, we applied CCM on all four time points following the stroke; day 1, day 27, day 94, and day 199 following the stroke (corresponding to t1, t2, t3, and t4, day 0 represents the day of the stroke). Figure 5 shows concordance across all time points (t1, t2, t3, t4). As in the healthy subjects of experiment 1, cortical regions were generally found to be concordant in this patient. For investigating the process of recovery after stroke, we monitored changes in connectivity represented by low concordance. The lowest concordance value of the entire brain was found in the left globus pallidus with Kendall’s W = 0.22 (Figure 5C).
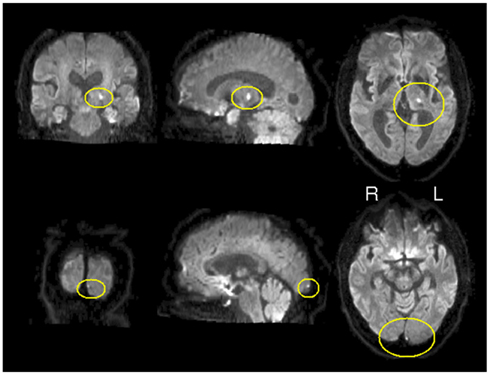
Figure 4. Location of stroke. Diffusion weighted image. Hyper intensities marked in yellow represent the lesioned areas. Lesions are restricted to left thalamus and left occipital pole.
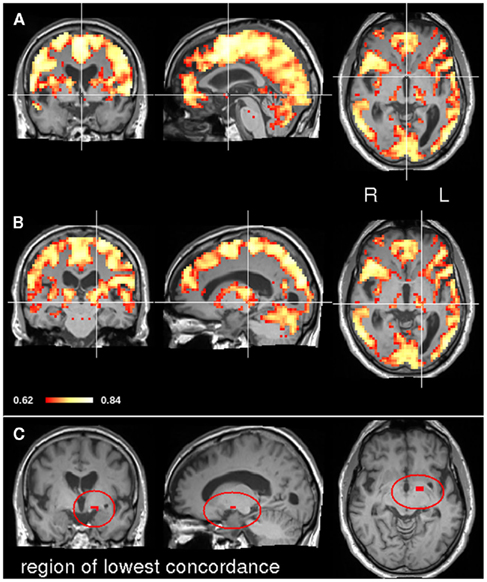
Figure 5. CCM in a stroke patient. The concordance over all four time points (t1, t2, t3, and t4) was assessed. The top image (A) shows the CCM map at MNI slice position (0, 0, 0). In the middle image (B) the map crosshair marks the position of the left thalamic lesion. The bottom image (C) shows the region where connectivity concordance was lowest.
In order to assess dynamics of concordance over time, we computed CCMs in each pair of consecutive time points i.e., t1 and t2, t2 and t3, and t3 and t4 (Figure 6). As before, most of the gray matter showed high concordance values. However, some areas show marked changes in their concordance over time (Figure 7). Prominent changes in the left and right globus pallidus were found in the difference between the CCMs of t2, t3 versus t3, t4, but much less in the difference of the CCMs of t1, t2 versus t2, t3. This indicates that the low concordance that we found in the overall concordance map shown in Figure 5 is primarily a late stage effect.
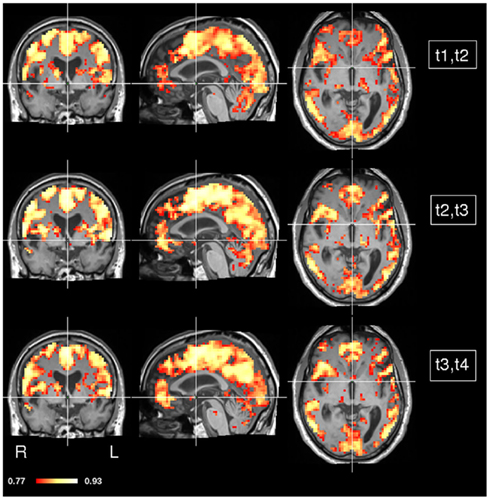
Figure 6. CCM dynamics in a stroke patient. The concordance between any two consecutive time points was calculated (t1 and t2, t2 and t3, t3 and t4). MNI coordinates of slice positions are (0, 0, 0).
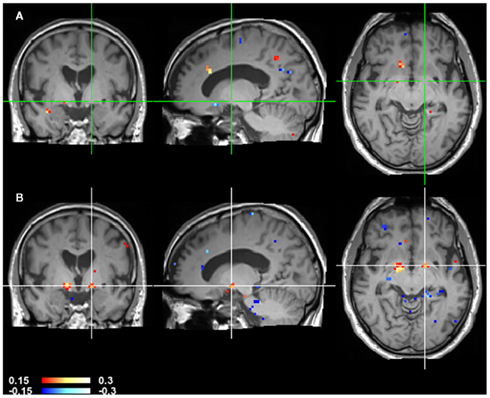
Figure 7. CCM dynamics in a stroke patient. CCMs of consecutive time points of Figure 6 were subtracted to highlight changes over time. The top image (A) shows CCM(t1, t2) minus CCM(t2, t3). The bottom image (B) shows CCM(t2, t3) minus CCM(t3, t4). Note that globus pallidus marked by the crosshair shows a large difference in the second difference image but not in the first indicating that the changes in this area occur at a late stage.
Local maxima or minima in connectivity concordance maps may be used as seeds for subsequent correlation analyses. Since the results shown in Figure 6 indicated a change in connectivity with globus pallidus, we used the local minima located in the left and right globus pallidus as seed voxels (Figures 8 and 9). We found a noticeable change in inter-hemispheric differences between time points t3 and t4.
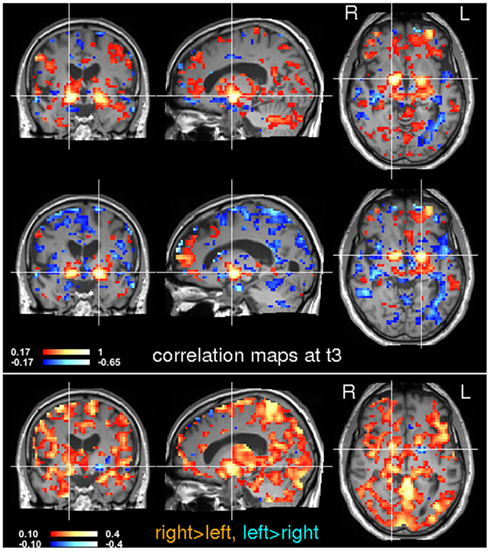
Figure 8. Seed-based correlation analysis at time t3. Voxels in the left and right globus pallidus were used for a subsequent seed-based correlation analysis. The location of the seeds is indicated by the crosshairs. Inter-hemispheric differences are shown in the bottom image. Note that the right globus pallidus generally shows stronger correlations than the left.
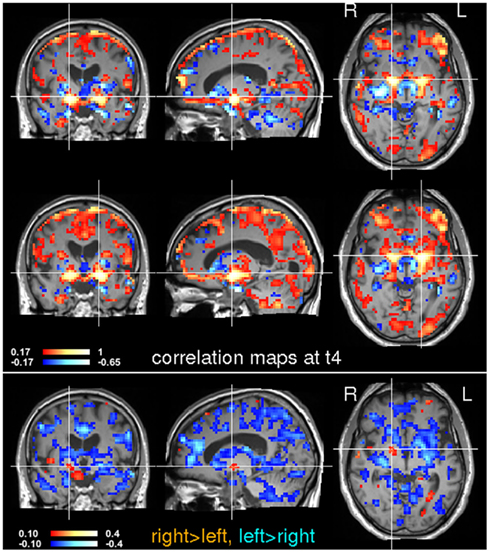
Figure 9. Seed-based correlation analysis at time t4. Voxels in the left and right globus pallidus were used for a subsequent seed-based correlation analysis. The location of the seeds is indicated by the crosshairs. Note that inter-hemispheric differences have changed noticeably between t3 and t4 (see Figure 8).
Discussion
In this study, we have introduced a new algorithm called connectivity concordance mapping (CCM) for model-free analysis of fMRI data. CCM computes the voxel-wise concordance of fMRI time courses and can be applied to regions-of-interest as large as the whole brain. One should note that Kendall’s W may be biased by underlying correlations within brain structures. As a result, it is possible that Kendall’s W may differ between two brain regions, although the underlying correlational structure within each respective region remains identical. Therefore, CCM should be used only as a method for generating hypotheses to be further explored and validated in subsequent processing steps such as seed-based correlation analyses.
We implemented CCM on resting state data in healthy subjects in different functional states. Our main finding is that CCM can differentiate between different functional states. A comparison between Kendall’s W and OCCC as measures of concordance did not show major differences. However, since OCCC presupposes Gaussianity of the data, we suggest to use Kendall’s W because it is applicable to a wider range of cases.
The investigation of state-dependent (eyes-opened/closed) differences using CCM implicated primary visual cortex, revealing within-subject concordance contrasts throughout the cuneus. Such a finding offers strong support to the functional significance of CCM. Previous studies have investigated the impact of eyes-opened and eyes-closed states on resting state functional connectivity results (McAvoy et al., 2008; Van Dijk et al., 2010). Our current results independently replicated the findings of McAvoy et al. (2008), who initially demonstrated that the functional connectivity of the visual cortex was altered in the eyes-closed condition, and that its spectral density in low-frequencies was higher. Likewise, Van Dijk et al. (2010) found that the eyes-closed condition demonstrated diminished functional connectivity in the default mode and attention networks, when compared to eyes-opened or eyes-opened with fixation. While our findings are not novel contributions to the understanding of the network differences between these two task conditions, our aim was rather to demonstrate how the methodology employed here could detect these same differences without any a priori assumptions about what areas were involved. Such a voxel-wise approach provides a powerful exploratory tool for investigating more complex, and less well understood state-related differences.
One should note that inter-subject CCMs may be confounded by anatomical variability because concordance may be lower in areas of high anatomical variance. This is not a concern for longitudinal data as such the one reported in experiment 2 because here we used only one single subject (the stroke patient). In experiment 1 however, it may have influenced the results. Anatomical variability is a very general problem not restricted to CCM that affects all group studies including task-based designs analyzed by the standard general linear model (GLM). Inter-subject alignment procedures can alleviate (but not solve) the problem to some extent.
Longitudinal studies are one of the most relevant areas of application of the CCM approach and may be used to explore clinical data. In the exploratory CCM analysis of a patient following stroke, we found that CCM can be used to provide insight into the dynamics of functional connectivity changes over the course of recovery. It can also serve a basis for subsequent seed-based analysis. In the present case study, we found inter-hemispheric differences in correlation with left and right globus pallidus between times t3 and t4 (day 94 and day 199). This effect was picked up by CCM so that globus pallidus appeared as a local minimum in the CCM maps. Globus pallidus is part of the extrapyramidal motor system which was effected by the thalamic stroke in this patient. The CCM analysis suggests that recovery after stroke involved this system.
We should note however that this finding is quite preliminary. The purpose of the present experiment was to provide a “proof of concept” for the use of CCM as a tool for monitoring recovery after stroke as a test case for similar clinical applications. A more careful interpretation of our results will follow in subsequent studies. In particular, since functional connectivity and behavior has been shown to correlate after stroke (He et al., 2007; Warren et al., 2009; Carter et al., 2010; Wang et al., 2010), in order to interpret the impact of our results on the recovery process, additional behavioral information must be included. For a detailed review on connectivity related changes following stroke see Grefkes and Fink (2011).
While further research is necessary to elucidate the significance of such results, the corroboration of similar findings using our exploratory methods supports further application of CCM to more complex state differences. Possible future applications may be clinically oriented, exploring dynamics of recovery as well as assessing impact of different treatment interventions on changes in functional connectivity.
Conflict of Interest Statement
The authors declare that the research was conducted in the absence of any commercial or financial relationships that could be construed as a potential conflict of interest.
Acknowledgments
The authors would like to thank Dr. med. Kersten Villringer, University Clinic Charite, Berlin, Germany.
References
Barnhart, H., Haber, M., and Song, J. (2002). Overall concordance correlation coefficient for evaluating agreement among multiple observers. Biometrics 58, 1020–1027.
Beckmann, C., DeLuca, M., Devlin, J., and Smith, S. (2005). Investigations into resting-state connectivity using independent component analysis. Philos. Trans. R. Soc. Lond. B Biol. Sci. 360, 1001–1013.
Biswal, B., Mennes, M., Zuo, X. N., Gohel, S., Kelly, C., Smith, S. M., Beckmann, C. F., Adelstein, J. S., Buckner, R. L., Colcombe, S., Dogonowski, A. M., Ernst, M., Fair, D., Hampson, M., Hoptman, M. J., Hyde, J. S., Kiviniemi, V. J., Kötter, R., Li, S. J., Lin, C. P., Lowe, M. J., Mackay, C., Madden, D. J., Madsen, K. H., Margulies, D. S., Mayberg, H. S., McMahon, K., Monk, C. S., Mostofsky, S. H., Nagel, B. J., Pekar, J. J., Peltier, S. J., Petersen, S. E., Riedl, V., Rombouts, S. A., Rypma, B., Schlaggar, B. L., Schmidt, S., Seidler, R. D., Siegle, G. J., Sorg, C., Teng, G. J., Veijola, J., Villringer, A., Walter, M., Wang, L., Weng, X. C., Whitfield-Gabrieli, S., Williamson, P., Windischberger, C., Zang, Y. F., Zhang, H. Y., Castellanos, F. X., and Milham, M. P. (2010). Toward discovery science of human brain function. Proc. Natl. Acad. Sci. U.S.A. 107, 4734–4739.
Biswal, B., Yetkin, F., Haughton, V., and Hyde, J. (1995). Functional connectivity in the motor cortex of resting human brain using echo-planar MRI. Magn. Reson. Med. 34, 537–541.
Buckner, R. (2010). Human functional connectivity: new tools, unresolved questions. Proc. Natl. Acad. Sci. U.S.A. 107, 10769–10770.
Bullmore, E., and Sporns, O. (2009). Complex brain networks: graph theoretical analysis of structural and functional systems. Nat. Rev. Neurosci. 10, 186–198.
Carter, A., Astafiev, S., Lang, C., Connor, L., Rengachary, J., Strube, M., Pope, D., Shulman, G., and Corbetta, M. (2010). Resting interhemispheric functional magnetic resonance imaging connectivity predicts performance after stroke. Ann. Neurol. 67, 365–375.
Cole, D., Smith, S., and Beckmann, C. (2010). Advances and pitfalls in the analysis and interpretation of resting-state fMRI data. Front. Syst. Neurosci. 4:8. doi:10.3389/fnsys.2010.00008
Craddock, R., James, G., Holtzheimer, P., Hu, X., and Mayberg, H. (2011). A whole brain fMRI atlas generated via spatially constrained spectral clustering. Hum. Brain Mapp. doi:10.1002/hbm.21333. [Epub ahead of print].
Damoiseaux, J., Rombouts, S., Barkhof, F., Scheltens, P., Stam, C., Smith, S., and Beckmann, C. (2006). Consistent resting-state networks across healthy subjects. Proc. Natl. Acad. Sci. U.S.A. 103, 13848–13853.
De Luca, M., Beckmann, C., De Stefano, N., Matthews, P., and Smith, S. (2006). fMRI resting state networks define distinct modes of long-distance interactions in the human brain. Neuroimage 29, 1359–1367.
Fox, M., Corbetta, M., Snyder, A., Vincent, J., and Raichle, M. (2006). Spontaneous neuronal activity distinguishes human dorsal and ventral attention systems. Proc. Natl. Acad. Sci. U.S.A. 103, 10046–10051.
Fox, M., and Greicius, M. (2010). Clinical applications of resting state functional connectivity. Front. Syst. Neurosci. 4:19. doi:10.3389/fnsys.2010.000192008
Grefkes, C., and Fink, G. (2011). Reorganization of cerebral networks after stroke: new insights from neuroimaging with connectivity approaches. Brain 134, 1264–1276.
Gusnard, D., Akbudak, E., Shulman, G., and Raichle, M. (2001). Medial prefrontal cortex and self-referential mental activity: relation to a default mode of brain function. Proc. Natl. Acad. Sci. U.S.A. 98, 4259–4264.
Hasson, U., Malach, R., and Heeger, D. (2009). Reliability of cortical activity during natural stimulation. Trends Cogn. Sci. (Regul. Ed.) 14, 40–47.
He, B., Snyder, A., Vincent, J., Epstein, A., Shulman, G., and Corbetta, M. (2007). Breakdown of functional connectivity in frontoparietal networks underlies behavioral deficits in spatial neglect. Neuron 53, 905–918.
Kendall, M., and Babington Smith, B. (1939). The problem of m rankings. Ann. Math. Stat. 10, 275–287.
Lange, N., Strother, S., Anderson, J., Nielsen, F., Holmes, A., Kolenda, T., Savoy, R., and Hansen, L. K. (1999). Plurality and resemblance in fMRI data analysis. Neuroimage 10, 282–303.
Legendre, P. (2005). Species associations: the Kendall coefficient of concordance revisited. J. Agric. Biol. Environ. Stat. 10, 226–245.
Lin, L. (1989). A concordance correlation coefficient to evaluate reproducibility. Biometrics 45, 255–268.
Liu, D., Yan, C., Ren, J., Yao, L., Kiviniemi, V., and Zang, Y. (2010). Using coherence to measure regional homogeneity of resting state fMRI signal. Front. Syst. Neurosci. 4:24.doi:10.3389/fnsys.2010.00024
Lohmann, G., Margulies, D., Horstmann, A., Pleger, B., Lepsien, J., Goldhahn, D., Schloegl, H., Stumvoll, M., Villringer, A., and Turner, R. (2010). Eigenvector centrality mapping for analyzing connectivity patterns in fMRI data of the human brain. PLoS ONE 5, e10232. doi:10.1371/journal.pone.0010232
Lohmann, G., Müller, K., Bosch, V., Mentzel, H., Hessler, S., Chen, L., Zysset, S., and von Cramon, D. Y. (2001). LIPSIA – a new software system for the evaluation of functional magnetic resonance images of the human brain. Comput. Med. Imaging Graph. 25, 449–457.
Margulies, D., Böttger, J., Long, X., Lv, Y., Kelly, C., Schäfer, A., Goldhahn, D., Abbushi, A., Milham, M., Lohmann, G., and Villringer, A. (2010). Resting developments: a review of fMRI post-processing methodologies for spontaneous brain activity. MAGMA 23, 289–307.
Margulies, D., Kelly, A., Uddin, L., Biswal, B., Castellanos, F., and Milham, M. (2007). Mapping the functional connectivity of anterior cingulate cortex. Neuroimage 37, 579–588.
McAvoy, M., Larson-Prior, L., Nolan, T., Vaishnavi, S., Raichle, M., and d’Avossa, G. (2008). Resting states affect spontaneous bold oscillations in sensory and paralimbic cortex. J. Neurophysiol. 100, 922–931.
Shehzad, Z., Kelly, C., Reiss, P., Gee, D., Gotimer, K., Uddin, L. Q., Lee, S. H., Margulies, D. S., Roy, A. K., Biswal, B. B., Petkova, E., Castellanos, F. X., and Milham, M. P. (2009). The resting brain: unconstrained yet reliable. Cereb. Cortex 19, 2209–2229.
Shehzad, Z., Reiss, P., Adelstein, J., Emerson, J., Chabernaud, C., Mennes, M., Di Martino, A., Kelly, C., Castellanos, F., and Milham, M. (2011). “Connectome-wide association studies (CWAS): a multivariate distance-based approach,” in Annual Meeting of the Organization for Human Brain Mapping, Quebec, CA.
Shrout, P., and Fleiss, J. (1979). Intraclass correlation: uses in assessing rater reliability. Psychol. Bull. 86, 420–428.
Smith, S., Fox, P., Miller, K., Glahn, D., Fox, P., Mackay, C., Filippini, N., Watkins, K., Toro, R., Laird, A., and Beckmann, C. (2009). Correspondence of the brain’s functional architecture during activation and rest. Proc. Natl. Acad. Sci. U.S.A. 106, 13040–13045.
Tzourio-Mazoyer, N., Landeau, B., Papathanassiou, D., Crivello, F., Etard, O., Delcroix, N., Mazoyer, B., and Joliot, M. (2002). Automated anatomical labeling of activations in SPM using a macroscopic anatomical parcellation of the MNI MRI single-subject brain. Neuroimage 15, 273–289.
Van Dijk, K., Hedden, T., Venkataraman, A., Evans, K., Lazar, S., and Buckner, R. (2010). Intrinsic functional connectivity as a tool for human connectomics: theory, properties, and optimization. J. Neurophysiol. 103, 297–321.
Wang, L., Yu, C., Chen, H., Qin, W., He, Y., Fan, F., Zhang, Y., Wang, M., Li, K., Zang, Y., Woodward, T., and Zhu, C. (2010). Dynamic functional reorganization of the motor execution network after stroke. Brain 133, 1224–1238.
Warren, J., Crinion, J., Lambon Ralph, M., and Wise, R. (2009). Anterior temporal lobe connectivity correlates with functional outcome after aphasic stroke. Brain 132, 3428–3442.
Zang, Y., Jiang, T., Lu, Y., He, Y., and Tian, L. (2004). Regional homogeneity approach to fMRI data analysis. Neuroimage 22, 394–400.
Appendix
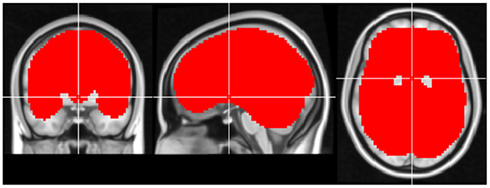
Figure A1. Region-of-interest used for CCM analysis in experiment 1. The crosshair is located in MNI coordinates (0, 0, 0).
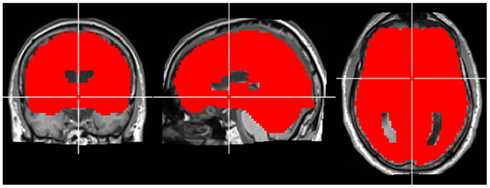
Figure A2. Region-of-interest used for CCM analysis in experiment 2. The crosshair is located in MNI coordinates (0, 0, 0).
Keywords: connectivity, resting state
Citation: Lohmann G, Ovadia-Caro S, Jungehülsing GJ, Margulies DS, Villringer A and Turner R (2012) Connectivity concordance mapping: a new tool for model-free analysis of fMRI data of the human brain. Front. Syst. Neurosci. 6:13. doi: 10.3389/fnsys.2012.00013
Received: 15 November 2011; Paper pending published: 20 December 2011;
Accepted: 29 February 2012; Published online: 20 March 2012.
Edited by:
Per E. Roland, Karolinska Institute, SwedenReviewed by:
Stefano Panzeri, Italian Institute of Technology, ItalyAnders Ledberg, Universitat Pompeu Fabra, Spain
Copyright: © 2012 Lohmann, Ovadia-Caro, Jungehülsing, Margulies, Villringer and Turner. This is an open-access article distributed under the terms of the Creative Commons Attribution Non Commercial License, which permits non-commercial use, distribution, and reproduction in other forums, provided the original authors and source are credited.
*Correspondence: Gabriele Lohmann, Max Planck Institute for Human Cognitive and Brain Sciences, Stephanstr. 1a, 04103 Leipzig, Germany. e-mail: lohmann@cbs.mpg.de