Online monitoring the hydrolysis of uranium hexafluoride for intermediates by cryogenic layering and FTIR
 Louis E. McNamara
 John T. Kelly*†
 - Savannah River National Laboratory, Aiken, SC, United States
Uranium hexafluoride (UF6) is a commonly utilized material feedstock in uranium enrichment processes due to its high vapor pressure and ease of sublimation. When exposed to air, UF6 undergoes spontaneous hydrolysis to form uranyl fluoride (UO2F2) particulates which are utilized for the detection of undeclared nuclear activities by nuclear safeguards organizations. The kinetics of the hydrolysis reaction and how they relate to particle morphology of the product are still debated in the literature. Here, we report the direct, in situ observation of UF6 reaction intermediates by cooling the reaction to cryogenic temperatures to significantly reduce the rate of hydrolysis. The reaction is then observable by Fourier transform infrared (FTIR) spectroscopy. The conversion of UF6 to UOF4 is observed as well as several other bands associated with possible long lived intermediate complexes. Chemometrics are used to further elucidate the reaction pathway from UF6 to UO2F2.
1 Introduction
In the 1980s, the Oak Ridge Gaseous Diffusion Plant conducted several characterization experiments on the spontaneous reaction of uranium hexafluoride (UF6) hydrolysis in a controlled environment (Bostick et al., 1983; Pickrell, 1984; Bostick et al., 1985; Pickrell, 1985). These studies show a correlation between physical features observed in the aerosol, the relative humidity, and the temperature of the UF6 at the time of release. This phenomenon, observed over 40 years ago, has yet to be fully understood and plays a key role in nuclear forensics and safeguards. There is consensus across the scientific literature that the simplified reaction:
can be used to describe the hydrolysis of UF6 with products of hydrofluoric acid and uranyl fluoride (UO2F2). Armstrong, Bostick, and Fletcher isolated the product of hydrolysis, UO2F2, and assigned the observed features in the IR spectrum (Armstrong et al., 1991). Sherrow and Hunt published a seminal spectroscopic study where they observed the formation of UOF4 by co-condensing water and UF6 in an argon matrix then initiating the hydrolysis reaction by photolysis (Sherrow and Hunt, 1992). Over the next several decades, multiple computational studies were published suggesting a UF5OH intermediate is more favorable than UOF4 (Garrison and Becnel, 2008; Hu et al., 2008; 2009; Lind et al., 2010; Hu et al., 2014; Lutz et al., 2022). Experimentalists have continued to attempt to elucidate the kinetics and identify intermediate compounds formed during the hydrolysis reaction, but the mechanism behind UF6 hydrolysis remains heavily debated in the literature (Paine et al., 1975; Klimov et al., 1992; Kips et al., 2007; Wagner et al., 2015; Richards et al., 2020; Pastoor et al., 2021). To date, there has been no experimental evidence for the formation of UF5OH and no in situ observations of any intermediate formation during the UF6 hydrolysis reaction.
Here, we demonstrate the ability to monitor the generation of reaction intermediates by cryogenic layering. We explore the hydrolysis of UF6 through temperature dependent infrared spectroscopy based on methods recently developed to better understand the hydrolysis of molybdenum hexafluoride (MoF6) (McNamara et al., 2023). By layering the reactant at cryogenic temperatures, the hydrolysis reaction is effectively halted until the sample layers are warmed sufficiently to overcome the activation barrier of each step in the hydrolysis reaction. Continuous monitoring of the sample layers by FTIR allows for the direct, in situ, observation of intermediates forming and being consumed as the reaction progresses. The data presented here is the initial findings from applying this technique to UF6.
2 Methods
The experimental design has been previously reported for studies of MoF6 hydrolysis (McNamara et al., 2023). In brief, a Jasco FT-IR 6300 (Jasco Inc, Easton, MD, USA) was employed for the acquisition of infrared spectra. To control the initiation of the hydrolytic reaction, the UF6 and water vapor were cryogenically condensed under vacuum by means of a helium cryostat (Janis Research, VPF Series). The cryogenic layers were held under a vacuum of 100 mTorr (13 Pa) during the duration of the entire experiment. The cell was constructed with 2-inch diameter uncoated zinc selenide windows (Edmund Optics, ZC-W-50-2) with a thin polished polycrystalline diamond window for cryogenic layering (Ap-plied Diamond, Inc., 18 mm diameter, 150 microns thin). The cell was brought under vacuum (Edwards Oil-Free Scroll Pump) to evacuate air and water vapor prior to and while achieving cryogenic conditions. A scan was taken periodically with a 2 cm−1 resolution, 8 averages, and a 500 to 5,000 cm−1 spectral range while the cell warmed to room temperature.
3 Results
The final product of the reaction aligns well with previously reported IR spectra of uranyl fluorides. A strong absorption band at 940 cm−1 is observed which is attributed to U-O stretching of UO2F2. Two distinct bands around 1,700 cm−1 and a broad absorption band from 2,500–3,500 cm−1 are observed, which are attributed to UO2F2…xH2O…yHF complexes. The resulting product is spectroscopically identical to the product observed by Armstrong et al., suggesting we have formed the same final product despite the reaction being performed in the condensed phase.
From time zero, it takes roughly 10 min for the layered reactants to warm enough to initiate the reaction. No temperature data could be recorded for these experiments, but temperatures have been estimated based on temperature data from previous experiments: time zero ∼ 10 K, after 30 min. ∼ 180 K, after 60 min. ∼ 240 K, after 72 min. ∼ 250 K. Based on the 100 mTorr pressure of the chamber and the phase diagrams of pure water and UF6, it seems likely the reaction progressed primarily in the solid state with excess H2O and UF6 sublimating away near the 60 min. (240 K) point. Figure 1 summarizes the observed spectroscopic signals during the reaction in the 700–1,000 cm−1 region. Initially, the intensity of the bands associated with UF6 from 590–630 cm−1 and the ice libration band at 850 cm−1 are observed to be decreasing while a much narrower peak at 850 cm−1 begins to grow. The growth of the feature at 850 cm−1 is quickly followed by the formation of a band at 930 cm−1. Next, three smaller bands at 715, 780, and 815 cm−1 appear while the bands at 850 cm−1 and 930 cm−1 blue shift. Finally, all bands in this region disappear except for the strong band at 940 cm−1 and small band at 865 cm−1 which are associated with the product.
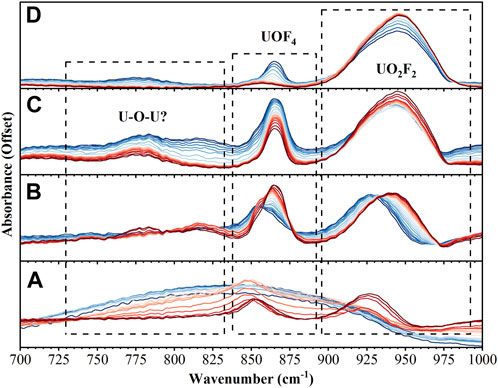
FIGURE 1. FTIR spectra from 700–1,000 cm−1 over 4 different time intervals: (A) 0–30 min (B) 31–40 min (C) 41–60 min (D) 61–72 min. Spectra in dark blue are the earliest while dark red represents the last spectra in that time interval.
The region between 1,000–4,000 cm−1 also shows significant changes during the reaction, Figure 2. As the reaction proceeds a broad continuum of absorption bands from 1,000–3,500 cm−1 is observed. This continuum is indicative of an aqueous proton network and depletes as the final product is formed. Before the reaction is initiated, the strong absorption due to OH stretching of amorphous solid water is observed at 3,250 cm−1. As the reaction proceeds five distinct bands are observed to shift, increase in intensity, and decrease in intensity over the duration of the experiment: 1,200 cm−1, 1,500 cm−1, 1700 cm−1, 2,200 cm−1, and 2,650 cm−1. The bands at 1,200 cm−1, 1,700 cm−1, and 2,650 cm−1, have been observed in cryogenic mixtures of HF with water and their intensities are reported as directly proportional to HF concentration (Ayotte et al., 2005; Ayotte et al., 2008; Iftimie et al., 2008). By the end of the experiment, the only bands that remain are associated with the UO2F2 product.
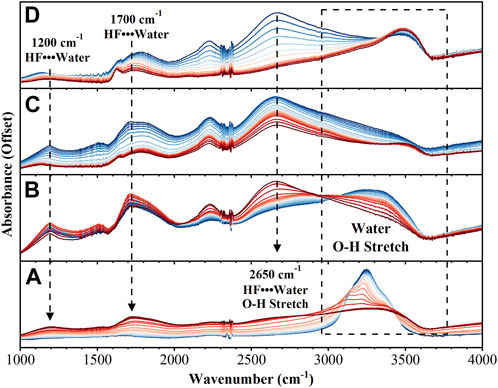
FIGURE 2. FTIR spectra from 1,000–4,000 cm−1 over 4 different time intervals: (A) 0–30 min (B) 31–40 min (C) 41–60 min (D) 61–72 min. Spectra in dark blue are the earliest while dark red represents the last spectra in that time interval.
4 Discussion
Figure 3 shows the spectral range between 500 and 700 cm−1, which has been characterized here as the reactant region in which the UF6 antisymmetric stretching mode is centered at 624 cm−1; however, a more dominant feature is observed at 590 cm−1 during the initial cryogenic conditions. Modes in this region have previously been attributed to free UF5 and also to UF6 complexes with water (Sherrow and Hunt, 1992). Neither of these assignments seems likely here as the feature does not resemble previously reported spectra of UF5 and is observed even before the addition of water (Kim et al., 2008; Krohn et al., 2008; Paine et al., 2008). Sherrow and Hunt also observed the formation of a broad absorption band centered at 550 cm−1 when co-depositing UF6 and water, which they attributed to the initial formation of UF6…xH2O complexes and is not observed here (Sherrow and Hunt, 1992). We are attributing the feature at 590 cm−1, and the smaller feature at 610 cm−1, to cryogenic UF6 as we observed a similar red shifted band in cryogenic layers of MoF6 (McNamara et al., 2023). As the layers warm and the reaction proceeds, these two features give way to the expected UF6 absorption profile.
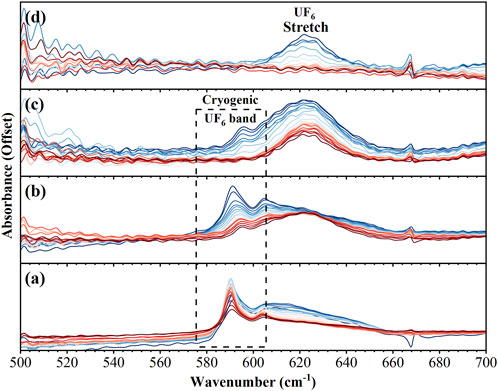
FIGURE 3. FTIR spectra from 500–700 cm−1 over 4 different time intervals: (A) 0–30 min (B) 31–40 min (C) 41–60 min (D) 61–72 min. Spectra in dark blue are the earliest while dark red represents the last spectra in that time interval.
The spectral region between 700 and 1,000 cm−1 is comprised of transient intermediate species and product (UO2F2). The spectral region between 1,000 and 3,800 cm−1 holds a rich dynamic signature of proton transfer processes that have been attributed to the fluoride-hydronium ion pair. The intermediate relationship of the negative fluoride ion and the positive hydronium ion has been described by Giguère and Turrell (1976) and Giguere and Turrell (1980). The canonical OH stretching region expresses a red-shifting progression to a continuous absorption from 3,800 cm−1 to 2000 cm−1. This is a well-characterized signature of proton transfer but is more obvious in the dissolution of hydrofluoric acid (Cabarcos et al., 1999; Ayotte et al., 2000; Ayotte et al., 2005; Ayotte et al., 2008; Iftimie et al., 2008).
Figure 4 shows peak fits for the spectral features observed between 700 and 1,000 cm−1 where m) is the initial spectrum of the reactants and a) is the spectrum of the final product. The features observed for the product display two major components centered at 955 cm−1 and 933 cm−1 (labelled as a1 and a2) and a minor feature at 857 cm−1 (a3). The minor feature at 857 cm−1 overlaps spectrally with the intermediate features in this region but can be observed in the final product. While the origin of the features can be attributed to the presence of UO2F2 with the crystalline environment of residual water and hydrofluoric acid, the temporal onset to these features may provide a mechanistic understanding of to the a1, a2, and a3 origins. Three features are observed most clearly at the end of hydrolysis; however, a1 and a3 have significant changes in intensity across the temperature dependent spectra. These features are likely the result of multiple uranyl ions being present in the aqueous environment. UO2+, (UO2)2OH22+, and (UO2)3OH5+ have previously been assigned to features of aqueous uranyl compounds in this region (Quilès and Burneau, 1998).
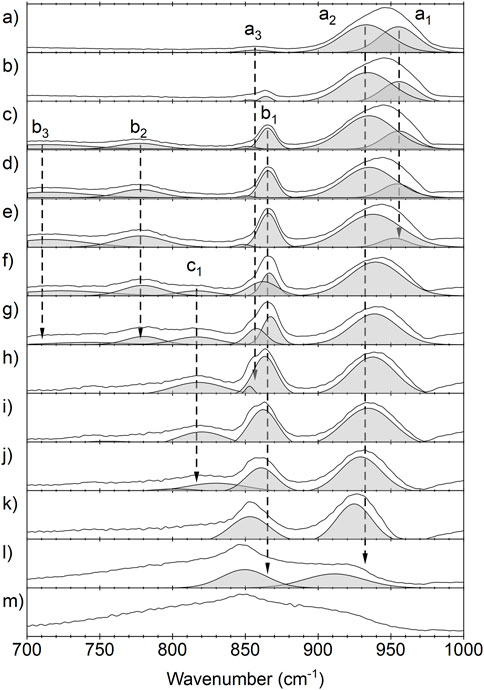
FIGURE 4. Temperature dependent infrared spectra of the uranium hexafluoride hydrolysis and the formation of uranyl fluoride in the spectral range of 700–1,000 cm−1. m) is the initial spectrum of the reactants and a) is the final product. a1 = 955 cm−1, a2 = 933 cm−1, and a3 = 857 cm−1 represent bands associated with the final product. b1 = 865 cm−1, b2 = 780 cm−1, b3 = 715 cm−1, and c1 = 815 cm−1 represent bands associated with intermediate complexes.
The spectral features of UOF4, assigned at 868 cm−1 and 857 cm−1 by Sherrow and Hunt, are observed as intermediate complexes (Sherrow and Hunt, 1992). The feature labeled b1 in Figure 3C is centered at 865 cm−1 and expressed a strong spectral signature throughout hydrolysis. The feature is first observed immediately upon hydration of UF6 but redshifts ∼10 cm-1 and becomes more dominant in the infrared spectrum as water reacts and is later evaporated from the matrix. The two bands around 860 cm−1 were previously observed and attributed to the axial and equatorial isomers of the UOF4. Interestingly, the doublet was previously observed at a 50/50 ratio while we are observing a clear shift from one isomer to another. This shift between the isomers is attributed to the kinetically more favorable formation of one isomer followed by the conversion to the more thermodynamically favorable isomer. Since the experiment takes place in the condensed phase, intermediate and product compounds are likely complexed with HF and water. The frequencies of these compounds will be affected by both the temperature of the film and the relative abundance of HF and water in the observed aqueous proton network. The resolution of the current experiment does not allow the different possible complexes to be easily distinguished from one another.
During the intermediate reaction stage, a band at 815 cm−1 is observed to grow and then deplete while two other bands at 715 cm−1 and 780 cm−1 grow. These two new bands, the UOF4 stretching mode at 865 cm−1, and the remaining UF6 then all deplete simultaneously as the final product continues to form. The new band observed at 815 cm−1 seems to be correlated with the conversion between the two UOF4 isomers as it is depleted by the time the 865 cm−1 component of the UOF4 band has reached its maximum intensity. The bands at 715 cm−1 and 780 cm−1 do not appear to depend on the formation of any other new bands in the spectrum but do deplete alongside the remaining UF6 and UOF4 bands. These two bands may be attributed to a previously unobserved intermediate complex. The region from 700 to 800 cm−1 is indicative of U-O-U bridging compounds. This region lines up well with several computationally predicted intermediates with U-O-U bonds (Hu et al., 2008; 2009; Lind et al., 2010; Lutz et al., 2022); however, these bridged compounds are typically predicted to have formed through UF5OH intermediates which there is not strong evidence of in this experiment. Other possibilities are U2O3F6 and U3O5F8, which have been shown to form as intermediates with sub-stochiometric mixtures of water and UF6, though their IR spectra are not well documented (Otey and LeDoux, 1967). PCA was performed on the data set and the results support the previous discussion, see Supplementary Material for more detail.
The observations from this experiment support previous claims that UF6 hydrolysis is composed of two half reactions with a UOF4 intermediate:
In excess water, the final product is a hydrate of the form: UO2F2…xH2O. The formation of the three previously unobserved bands at 715 cm−1, 780 cm−1, and 815 cm−1 suggest the formation of bridged O-U-O intermediates which can directly convert to UO2F2. These preliminary results show promise for this technique to further elucidate the chemistry governing UF6 hydrolysis by varying reactant isotopologues and employing other spectroscopic techniques.
Data availability statement
The original contributions presented in the study are included in the article/Supplementary Material, further inquiries can be directed to the corresponding authors.
Author contributions
LM: Conceptualization, Data curation, Formal Analysis, Investigation, Methodology, Visualization, Writing–original draft, Writing–review and editing. JK: Data curation, Formal Analysis, Writing–original draft, Writing–review and editing. AW: Conceptualization, Investigation, Methodology, Writing–review and editing. EV-A: Conceptualization, Funding acquisition, Project administration, Resources, Supervision, Writing–review and editing. KS: Funding acquisition, Resources, Supervision, Writing–review and editing.
Funding
The author(s) declare financial support was received for the research, authorship, and/or publication of this article. Financial support for this work was provided by the National Nuclear Security Administration under Defense Nuclear Nonproliferation R&D.
Acknowledgments
This work was produced by Battelle Savannah River Alliance, LLC under Contract No. 89303321CEM000080 with the US Department of Energy. Publisher acknowledges the US Government license to provide public access under the DOE Public Access Plan (http://energy.gov/downloads/doe-public-access-plan). Assistance from Jason Richards at ORNL for UF6 expertise and samples is greatly appreciated.
Conflict of interest
The authors declare that the research was conducted in the absence of any commercial or financial relationships that could be construed as a potential conflict of interest.
Publisher’s note
All claims expressed in this article are solely those of the authors and do not necessarily represent those of their affiliated organizations, or those of the publisher, the editors and the reviewers. Any product that may be evaluated in this article, or claim that may be made by its manufacturer, is not guaranteed or endorsed by the publisher.
Supplementary material
The Supplementary Material for this article can be found online at: https://www.frontiersin.org/articles/10.3389/fnuen.2023.1300544/full#supplementary-material
References
Armstrong, D. P., Bostick, W. D., and Fletcher, W. H. (1991). An FT-IR study of the atmospheric hydrolysis of uranium hexafluoride. Appl. Spectrosc. 45 (6), 1008–1016. doi:10.1366/0003702914336381
Ayotte, P., Hébert, M., and Marchand, P. (2005). Why is hydrofluoric acid a weak acid? J. Chem. Phys. 123 (18), 184501. doi:10.1063/1.2090259
Ayotte, P., Kelley, J. A., Nielsen, S. B., and Johnson, M. A. (2000). Vibrational spectroscopy of the F−·H2O complex via argon predissociation: photoinduced, intracluster proton transfer? Chem. Phys. Lett. 316 (5), 455–459. doi:10.1016/s0009-2614(99)01257-9
Ayotte, P., Plessis, S., and Marchand, P. (2008). Trapping proton transfer intermediates in the disordered hydrogen-bonded network of cryogenic hydrofluoric acid solutions. Phys. Chem. Chem. Phys. 10 (32), 4785–4792. doi:10.1039/b806654j
Bostick, W. D., McCulla, W. H., and Pickrell, P. W. (1985). Sampling, characterization, and remote sensing of aerosols formed in the atmospheric hydrolysis of uranium hexafluoride. J. Environ. Sci. Health . Part A Environ. Sci. Eng. 20 (3), 369–393. doi:10.1080/10934528509375230
Bostick, W. D., McCulla, W. H., Pickrell, P. W., and Branam, D. A. (1983). Sampling and characterization of aerosols formed in the atmospheric hydrolysis of UF6. United States.
Cabarcos, O. M., Weinheimer, C. J., Lisy, J. M., and Xantheas, S. S. (1999). Microscopic hydration of the fluoride anion. J. Chem. Phys. 110 (1), 5–8. doi:10.1063/1.478075
Garrison, S. L., and Becnel, J. M. (2008). Transition state for the gas-phase reaction of uranium hexafluoride with water. J. Phys. Chem. A 112 (24), 5453–5457. doi:10.1021/jp801524v
Giguère, P. A., and Turrell, S. (1976). H3O+ ions in aqueous acid solutions. The infrared spectra revisited. Can. J. Chem. 54 (21), 3477–3482. doi:10.1139/v76-499
Giguere, P. A., and Turrell, S. (1980). The nature of hydrofluoric acid. A spectroscopic study of the proton-transfer complex H3O+⋅⋅⋅F-. J. Am. Chem. Soc. 102 (17), 5473–5477. doi:10.1021/ja00537a008
Hu, S.-W., Lin, H., Wang, X.-Y., and Chu, T.-W. (2014). Effect of H2O on the hydrolysis of UF6 in the gas phase. J. Mol. Struct. 1062, 29–34. doi:10.1016/j.molstruc.2014.01.015
Hu, S.-W., Wang, X.-Y., Chu, T.-W., and Liu, X.-Q. (2008). Theoretical mechanism study of UF6 hydrolysis in the gas phase. J. Phys. Chem. A 112 (37), 8877–8883. doi:10.1021/jp804797a
Hu, S.-W., Wang, X.-Y., Chu, T.-W., and Liu, X.-Q. (2009). Theoretical mechanism study of UF6 hydrolysis in the gas phase (II). J. Phys. Chem. A 113 (32), 9243–9248. doi:10.1021/jp904655w
Iftimie, R., Thomas, V., Plessis, S., Marchand, P., and Ayotte, P. (2008). Spectral signatures and molecular origin of acid dissociation intermediates. J. Am. Chem. Soc. 130 (18), 5901–5907. doi:10.1021/ja077846o
Kim, K. C., Reisfeld, M., and Seitz, D. (2008). Laser photolysis of UF6: reactions of the transient UF5 molecules. J. Chem. Phys. 73 (11), 5605–5610. doi:10.1063/1.440081
Kips, R., Leenaers, A., Tamborini, G., Betti, M., Van den Berghe, S., Wellum, R., et al. (2007). Characterization of uranium particles produced by hydrolysis of UF6 using SEM and SIMS. Microsc. Microanal. 13 (3), 156–164. doi:10.1017/s1431927607070341
Klimov, V. D., Kravetz, Y. M., and Besmelnitzin, A. V. (1992). Investigation of uranium hexafluoride hydrolysis kinetics by laser HF analyzer. J. Fluor. Chem. 58 (2), 262. doi:10.1016/s0022-1139(00)80715-0
Krohn, B. J., Person, W. B., and Overend, J. (2008). The predicted infrared spectrum and the structure of the isolated UF5 molecule. J. Chem. Phys. 65 (3), 969–976. doi:10.1063/1.433169
Lind, M. C., Garrison, S. L., and Becnel, J. M. (2010). Trimolecular reactions of uranium hexafluoride with water. J. Phys. Chem. A 114 (13), 4641–4646. doi:10.1021/jp909368g
Lutz, J. J., Byrd, J. N., Lotrich, V. F., Jensen, D. S., Zádor, J., and Hubbard, J. A. (2022). A theoretical investigation of the hydrolysis of uranium hexafluoride: the initiation mechanism and vibrational spectroscopy. Phys. Chem. Chem. Phys. 24 (16), 9634–9647. doi:10.1039/d1cp05268c
McNamara, L., Waldron, A., Thomas, M., Jones, W., O’Rourke, P., Darrell, S., et al. (2023). Investigating the hydrolysis of cryogenically layered molybdenum hexafluoride through a disordered hydrogen-bonded network. Phys. Chem. Chem. Phys. 25 (4), 2990–2998. doi:10.1039/d2cp04147b
Otey, M. G., and LeDoux, R. A. (1967). U3O5F8—a new compound in the U-O-F system. J. Inorg. Nucl. Chem. 29 (9), 2249–2256. doi:10.1016/0022-1902(67)80279-3
Paine, R. T., McDowell, R. S., Asprey, L. B., and Jones, L. H. (2008). Vibrational spectroscopy of matrix-isolated UF6 and UF5. J. Chem. Phys. 64 (7), 3081–3083. doi:10.1063/1.432574
Paine, R. T., Ryan, R. R., and Asprey, L. B. (1975). Synthesis, characterization, and structure of uranium oxide tetrafluoride. Inorg. Chem. 14 (5), 1113–1117. doi:10.1021/ic50147a031
Pastoor, K. J., Kemp, R. S., Jensen, M. P., and Shafer, J. C. (2021). Progress in uranium chemistry: driving advances in front-end nuclear fuel cycle forensics. Inorg. Chem. 60 (12), 8347–8367. doi:10.1021/acs.inorgchem.0c03390
Pickrell, P. W. (1984). Characterization of the solid, airborne materials created by the interaction of UF6 with atmospheric moisture in a contained volume. United States.
Pickrell, P. W. (1985). Characterization of the solid, airborne materials created when UF6 reacts with moist air flowing in single-pass mode.
Quilès, F., and Burneau, A. (1998). Infrared and Raman spectroscopic study of uranyl complexes: hydroxide and acetate derivatives in aqueous solution. Vib. Spectrosc. 18 (1), 61–75. doi:10.1016/s0924-2031(98)00040-x
Richards, J. M., Martin, L. R., Fugate, G. A., and Cheng, M.-D. (2020). Kinetic investigation of the hydrolysis of uranium hexafluoride gas. RSC Adv. 10 (57), 34729–34731. doi:10.1039/d0ra05520d
Sherrow, S. A., and Hunt, R. D. (1992). FTIR spectra of the hydrolysis of uranium hexafluoride. J. Phys. Chem. 96 (3), 1095–1099. doi:10.1021/j100182a015
Keywords: uranium hexafluoride, reaction kinetics, hydrolysis, cryogenic, FTIR, spectroscopy
Citation: McNamara LE, Kelly JT, Waldron AM, Villa-Aleman E and Strange Fessler KA (2023) Online monitoring the hydrolysis of uranium hexafluoride for intermediates by cryogenic layering and FTIR. Front. Nucl. Eng. 2:1300544. doi: 10.3389/fnuen.2023.1300544
Received: 23 September 2023; Accepted: 17 November 2023;
Published: 07 December 2023.
Edited by:
Luke Sadergaski, Oak Ridge National Laboratory (DOE), United StatesReviewed by:
Jacques Lechelle, Commissariat à l’Energie Atomique et aux Energies Alternatives (CEA), FranceDavid Hatchett, University of Nevada, Las Vegas, United States
Jesse Lutz, Sandia National Laboratories (DOE), United States
Copyright © 2023 McNamara, Kelly, Waldron, Villa-Aleman and Strange Fessler. This is an open-access article distributed under the terms of the Creative Commons Attribution License (CC BY). The use, distribution or reproduction in other forums is permitted, provided the original author(s) and the copyright owner(s) are credited and that the original publication in this journal is cited, in accordance with accepted academic practice. No use, distribution or reproduction is permitted which does not comply with these terms.
*Correspondence: Louis E. McNamara, louis.mcnamara@srnl.doe.gov John T. Kelly, john02.kelly@srnl.doe.gov
†ORCID: Louis E. McNamara, orcid.org/0000-0002-7706-6441; John T. Kelly, orcid.org/0000-0003-2627-4141