Optical density of high fluence autoradiographic images to study boron microdistribution: validation of the technique in tissue sections
 M. S. Espain1,2,3
  J. S. Viglietti1 C. Vidal4 D. Martin1 V. A. Trivillin1,2
  A. Monti Hughes1,2 M. A. Palmieri5 L. De Leo4 M. A. Garabalino1 P. Curotto1 S. I. Thorp1 E. C. C. Pozzi1 G. Saint Martin1
  A. M. Portu1,2,3*
- 1National Atomic Energy Commission (CNEA), Buenos Aires, Argentina
- 2National Scientific and Technological Research Council (CONICET), Buenos Aires, Argentina
- 3School of Science and Technology, National University of San Martín (UNSAM), Buenos Aires, Argentina
- 4Faculty of Engineering and Exact and Natural Sciences, Favaloro University, Sarmiento, Argentina
- 5Department of Biodiversity and Experimental Biology, Faculty of Exact and Natural Sciences, University of Buenos Aires (UBA), Buenos Aires, Argentina
The distribution of boron in biological samples coming from BNCT protocols can be determined by the analysis of autoradiographic images formed by nuclear tracks on polymeric detectors. The tissue section is first explored to delimit regions of interest (ROIs), and then it is removed in order to reveal nuclear tracks through an etching process. A quantitative autoradiographic technique was developed to measure the boron concentration in the sample by counting the nuclear tracks on the detector. However, under certain circumstances, rapid measurements of boron distribution are required. For that purpose, a methodology was developed, allowing a rapid and easy determination of boron concentration and distribution in a tissue section by measuring grey levels in the corresponding high fluence autoradiographic image (HFA). The grey levels are then converted to optical density values which are then correlated with boron concentration values. In order to validate the technique, consecutive sections of several tissue samples were analyzed by the conventional counting method and by HFA. The image analysis and boron concentration estimation can be carried out in under 15 min, and relative differences between zones can be easily determined.
1 Introduction
Boron Neutron Capture Therapy (BNCT) is a charged particle radiotherapy to treat cancer, based on the boron neutron capture reaction (BNC): 10B (n,α)7Li (Locher, 1936). The knowledge of the spatial localization of boron atoms is essential, as the BNC products cause a lethal damage in a short path. There are some techniques that provide this information with different levels of resolution, such as Single Photon Emission Computed Tomography for BNCT (BNCT-SPECT) and Nuclear Magnetic Resonance (NMR). Other techniques supporting elemental imaging can also be mentioned: Secondary Ion Mass Spectrometry (SIMS), Laser post-ionization Secondary Neutral Mass Spectrometry (laser-SNMS), Electron Energy Loss Spectroscopy (EELS), and Laser-Induced Breakdown Spectroscopy (LIBS), which are all complementary tools for efficient boron identification in preclinical investigations or clinical translation, but quite sophisticated and hardly accessible (IAEA, 2023).
On the other hand, neutron autoradiography (NA) using Nuclear Track Detectors (NTD) is especially suitable due to its high resolution and low cost. NAs are generated by placing a boron-loaded biological matrix in contact with a polymeric NTD. When this assembly is irradiated with thermal neutrons, the alpha and lithium particles resulting from the BNC reaction may produce a locally damaged region in each point they impact on the NTD. Through a chemical process, the latent damaged zones can be enlarged up to optical level and “tracks” become observable (Fleischer et al., 1975). The position of each nuclear track on the detector surface reproduces the location of a10B atom in the studied tissue section.
In our laboratory, we have established different approaches to neutron autoradiography, such as Quantitative autoradiography (QTA), which allows the conversion of track density measurements (number of nuclear tracks per unit area) into absolute boron concentration values by means of a calibration curve (Espain et al., 2020). On the other hand, there is qualitative autoradiography (QLA), which involves irradiation with a higher neutron fluence and longer etching times than those used for QTA. This allows the observation of the boron microdistribution through differences in grey levels, which are observed as a consequence of the superposition of nuclear tracks (Portu et al., 2013).
Many of the studies we are currently addressing require an increase in the spatial resolution of the technique. By introducing the exposure of the biological sample-detector ensemble to UV-C radiation, we developed a simple method to simultaneously observe images of cultured cells in a polycarbonate (PC) detector and the nuclear tracks produced by the capture reaction in boron atoms inside those cells. The most favorable conditions for cells growing on the surface of the polycarbonate sheets were found, and the best UV exposure and chemical attack requirements were determined (Portu et al., 2015c). Later, this technique was optimized by staining the biological sample before UV C irradiation (Gadan et al., 2019).
When the track density in the NTD is considerably high, quantification of boron concentration becomes troublesome, since counting individual events is difficult due to track overlapping. In these cases, different approaches are applied, such as obtaining boron ratios in combination with a gross boron measurement through alpha spectrometry (Bortolussi et al., 2011) or by profile intensity analysis (Lin et al., 2012). At least for a rough quantification of boron concentration, it would be convenient to develop a method based on the optical collective effect produced by the tracks in the detector. In fact, as the opacity of the detector foil becomes noticeable even to the naked eye after etching, the evaluation of nuclear track density through the measurement of the optical density (OD) is possible. Preliminary experiences using this method (Portu et al., 2011b) justified a deeper analysis based on the OD determination.
Different parameters from which the OD could be defined have been reported, according to the methodology used to quantify the differences in light absorption in images formed in NTD (El Hofy and Elsamman, 1998). In the present method the direct measurement parameter is the so-called grey level (GL). Each pixel in the sample image is associated with an intensity value or GL, between 0 and 255, that symbolizes the visual information. This pixel value requires a certain number of bits to represent the light intensity associated to that spot, being the most usual sizes 8 bits (corresponding to a byte), 16 bits or 32 bits which correspond to 2 and 4 bytes respectively (Gonzalez and Woods, 2007).
In previous work, we have defined that OD can be calculated through Eq. 1 (Vidal et al., 2018)
where GL0 is the grey level measured in a control image where a virgin foil is photographed under the same conditions as the autoradiographies to be studied. Ideally, a sample without boron (0 μg g−1 concentration) would be associated with an GL0 value of 255. In practice, the detector thickness itself generates reflection and refraction of light, which reduces this value (typically GL0: 169) (Vidal et al., 2018).
The present work deals with the evaluation of “High Fluence Autoradiography” (HFA) images. It is intended to determine differences in 10B content from variations in the grey tones of these images. Optimal experimental conditions had to be set up to obtain good quality autoradiographic images, in such a way that different regions of interest in the sample can be associated with grey intensity values. In particular the etching time leading to well contrasted autoradiographic images had to be determined. Besides, the system must be calibrated so that grey level and 10B concentration can be associated. With that purpose a calibration was performed, using boronated aqueous solutions of known concentration (Vidal et al., 2018).
In this work, we present the workflow for rapidly estimating the distribution of boron in tissue by analyzing histological and autoradiographic images obtained using a microscope coupled with an image acquisition system. The main goal was to obtain a preliminary value as a first assessment of boron microdistribution. The proposed methodology was validated following the criteria established by the Guide for Validation of Test Methods (DC-LE-05), of the Argentine Accreditation Organization (OAA1).
2 Materials and methods
2.1 Biological samples
A group of samples was selected to quantify 10B by the HFA method and subsequent sections were chosen to be measured using the QTA method. The samples were:
a) Normal hamster’s liver. Liver tissue is histologically uniform and has a homogeneous boron uptake. For that reason, it was chosen to make comparisons between techniques (Portu et al., 2015a; Portu et al., 2015b). Hamsters were injected intravenously with a BPA-F (boronophenylalanine fructose) dose of 15.5 mg 10B kg −1 body weight (bw) and the samples were excised 3 h later (Monti-Hughes et al., 2015).
b) Hamster cheek pouch oral cancer model. Tumor, premalignant oral mucosa tissue and normal oral mucosa samples were taken. The protocol used to induce tumors consists of the topical application of subthreshold doses of the complete carcinogen DMBA (7,12-dimethylbenz [a]anthracene) in the hamster’s right cheek pouch. This chemical cancerization model allows to study tumors surrounded by premalignant tissue, the dose-limiting tissue due to BNCT induced mucositis (Monti-Hughes et al., 2015). The contralateral pouch is considered as normal tissue. Animals were injected intravenously with GB-10: Na2 [closo-B10H10] (50 mg 10B kg −1 bw) and 3 h later, tumor, premalignant and normal tissue samples were taken in order to analyze the ability of the technique to evaluate samples with a non-uniform spatial distribution of boron. The 10B microdistribution in these samples had been previously determined by the QTA method (e.g., (Portu et al., 2015a)). A group of the samples belong to animals pre-treated with thalidomide (and injected with GB-10), as described in (Molinari et al., 2015).
c) Tumor surrounded by normal skin from an experimental model of ectopic colon cancer. BDIX rats (River Lab., Wilmington, DE, United States of America) were injected subcutaneously in the right hind flank with 1 × 10⁶ DHD/K12/TRb syngeneic colon cancer cells (ECACC, Porton Down, Salisbury, UK) in 100 μL of F-10-DMEM culture medium (GIBCO) (Trivillin et al., 2017). Three weeks post inoculation, BPA was administered intravenously at a dose of 46.5 mg 10B kg −1 bw. A group was pre-treated with joint oral and topical applications of Oligo-Fucoidan (O-Fuco, 200 mg mL−1) 1 day before BPA administration as previously described (Frydryk Benitez et al., 2023). The animals were euthanized 3 h after BPA administration. Samples of tumor surrounded by skin were excised. The ROIs analyzed corresponded to tumor, necrosis and skin.
The samples were submerged in liquid nitrogen right after excision in order to avoid boron migration. All samples came from preclinical protocols of other research groups in BNCT approved by the Ethics Committee of the Argentine National Atomic Energy Commission. No animals were sacrificed specifically for this study.2.2 High fluence autoradiography
Tissue sections (30–40 μm thickness) were obtained using a cryostat microtome Leica Microsystems CM 1850. Lexan™ Polycarbonate foils (250 μm thickness) were used as nuclear track detectors. Thermal neutron irradiations with a neutron fluence of 1013 n cm−2 were performed at the thermal column central facility of the 8 MW RA-3 nuclear reactor (National Atomic Energy Commission, Argentina) (Miller et al., 2009). The flux was monitored over the whole experiments (Miller et al., 2011) and the configuration assured a uniform neutron fluence at the irradiation position over an area of 9 cm × 13 cm. After irradiation, the tissue sections mounted on Lexan were coloured with haematoxylin-eosin (H&E). The histological and the autoradiographic images were observed and digitalized with an Olympus BX51 light microscope and a CCD camera (Olympus DP70).
Then, the tissue sections were detached from the detector by means of trypsin-EDTA. A chemical process (etching) was performed with PEW solution (90 g H2O, 80 g ethanol, 30 g KOH) at 70°C. Both the KOH solution and the temperature have been largely validated in previous works by intercomparison with other boron determination techniques (e.g., Portu et al. (2011a; 2015b)). The etching time was set at 4 min, after analyzing the evolution of the image contrast with etching time (Portu et al., 2023). The detector was re-positioned on a slide and the autoradiographic images were explored and photographed. Images were captured at low magnification (1.25x), in greyscale and at a resolution of 4,080 × 3,072 (W x H). Exposure times ranged from 1/8,000 s to 1/3,000, with 1/8,000 s being the most suitable one. As the exposure time increases, the camera captures light over a longer period, resulting in brighter images. Conversely, when the exposure time decreases, darker images are obtained. Digital images were stored in the .tiff format to avoid an eventual loss of resolution.
2.3 Methodology for OD measurement and boron concentration determination
An algorithm was developed in MATLAB to analyze the autoradiographic images, calculate the OD in each Region of Interest (ROI), and translate it to boron concentration. The software receives the histological image and its corresponding HFA neutron autoradiography as input, and by delimiting manual ROIs on the histological image, it generates masks that are automatically superimposed on the autoradiographic image. The developed software also offers a tool for aligning the histological and autoradiographic images, explicitly programmed for this purpose.
An average grey level (GLa ± STD) is measured for each ROI, and OD is calculated using Eq 1. A calibration curve for aqueous solutions of enriched boric acid (99%) ranging from 0 to 200 μg g−1 is used to convert OD into boron concentration values (Vidal et al., 2018). Small Lexan Cases (SLCs) were constructed and filled with the borated standards as described in (Portu et al., 2011a). The SLCs were irradiated at the same facility and using an identical configuration as the samples for HFA analysis. The calibration curve to be used must be one acquired using the same exposure time as the samples under analysis.
2.4 Validation
The Guide for Validation of Test Methods (DC-LE-05) of the Argentine Accreditation Organization (OAA), establishes criteria to validate a given test method, depending on its characteristics. This guide establishes a procedure in which it is first necessary to determine the validation parameters and the requirements they have to meet. Then the measurements obtained for the chosen parameters have to be compared to the previously defined requests. Using this guide as a reference, the parameters to validate the proposed methodology were: Specificity, Precision, Linearity, Range, Limit of Detection, Limit of Quantification, Accuracy or Trueness and Uncertainty.
• Specificity: Defined as the ability of a method to assess unequivocally an analyte in the presence of interference, is also called selectivity.
• Precision: proximity (degree of scatter) between the results of independent measurements of the same homogeneous sample, obtained under stipulated conditions.
• Linearity: It is defined as the ability of an analytical method to produce results that are proportional to the concentration of analyte in the sample (within a given range), directly or through a defined mathematical transformation.
• Range: Interval of an analytical procedure within which the validated method can be considered.
• Limit of Detection (LD): It is defined as the true value of the concentration of an analyte in a sample, which can be detected with a probability equal to β of producing a false negative. IUPAC (International Union of Pure and Applied Chemistry) recommends β = 0.05. The Limit of Detection (for α = β) can be calculated as follows:
where S0 is the standard deviation of the control sample (blank foil in this case) and t1−α,ν is the Student value for probability α and ν degrees of freedom.
• Limit of Quantitation (LQ): the lowest amount of analyte that can be quantified with an acceptable level of uncertainty. It is determined as the concentration of analyte for which the relative standard deviation of the method (RSD%) is 10%. LQ can be calculated as follows:
where S0 is the standard deviation in a blank sample.
• Accuracy: proximity between the average of a large series of results and the value that is accepted either as a conventional true value or an accepted reference value of the measured magnitude. In this case, measurements obtained by HFA methodology were compared with those from a quantitative autoradiographic analysis (QTA) in the same tissue region. The QTA image generation process is identical to that of HFA, with the difference that a lower neutron fluence (1012 n cm−2) and an etching time of 2 min are used. As a result, the number of tracks on the detector is reduced, and it is possible to quantify them individually. Thus, by calculating the track density per unit area and using a calibration curve, it is possible to determine the boron concentration in the tissue (Portu et al., 2011a).
• Uncertainty: Parameter associated with the result of a measurement, which characterizes the dispersion of the values that could reasonably be attributed to the measured magnitude.
3 Results
3.1 Workflow
A working protocol to perform an analysis using high fluence autoradiographic images (HFA) was established (as shown in Figure 1). The process starts with the acquisition of the histological image (imH) of the tissue section to be analyzed, on which the ROIs will be delimited. Then, the sample is processed to generate and acquire the corresponding autoradiographic image (imAR). Both images are loaded into the analysis algorithm and aligned. After that, the ROIs are outlined in the rotated imH and the created masks are applied to the imAR, where the average grey level in each region is calculated. The whole procedure to estimate boron concentration values can be completed in approximately 15 min using this software, and relative differences between zones can be easily determined.
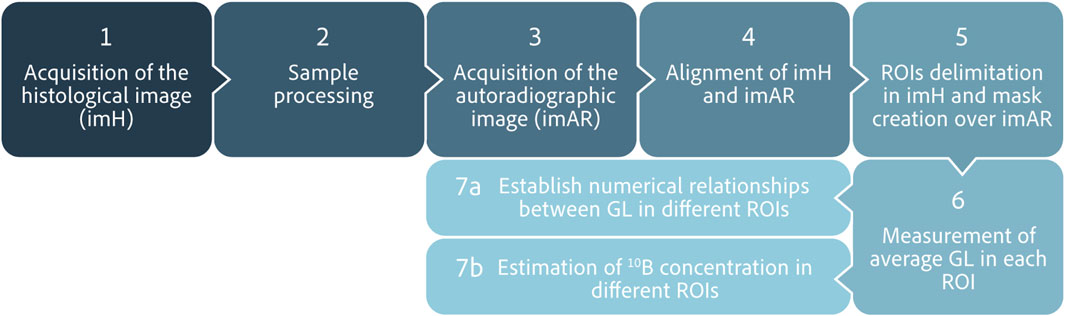
FIGURE 1. Workflow of the HFA process protocol.
An example of the application is shown in Figure 2, where sections of BDIX’s tumors surrounded by skin were analyzed. Figure 2A shows a histological section from a BDIX rat infused with BPA (ImH), while Figure 2B is the same image with the ROIs masks superimposed, and Figure 2C the autoradiographic images (ImAR). Figures 2D–F is equivalent, but a pretreatment with Oligo-Fucoidan was applied before BPA infusion (see Section 2.1). When comparing qualitatively the autoradiographic images, it is observed that the contrast of gray levels is higher for the BPA protocol. This would imply a more homogeneous uptake when Oligo-Fucoidan is applied beforehand. This observation was confirmed by OD analysis, obtaining a Tumor/Skin ratio of 2.6±0.5 (BPA) vs. 1.9±0.2 (BPA + O-Fuco). These values are consistent with those obtained by ICP-OES measurements (2.1±0.2 and 1.8±0.2, respectively). In order to confirm these findings, more samples should be analyzed.
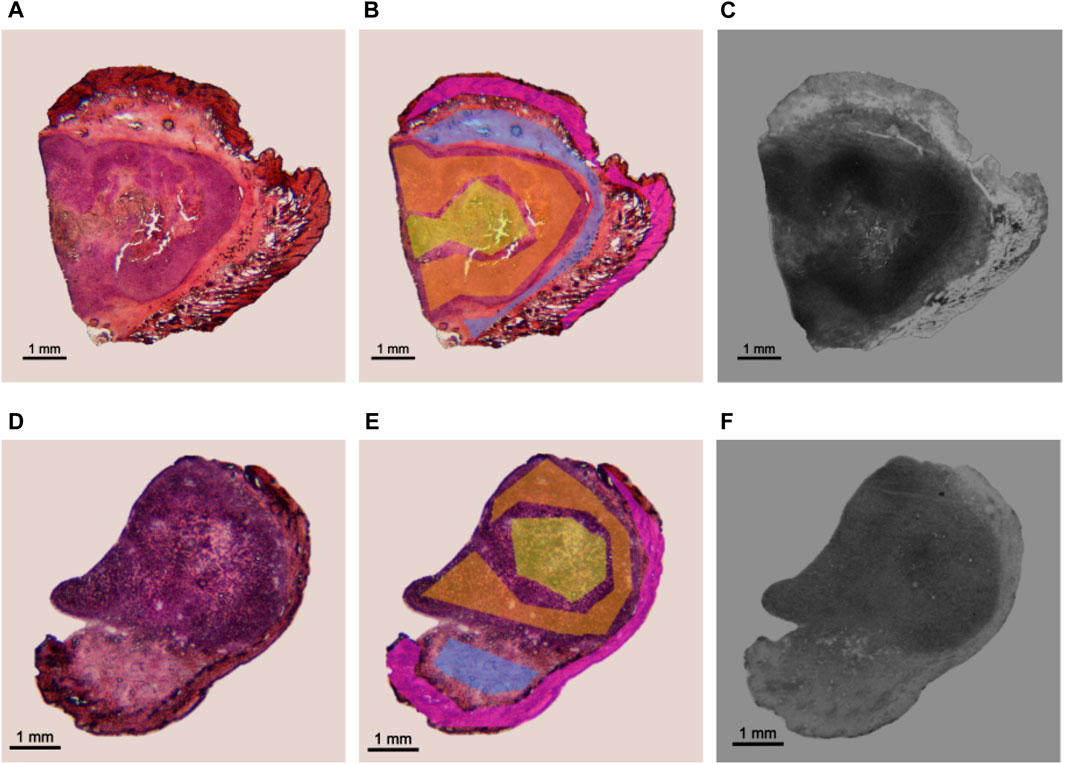
FIGURE 2. Application of the established protocol in an experimental model of colon cancer in BDIX rats. Examples of a section coming from BPA (top) and BPA + O-Fuco (bottom) protocols are presented. (A, D) Histological image stained with H&E (imH) (B, E) ROI delimitation: tumor (orange), necrosis (yellow), connective tissue (light blue) and epithelium + dermis (pink). (C, F) corresponding HFA autoradiographic image (imAR).
3.2 Validation of the HFA methodology
3.2.1 Specificity
Since the implemented methodology for the OD calculation implies the use of low-magnification images, the delimitation of small regions may not be sufficiently precise. This makes it challenging to quantify regions with interference from histologically different structures (which would absorb varying quantities of boron) that eventually could not be distinguished. The lack of specificity is particularly relevant in tissue sections where histological structures are diffuse. An example of this limitation is presented in Figure 3, where a histological section of pouch tumor (a) at low magnification (1.25x) and its corresponding autoradiography (b) are shown. The region marked in red is shown at higher magnification (10x) in (c). This image exhibits that the selected region of parenchyma contains stroma. Generally, depending on sample size, microscope positioning, and acquisition conditions, it may be difficult to delimitate the parenchyma ROI independently from the stroma, and the operator’s ability will strongly influence the definition of the regions.
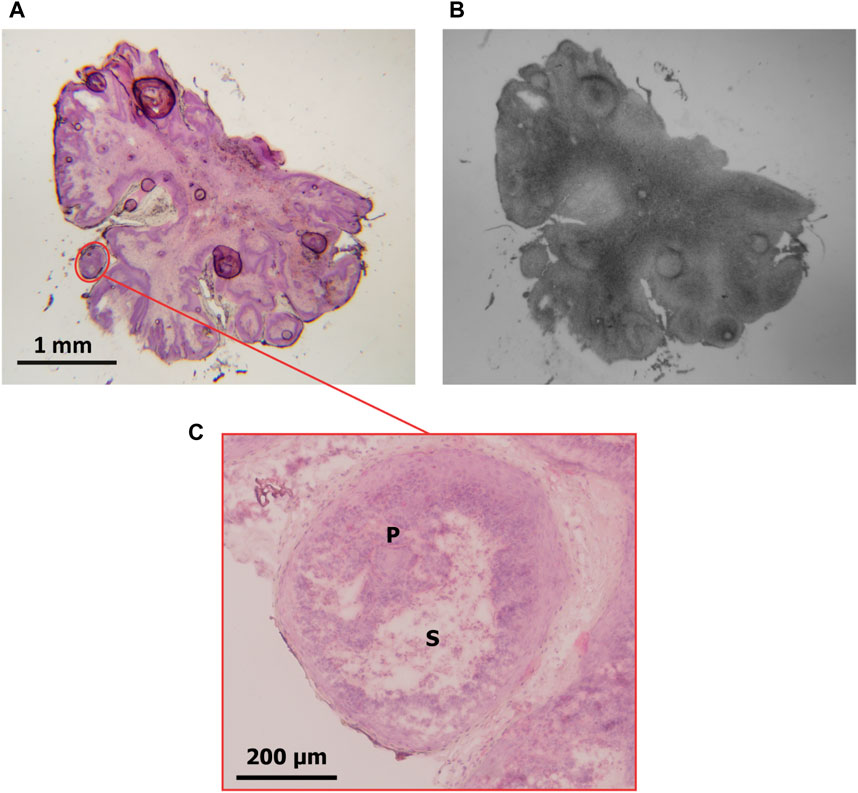
FIGURE 3. (A) Pouch tumor section stained with H&E (magnification: 1.25x). A ROI delimiting parenchyma containing stroma is marked in red. (B) autoradiographic image of the same section. (C) the ROI delimited in (A) is observed at higher magnification (10x). P: parenchyma; S: stroma.
Ten users were asked to delimit the parenchyma within the ROI highlighted in red in Figure 3A, and two parameters were evaluated: the number of pixels and the calculated OD value in the region. The specificity of the HFA methodology was then assessed based on the variability of these measurements. The same pair of histological and autoradiographic images (Figures 3A, B) was used in all cases. Figure 4A shows the distribution of the number of pixels delimited by each user for the same ROI. The values range from approximately 13000 pixels to 22500 pixels, with a standard deviation of 2,883 pixels, which represents 17% of the mean (16617). The interquartile range (IQR) is 3,894 and the median 16315. From the area distribution standard deviation, a spatial resolution of about 160 μm could be inferred for ROIs of at most 1.5 × 105 μm2.
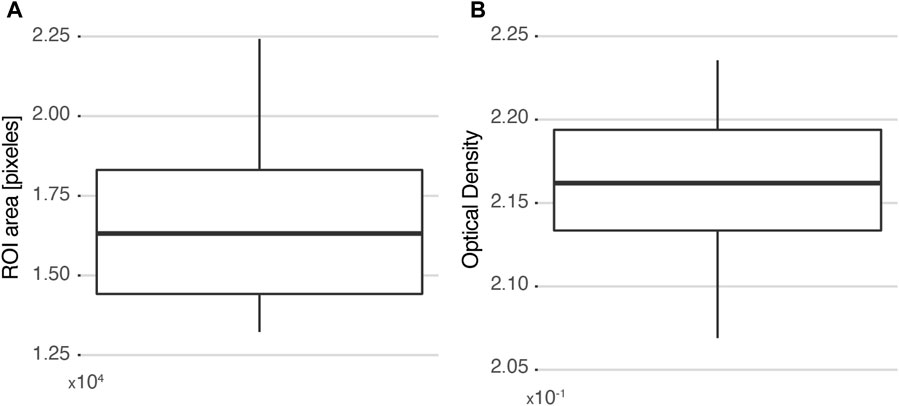
FIGURE 4. Selectivity measured as the variability among 10 different users selecting the same ROI. (A) Distribution of ROI areas measured in each case. (B) Distribution of the corresponding calculated OD values. The box plots are drawn from the 25th percentile to the 75th percentile, with a horizontal line that denotes the median. The vertical lines extend to the minimum and maximum values of the distribution.
Since the number of pixels that compose a region is considerably high, it is almost impossible for two different users to perform the exact same delimitation. Thus, the resulting OD calculation would include pixels that do not belong to the histological structure of interest. However, when the impact of these “intrusive pixels” is analyzed (Figure 4B), it is observed that the OD measurement is not significantly affected. The values vary between 2.07 × 10⁻¹ and 2.23 × 10⁻¹, and the distribution has a standard deviation of 5 × 10⁻³, representing 2% of the mean (2.16 × 10⁻¹). In summary, it can be concluded that the HFA methodology is insensitive to “intrusive pixels” added by the user when the histological region of interest contains a minimum of 16000 pixels.
3.2.2 Precision
A tumor section corresponding to the GB-10 protocol in the hamster oral cancer model was chosen to determine the precision of the methodology. Two ROIs were identified: a parenchyma and a stroma, and images of both ROIs were repeatedly acquired by the same user. Figure 5 shows the distribution of the calculated OD values for each ROI. The deviations of the measurements are similar for both regions, resulting in a higher percentage deviation for parenchyma. The precision for the studied cases ranged between 4% (for stroma) and 12% (for parenchyma).
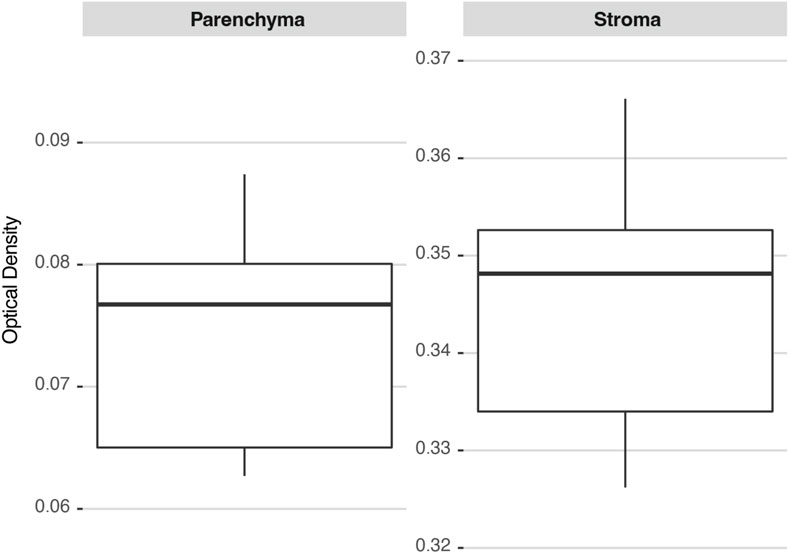
FIGURE 5. 10B concentration distributions in two ROIs (parenchyma and stroma) calculated several times on the same hamster’s cheek pouch tumor section. The box plots are drawn from the 25th percentile to the 75th percentile, with a horizontal line that denotes the median. The vertical lines extend to the minimum and maximum values of the distribution.
3.2.3 Linearity
The linearity of this methodology was assessed from SLCs standards of enriched boric acid (Vidal et al., 2018). Figure 6 shows the average OD values of the reference standards captured at different exposure times. In all cases, a linear relationship between optical density and boron concentration is observed. The linear fit coefficients for each exposure time are displayed in Table 1. As expected, the slope increases as the exposure time decreases. This is due to the fact that, for the same boron concentration, a lower exposure leads to a darker image, resulting in a higher OD value. The exposure time of 1/8,000 s resulted in the most suitable one for the set of samples under study because it allows for exploring the entire boron concentration range without saturation, enabling differentiation of similar 10B concentrations.
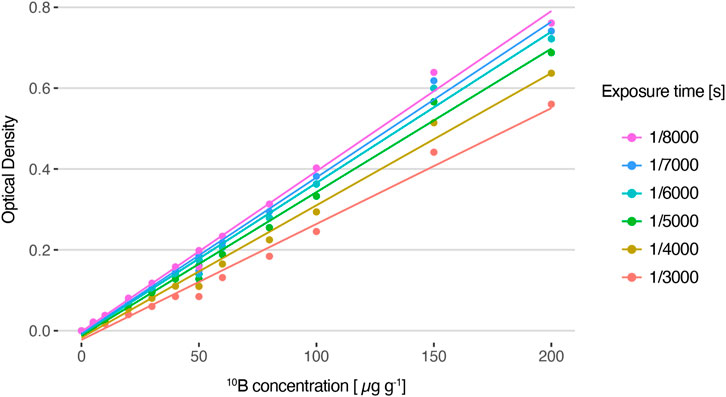
FIGURE 6. Average optical density values for HFA autoradiographic images generated from solutions with varying 10B concentrations and captured with different exposure times, and their corresponding linear fit (R2 = 0.99).
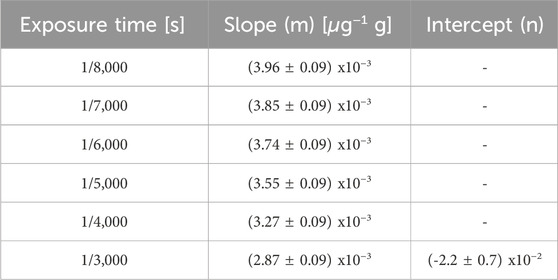
TABLE 1. Parameters of the linear fits shown in Figure 6.
3.2.4 Range
The standard samples of enriched boron acid solutions used to perform the calibration lines ranged between 0 and 200 μg g−1 of 10B concentrations (see Figure 6). To determine the boron concentration in biological samples, a correction factor for evaporation (CEv) should be applied, which usually fluctuates between 0.2 and 0.3 (Espector et al., 2023). Therefore, the valid range in tissue is between 0 and 60 μg g−1.
3.2.5 Limit of detection (LD)
To calculate LD, the average OD value of a selected ROI was measured for different images of the same blank (Virgin Lexan) acquired with the same microscope under equal conditions, but at different times. Then, the corresponding 10B concentration value was calculated using the HFA method. The detection limit was calculated by Eq. 2 and the result is LD = 3 μg g−1.
3.2.6 Limit of Quantitation (LQ)
LQ was determined using the same blank foil measurements used to calculate LD. The result obtained for the HFA method using Eq. 3 was LQ = 7 μg g−1.
3.2.7 Accuracy
In order to evaluate the accuracy of the HFA method, various tissue samples were examined using the HFA approach, and consecutive sections were selected for measurement by QTA. A total of 19 samples from the different protocols described in Section 2.1 were analyzed in which 90 ROIs of different tissue structures (normal, premalignant and tumor of different models) were delimited and measured. Figure 7 presents a comparison between HFA and QTA measurements, where each point corresponds to an equivalent ROI for consecutive sections. The line y = x is also plotted, indicating the expected result if both measurements were the same. No CEv factors were applied since the aim was to compare the techniques across the entire range of concentration values. Most of the ROIs (around 70%) show a good agreement between both techniques, with less than 30% of difference. In particular, both measurement methods yielded similar concentration values for the homogeneous hamster liver sections, with relative differences under 20%.
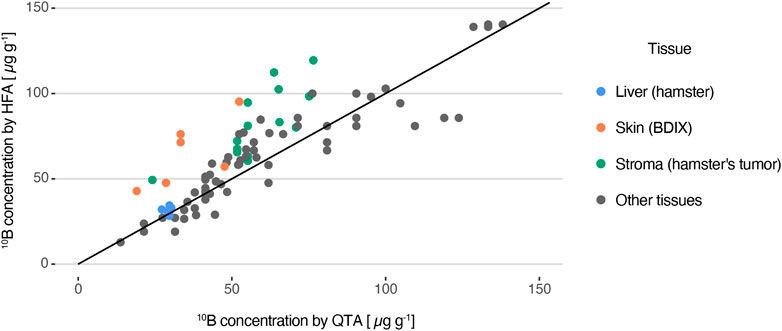
FIGURE 7. 10B concentration measured with HFA as a function of the values obtained by the QTA method, considered as the accepted reference value. The line y = x is also plotted.
For heterogeneous samples, HFA generally overestimates boron concentration compared with QTA. While most of the values are consistent between both methods, with a median variance of 16%, there are certain ROIs that exhibit differences of up to 100%. Stromal regions of tumor sections of the cheek pouch oral cancer model and skin surrounding tumor of BDIX rats are examples of ROIs that could present disagreement between both techniques. It is important to note that the smaller the areas of the ROIs, the higher the likelihood of finding significant deviations (as previously discussed). It must be noted that these results combine samples coming from different models and that biological variations between consecutive sections are not being considered.
3.2.8 Uncertainty
The concentration values obtained by the HFA method have two sources of uncertainty. Firstly, the error in the interpolation process Δ[10B]* is calculated using Eq. 4 (Skoog et al., 1994).
where N is the number of points included in the calibration curve (N = 12 considering images between 0 and 200 μg g−1), L is the number of times each sample was analyzed (L = 1 in this case),
On the other hand, given that [10B]* is obtained by interpolation on the linear fit and that it is necessary to correct the final value to consider the evaporation process by multiplying [10B]* by the CEv, the absolute concentration error measured by the HFA method is:
where the estimated uncertainty for the determination of the CEv factor (ΔCEv2) is approximately 5% (Espector et al., 2023).
4 Discussion
The validation of the workflow for determining 10B concentration in tissue sections using high-fluence autoradiographic images acquired at ×1.25 magnification has been completed. Table 2 shows the values obtained for the selected parameters used to characterize methodology. From this it was concluded that the method is valid for ROIs with at least 16000 pixels, with a limit of detection of 3 μg g−1 and a limit of quantification of 7 μg g−1. The accuracy can range between 4% and 13%, with a suitable range of 10B concentration from 0 to 60 μg g−1 and mean uncertainty [6%–32%] with mean value 13%. It is worth mentioning that the obtained parameters depend on the specific characteristics of the equipment used in our laboratory, such as the microscope, lens and CCD camera, as well as the HFA generation conditions like neutron fluence, etching time and exposure time for image acquisition.

TABLE 2. Parameters defined for the HFA method.
After completing the presented analysis, this method can be considered valid for the proposed objective, which was to obtain a rapid result on boron distribution, which can be complemented later by QTA. It should be noted that this methodology offers a good overview of boron distribution and quite representative concentration values that allow a preliminary biological analysis.
In certain cases, a more detailed insight about boron microdistribution would be desirable and could be achieved by analyzing grey level distribution within the ROIs. However, the precision of the results in small structures is limited, as shown in Section 3.2.1. The spatial resolution of the present technique is around 160 μm. The effect in the OD measurement of increasing or decreasing pixels on a specific ROI will vary based on the ROI’s size. Therefore, the required precision and user’s ability to delineate the area of interest in the histological image will determine the spatial resolution. Actually, the technique is limited to the analysis of structures that can be delimited in images acquired at low magnification, where the collective effect of track superposition allows to analyze differences of boron concentration in terms of shades of grey. Indeed, at higher magnification, individual tracks produce a granular texture that impacts the optical effect.
In this study we have pooled a considerable amount of results with the aim to validate the OD analysis and to state the limitations of the technique. This work has led to the creation of a notable set of labeled images, which could be useful considering the increasing interest in applying machine learning techniques for classification and segmentation purposes (e.g., (Viglietti et al., 2023)).
It is worth mentioning that the analysis of the present study did not focus on the biological implications of the microdistribution analysis, but on the comparison and validation between HFA and QTA. Further work will be devoted to reporting the application of this methodology to biological models of interest.
Data availability statement
The raw data supporting the conclusion of this article will be made available by the authors, without undue reservation.
Ethics statement
The animal study was approved by the Ethics Committee of the Argentine National Atomic Energy Commission. The study was conducted in accordance with the local legislation and institutional requirements.
Author contributions
ME: Writing–original draft, Visualization, Methodology, Formal Analysis, Data curation, Conceptualization. JV: Writing–review and editing, Visualization, Software, Investigation, Data curation. CV: Writing–review and editing, Software, Investigation, Formal Analysis, Data curation. DM: Writing–review and editing, Methodology, Formal Analysis. VAT: Writing–review and editing, Investigation. AM: Writing–review and editing, Investigation. MP: Writing–review and editing, Investigation. LD: Writing–review and editing, Investigation. MAG: Writing–review and editing, Investigation. PC: Writing–review and editing, Investigation. ST: Writing–review and editing, Investigation. EP: Writing–review and editing, Investigation. GS: Writing–original draft, Supervision, Methodology, Formal Analysis, Conceptualization. AP: Writing–original draft, Visualization, Supervision, Project administration, Methodology, Funding acquisition, Formal Analysis, Data curation, Conceptualization.
Funding
The author(s) declare financial support was received for the research, authorship, and/or publication of this article. This study was partially funded by the Agencia Nacional de Promoción Científica y Tecnológica, (grant number PICT 2021-00026) and by Balseiro Foundation (grant no. 306/21). No additional external funding was received for this study.
Acknowledgments
The authors are extremely grateful to Dr. Amanda Schwint for the fruitful discussions and mentorship during so many years. They also acknowledge Dr. Ana Molinari for the initial discussions on thalidomide protocols. Finally, they authors are thankful to HI-Q Marine Biotech internationaL Ltd (Taiwan) for providing Oligo-Fucoidan.
Conflict of interest
The authors declare that the research was conducted in the absence of any commercial or financial relationships that could be construed as a potential conflict of interest.
Publisher’s note
All claims expressed in this article are solely those of the authors and do not necessarily represent those of their affiliated organizations, or those of the publisher, the editors and the reviewers. Any product that may be evaluated in this article, or claim that may be made by its manufacturer, is not guaranteed or endorsed by the publisher.
Footnotes
1The OAA is a signatory of Multilateral Agreements and is a member of ILAC (International Laboratory Accreditation Cooperation), IAF (International Accreditation Forum) and IAAC (Interamerican Accreditation Cooperation).
References
Bortolussi, S., Bakeine, J. G., Ballarini, F., Bruschi, P., Gadan, M. A., Protti, N., et al. (2011). Boron uptake measurements in a rat model for Boron Neutron Capture Therapy of lung tumours. Appl. Radiat. Isotopes 69, 394–398. doi:10.1016/j.apradiso.2010.11.018
El Hofy, M., and Elsamman, H. (1998). Optical density of the etched α-tracks in CR-39 nuclear track detector. Radiat. Meas. 29, 461–464. doi:10.1016/s1350-4487(98)00055-9
Espain, M. S., Dattoli Viegas, A. M., Trivillin, V. A., Saint Martin, G., Thorp, S. I., Curotto, P., et al. (2020). Neutron autoradiography to study the microdistribution of boron in the lung. Appl. Radiat. Isotopes 165, 109331–109339. doi:10.1016/j.apradiso.2020.109331
Espector, N., Portu, A. M., Espain, M. S., Leyva, G., and Saint Martin, G. (2023). Measurement of an evaporation coefficient in tissue sections as a correction factor for 10B determination. Histochem. Cell Biol. 160, 3–10. doi:10.1007/s00418-023-02200-w
Fleischer, R. L., Price, P. B., and Walker, R. M. (1975). Nuclear tracks in solids: principles and applications. Nucl Tracks Solids, Princ Appl. doi:10.13182/nt81-a32766
Frydryk Benitez, D. N., Palmieri, M. A., Langle, Y. V., Monti Hughes, A., Pozzi, E. C., Thorp, S. I., et al. (2023). Therapeutic efficacy, radiotoxicity and abscopal effect of BNCT at the RA-3 nuclear reactor employing oligo-fucoidan and glutamine as adjuvants in an ectopic colon cancer model in rats. Life 13, 1538. doi:10.3390/life13071538
Gadan, M. A., Lloyd, R., Saint Martin, G., Olivera, M. S., Policastro, L., and Portu, A. M. (2019). Neutron autoradiography combined with UV-C sensitization: toward the intracellular localization of boron. Microsc. Microanal. 25, 1331–1340. doi:10.1017/S1431927619015058
Lin, Y. C., Hwang, J. J., Wang, S. J., Yang, B. H., Chang, C. W., Hsiao, M. C., et al. (2012). Macro- and microdistributions of boron drug for boron neutron capture therapy in an animal model. Anticancer Res. 32, 2657–2664.
Locher, G. L. (1936). Biological effects and therapeutic possibilities of neutrons. Am. J. Roentgenol. Radium Ther. 36.
Miller, M., Quintana, J., Ojeda, J., Langan, S., Thorp, S., Pozzi, E., et al. (2009). New irradiation facility for biomedical applications at the RA-3 reactor thermal column. Appl. Radiat. Isotopes 67, 226–229. doi:10.1016/j.apradiso.2009.03.107
Miller, M. E., Sztejnberg, M. L., González, S. J., Thorp, S. I., Longhino, J. M., and Estryk, G. (2011). Rhodium self-powered neutron detector as a suitable on-line thermal neutron flux monitor in BNCT treatments. Med. Phys. 38, 6502–6512. doi:10.1118/1.3660204
Molinari, A. J., Thorp, S. I., Portu, A. M., Saint Martin, G., Pozzi, E. C., Heber, E. M., et al. (2015). Assessing advantages of sequential boron neutron capture therapy (BNCT) in an oral cancer model with normalized blood vessels. Acta Oncol. 54, 99–106. doi:10.3109/0284186X.2014.925140
Monti-Hughes, A., Aromando, R. F., Pérez, M. A., Schwint, A. E., and Itoiz, M. E. (2015). The hamster cheek pouch model for field cancerization studies. Periodontol. 2000 67, 292–311. doi:10.1111/prd.12066
Portu, A., Bernaola, O. A., Nievas, S., Liberman, S., and Saint Martin, G. (2011a). Measurement of 10B concentration through autoradiography images in polycarbonate nuclear track detectors. Radiat. Meas. 46, 1154–1159. doi:10.1016/j.radmeas.2011.07.034
Portu, A., Saint Martin, G., Brandizzi, D., Bernaola, O. A., and Cabrini, R. L. (2011b). 10B concentration evaluation in autoradiography images by optical density measurements. Appl. Radiat. Isotopes 69, 1710–1712. doi:10.1016/j.apradiso.2011.04.029
Portu, A., Carpano, M., Dagrosa, A., Cabrini, R. L., and Saint Martin, G. (2013). Qualitative autoradiography with polycarbonate foils enables histological and track analyses on the same section. Biotech. Histochem. 88, 217–221. doi:10.3109/10520295.2012.759624
Portu, A., Molinari, A. J., Thorp, S. I., Pozzi, E. C., Curotto, P., Schwint, A. E., et al. (2015a). Neutron autoradiography to study boron compound microdistribution in an oral cancer model. Int. J. Radiat. Biol. 91, 329–335. doi:10.3109/09553002.2014.995381
Portu, A., Postuma, I., Gadan, M. A., Saint Martin, G., Olivera, M. S., Altieri, S., et al. (2015b). Inter-comparison of boron concentration measurements at INFN-University of Pavia (Italy) and CNEA (Argentina). Appl. Radiat. Isotopes 105, 35–39. doi:10.1016/j.apradiso.2015.07.022
Portu, A., Rossini, A. E., Thorp, S. I., Curotto, P., Pozzi, E. C. C., Granell, P., et al. (2015c). Simultaneous observation of cells and nuclear tracks from the boron neutron capture reaction by UV-C sensitization of polycarbonate. Microsc. Microanal. 21, 796–804. doi:10.1017/S1431927615014348
Portu, A. M., Espain, M. S., Viglietti, J. S., and Martin, G. S. (2023). Neutron autoradiography with nuclear tracks detectors: an imaging technique for Boron Neutron Capture Therapy. J. Phys. Conf. Ser. 2605, 012010. doi:10.1088/1742-6596/2605/1/012010
Trivillin, V. A., Pozzi, E. C., Colombo, L. L., Thorp, S. I., Garabalino, M. A., Monti Hughes, A., et al. (2017). Abscopal effect of boron neutron capture therapy (BNCT): proof of principle in an experimental model of colon cancer. Radiat. Environ. Biophysics 56, 365–375. doi:10.1007/s00411-017-0704-7
Vidal, C., Portu, A., Thorp, S. I., Curotto, P., Pozzi, E., and Saint Martin, G. (2018). Optical density analysis in autoradiographic images from BNCT protocols. Radiat. Meas. 119, 121–124. doi:10.1016/j.radmeas.2018.10.005
Viglietti, J. S., Espain, M. S., Díaz, R. F., Nieto, L. A., Szewc, M., Bernardi, G. C., et al. (2023). From nuclear track characterization to machine learning based image classification in neutron autoradiography for boron neutron capture therapy. PLoS ONE 18, e0293891. doi:10.1371/journal.pone.0293891
Keywords: neutron autoradiography, boron imaging, BNCT, optical density, validation, nuclear track detectors, animal models
Citation: Espain MS, Viglietti JS, Vidal C, Martin D, Trivillin VA, Monti Hughes A, Palmieri MA, De Leo L, Garabalino MA, Curotto P, Thorp SI, Pozzi ECC, Saint Martin G and Portu AM (2024) Optical density of high fluence autoradiographic images to study boron microdistribution: validation of the technique in tissue sections. Front. Nucl. Eng. 3:1363880. doi: 10.3389/fnuen.2024.1363880
Received: 31 December 2023; Accepted: 28 February 2024;
Published: 12 March 2024.
Edited by:
Alex Winkler, University of Helsinki, FinlandReviewed by:
Jean-Emmanuel Groetz, University of Franche-Comté, FrancePawel Olko, Polish Academy of Sciences, Poland
Copyright © 2024 Espain, Viglietti, Vidal, Martin, Trivillin, Monti Hughes, Palmieri, De Leo, Garabalino, Curotto, Thorp, Pozzi, Saint Martin and Portu. This is an open-access article distributed under the terms of the Creative Commons Attribution License (CC BY). The use, distribution or reproduction in other forums is permitted, provided the original author(s) and the copyright owner(s) are credited and that the original publication in this journal is cited, in accordance with accepted academic practice. No use, distribution or reproduction is permitted which does not comply with these terms.
*Correspondence: A. M. Portu, agustina.portu@gmail.com