Multivariate-coupling LOCA prediction using zLSTM
 Xichen Li1
  Jingke She
- 1College of Computer Science and Electronic Engineering, Hunan University, Changsha, China
- 248th Research Institute of China Electronic Technology Group Corporation, Changsha, China
- 3Beijing Zhongbao Network Shield Technology Co., Ltd., Beijing, China
A novel deep learning model zLSTM, which evolves from Long-Short Term Memory (LSTM) with enhanced long-term processing capability, is applied to the prediction of Loss of Coolant Accident (LOCA). During the prediction process, six-dimensional multivariate coupling is established among six major system parameters after connecting each timestep with the time dimension. The demonstration experiments show that the proposed method can increase the prediction accuracy by 35.84% comparing to the traditional LSTM baseline. Furthermore, zLSTM model follows the parameter progress well at the starting stage of LOCA, which reduces the prediction error at both the beginning and the far end.
1 Introduction
LOCA is a severe accident that causes critical threat to the Nuclear Power Plants (NPPs), which makes timely and accurate prediction meaningful to the NPP safety (Saxena et al., 2010). However, the nonlinearity and system complexity of LOCA increase the prediction difficulty. The LOCA modeling process becomes even more complicated when a multivariate coupling structure is needed to present comprehensive illustration of the entire LOCA process.
During the past decades, a lot of multivariate prediction attempts were conducted, which can be divided into three categories. The first class is based on statistical methods, such as 1) LOCA calculation using an input card with modified reactor core section (Li et al., 2019), and 2) coolant injection model from FLUENT software (Bingzheng et al., 2020). Methods of this class assume linear dependences among all the system parameters, leading to quadratic increase of the model complexity and over-fitting problem. The second class uses traditional machine learning methods, such as Support Vector Machine (SVM) for break size estimation (Yu et al., 2022; Liu et al., 2021) and Group Method of Data Handling (GMDH) for the break location and break size estimation (Radaideh and Kozlowski, 2020). Artificial Intelligence (AI) methods groups the third class, in which Deep Neural Network (DNN) is deployed to predict the reactor core water level (Koo et al., 2018) and Convolutional Neural Networks (CNN) is widely used for multivariate time series prediction (Kollias and Zafeiriou, 2020) and operation parameter prediction of LOCA (Fukun et al., 2022). AI class methods have been proved to be effective for nonlinear challenges. For example, a combination of Autoregressive Integrated Moving Average (ARIMA) and LSTM were proposed as a solution for fault diagnosis and prediction of NPP’s accidents (Zhu et al., 2022); She, et al. combined both CNN and LSTM to analyze the coolant variation during a LOCA (She et al., 2021). LSTM was also used in (She et al., 2020) for the key parameter prediction of steam generators.
As indicated above, nonlinearity, multivariate processing, and long-term memory must be considered for a precise LOCA prediction. The previous works in the LOCA field only realized multivariate prediction of a single variable within a relative short period, leaving a challenge for multivariate and long-term processing. This work thus proposes to solve such challenge with zLSTM-based prediction model (Gong et al., 2022), in which its enhanced long-term memory is utilized together with multivariate coupling to generate more accurate and reliable LOCA prediction results.
This paper consists of four sections. Besides the introduction part, Section 2 provides details of the zigmoid function and the prediction model using zLSTM; Section 3 presents the design of the verification experiments and the results, as well as the analysis. The paper is then concluded in Section 4.
2 The prediction model based on multivariate coupling
The multivariate coupling of several critical system parameters is realized using the above mentioned zLSTM model, where the zLSTM model, the dense block, and the output prediction sequence are combined to establish the entire model structure.
2.1 Model structure
LSTM networks still have long-range dependence problems due to functions inherited from RNN. Those states with long timesteps are far away from the current calculation point, leading to difficult updates of parameters at the current time. With a consideration of improving the prediction accuracy in long-term sequence prediction, it is necessary to alleviate the gradient vanishing problem that occurs as the time series range becomes longer. This paper uses an improved zLSTM model for long-term sequence parameter prediction in a multivariate environment. As (Gong et al., 2022) indicates, the formulas for forget gate
Due to the issue that the gradient of the sigmoid in the LSTM forget gate diminishes significantly over distant time steps, which may hinder effective learning of states over longer time durations, the zLSTM improves upon this by replacing the sigmoid activation function originally used in the forget gate
The exponential function in trans(x) enhances the gradient at far end of the time series and provides stronger information memory capability. The coupled multivariate vector, which contains more complex system information than a single-variable input, can then be fed into the model to generate a more precise prediction of the system behaviour.
The overall structure of the model used is presented in Figure 1 below.
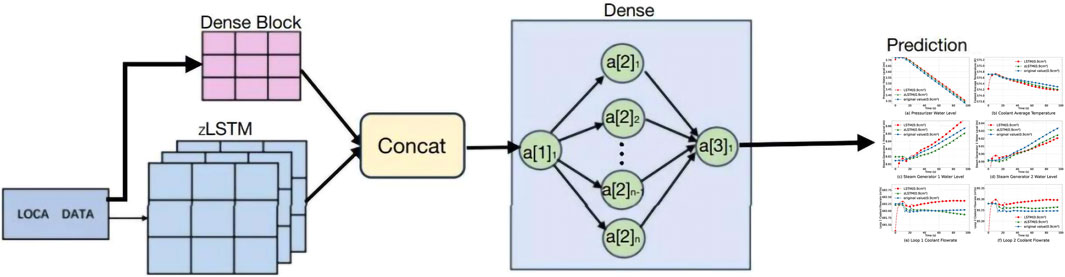
Figure 1. Multivariate Coupling Prediction Model based on zLSTM.
During the multivariate prediction calculation process, the input data is a multi-variable sequence containing multiple timesteps. Each timestep contains multiple multidimensional features of important LOCA process parameters, with a feature dimension of seven. Among the seven dimensions, the first dimension is time, and each remaining dimension represents a system variable that affects the LOCA condition, namely,: pressurizer water level, average coolant temperature, No. 1 steam generator water level, No. 2 steam generator water level, loop 1 coolant flowrate, and loop 2 coolant flowrate. To reduce the time complexity, the input sequence needs to be normalized by minimum and maximum values on the feature dimension except for time features, with the feature value range being [0, 1].
The input window width of each sample sequence is set to 5. The input time series first passes through a unidirectional LSTM network, which simultaneously sends multiple variables at each timestep into the zLSTM, allowing it to establish causal dependencies between timesteps in the time dimension and simultaneously establish dependencies between multiple variables. This enables the output of the zLSTM to contain dependencies between multiple variables and time dependencies with past timesteps at each timestep, ensuring that the condition prediction of LOCA is a coupled calculation result of relevant important system parameters. By this means, the coupling between critical system parameters is founded and the LOCA prediction will be conducted based on such coupled multi-parameter vector.
The modeling of the input time series is completed using a dense block, which further strengthens the coupling calculation between multiple system variables. The fully connected layer in the dense block can establish the dependence relationship between each variable in the current timestep and other variables, as well as all variables in other timesteps. After the output of the zLSTM and the input time series pass through the fully connected module, they are spliced in feature dimension, so that the obtained spliced features contain abundant inter-variable dependence relationships and timestep dependence relationships in each timestep. The spliced features are then operated by this fully connected layer, allowing the feature dimension of each timestep to reduce while coupling the above-mentioned dependence relationships, facilitating the implementation of simultaneous multi-variable prediction. This method predicts the future for three timesteps at each timepoint, with six feature dimensions in each timestep, including other variables except for the time dimension in the input multivariable.
2.2 The dense block
As shown in Figure 2, the input time series is modeled using a dense block, which employs a fully connected layer inside. This layer can establish the dependencies between each variable in the current timestep and other variables in the current timestep, as well as all variables in other timesteps. In the experiment, the model predicts the future three timesteps using feedforward prediction, with a feature dimension of six per timestep. The physical meaning is that the input variables include all variables except time.
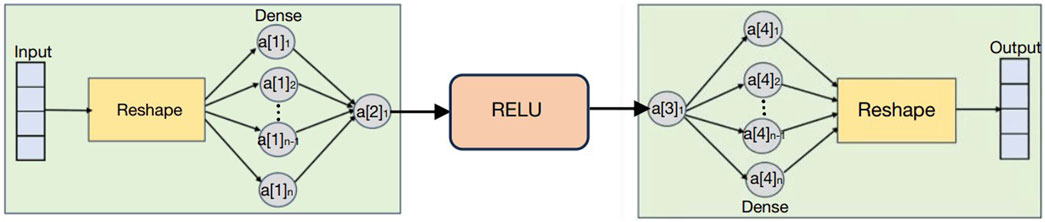
Figure 2. The dense block.
The introduction of the zLSTM is particularly critical for capturing long-term dependencies in the temporal dimension. This is of importance when dealing with tasks such as natural language processing or time series prediction, as these tasks often require understanding and remembering long-term contextual information. The role of the fully connected layer is reflected in its ability to effectively model the dependencies between multiple variables. In an input sequence, each timestep may contain multiple variables, and the fully connected layer is able to model the complex relationships between these variables.
In specific implementation, the model first converts the input sequence into a vector form through tensor shaping, where each element of the vector corresponds to one timestep of the input time series and all its variables. In this way, the model cannot only handle the relationship between variables, but also the dependencies between various timesteps. Next, the model uses a fully connected layer for feature dimension reduction, which converts the input vector into a new feature vector through linear transformation. Each element is a linear combination of all variables at all timesteps of the original input sequence. The purpose of this step is to increase the expressive power of the model, enabling it to capture more complex dependencies.
In addition, the application of rectified linear unit (ReLU) further enhances the nonlinear ability of the model, which is crucial for capturing complex data patterns. Finally, the model will up-scale the features processed by the second fully connected layer again and shape them into a sequence form, such that it can match the output feature size with that of the zLSTM.
Overall, the design combining zLSTM and the dense blocks improves the model ability to understand time series data, as well as enhancing its ability to model complex dependencies between multiple variables. This approach exhibits higher efficiency and accuracy when processing data with complex time dependencies and multivariable characteristics.
2.3 Output prediction sequence
After modeling the LSTM networks and dense blocks in the time dimension, as well as modeling the multivariable dependencies, the two obtained sequences are spliced in the feature dimension. At this time, for each timestep after splicing, the first half of the elements are features modeled by zLSTM, each element covering the dependencies between the multivariable in this time step and those in previous time steps. The second half of the elements are features modeled by the dense blocks, each element covering the dependencies between all timesteps of the input sequence. The obtained spliced features are coupled in the feature dimension using a fully connected layer for multivariable dependencies, and dimensionality reduction is performed in the feature dimension to simultaneously predict multiple variables in subsequent time steps. In this paper, each prediction is made for three timesteps, and the feature dimension for each timestep is six, which physically means predicting variables other than time in the input variables. The predicted sequence containing three timesteps is compared with its corresponding true value using mean square error (MSE) for backpropagation, and Adam (Adaptive Moment Estimation Algorithm) optimizer is used for training to make the model continuously fit the sequence in the prediction time window.
2.4 Model building process
The zLSTM neural network training process is similar to the traditional LSTM network. First, the initialization of the parameters and the model accuracy calculation are performed through the loss function. If the required accuracy is not achieved, the parameters need to be updated. The update criterion for weights and bias terms is to make them minimize the loss of the specified objective function in the training samples. This involves derivation of the parameters through a loss function to obtain gradient information, and updating the parameters in conjunction with the model learning rate. Usually, an appropriate optimization algorithm to update the gradient is demanded. By repeating this process until the gradient reaches the required accuracy, the model parameters can be determined, the zLSTM model is completed, and then applied to prediction or classification tasks.
The process of building the model is mainly divided into two parts: building the zLSTM model and the fully connected block. Among them, zLSTM is the main sequence modeling tool, and the fully connected block is responsible for extracting effective features. The parameter settings are listed in Table 1. In the forward propagation function, the input is reshaped, the encoder and ReLU activation functions are applied, and the input data is passed through the zLSTM layer for sequence modeling, and finally the output of the zLSTM is combined with the result of the fully connected block in the last dimension splicing, and then passing through the linear layer to obtain the final prediction result.

Table 1. Parameter settings of zLSTM.
3 Experiments and analysis
The verification experiments are designed and conducted after obtaining a trained prediction model. Results analysis is then performed to demonstrate the functionality and advantage of the proposed multivariate-coupling prediction method.
3.1 Datasets
The data used in this work is from an industrial-grade nuclear power simulation platform (Sun et al., 2017). The LOCA simulations in this paper are conducted at 98% reactor power. The chosen break sizes are 0.9 cm2, 1.0 cm2, and 2.0 cm2. Each sample data uses six features.
1. Pressurizer water level;
2. Coolant average temperature;
3. No.1 steam generator water level;
4. No.2 steam generator water level;
5. Loop 1 coolant flowrate;
6. Loop 2 coolant flowrate;
The dataset preprocessing involves handling time-series data, including loading, splitting, and normalizing the data, which provides preparatory work for subsequent model training. The dataset preprocessing first requires defining various parameters, including data file paths, feature columns, sliding window size, and prediction steps, which will affect the construction, filtering, and processing of the dataset. Next is the normalization of the training and testing dataset, ensuring that the data are all within the same scale range, which helps improve the effectiveness and stability of model training. Normalization involves calculating the maximum and minimum values of each feature and linearly scaling the data, mapping the data to the range [0,1]. Here, a sliding window size of 5 and a prediction step of three are considered to ensure that each sample has enough historical data for prediction.
3.2 Performance metrics
Mean square error (MSE) and Mean Absolute Error (MAE), as indicated by Eqs 8, 9, are chosen as the performance metrics to evaluate the multivariate-coupling prediction method.
where
3.3 Parameter configurations
To verify the effectiveness of the zLSTM model, this paper trains both the zLSTM model and the LSTM model using the same experimental parameter settings, maintaining a basically consistent network structure. The dataset is divided into training and testing sets with a ratio of 4:1, the learning rate is set to 0.00008, the number of hidden layer units is 256, and the β value in the zigmoid function is set to 1.0.
3.4 Experiment results
Six target variables are tested under three different break sizes as mentioned in Section 3.1, including the pressurizer water level, average coolant temperature, water level of steam generator 1, water level of steam generator 2, coolant flow rate of loop 1, and coolant flow rate of loop 2. The predicted LOCA progresses are plotted in Figures 3–5. The predicted values are compared with the true values to calculate their MAE and MSE. The results are shown in Table 2.

Figure 3. LOCA prediction for 0.9 cm2 break size.
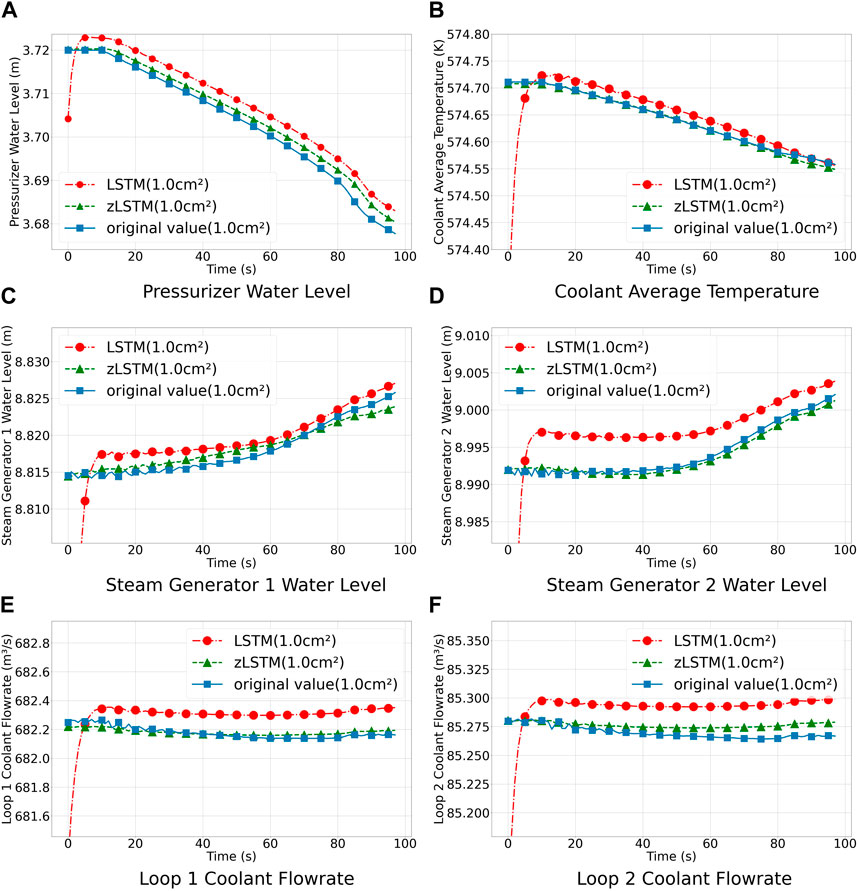
Figure 4. LOCA prediction for 1.0 cm2 break size.
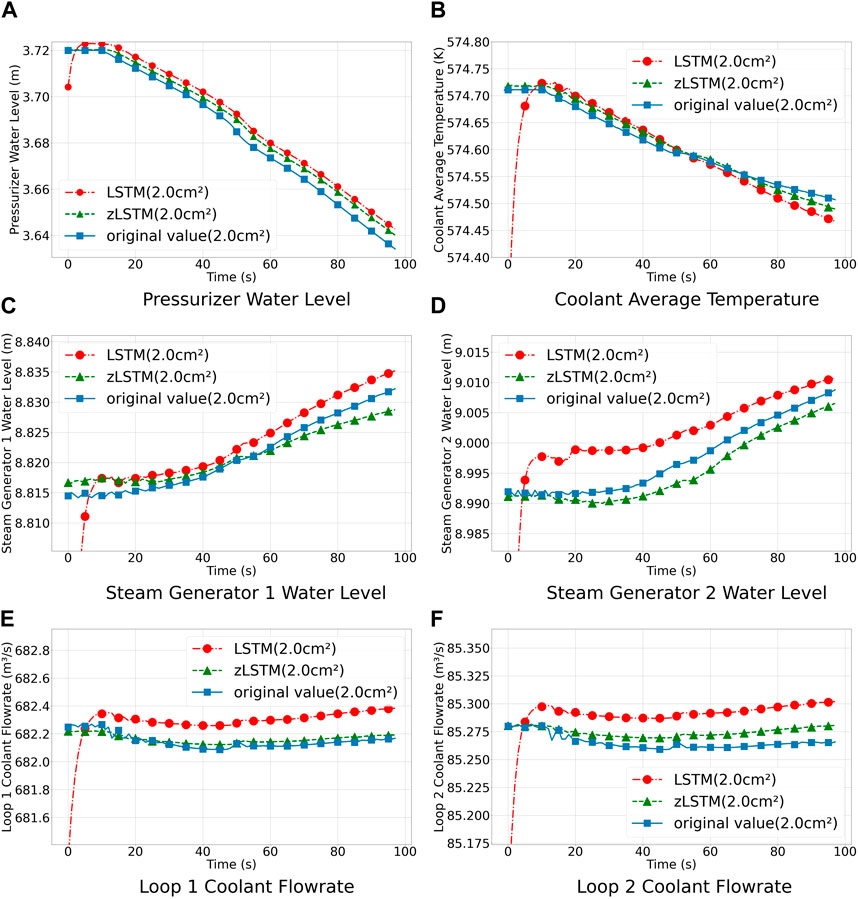
Figure 5. LOCA prediction for 2.0 cm2 break size.
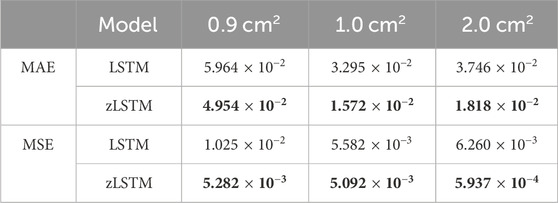
Table 2. The prediction results under different break size.
3.5 Results analysis
As seen in Table 2, the zLSTM model performs better than the LSTM model in terms of MAE and MSE across different break sizes. For instance, the average MAE of zLSTM is 0.016 lower than that of LSTM, representing a 35.84% improvement in accuracy. Similarly, the average MSE of zLSTM is 0.0052 lower than LSTM, indicating a 71.10% increase in accuracy. This is due to the larger distal gradient of the zigmoid function compared to sigmoid, allowing the model to learn from longer input sequences over the entire time series, enhancing long-term memory performance, and enabling it to capture more distant and effective information. Moreover, the multivariate-coupling method generates the prediction with a consideration of the dependencies among the six critical system parameters, which requires stronger processing capability for larger and longer time series. LSTM, as a variation of RNN, cannot precisely handle such a calculation task, giving zLSTM an opportunity to demonstrate its advantage in dealing with multivariate-coupling calculations.
Figures 3–5 demonstrate the prediction results for the chosen six target variables under different break sizes. The LOCA occurs at the 10-s mark in the figures. As shown, the LSTM model deviates significantly from the true values during the initial prediction phase, whereas the zLSTM model more closely aligns with them. This further confirms that the larger distal gradient of the zigmoid function allows for better capturing of the initial system state during a LOCA. Secondly, the zLSTM model consistently approximates the true values of the target variables throughout the prediction process, while LSTM exhibits larger deviations. For instance, in the case of the pressurizer water level, the zLSTM model accurately captures the decreasing water level after the LOCA incident, whereas the LSTM model underestimates the magnitude of the change. These results suggest that the zLSTM model is more stable and flexible compared to LSTM, adapting well to different prediction requirements. In terms of Loop 1 Coolant flowrate, both LSTM and zLSTM experienced a continuous decrease in flow when accidents occurred. Subsequently, zLSTM effectively responded to these sudden changes, while LSTM maintained a stable and smooth trend in flow. Compared to LSTM, the zLSTM model demonstrated greater stability and flexibility, being capable of adapting well to various forecasting needs and system conditions. Additionally, in the case of small-break LOCA, the rate of coolant loss is slower compared to large breaches, resulting in a delayed detection time for the system. Once the system detects the fault, it initiates the emergency water replenishment system to lower the temperature and pressure, leading to more significant flow variations in small breaks and increasing prediction errors.
4 Conclusion
In this paper, an attempt is made to apply the zLSTM, which exhibits stronger long-term memory capabilities, to multivariate prediction in LOCA accident scenarios. Based on the computational characteristics of zLSTM, a multivariate-coupling prediction model is constructed to capture the dependencies among multiple critical LOCA parameters. In simulation experiments targeting typical LOCA cases, the zLSTM model, equipped with multivariate coupling computational abilities, significantly outperforms the traditional univariate LSTM model in terms of accuracy metrics (such as MAE/MSE) across different break sizes. Additionally, by fully considering the dependencies among multiple relevant system parameters, the zLSTM model can more realistically capture parameter variations in LOCA accident scenarios. This not only enhances prediction accuracy but also better represents the trend of operational condition changes. This has positive implications for improving the accuracy of LOCA accident safety analysis. Future research will focus on addressing the issue of reduced prediction accuracy during drastic operational condition changes by exploring more refined model architectures and approximation methods to enhance the precision of the entire prediction process.
Data availability statement
The original contributions presented in the study are included in the article/Supplementary Material, further inquiries can be directed to the corresponding author.
Author contributions
XL: Investigation, Methodology, Validation, Writing–original draft. XC: Data curation, Formal Analysis, Software, Writing–original draft. JS: Conceptualization, Funding acquisition, Methodology, Project administration, Resources, Supervision, Writing–review and editing. YZ: Data curation, Formal Analysis, Software, Writing–original draft. TW: Data curation, Formal Analysis, Writing–review and editing.
Funding
The author(s) declare that financial support was received for the research, authorship, and/or publication of this article. The authors would like to thank the National Key Research and Development Project (2020YFB1713400) of the Ministry of Science and Technology, China for financial support.
Acknowledgments
The authors would like to thank both the Central Research Institution of the State Power Investment Co. Ltd. (SPIC) and China Guangdong Nuclear (CGN) Research Institution Co. Ltd. for technical support.
Conflict of interest
Author YZ was employed by Research Institute of China Electronic Technology Group Corporation.
Author TW was employed by Beijing Zhongbao Network Shield Technology Co., Ltd.
The remaining authors declare that the research was conducted in the absence of any commercial or financial relationships that could be construed as a potential conflict of interest.
Publisher’s note
All claims expressed in this article are solely those of the authors and do not necessarily represent those of their affiliated organizations, or those of the publisher, the editors and the reviewers. Any product that may be evaluated in this article, or claim that may be made by its manufacturer, is not guaranteed or endorsed by the publisher.
Supplementary material
The Supplementary Material for this article can be found online at: https://www.frontiersin.org/articles/10.3389/fnuen.2024.1386540/full#supplementary-material
References
Bingzheng, K. E., Gao, P., Wang, Bo, Chen, B., Wen, J., and Ruifeng, TIAN (2020). Numerical study on influence of blowdown parameter on coolant blowdown characteristic in LOCA. Atomic Energy Sci. Technol. 54 (10), 1858–1865. doi:10.7538/yzk.2019.youxian.0687
Fukun, C., Xiaomeng, D., and Yicheng, L. (2022). “GRU-CNN-Based prediction of LOCA accident condition in nuclear power plants,” in 2022 4th International Conference on System Reliability and Safety Engineering (SRSE), Guangzhou, China, December, 2022, 174–179.
Gong, S., Yang, S., She, J., Li, W., and Lu, S. (2022). Multivariate time series prediction for loss of coolant accidents with a zigmoid-based LSTM. Front. Energy Res. 10. doi:10.3389/fenrg.2022.852349
Kollias, D., and Zafeiriou, S. (2020). Exploiting multi-CNN features in CNN-RNN based dimensional emotion recognition on the OMG in-the-Wild dataset. IEEE Trans. Affect. Comput. 12, 595–606. doi:10.1109/TAFFC.2020.3014171
Koo, Y. D., Na, M. G., Kim, K.-S., and Kim, C.-H. (2018). “Prediction of nuclear reactor vessel water level using deep neural networks,” in 2018 International Conference on Electronics, Information, and Communication (ICEIC), Honolulu, HI, USA, January, 2018, 1–3.
Li, Y., He, X., Zhang, Y., and Ji, S. (2019). Effects of 1-D and 2-D heat conduction models on LOCA accident. Appl. Energy Technol. (3), 34–38. doi:10.3969/j.issn.1009-3230.2019.03.011
Liu, M., Wang, L., and Lee, Y. (2021). Diagnosis of break size and location in LOCA and SGTR accidents using support vector machines. Prog. Nucl. Energy 140, 103902. doi:10.1016/j.pnucene.2021.103902
Radaideh, M. I., and Kozlowski, T. Analyzing nuclear reactor simulation data and uncertainty with the group method of data handling. Nucl. Eng. Technol., 2020, 52(2): 287–295. doi:10.1016/j.net.2019.07.023
Saxena, A. K., Limaye, S. P., and Bhaumik, P. K. (2010). “Severe accident management,” in 2010 2nd International Conference on Reliability, Safety and Hazard - Risk-Based Technologies and Physics-of-Failure Methods (ICRESH), Mumbai, India, December, 2010, 611–614.
She, J. K., Wang, J. N., Yang, S. Y., and Xue, S. Y. (2021). “The design and implementation of an LSTM-based steam generator level prediction model,” in SICPNPP 2020. Lnee. Editors Y. Xu, Y. Sun, Y. Liu, F. Gao, P. Gu, and Z. Liu (Singapore: Springer), 505–517.
She, J. K., Xue, S. Y., Sun, P. W., and Cao, H. S. (2020). “The application of LSTM model to the prediction of abnormal condition in nuclear power plants,” in SICPNPP 2019. Lnee. Editors Y. Xu, Y. Sun, Y. Liu, Y. Wang, P. Gu, and Z. Liu (Singapore: Springer), 463–476.
Sun, P., Zhao, H., Liao, L., Zhang, J., and Su, G. (2017). Control system design and validation platform development for small pressurized water reactors (SPWR) by coupling an engineering simulator and MATLAB/Simulink. Ann. Nucl. Energy 102, 309–316. doi:10.1016/j.anucene.2016.12.034
Yu, W., Yu, R., and Cheng, Li (2022). An information granulated based SVM approach for anomaly detection of main transformers in nuclear power plants. Sci. Technol. Nucl. Installations 2022, 1–11. doi:10.1155/2022/3931374
Keywords: multivariate coupling, LOCA prediction, zLSTM, deep learning, nuclear power accident
Citation: Li X, Chen X, She J, Zhang Y and Wang T (2024) Multivariate-coupling LOCA prediction using zLSTM. Front. Nucl. Eng. 3:1386540. doi: 10.3389/fnuen.2024.1386540
Received: 15 February 2024; Accepted: 01 May 2024;
Published: 30 May 2024.
Edited by:
Jian Deng, Nuclear Power Institute of China (NPIC), ChinaReviewed by:
Yandong Hou, Northeast Electric Power University, ChinaLuteng Zhang, Chongqing University, China
Copyright © 2024 Li, Chen, She, Zhang and Wang. This is an open-access article distributed under the terms of the Creative Commons Attribution License (CC BY). The use, distribution or reproduction in other forums is permitted, provided the original author(s) and the copyright owner(s) are credited and that the original publication in this journal is cited, in accordance with accepted academic practice. No use, distribution or reproduction is permitted which does not comply with these terms.
*Correspondence: Jingke She, shejingke@hnu.edu.cn