An assessment of PET and CMR radiomic features for detection of cardiac sarcoidosis
 Nouf A. Mushari1*
  Georgios Soultanidis2
  Lisa Duff1,3
  Maria G. Trivieri2,4
  Zahi A. Fayad2 Philip Robson2
  Charalampos Tsoumpas1,2,5
- 1Leeds Institute of Cardiovascular and Metabolic Medicine, University of Leeds, Leeds, United Kingdom
- 2BioMedical Engineering and Imaging Institute, Icahn School of Medicine at Mount Sinai, New York, NY, United States
- 3Beatson Institute for Cancer Research, University of Glasgow, Glasgow, United Kingdom
- 4Cardiovascular Research Institute, Icahn School of Medicine at Mount Sinai, New York, NY, United States
- 5Department of Nuclear Medicine and Molecular Imaging, University Medical Centre Groningen, University of Groningen, Groningen, Netherlands
Background: Visual interpretation of PET and CMR may fail to identify cardiac sarcoidosis (CS) with high specificity. This study aimed to evaluate the role of [18F]FDG PET and late gadolinium enhancement (LGE)-CMR radiomic features in differentiating CS from another cause of myocardial inflammation, in this case patients with cardiac-related clinical symptoms following COVID-19.
Methods: [18F]FDG PET and LGE-CMR were treated separately in this work. There were thirty-five post-COVID-19 (PC) and forty CS datasets. Regions of interest were delineated manually around the entire left ventricle for PET and LGE-CMR datasets. Radiomic features were then extracted. The ability of individual features to correctly identify image data as CS or PC was tested to predict clinical classification of CS vs. PC using Mann–Whitney U-tests and logistic regression. Features were retained if P-value <0.00053, AUC >0.5 and accuracy >0.7. After applying correlation test, uncorrelated features were used as a signature (joint features) to train machine learning classifiers. For LGE-CMR analysis, to further improve the results, different classifiers were used for individual features besides logistic regression and the results of individual features of each classifier were screened to create a signature that include all features that followed the previously mentioned criteria and use them as input for machine learning classifiers.
Results: The Mann–Whitney U-tests and logistic regression were trained on individual features to build a collection of features. For [18F]FDG PET analysis, the maximum target-to-background ratio (TBRmax) showed high area under the curve (AUC) and accuracy with small P-values (<0.00053) but the signature performed better (AUC 0.98 and accuracy 0.91). For LGE-CMR analysis, Gray Level Dependence Matrix (gldm)-Dependence Non-Uniformity showed good results with small error bars (accuracy 0.75 and AUC 0.87). However, by applying a Support Vector Machine classifier on individual LGE-CMR features and creating a signature, a Random Forest classifier displayed better AUC and accuracy (0.91 and 0.84, respectively).
Conclusion: Using radiomic features may prove useful in identifying individuals with CS. Some features showed promising results to differentiate between PC and CS. By automating the analysis, the patient management process can be accelerated and improved.
1 Introduction
Cardiac sarcoidosis (CS) is a granulomatous inflammatory disease that can be diagnosed with [18F]-fluorodeoxyglucose positron emission tomography ([18F]FDG PET). [18F]FDG PET is performed in suspected CS due to the avid uptake of glucose by the active inflammation cells in sarcoid granulomas. It is recommended that a low-carbohydrate, high-fat diet followed by fasting be used to inhibit the physiologic glucose metabolism of the heart to enable diagnostic imaging. Moreover, a cardiac PET with abnormal [18F]FDG uptake on suppressed myocardial uptake is crucial to CS diagnosis (1). A PET image can also be used to quantify inflammation in addition to a visual review. Several metrics exist to describe the intensity and heterogeneity of [18F]FDG uptake. PET is less specific for CS when there is no extracardiac uptake (2). In addition, it is critical to note that approximately 25% of cardiac PET studies fail due to the inadequate suppression of physiologic glucose uptake (3).
Conversely, cardiovascular magnetic resonance (CMR) is a non-invasive imaging technique that plays a significant role in diagnosing or screening patients with CS. It can detect scar tissue that may indicate inactive CS (4). Myocardial scarring can be evaluated using late gadolinium enhancement (LGE) imaging. Gadolinium is an extracellular contrast agent that demonstrates a slow washout in fibrotic regions compared to the normal myocardium. Although LGE is helpful for identifying CS, based on the LGE distribution and pattern (5, 6), it is a non-specific tool. In addition, LGE-CMR has limited sensitivity prior to myocardial scar development (7).
Moreover, [18F]FDG PET can detect the inflammation related to CS, which theoretically leads to its early diagnosis (8). On the other hand, CMR with LGE is capable of identifying myocardial scarring even in small areas, owing to its high spatial resolution. The specificity of CMR in diagnosing CS might be higher than [18F]FDG PET, however, both have high sensitivity (9). There is controversy among studies regarding the identification of the appropriate technique for diagnosing CS (10–13). Similarly, the feasibility of combining the findings of both [18F]FDG PET and LGE-CMR has not been adequately explored and could enhance the accuracy of the assessment owing to the identification of different pathologic features.
Additionally, it may be possible to gain additional information by employing quantitative measurements that may supply complementary information greater than that provided by non-invasive methods (14). A method of analyzing imaging data uses radiomics to automatically extract high-dimensional features. Subsequently, researchers can mine and analyze these features to support decision making (15, 16). First-order statistical features comprise properties based on histograms (HISTO). Regardless of the spatial relationship between the voxels, these features are based on the shape of the histogram and discern statistical values of the voxel intensities (17, 18). Statistical inter-relationships between neighboring voxels are calculated using second-order statistical features, which can be derived from the gray-level cooccurrence matrix (GLCM) (17). In addition, areas with coarser textures can be extracted using higher-order statistical features (19). They are derived from the gray level run length matrix (GLRLM), gray level dependence matrix (GLDM), gray level size zone matrix (GLSZM), and neighboring gray tone difference matrix (NGTDM).
Correspondingly, this work investigates the precision of PET and CMR radiomic features in differentiating CS from another cause of myocardial inflammation, in this case, patients with cardiac-related symptoms following COVID-19, or post-COVID-19 (PC) patients. Myocardial inflammation can be a symptom observed in some PC patients. The severity and prevalence of myocardial inflammation may vary among individuals, and it is one of the potential complications associated with COVID-19. It is important to note that not all PC patients will experience myocardial inflammation, and the manifestation of symptoms can vary widely (20).
2 Materials and methods
2.1 Ethical approval
This study was conducted with the approval of the Institutional Review Board at Mount Sinai Hospital (GCO # 01-1032). All the subjects supplied their written informed consent.
2.2 Subject selection
Both PET and CMR imaging were performed at Mount Sinai Hospital in New York on two types of patients: patients suspected of having cardiac sarcoidosis based on extracardiac disease and cardiac symptoms, as well as PC patients. The majority of the CS cohort predates the COVID-19 era, ensuring that these patients did not exhibit post-COVID-19 symptoms. CS diagnosis is consistent with the Heart Rhythm Society (HRS) expert consensus statement (10). PC patients had either chest pain, palpitations, or shortness of breath following COVID-19 that could not be attributed to another cause. This retrospective study encompassed CS and PC patients exhibiting abnormal FDG uptake in the myocardium that were evaluated by a cardiologist who is an expert in the use of PET/MR to diagnose cardiomyopathies. Exclusions were made for individuals with renal dysfunction, insulin-dependent diabetes, blood glucose levels exceeding 200 mg/dl, pregnant or lactating individuals, and those with cardiac pacemakers or automatic implantable cardioverter-defibrillators. In preparation for the scan, the patient was required to abstain from carbohydrate consumption for 24 h and fast for 12 h. Initially, there were 90 suspected PC patients and 69 patients with CS. However, for the purpose of this study, only cases with myocarditis were included. Therefore, the study included thirty-five datasets from PC patients and forty datasets from patients with CS, as summarized in Figure 1. The demographic information of the patients is provided in Table 1.

Figure 1. A flowchart of datasets selection.

Table 1. Demographic information of the study population.
2.3 Imaging protocol
An integrated PET/MR system was used to perform simultaneous CMR and [18F]FDG PET (Biograph™ mMR, Siemens Healthcare, Erlangen, Germany). An intravenous injection of [18F]FDG containing 5 MBq/kg was given to the patients. Acquisition of thoracic PET (one-bed position centered on the heart) takes approximately 90 min to scan the patients in two phases (blood and tissue phases). However, for the purpose of this study, only the last 60 min of the time window were chosen because the focus of this study specifically centers on the tissue phase. Iterative ordinary Poisson ordered subset expectation maximization (OP-OSEM) was used to reconstruct PET images over a 344 × 344 × 129 image matrix with 3 iterations, 21 subsets and 2 mm isotropic voxels, followed by post-filtering using a Gaussian kernel of 4 mm. A PET study was neither respiratory-gated nor electrocardiogram (ECG)-gated, and no motion correction was carried out. Attenuation correction was performed using a 3D breath-hold Dixon-based MR image. Parallel to the PET scan, CMR was performed with ECG triggering covering the whole left ventricle. Inversion-recovery gradient-echo LGE sequences were acquired across the entire myocardium approximately 15 min after injection of 0.2 mmol/kg gadolinium-based contrast agent (MultiHance, Bracco, NJ) with 8 mm slice thickness and 10 mm spacing between slices. Bias correction was not performed in CMR images.
2.4 Segmentation
3D slicer software (Version 4.11.2; https://www.slicer.org) was used for the segmentation (21, 22). Regions of interest (ROI) were drawn manually in the entire left ventricular myocardium for both [18F]FDG PET and LGE-CMR images by a junior radiographer and reviewed by a Biomedical Engineering expert with 10 years of experience in Medical Imaging. This approach is less likely to be influenced by the intensity and experience of observers compared to the hot regions-only segmentation. The hot regions-only segmentation may exhibit bias and result in unreliable outcomes during testing in our prior study (23). Figure 2 provides an illustrative example of the segmentation on PET/CMR image. Subsequently, radiomic features were extracted.

Figure 2. An example of the segmentation on PET/CMR image.
To calculate the maximum target-to-background ratio (TBRmax) in PET images, the standardized uptake value (SUVmax) was extracted, and another ROI was drawn in the blood pool to extract the (SUVmean) of the background and then follow the following equation (1):
2.5 Feature extraction
PyRadiomics (Version 3.0.1) was used to extract six feature classes (94 features in total) from the PET/CMR images (24). A list of all radiomic features is shown in Supplementary Material S1. PyRadiomics adheres to most of the image biomarker standardization initiative (IBSI) feature definitions. In the case of PET images, a fixed bin size of 0.075 was utilized, this gave a good number of bins and a good representation of the data. However, in LGE-CMR images, the default fixed bin size of 25 was used. The impact of gray-level discretization on extracted feature values from PET images has been well-documented (25). Nevertheless, there is limited research exploring the effect of gray-level discretization on clinical MR images. According to Duron et al. (26), an experimental study aimed at examining the impact of gray-level discretization on the reproducibility of texture features from MR images, it was found that utilizing different fixed bin sizes had a minimal effect on the variability of these features. The PET images were subjected to SUV normalization. Since the datasets were obtained from a single scanner, pre-processing (except post-filtering using a Gaussian kernel in reconstruction process in PET images) and harmonization were not performed. The feature extraction was conducted in 3D, as it provides more informative results compared to 2D analysis. In addition, to mitigate the risk of overfitting caused by limited data, the models were not optimized.
2.6 Statistical analysis
Statistical analyses were undertaken using the Scikit-learn software (Version 0.23.2) (27). The individual radiomic features of the study groups were compared using Mann-Whitney U test to assess their ability to separate CS from PC. In addition, Bonferroni correction was used to adjust the P-value for multiple tests. According to the significance level of 0.05, and with 94 features, the corrected P-value was <0.00053. The radiomic features were then trained and tested using logistic regression classifiers. This analysis used stratified five-fold cross-validation to obtain the mean area under the curve (AUC), mean accuracy, and 95% confidence intervals (CIs). An AUC >0.5 and an accuracy >0.7 were considered acceptable for the retention of features with a P-value of less than 0.00053. When 0.5 < AUC < 1, there is a high chance that the feature will be able to distinguish the positive class values from the negative ones. In addition, accuracy >0.7 can be considered as a decent score. Subsequently, Spearman correlation was used to detect the correlated features with 0.70 correlation coefficient. This threshold was selected because higher thresholds indicate a strong resemblance between the two features, with at least half of their variance being shared. Of these correlated features, the feature with the highest AUC was retained. Following that, the uncorrelated features where then used as input for machine learning classifiers to create a signature (joint features). In LGE-CMR features, to find a classifier that can provide high values of AUC and accuracy, other classifiers besides logistic regression were explored. The retained features were then used as input for machine learning classifiers. The selection of the top-performing machine learning classifier was based on the highest mean AUC and mean accuracy values from stratified five-fold cross-validation. Due to the small sample size in this study, only the training cross-validation outcomes were documented. This approach has been recommended in situations where the sample size is insufficient to support an independent validation set (28). By using cross-validation, the potential overestimation of the model's performance was reduced. The workflow of the statistical analysis is illustrated in Figure 3. In this study, the PET and CMR datasets were analyzed separately, enabling a more focused investigation of the specific features and characteristics inherent to each modality. This approach yields valuable insights into the individual contributions of PET and CMR, enhancing the understanding of the subject under investigation.

Figure 3. Statistical analysis workflow.
3 Results
3.1 Individual features assessment
The univariate analysis of individual features in each dataset revealed that [18F]FDG PET and LGE-CMR data had 5 features and 11 features, respectively, with P-values <0.00053. For all datasets, Table 2 demonstrates the five best radiomic features based on the P-values.

Table 2. Five best radiomic features based on the P-values.
3.2 Feature selection
The logistic regression was applied on individual features. [18F]FDG PET and LGE-CMR datasets had only three and five features, respectively, conforming to the inclusion criteria (P-value <0.00053, AUC >0.5 and accuracy >0.7). Those features that met the inclusion criteria were again screened based on correlation. To detect the correlated features, a correlation test was conducted. Features with a higher AUC were retained. The number of selected features in the PET and LGE-CMR features decreased to two uncorrelated features for each one. Table 3 presents AUC and accuracy values, along with their corresponding 95% CI, for the uncorrelated features in each dataset. Scrutinizing PET features in greater detail, TBRmax conveyed high AUC and accuracy with relatively small confidence intervals while glszm_Zone Variance had acceptable values but with large confidence intervals. Creating a signature using these uncorrelated features as input for machine learning classifiers improved the performance. Random Forest was the best one (95% CI AUC 0.95–1.00: accuracy 0.83–0.99). The performance of all machine learning classifiers is displayed in Table 4.
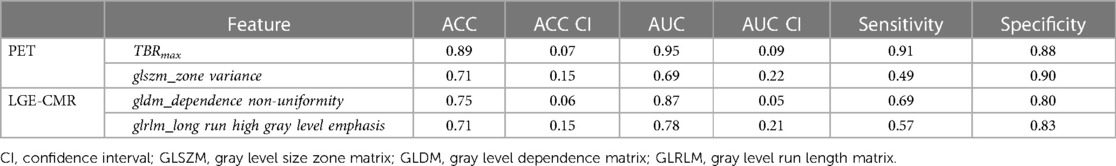
Table 3. Areas under the curve (AUCs) and accuracies (ACC) of uncorrelated features.
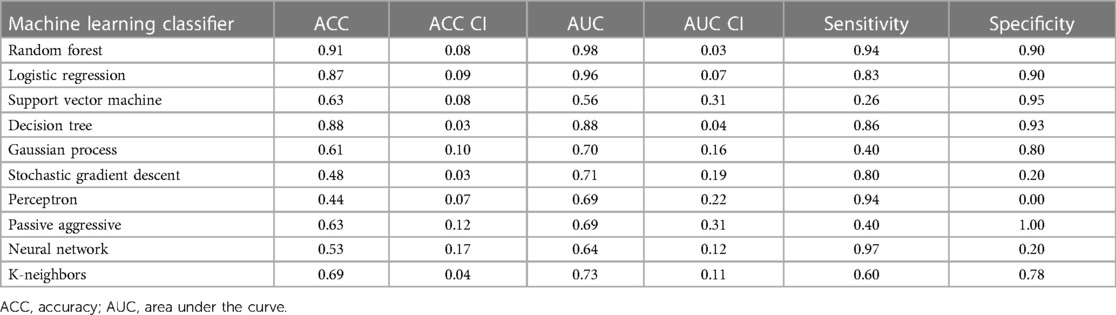
Table 4. The machine learning classifiers performance of PET joint features with 95% confidence intervals (CI).
For LGE-CMR features, gldm_Dependence Non-Uniformity presented good AUC and accuracy (95% CI AUC 0.82–0.92: accuracy 0.69–0.81). Examples of PET and CMR images for CS and PC with the related features are shown in Figure 4. However, to further improve the AUC and accuracy findings of LGE-CMR, additional measures were taken. After applying many other classifiers besides logistic regression, Support Vector Machine showed six features following the criteria, Table 5. The total number of features were not normalized before applying Support Vector Machine because the focus was on the relative relationships between the data points rather than their absolute values or scales. Additionally, normalization had the potential to modify the original distances and influence the underlying relationships within the data, which are crucial for distance-based algorithms. The retained features were used as input for machine learning classifiers, and Random Forest proved to have the greatest AUC and accuracy values (95% CI AUC 0.82–1.00: accuracy 0.73–0.95). The machine learning classifiers performance for joint features are shown in Table 6.

Figure 4. Two cases of PET/CMR cardiac sarcoidosis (CS) and one case of post-COVID-19 (PC) associated with the best-performance features. PET/CMR CS (case 1) has significantly lower values than PC values, whereas (case 2) has values within the range of PC patients’ values, potentially leading to a misdiagnosis. Display intensity of PET images is from 0 to 6.
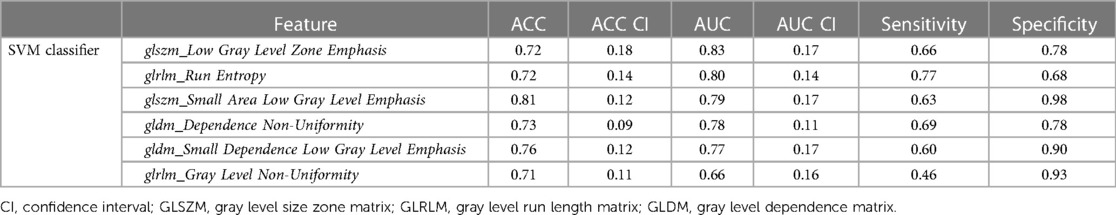
Table 5. Areas under the curve (AUCs) and accuracies (ACC) of uncorrelated features using the support vector machine (SVM) that used to create a CMR signature.
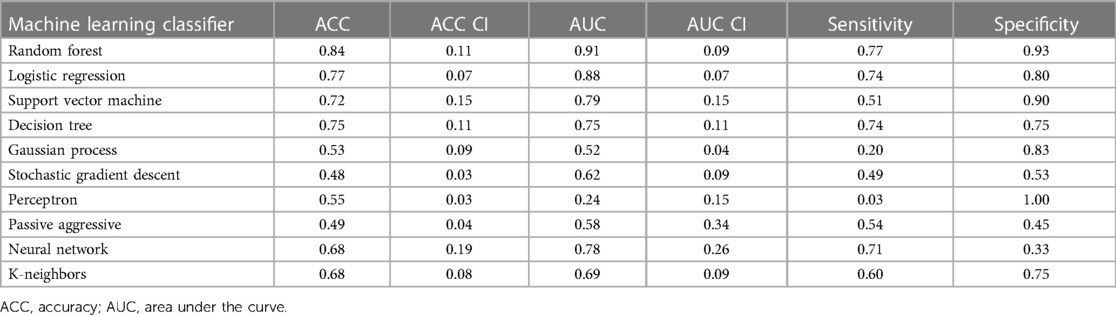
Table 6. The machine learning classifiers performance of LGE-CMR joint features with 95% confidence intervals (CI).
4 Discussion
CS is an inflammatory disease with an unknown cause. To aid in the diagnostic process, advanced imaging techniques like [18F]FDG PET and LGE-CMR are recommended. [18F]FDG PET is utilized in suspected CS cases due to its ability to detect glucose uptake by active inflammatory cells in sarcoid granulomas while LGE-CMR can identify scar tissue that may indicate inactive CS. However, both techniques have limitations that contribute to their lack of specificity for CS. This study focused on investigating the potential of [18F]FDG PET and LGE-CMR radiomic features in differentiating CS from other causes of myocardial inflammation, specifically in patients with post-COVID-19 symptoms related to the heart.
After applying several steps to filter the radiomic features of PET images, TBRmax succeeded in being the best performed feature. TBRmax was able to discriminate about 90% of CS cases from PC cases. Most of the CS cases had a TBRmax range between 1 and 3 while PC cases had higher values. This result is supported by other studies that revealed similar range values of TBRmax in CS patients, which were between 1 and 3 (12, 23). To some extent, TBRmax can make fair comparisons between institutions by looking at the equation of extracting their values, which essentially means a blood uptake correction (29). Although TBRmax has successfully discriminated about 90% of cases, there is still about 10% of cases that have been misdiagnosed such as the TBRmax value of case 2 in Figure 4 which provided values that were approximately similar to those of PC patients. glszm_Zone Variance was the second-best performing feature but had significant error bars that made it unreliable. However, the PET features performance improved significantly after using joint features as input for machine learning classifiers, especially Random Forest classifier.
For the radiomic features of CMR images, gldm_Dependence Non-Uniformity presented acceptable results, but with some errors. About 67.5% of CS patients had values less than 88.5% of PC patients (average value in CS = 205.8, average value in PC = 323.4). This measure determines the degree of similarity of dependence within an ROI (24). Therefore, the higher values of gldm_Dependence Non-Uniformity indicate a greater level of heterogeneity. As an interpretation of the values of each group, CS appears to have a lower variance than PC. However, it is recommended that this feature should be interpreted cautiously because it may contain errors especially for CS group, as third of CS patients had values similar to the majority of PC patients. In Figure 4, there was a big difference between the feature values in the first and second cases, and the second case even gave higher values than the PC patient value.
One of the approaches followed to augment the performance of the LGE-CMR features is creating a signature (joint features) that includes all the uncorrelated features with the best AUCs and good accuracies. This step was applied to the output of the logistic regression as well as other classifiers. The signature from the Support Vector Machine illustrated great results and ameliorated the findings compared to the individual features. The individual feature of LGE-CMR dataset from logistic regression, gldm_Dependence Non-Uniformity, had lower AUC but smaller confidence intervals than when using the signature. Employing the joint features gives only a little advantage in making it the superior choice for LGE-CMR dataset classification.
In our previous study (23), it was found that gldm_Dependence Non-Uniformity emerged as one of the top features in PET images for distinguishing between CS patients and controls. However, it exhibited larger error bars compared to TBRmax indicating greater variability in its measurements. In contrast, the evaluation of LGE-CMR radiomic features to differentiate between active CS and inactive CS (4) yielded different top features compared to the current study. This discrepancy can be attributed to the distinct types of comparisons conducted in each study, as well as slight variations in the methodology employed. These alterations resulted in improved outcomes of the analysis of LGE-CMR images. Radiomic analysis is affected by several factors that make the comparisons among studies are difficult. The findings across studies are not consistently replicated; instead, they often exhibit conflicting results (30, 31). This divergence in outcomes could potentially be attributed to technical factors. Efforts should be made to minimize variation up to the reconstruction step to ensure consistency. It is crucial to avoid introducing variation in factors that occur after reconstruction whenever possible. This entails making consistent choices, such as employing the same image segmentation algorithm and utilizing a uniform discretization scheme for all the data (32). In addition, the higher the resolution and number of voxels can impact certain radiomic features by inflating their values (33). By mitigating variability at these stages, the reliability and comparability of the results can be enhanced.
Several limitations are associated with this study. First, all studies evaluating patients with suspected CS have well-known limitations due to the absence of a standard for diagnosing the condition. However, it is possible to detect CS more effectively by combining data from both CMR and PET. This patient cohort routinely did not undergo endomyocardial biopsies. It is, however, difficult to rule out CS with an endomyocardial biopsy due to its low sensitivity and high sampling error rate because of its focal distribution (34). In addition, considering the size of the sample, further studies are needed to verify this conclusion to avoid overfitting and type I errors. This issue was reduced by applying the Bonferroni correction. Furthermore, validating the AI approach on a larger and diverse patient population as well as normal controls would indeed enhance the robustness and applicability of the results. Moreover, no automated segmentation was performed, and reference segmentation was not provided in this study.
The new knowledge gained from this study is that radiomic analysis can enhance the objectivity and complementarity of PET and CMR in identifying CS from PC. PET-based analyses could effectively differentiate CS from PC. The PET joint features demonstrated high performance that can be used alone without resorting to CMR. However, CMR-based analysis is helpful when PET images suffer from failed suppression of the physiological uptake of [18F]FDG in the myocardium (3). The results may vary from one institution to another due to different scanning procedures and protocols, and characteristics of each scanner. However, the methodology is straightforward and transferable to PET/CT-only and MRI-only studies.
5 Conclusion
This work adds to the growing evidence that radiomic analysis may assist [18F]FDG PET and LGE-CMR to precisely discern cardiac sarcoidosis with a specific focus on TBRmax. These features hold promise for heightening the accuracy of diagnoses. Nonetheless, more research is warranted to validate and refine these results and guarantee their wider clinical applicability.
Data availability statement
The original contributions presented in the study are included in the article/Supplementary Material, further inquiries can be directed to the corresponding author.
Ethics statement
The studies involving humans were approved by The Institutional Review Board at Mount Sinai Hospital (GCO # 01-1032). The studies were conducted in accordance with the local legislation and institutional requirements. The participants provided their written informed consent to participate in this study.
Author contributions
NM segmented all datasets using 3D slicer, analyzed the data using PyRadiomics, performed the statistical analysis, analyzed the results and wrote the manuscript. GS shared datasets, reviewed segmentations and helped in the guidance of the project. LD wrote python code and helped to modify it and provide essential guidance on how to perform the optimization of the radiomic analysis and machine learning approaches. MT facilitated the availability of data. MT, ZF, and PR contributed to reviewing the manuscript and the overall guidance of the project and data. CT supervised the specific study and helped in restructuring and reviewing the manuscript. The final version of the manuscript was thoroughly reviewed and approved by all co-authors.
Funding
The author(s) declare financial support was received for the research, authorship, and/or publication of this article.
NM studies are fully funded by Taif University, Saudi Arabia. GS and PR are supported by NIH grant R01HL071021. The data were acquired using this grant. ZAF is the PI of the NIH grant.
Conflict of interest
The authors declare that the research was conducted in the absence of any commercial or financial relationships that could be construed as a potential conflict of interest.
The authors declared that they were an editorial board member of Frontiers, at the time of submission. This had no impact on the peer review process and the final decision.
Publisher's note
All claims expressed in this article are solely those of the authors and do not necessarily represent those of their affiliated organizations, or those of the publisher, the editors and the reviewers. Any product that may be evaluated in this article, or claim that may be made by its manufacturer, is not guaranteed or endorsed by the publisher.
Supplementary material
The Supplementary Material for this article can be found online at: https://www.frontiersin.org/articles/10.3389/fnume.2024.1324698/full#supplementary-material
References
1. Lehtonen J, Uusitalo V, Pöyhönen P, Mäyränpää MI, Kupari M. Cardiac sarcoidosis: phenotypes, diagnosis, treatment, and prognosis. Eur Heart J. (2023) 44(17):1495–510. doi: 10.1093/eurheartj/ehad067
2. Divakaran S, Stewart GC, Lakdawala NK, Padera RF, Zhou W, Desai AS, et al. Diagnostic accuracy of advanced imaging in cardiac sarcoidosis: an imaging-histologic correlation study in patients undergoing cardiac transplantation. Circ Cardiovasc Imaging. (2019) 12(6):e008975. doi: 10.1161/CIRCIMAGING.118.008975
3. Osborne MT, Hulten EA, Murthy VL, Skali H, Taqueti VR, Dorbala S, et al. Patient preparation for cardiac fluorine-18 fluorodeoxyglucose positron emission tomography imaging of inflammation. J Nucl Cardiol. (2017) 24(1):86–99. doi: 10.1007/s12350-016-0502-7
4. Mushari NA, Soultanidis G, Duff L, Trivieri MG, Fayad ZA, Robson PM, et al. Exploring the utility of cardiovascular magnetic resonance radiomic feature extraction for evaluation of cardiac sarcoidosis. Diagnostics. (2023) 13(11):1865. doi: 10.3390/diagnostics13111865
5. Smedema J-P, Snoep G, van Kroonenburgh MP, van Geuns R-J, Dassen WR, Gorgels AP, et al. Evaluation of the accuracy of gadolinium-enhanced cardiovascular magnetic resonance in the diagnosis of cardiac sarcoidosis. J Am Coll Cardiol. (2005) 45(10):1683–90. doi: 10.1016/j.jacc.2005.01.047
6. Ichinose A, Otani H, Oikawa M, Takase K, Saito H, Shimokawa H, et al. MRI of cardiac sarcoidosis: basal and subepicardial localization of myocardial lesions and their effect on left ventricular function. Am J Roentgenol. (2008) 191(3):862–9. doi: 10.2214/AJR.07.3089
7. Nakamori S, Neisius U, Nezafat M, Jang J, Ngo LH, Rodriguez J, et al. Multiparametric mapping approach for detection of cardiac involvement in systemic sarcoidosis. Cardiovasc Imaging. (2020) 13(9):2058–60.
8. Skali H, Schulman AR, Dorbala S. 18 F-FDG PET/CT for the assessment of myocardial sarcoidosis. Curr Cardiol Rep. (2013) 15(4):370. doi: 10.1007/s11886-013-0370-6
9. Aggarwal NR, Snipelisky D, Young PM, Gersh BJ, Cooper LT, Chareonthaitawee P. Advances in imaging for diagnosis and management of cardiac sarcoidosis. Eur Heart J Cardiovasc Imaging. (2015) 16(9):949–58. doi: 10.1093/ehjci/jev142
10. Birnie DH, Sauer WH, Bogun F, Cooper JM, Culver DA, Duvernoy CS, et al. HRS expert consensus statement on the diagnosis and management of arrhythmias associated with cardiac sarcoidosis. Heart Rhythm. (2014) 11(7):1304–23. doi: 10.1016/j.hrthm.2014.03.043
11. Terasaki F, Yoshinaga K. New guidelines for diagnosis of cardiac sarcoidosis in Japan. Ann Nucl Cardiol. (2017) 3(1):42–5. doi: 10.17996/anc.17-00042
12. Dweck MR, Abgral R, Trivieri MG, Robson PM, Karakatsanis N, Mani V, et al. Hybrid magnetic resonance imaging and positron emission tomography with fluorodeoxyglucose to diagnose active cardiac sarcoidosis. JACC Cardiovasc Imaging. (2018) 11(1):94–107. doi: 10.1016/j.jcmg.2017.02.021
13. Vita T, Okada DR, Veillet-Chowdhury M, Bravo PE, Mullins E, Hulten E, et al. Complementary value of cardiac magnetic resonance imaging and positron emission tomography/computed tomography in the assessment of cardiac sarcoidosis. Circ Cardiovasc Imaging. (2018) 11(1):e007030. doi: 10.1161/CIRCIMAGING.117.007030
14. Rainey C, O'Regan T, Matthew J, Skelton E, Woznitza N, Chu K-Y, et al. An insight into the current perceptions of UK radiographers on the future impact of AI on the profession: a cross-sectional survey. J Med Imaging Radiat Sci. (2022) 53(3):347–61. doi: 10.1016/j.jmir.2022.05.010
15. Duff L, Scarsbrook AF, Mackie SL, Frood R, Bailey M, Morgan AW, et al. A methodological framework for AI-assisted diagnosis of active aortitis using radiomic analysis of FDG PET–CT images: initial analysis. J Nucl Cardiol. (2022) 29:1–17. doi: 10.1007/s12350-022-02927-4
16. Tingen HSA, van Praagh GD, Nienhuis PH, Tubben A, van Rijsewijk ND, Ten Hove D, et al. The clinical value of quantitative cardiovascular molecular imaging: a step towards precision medicine. Br J Radiol. (2023) 96(1152):20230704. doi: 10.1259/bjr.20230704
17. Rizzo S, Botta F, Raimondi S, Origgi D, Fanciullo C, Morganti AG, et al. Radiomics: the facts and the challenges of image analysis. Eur Radiol Exp. (2018) 2(1):1–8. doi: 10.1186/s41747-018-0068-z
18. Basran PS, Porter I. Radiomics in veterinary medicine: overview, methods, and applications. Vet Radiol Ultrasound. (2022) 63:828–39. doi: 10.1111/vru.13156
19. Gillies RJ, Kinahan PE, Hricak H. Radiomics: images are more than pictures, they are data. Radiology. (2016) 278(2):563. doi: 10.1148/radiol.2015151169
20. Srinivasan A, Wong F, Couch LS, Wang BX. Cardiac complications of COVID-19 in low-risk patients. Viruses. (2022) 14(6):1322. doi: 10.3390/v14061322
21. Fedorov A, Beichel R, Kalpathy-Cramer J, Finet J, Fillion-Robin J-C, Pujol S, et al. 3D slicer as an image computing platform for the quantitative imaging network. Magn Reson Imaging. (2012) 30(9):1323–41. doi: 10.1016/j.mri.2012.05.001
22. Kikinis R, Pieper SD, Vosburgh KG. 3D slicer: a platform for subject-specific image analysis, visualization, and clinical support. In: Jolesz FA, editor. Intraoperative Imaging and Image-Guided Therapy. New York, NY: Springer (2014). p. 277–89.
23. Mushari NA, Soultanidis G, Duff L, Trivieri MG, Fayad ZA, Robson P, et al. Exploring the utility of radiomic feature extraction to improve the diagnostic accuracy of cardiac sarcoidosis using FDG PET. Front Med (Lausanne). (2022) 9:840261. doi: 10.3389/fmed.2022.840261
24. Van Griethuysen JJ, Fedorov A, Parmar C, Hosny A, Aucoin N, Narayan V, et al. Computational radiomics system to decode the radiographic phenotype. Cancer Res. (2017) 77(21):e104–7. doi: 10.1158/0008-5472.CAN-17-0339
25. Leijenaar RT, Nalbantov G, Carvalho S, Van Elmpt WJ, Troost EG, Boellaard R, et al. The effect of SUV discretization in quantitative FDG-PET radiomics: the need for standardized methodology in tumor texture analysis. Sci Rep. (2015) 5(1):11075. doi: 10.1038/srep11075
26. Duron L, Balvay D, Vande Perre S, Bouchouicha A, Savatovsky J, Sadik J-C, et al. Gray-level discretization impacts reproducible MRI radiomics texture features. PLoS One. (2019) 14(3):e0213459. doi: 10.1371/journal.pone.0213459
27. Pedregosa F, Varoquaux G, Gramfort A, Michel V, Thirion B, Grisel O, et al. Scikit-learn: machine learning in python. J Mach Learn Res. (2011) 12:2825–30.
28. Steyerberg EW. Validation in prediction research: the waste by data splitting. J Clin Epidemiol. (2018) 103:131–3. doi: 10.1016/j.jclinepi.2018.07.010
29. Akerele MI, Mushari NA, Forsythe RO, Syed M, Karakatsanis NA, Newby DE, et al. Assessment of different quantification metrics of [18 F]-NaF PET/CT images of patients with abdominal aortic aneurysm. J Nucl Cardiol. (2020) 29:1–11. doi: 10.1007/s12350-020-02220-2
30. Apostolova I, Ego K, Steffen IG, Buchert R, Wertzel H, Achenbach HJ, et al. The asphericity of the metabolic tumour volume in NSCLC: correlation with histopathology and molecular markers. Eur J Nucl Med Mol Imaging. (2016) 43:2360–73. doi: 10.1007/s00259-016-3452-z
31. Cheng N-M, Fang Y-HD, Tsan D-L, Hsu C-H, Yen T-C. Respiration-averaged CT for attenuation correction of PET images–impact on PET texture features in non-small cell lung cancer patients. PLoS One. (2016) 11(3):e0150509. doi: 10.1371/journal.pone.0150509
32. Zwanenburg A. Radiomics in nuclear medicine: robustness, reproducibility, standardization, and how to avoid data analysis traps and replication crisis. Eur J Nucl Med Mol Imaging. (2019) 46(13):2638–55. doi: 10.1007/s00259-019-04391-8
33. Han S, Woo S, Suh CH, Kim YJ, Oh JS, Lee JJ. A systematic review of the prognostic value of texture analysis in 18 F-FDG PET in lung cancer. Ann Nucl Med. (2018) 32:602–10. doi: 10.1007/s12149-018-1281-9
Keywords: cardiac sarcoidosis, post-COVID, PET-MRI, imaging, machine learning
Citation: Mushari NA, Soultanidis G, Duff L, Trivieri MG, Fayad ZA, Robson P and Tsoumpas C (2024) An assessment of PET and CMR radiomic features for detection of cardiac sarcoidosis. Front. Nucl. Med. 4:1324698. doi: 10.3389/fnume.2024.1324698
Received: 20 October 2023; Accepted: 5 January 2024;
Published: 16 January 2024.
Edited by:
Xiaosong Wang, Shanghai AI Laboratory, ChinaReviewed by:
Nikolaos Papathanasiou, General University Hospital of Patras, GreeceIsaac Shiri, University Hospital of Bern, Switzerland
© 2024 Mushari, Soultanidis, Duff, Trivieri, Fayad, Robson and Tsoumpas. This is an open-access article distributed under the terms of the Creative Commons Attribution License (CC BY). The use, distribution or reproduction in other forums is permitted, provided the original author(s) and the copyright owner(s) are credited and that the original publication in this journal is cited, in accordance with accepted academic practice. No use, distribution or reproduction is permitted which does not comply with these terms.
*Correspondence: Nouf A. Mushari ml16nam@leeds.ac.uk