Modeling the Impact of Fat Flexibility With Dairy Food Servings in the 2015–2020 Dietary Guidelines for Americans Healthy U.S.-Style Eating Pattern
 Julie M. Hess
 Christopher J. Cifelli1
  Victor L. Fulgoni III
- 1National Dairy Council, Rosemont, IL, United States
- 2Nutrition Impact LLC, Battle Creek, MI, United States
Background: The 2015–2020 Dietary Guidelines for Americans (DGA) recommends consuming low-fat or fat-free dairy foods due to concerns about energy and saturated fat intake. It also recommends consuming no more than 10% of daily calories from saturated fat.
Objective: The objective was to assess the impact of replacing one serving of fat-free dairy foods in the Healthy U.S.-Style Eating Pattern (HUSEP) from the DGA with one serving of whole- or reduced-fat dairy foods. We hypothesized that this replacement would keep the HUSEP within calorie, saturated fat, and sodium limits.
Methods: Utilizing the same modeling procedures as the 2015–2020 DGA, we assessed the nutrient composition of seven alternative models of the 2000-calorie HUSEP. These models replaced all three servings of dairy foods in the HUSEP with an updated fat-free dairy composite (Model 1) or one of three fat-free dairy servings in the HUSEP with: a whole-fat dairy food composite, a reduced-fat/low-fat dairy food composite, whole milk, reduced-fat milk, whole-fat cheese, or reduced-fat cheese (Models 2–7).
Results: In all models, the amount of saturated fat did not exceed 10% of total calories, but the amount of energy increased by 45–94 calories. While still lower than current average intake (3,440 mg/d), sodium amounts in four of the seven models exceeded the 2,300 mg/d recommended intake level.
Conclusions: Some reduced- and whole-fat dairy foods, especially milk, can fit into calorie-balanced healthy eating patterns that also align with saturated fat recommendations. Allowing some flexibility in fat level of dairy food servings aligns with the recommendations that calories from solid fats and added sugars are best used to increase the palatability of nutrient-dense foods.
Introduction
Since 1980, the Dietary Guidelines for Americans (DGA) has cautioned against consuming excess saturated fat. Recommendations to “avoid too much fat, saturated fat, and cholesterol” were part of the 1980 DGA and, since 1985, the DGAs have also recommended limiting intake of saturated fats to <10% of calories per day (1–8). In line with these recommendations, since 1985, the DGAs have recommended consuming low-fat or fat-free dairy foods instead of reduced-fat or whole-fat dairy foods to reduce both saturated fat and caloric intake (1–8). In the 2015 DGA, the Healthy U.S.-Style Eating Pattern (HUSEP) and the Healthy Vegetarian Eating Pattern recommend 3 daily servings (cup-equivalents) of low-fat or fat-free dairy foods for all Americans ages 9 and older, 2½ servings for children 4–8 years, and 2 servings for children 2–3 years (1). These recommendations reflect the importance of the overall nutrient composition of dairy foods and their role in in providing important shortfall nutrients to American children and adults (1).
While the DGA recommends low-fat or fat-free dairy foods, a growing body of recent evidence indicates that consuming whole-fat dairy foods does not lead to increased risk of adverse cardiometabolic outcomes, including obesity (9–13), type 2 diabetes (T2D) (14–22), cardiovascular disease (CVD), and stroke (14, 15, 23–45). In some studies, consuming whole-fat dairy foods was linked to a lower risk of adverse cardiometabolic health outcomes (11, 15, 23, 25, 26, 46, 47). For instance, a 2016 intervention trial found that a modified DASH diet with 2–3 daily servings of whole-fat dairy foods instead of low-fat or fat-free dairy foods lowered blood pressure, reduced blood levels of triglycerides, did not increase total cholesterol or low density lipoprotein cholesterol (LDL-C), and also did not decrease high density lipoprotein cholesterol levels (HDL-C), effects similar to those observed with a standard DASH diet containing low-fat or fat-free dairy foods (48).
Further, flexibility in dairy product selection would give Americans more options to meet dairy recommendations and nutrient needs. Accordingly, this study assessed the impact of replacing one of the three servings of low-fat or fat-free dairy foods in the 2000 calorie 2015 DGA's HUSEP with a serving of whole-fat or reduced-fat dairy foods using food pattern modeling. We hypothesized that, using the same food pattern modeling procedures as the 2015 DGA, replacing one serving of the fat-free dairy food composite with one serving of a whole- or reduced-fat dairy food or dairy food composite in the HUSEP would still result in an eating pattern within calorie, saturated fat, and sodium limits.
Materials and Methods
The 2015 DGA used food pattern modeling to develop recommended healthy eating patterns that could meet Americans' nutrient needs while staying within limits for calories, added sugars, sodium, and saturated fat. These models used a fat-free dairy food composite to estimate the contributions of dairy foods (milk, cheese, and yogurt) to the healthy eating patterns of Americans. The “dairy food composite” is a calculated nutrient profile generated with nutrient data for representative forms of nutrient-dense dairy foods, weighted to match the proportional intake of each food by the U.S. population (49). This dairy food composite reflects actual consumption, based on data from the National Health and Nutrition Examination Survey (NHANES), in terms of the amounts of different dairy foods consumed, but not the actual fat content of the foods consumed. While Americans consume primarily reduced-fat or whole-fat dairy foods (50), the dairy foods used to model eating patterns in the 2015–2020 DGA were almost entirely fat-free products, including fat-free ice cream, cheese, and frozen yogurt (49). Utilizing the same food pattern modeling procedures used for the 2015 DGA, we assessed the energy and nutrient composition of seven alternative models of the 2000-calorie HUSEP, detailed below.
Dairy Food Composites
To reflect shifts in consumption of different types of dairy foods since the 2010 NHANES, we utilized data from NHANES 2013–2016 to both update a fat-free dairy food composite, similar to the composite used in the 2015 DGA food pattern modeling, and to generate whole- and reduced-fat dairy food composites.
The dairy food composite used in the 2015 DGAC was comprised of 51% milk, 2.6% yogurt, 44.8% cheese, and 1.5% soymilk and utilized primarily fat-free products. The amounts of different products reflects dairy food consumption trends from 2 days of NHANES 2009–2010 consumption data analyzed with USDA Food and Nutrient Database for Dietary Studies (FNDDS), 5.0 (51). Using consumption data from NHANES 2013–2016, the updated fat-free dairy food composite (Composite A) included 47.76% milk, 47.30% cheese, and 4.93% yogurt (Table 1). NHANES 2013–2016 data for Americans ages two and older includes data from n = 15,782 Americans, after exclusions for unreliable dietary recalls and data from pregnant and lactating females. Nutrition information for the products used in composites developed for this study are from the updated USDA FNDDS, 2013–2014 and 2015–2016 (52, 53).
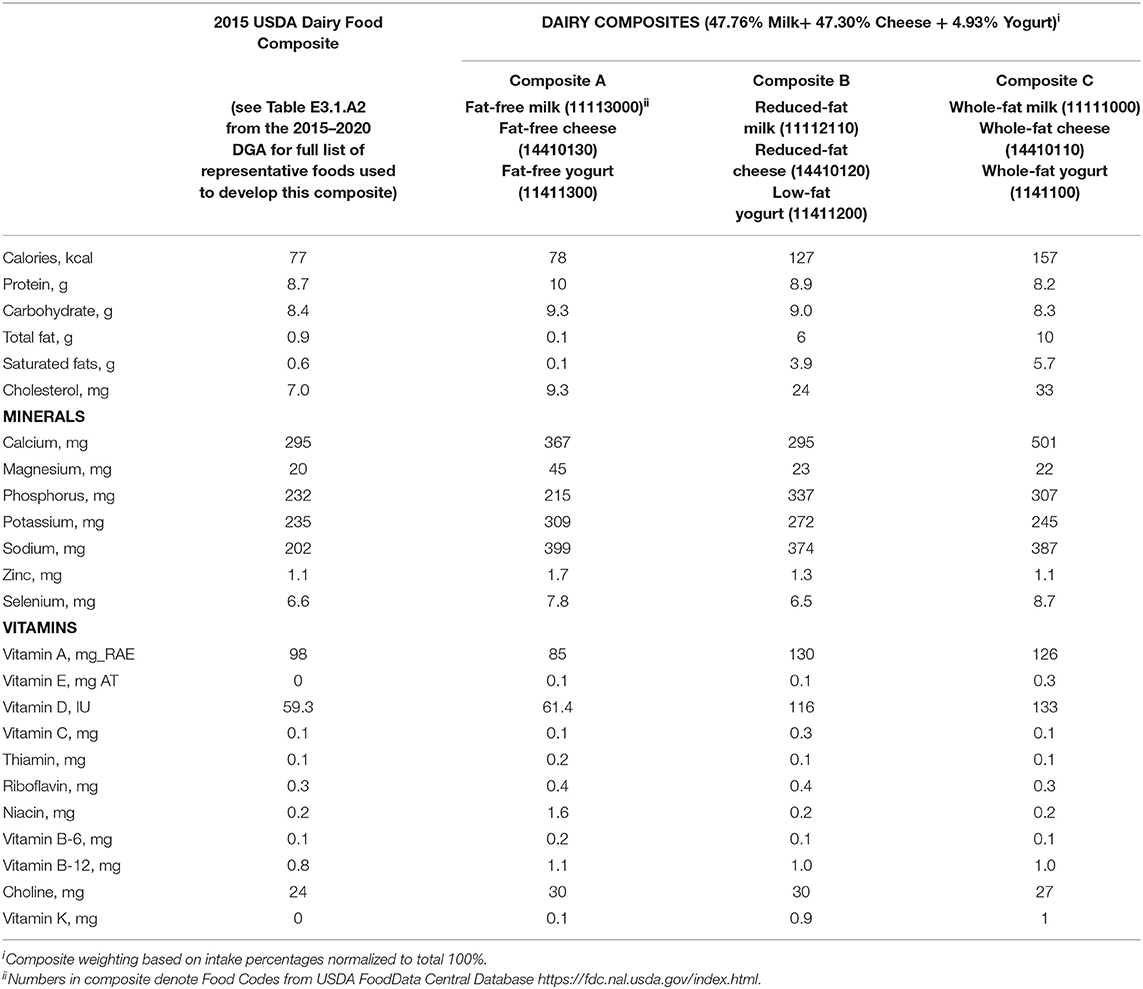
Table 1. Fat-free, reduced-fat and whole-fat dairy food composites nutrient profile.
In addition to an updated fat-free composite, two additional dairy food composites were generated for the purposes of this study. Composite B includes reduced-fat milk, reduced-fat cheese, and low-fat yogurt. Low-fat yogurt was used in lieu of reduced-fat yogurt for this composite, because the USDA FNDDS does not contain reduced-fat yogurts. Composite C includes whole-fat milk, whole-fat cheese, and whole-fat yogurt (Table 1), in the proportions consumed by Americans in 2013–2016 NHANES data.
Modeling
The following models (Tables 2,3) were developed to showcase the impact of one serving of reduced-fat or whole-fat dairy foods in the 2015 DGA's 2000 kcal HUSEP. Model 1 was developed to show the impact of an updated dairy food composite on the HUSEP and to serve as a baseline model for comparison. Models 2–7, also described below, illustrate the impact of replacing a serving of this updated dairy food composite with a serving of a reduced-fat dairy food composite, a whole-fat dairy food composite, whole milk, reduced-fat milk, whole-fat cheese, or reduced-fat cheese. Nutritional information on all dairy foods used for these models comes from FNDDS (53).
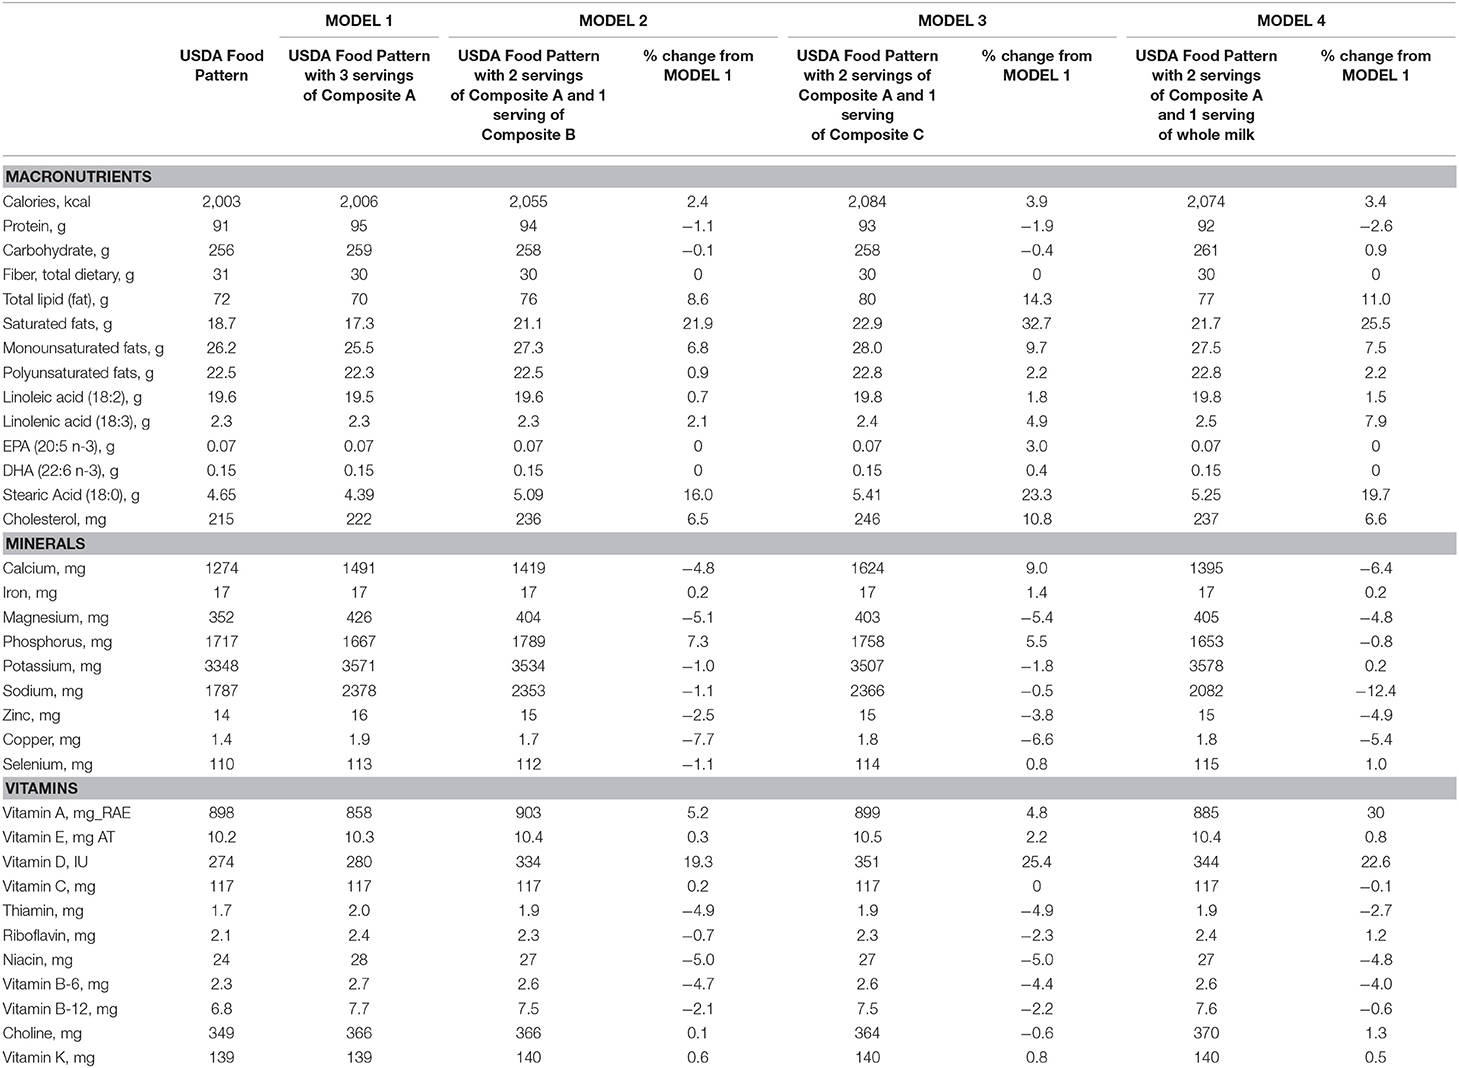
Table 2. Impact of replacing USDA dairy composite in USDA 2,000 kcal Food Patterns with fat-free, reduced-fat and whole-fat dairy food composites from Table 1 (Models 1–4).
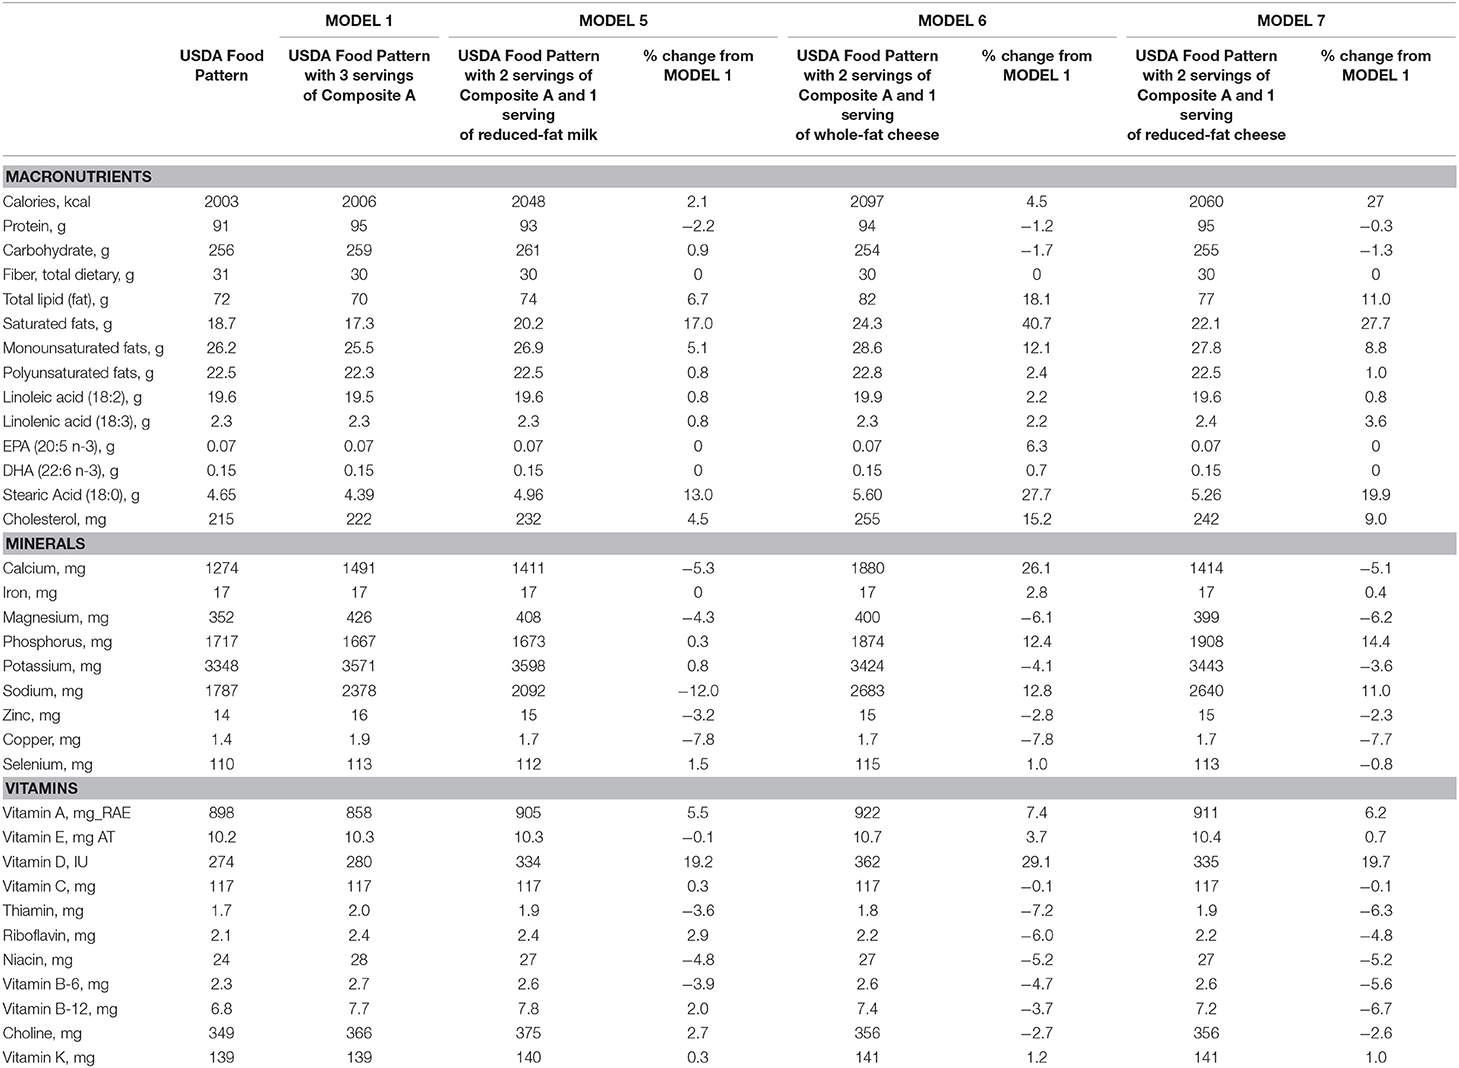
Table 3. Impact of replacing USDA dairy composite in USDA 2,000 kcal Food Patterns with fat-free, reduced-fat and whole-fat dairy food composites from Table 1 (Models 5–7).
To further illustrate the differences between the Model 1 baseline and Models 2–7, percent change was calculated for each nutrient. Nutrition labeling in the U.S. indicates that foods providing between 10 and 19% of the Daily Value (labeling value derived from recommended reference intakes) of a given nutrient can claim to be a “good source” of that nutrient. Foods providing 20% or more of the Daily Value of a given nutrient can claim they are an “excellent source” (54). Therefore, in this study, 10 and 20% differences indicate meaningful changes from the Model 1 baseline (55, 56).
Model 1: Replace all 3 cup equivalents of the USDA's dairy food composite with 3 servings of Composite A.
Model 2: Replace 2 cup equivalents of the USDA's dairy food composite with 2 servings of Composite A and 1 serving of Composite B.
Model 3: Replace 2 cup equivalents of the USDA's dairy food composite with 2 servings of Composite A and 1 serving of Composite C.
Model 4: Replace 2 cup equivalents of the USDA's dairy food composite with 2 servings of Composite A and 1 serving of whole milk (11111000).
Model 5: Replace 2 cup equivalents of the USDA's dairy food composite with 2 servings of Composite A and 1 serving of reduced-fat milk (11112110).
Model 6: Replace 2 cup equivalents of the USDA's dairy food composite with 2 servings of Composite A and 1 serving of whole-fat cheese (14410110).
Model 7: Replace 2 cup equivalents of the USDA's dairy food composite with 2 servings of Composite A and 1 serving of reduced-fat cheese (14410120).
Results
Tables 2–4 show the impact of these models on macronutrient and micronutrient amounts and their comparison with dietary goals (i.e., % Recommended Dietary Allowance). For this study, sample age/sex groups were females 19–30 years of age and males 51+ years of age. Tables 2,3 also show percent change between Model 1 and Models 2–7.
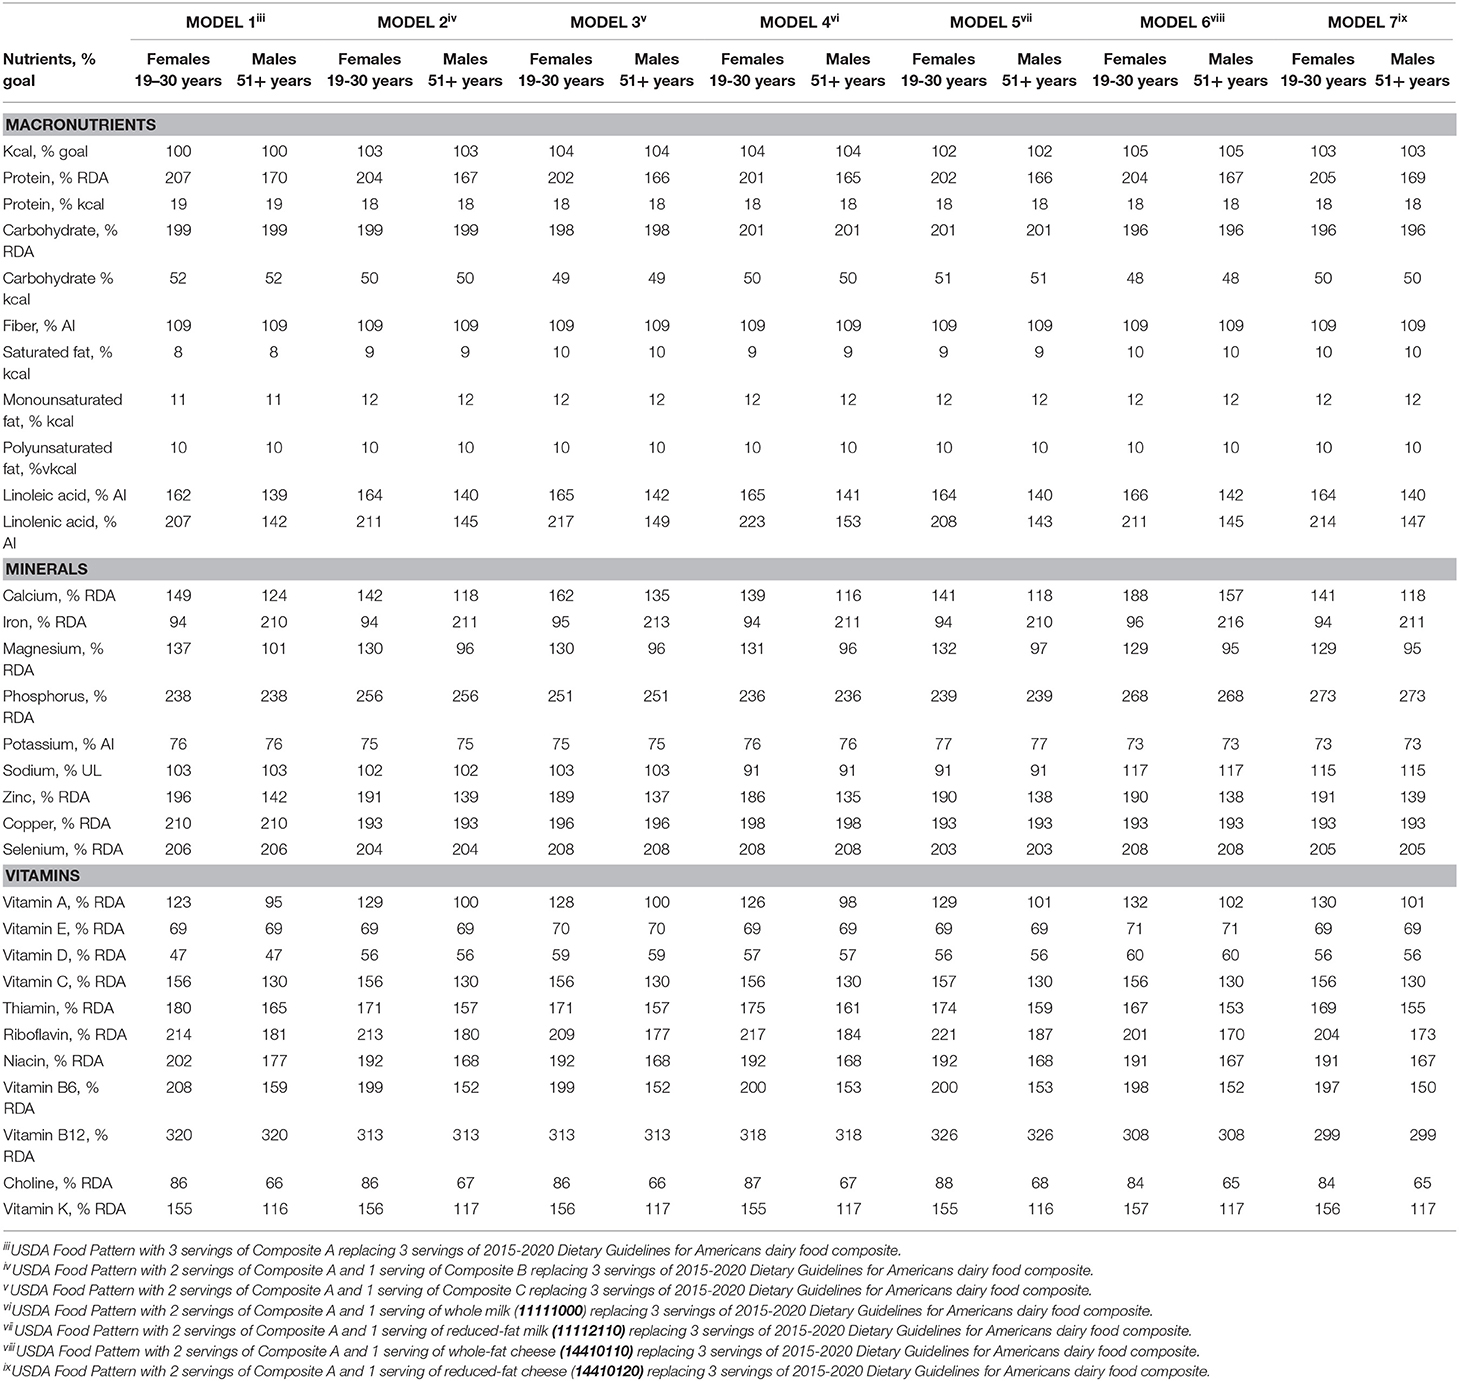
Table 4. Comparing food pattern modeling from Tables 2, 3 to dietary goals for sample age/sex groups with 2,000 kcal diets, taken from Table E3.1.A4 of 2015 DGAC Scientific Report (% goal; % Recommended Dietary Allowance, RDA; % Adequate Intake, AI; % Upper Limit, UL; %kcal).
The amount of energy increased across all models, since no other modifications to the eating pattern were made (Tables 2,3), though none of the increases exceeded 5%. The percent change in saturated fat from Model 1 ranged from an increase of 17.0% in Model 5 to an increase of 40.7% in Model 6. The percentage of calories from saturated fat increased from 8% of total calories in the original 2000 kcal HUSEP diet and Model 1 but did not exceed 10% of total calories in Models 2–7. In Models 2, 4, and 5, which added one serving of the reduced-fat composite or milk, saturated fat was 9% of total calories. The amount of sodium increased across all models, including Model 1, due to changes in dairy product consumption. While the original 2,000 kcal HUSEP had 1,787 mg of sodium, Model 1 (with 3 servings of updated fat-free Composite A) contained 2,378 mg of sodium. The amount of sodium in some other models remained below the 2,300 mg/d threshold for reducing risk of chronic disease set by the National Academies of Sciences, Engineering, and Medicine in 2019 (57). Models 4 and 5, which replaced a serving of the fat-free dairy food composite with whole- and reduced-fat milk, respectively, had 2,082 and 2,092 mg of sodium, decreases of 12.4 and 12.0%, respectively, from Model 1.
Model 1, which updated the fat-free dairy foods composite used in the original 2,000 kcal HUSEP, led to an eating pattern with 2,006 kcal (compared to 2003 in original HUSEP), 4 more grams of protein, less total fat, saturated fat, and monounsaturated fat, and a 591 mg increase in sodium content. Including one serving of a “reduced-fat dairy foods composite” and 2 servings of an updated fat-free dairy food composite in the 2,000 kcal HUSEP kept saturated fat intake at 9% of total calories (Table 4) and increased energy by 49 kcal (total calories = 2,055 kcal), compared to Model 1 (Table 2). Including one serving of a “whole-fat dairy foods composite” and 2 servings of a “fat-free dairy food composite” as part of the 2000 kcal HUSEP results in saturated fat intake at 10% of total calories (Table 4) and increases total caloric intake by 78 kcal (total calories = 2,084 kcal; ~4% increase), compared to Model 1 (Tables 2,4).
Replacing one serving of the updated dairy food composite with one serving of whole milk or reduced-fat milk in the 2,000 kcal HUSEP increased calories by 68 kcal (3.4% increase) and 42 kcal (2.1% increase), respectively, compared to Model 1. Both models provided 9% of calories from saturated fat (Table 4). Replacing one serving of the updated dairy food composite with one serving of whole-fat cheese or reduced-fat cheese in the 2,000 kcal HUSEP increased calories by 91 kcal (4.5% increase) and 54 kcal (2.7% increase), respectively, compared to than Model 1. Both models had 10% of calories from saturated fat (Table 4).
Vitamin D was higher by ~19–29% in Models 2–7, compared to Model 1. Model 6 had the largest increase in Vitamin D content from Model 1 (29.1%). Model 6 also had >10% increases in calcium and phosphorus compared to Model 1. Model 7 had a 14.4% increase in phosphorus compared to Model 1, but none of the other models had changes that exceeded 10% with either calcium or phosphorus. Changes in the amounts of other minerals (iron, magnesium, potassium, zinc, copper, selenium) and vitamins (vitamins A, E, C, B6, B12, K, thiamin, riboflavin, niacin, and choline) in Models 2–7 did not differ by more than 10% from Model 1.
Discussion
Food pattern modeling indicates that one of the three recommended servings of dairy foods for Americans 9 years and older can be a whole- or reduced-fat option while staying within the 2015 DGA's recommended ranges for saturated fat, energy, and sodium intake, especially if the choices are reduced-fat or whole-fat milk. The amount of saturated fat in all seven models did not exceed 10% of total calories, the upper limit recommended in the 2015 DGA (1). While shifting from low-fat or fat-free dairy foods to reduced-fat and whole-fat foods increased the energy content of the HUSEP, this increase in calories could be mitigated by decreasing calories from added sugars or refined grains, a dietary strategy that does not significantly impact overall dietary nutrient content and has been used successfully to manage energy intake in intervention trials using whole-fat dairy foods (48). Total calorie allowance for added sugars in a 2,000 kcal eating pattern is 120 kcal (93), and the largest increase in calories in the modeled eating patterns was 91 kcals (Model 6 compared to Model 1). In addition, while the amount of sodium in Models 1, 2, 5, and 6 exceeds the 2,300 mg/d Chronic Disease Risk Reduction Intake level for sodium, the sodium in these models is still lower than the current average sodium intake (3,410 mg/d) of Americans by at least 700 mg (58) (Model 6).
While dairy foods are an important source of nutrients in the diets of American children and adults, including for three of the four nutrients of public health concern (calcium, potassium, and vitamin D) (59–61), most Americans do not meet dairy food recommendations. On average, Americans consume <2 cup equivalents of dairy foods daily (50). In addition to helping Americans meet nutrient needs, meeting recommendations for dairy foods may also lead to healthcare cost savings up to $12.5 billion for the U.S., due to projected reductions in stroke, hypertension, type 2 diabetes, and colorectal cancer from adequate intake (62). While more targeted research is needed, flexibility with the fat level of dairy food servings in dietary guidance could help Americans meet recommendations, since most of the dairy foods that Americans currently consume are reduced-fat or whole-fat products (50). Allowing flexibility in dairy food servings also aligns with the recommendation from the 2010 DGA that calories from solid fats and added sugars are best used to increase the palatability of nutrient-dense foods, which includes milk, cheese, and yogurt (8).
Flexibility with whole- and reduced-fat dairy foods in the DGA would accurately reflect the latest scientific evidence on whole-fat and reduced-fat dairy foods and cardiometabolic outcomes. Two other authoritative health organizations have recently published dietary recommendations with “fat flexibility” with dairy food selection within healthy eating patterns. In 2016, Joslin Diabetes Center's Nutrition Guidelines for Overweight and Obese Adults with T2D or Prediabetes, or Those at High Risk for Developing T2D states “recent evidence demonstrates that saturated fat from dairy foods (milk, yogurt, cheese) may be acceptable within the total daily caloric intake” (63). Similarly, in 2019, the Australian Heart Foundation's (AHF) statement on heart-healthy eating patterns encouraged consumption of dairy foods, regardless of fat content, as part of healthy eating patterns. The AHF stated that “there is not enough evidence to recommend fat modification (full-fat over reduced-fat products or reduced-fat over full-fat products) for the general population” (64).
One reason that whole- and reduced-fat dairy foods may have different effects on LDL-C than would be expected based on their saturated fat content is due to the complexity of dairy fat (65). Approximately two-thirds of milkfat is saturated fatty acids (including short-, medium-, long-, branched-, and odd-chain fatty acids) and one-third is unsaturated fat (including mono- and polyunsaturated fatty acids). Dairy fat contains over 400 types of fatty acids that have different physiological effects (65). Stearic acid, which contains 18 carbons, has no effect on LDL-C (66). The other most common saturated fatty acids in dairy fat (12, 14, or 16 carbons) raise blood levels of LDL-C but also raise HDL-C levels and lower triglyceride levels, a pattern associated with lower risk for CVD (66, 67). Dairy fat also contains small amounts of saturated fatty acids with 15 and 17 carbons. These fatty acids have also been associated with reduced risk of CVD and T2D (17, 46).
Food pattern modeling indicates that the HUSEP from the 2015 DGA with one serving of whole- or reduced-fat dairy foods and two servings of low-fat or fat-free dairy foods can be accomplished within calorie and nutrient recommendations. The methods in this study are subject to limitations, however. Because this study relied on food pattern modeling, it is theoretical in nature and not developed from actual eating patterns. The modeling results indicate that, of the three servings per day of recommended for Americans 9 years and older, one serving of whole- or reduced-fat dairy foods, such as a glass of whole milk or serving of reduced-fat cheese, can be part of healthy eating patterns for Americans.
Data Availability Statement
All datasets used in this study are publicly available and references in the article indicate how to access them.
Author Contributions
CC and VF: conceptualization and writing- review and editing. JH, CC, and VF: methodology. JH: writing- original draft preparation. Final manuscript was read and approved by all authors.
Funding
This study and the writing of this manuscript were supported by the National Dairy Council.
Conflict of Interest
JH and CC work for National Dairy Council. VF III, as senior vice-president of Nutrition Impact LLC, performs consulting and database analyses for various food and beverage companies and related entities including the National Dairy Council.
References
1. USDA, HHS. 2015-2020 Dietary Guidelines - health.gov. (2016) Available online at: http://health.gov/dietaryguidelines/2015/guidelines/ (accessed January 8, 2016).
2. USDA and HHS. Nutrition and Your Health: Dietary Guidelines for Americans (Feb. 1980). (1980) Available online at: http://www.health.gov/dietaryguidelines/1980thin.pdf (accessed June 1, 2015).
3. USDA and HHS. Nutrition and Your Health: Dietary Guidelines for Americans. (1985). Available online at: http://health.gov/dietaryguidelines/1985thin.pdf (accessed October 27, 2015).
4. USDA and HHS. Nutrition and Your Health. Dietary Guidelines for Americans. USDA. (1990) Available online at: http://www.health.gov/dietaryguidelines/1990thin.pdf (accessed June 10, 2015).
5. USDA and HHS. Nutrition and Your Health: Dietary Guidelines for Americans, 4rth Edn. (1995). Available online at: http://health.gov/dietaryguidelines/dga95/ (accessed January 6, 2016).
6. USDA and HHS. Nutrition and Your Health: Dietary Guidelines for Americans. (2000) Available online at: http://health.gov/dietaryguidelines/dga2000/dietgd.pdf (accessed January 6, 2016).
7. USDA and HHS. Dietary Guidelines for Americans. (2005) Available online at: http://health.gov/dietaryguidelines/dga2005/document/ (accessed January 6, 2016).
8. USDA and HHS. Dietary Guidelines for Americans, 2010. 7th ed. Washington, DC: U.S. Government Printing Office (2010). Available online at: DietaryGuidelines.gov
9. Kratz M, Baars T, Guyenet S. The relationship between high-fat dairy consumption and obesity, cardiovascular, and metabolic disease. Eur J Nutr. (2013) 52:1–24. doi: 10.1007/s00394-012-0418-1
10. Rautiainen S, Wang L, Lee I-M, Manson JE, Buring JE, Sesso HD. Dairy consumption in association with weight change and risk of becoming overweight or obese in middle-aged and older women: a prospective cohort study. Am J Clin Nutr. (2016) 103:979–88. doi: 10.3945/ajcn.115.118406
11. Santiago S, Sayón-Orea C, Babio N, Ruiz-Canela M, Martí A, Corella D, et al. Yogurt consumption and abdominal obesity reversion in the PREDIMED study. Nutr Metab Cardiovasc Dis. (2016) 26:468–75. doi: 10.1016/j.numecd.2015.11.012
12. Rosell M, Håkansson NN, Wolk A. Association between dairy food consumption and weight change over 9 y in 19 352 perimenopausal women. Am J Clin Nutr. (2006) 84:1481–8. doi: 10.1093/ajcn/84.6.1481
13. Mozaffarian D, Hao T, Rimm EB, Willett WC, Hu FB. Changes in diet and lifestyle and long-term weight gain in women and men. N Engl J Med. (2011) 364:2392–404. doi: 10.1056/NEJMoa1014296
14. de Souza RJ, Mente A, Maroleanu A, Cozma AI, Ha V, Kishibe T, et al. Intake of saturated and trans unsaturated fatty acids and risk of all cause mortality, cardiovascular disease, and type 2 diabetes: systematic review and meta-analysis of observational studies. BMJ. (2015) 351:h3978. doi: 10.1136/bmj.h3978
15. Drouin-Chartier J-P, Brassard D, Tessier-Grenier M, Côté JA, Labonté M-È, Desroches S, et al. Systematic review of the association between dairy product consumption and risk of cardiovascular-related clinical outcomes. Adv Nutr An Int Rev J. (2016) 7:1026–40. doi: 10.3945/an.115.011403
16. Yakoob MY, Shi P, Willett WC, Rexrode KM, Campos H, Orav EJ, et al. Circulating biomarkers of dairy fat and risk of incident diabetes mellitus among men and women in the united states in two large prospective cohorts. Circulation. (2016) 133:1645–54. doi: 10.1161/CIRCULATIONAHA.115.018410
17. Imamura F, Fretts A, Marklund M, Ardisson Korat AV, Yang W-S, Lankinen M, et al. Fatty acid biomarkers of dairy fat consumption and incidence of type 2 diabetes: a pooled analysis of prospective cohort studies. PLoS Med. (2018) 15:e1002670. doi: 10.1371/journal.pmed.1002670
18. Aune D, Norat T, Romundstad P, Vatten LJ. Dairy products and the risk of type 2 diabetes: a systematic review and dose-response meta-analysis of cohort studies. Am J Clin Nutr. (2013) 98:1066–83. doi: 10.3945/ajcn.113.059030
19. Tong X, Dong J-Y, Wu Z-W, Li W, Qin L-Q. Dairy consumption and risk of type 2 diabetes mellitus: a meta-analysis of cohort studies. Eur J Clin Nutr. (2011) 65:1027–31. doi: 10.1038/ejcn.2011.62
20. Gao D, Ning N, Wang C, Wang Y, Li Q, Meng Z, Liu Y, Li Q. Dairy products consumption and risk of type 2 diabetes: systematic review and dose-response meta-analysis. PLoS ONE. (2013) 8:e73965. doi: 10.1371/journal.pone.0073965
21. Chen M, Sun Q, Giovannucci E, Mozaffarian D, Manson JE, Willett WC, et al. Dairy consumption and risk of type 2 diabetes: 3 cohorts of US adults and an updated meta-analysis. BMC Med. (2014) 12:215. doi: 10.1186/s12916-014-0215-1
22. Santaren ID, Watkins SM, Liese AD, Wagenknecht LE, Rewers MJ, Haffner SM, et al. Serum pentadecanoic acid (15:0), a short-term marker of dairy food intake, is inversely associated with incident type 2 diabetes and its underlying disorders. Am J Clin Nutr. (2014) 100:1532–40. doi: 10.3945/ajcn.114.092544
23. Chen G-C, Wang Y, Tong X, Szeto IMY, Smit G, Li Z-N, et al. Cheese consumption and risk of cardiovascular disease: a meta-analysis of prospective studies. Eur J Nutr. (2017) 56:2565–75. doi: 10.1007/s00394-016-1292-z
24. Mullie P, Pizot C, Autier P. Daily milk consumption and all-cause mortality, coronary heart disease and stroke: a systematic review and meta-analysis of observational cohort studies. BMC Public Health. (2016) 16:1236. doi: 10.1186/s12889-016-3889-9
25. Alexander DD, Bylsma LC, Vargas AJ, Cohen SS, Doucette A, Mohamed M, et al. Dairy consumption and CVD: a systematic review and meta-analysis. Br J Nutr. (2016) 115:737–50. doi: 10.1017/S0007114515005000
26. Guo J, Astrup A, Lovegrove JA, Gijsbers L, Givens DI, Soedamah-Muthu SS. Milk and dairy consumption and risk of cardiovascular diseases and all-cause mortality: dose–response meta-analysis of prospective cohort studies. Eur J Epidemiol. (2017) 32:269–87. doi: 10.1007/s10654-017-0243-1
27. Soedamah-Muthu SS, Ding EL, Al-Delaimy WK, Hu FB, Engberink MF, Willett WC, et al. Milk and dairy consumption and incidence of cardiovascular diseases and all-cause mortality: dose-response meta-analysis of prospective cohort studies. Am J Clin Nutr. (2011) 93:158–71. doi: 10.3945/ajcn.2010.29866
28. Hu D, Huang J, Wang Y, Zhang D, Qu Y. Dairy foods and risk of stroke: a meta-analysis of prospective cohort studies. Nutr Metab Cardiovasc Dis. (2014) 24:460–469. doi: 10.1016/j.numecd.2013.12.006
29. Qin L-Q, Xu J-Y, Han S-F, Zhang Z-L, Zhao Y-Y, Szeto IM. Dairy consumption and risk of cardiovascular disease: an updated meta-analysis of prospective cohort studies. Asia Pac J Clin Nutr. (2015) 24:90–100. doi: 10.6133/apjcn.2015.24.1.09
30. Dehghan M, Mente A, Zhang X, Swaminathan S, Li W, Mohan V, et al. Associations of fats and carbohydrate intake with cardiovascular disease and mortality in 18 countries from five continents (PURE): a prospective cohort study. Lancet. (2017) 390:2050–62. doi: 10.1016/S0140-6736(17)32252-3
31. Mente A, Dehghan M, Rangarajan S, McQueen M, Dagenais G, Wielgosz A, et al. Association of dietary nutrients with blood lipids and blood pressure in 18 countries: a cross-sectional analysis from the PURE study. Lancet Diabetes Endocrinol. (2017) 5:774–87. doi: 10.1016/S2213-8587(17)30283-8
32. Larsson SC, Virtamo J, Wolk A. Dairy Consumption and Risk of Stroke in Swedish Women and Men. Stroke. (2012) 43:1775–80. doi: 10.1161/STROKEAHA.111.641944
33. Patterson E, Larsson SC, Wolk A, Åkesson A. Association between dairy food consumption and risk of myocardial infarction in women differs by type of dairy Food. J Nutr. (2013) 143:74–9. doi: 10.3945/jn.112.166330
34. Sonestedt E, Wirfält E, Wallström P, Gullberg B, Orho-Melander M, Hedblad B. Dairy products and its association with incidence of cardiovascular disease: the Malmö diet and cancer cohort. Eur J Epidemiol. (2011) 26:609–18. doi: 10.1007/s10654-011-9589-y
35. Dalmeijer GW, Struijk EA, van der Schouw YT, Soedamah-Muthu SS, Verschuren WMM, Boer JMA, et al. Dairy intake and coronary heart disease or stroke—A population-based cohort study. Int J Cardiol. (2013) 167:925–9. doi: 10.1016/j.ijcard.2012.03.094
36. Soedamah-Muthu SS, Masset G, Verberne L, Geleijnse JM, Brunner EJ. Consumption of dairy products and associations with incident diabetes, CHD and mortality in the Whitehall II study. Br J Nutr. (2013) 109:718–26. doi: 10.1017/S0007114512001845
37. Louie J, Flood V, Burlutsky G, Rangan A, Gill T, Mitchell P. Dairy consumption and the risk of 15-year cardiovascular disease mortality in a cohort of older Australians. Nutrients. (2013) 5:441–54. doi: 10.3390/nu5020441
38. van Aerde MA, Soedamah-Muthu SS, Geleijnse JM, Snijder MB, Nijpels G, Stehouwer CDA, et al. Dairy intake in relation to cardiovascular disease mortality and all-cause mortality: the Hoorn Study. Eur J Nutr. (2013) 52:609–16. doi: 10.1007/s00394-012-0363-z
39. Bonthuis M, Hughes MCB, Ibiebele TI, Green AC, van der Pols JC. Dairy consumption and patterns of mortality of Australian adults. Eur J Clin Nutr. (2010) 64:569–77. doi: 10.1038/ejcn.2010.45
40. Kondo I, Ojima T, Nakamura M, Hayasaka S, Hozawa A, Saitoh S, et al. Consumption of dairy products and death from cardiovascular disease in the Japanese general population: the NIPPON DATA80. J Epidemiol. (2013) 23:47–54. doi: 10.2188/jea.JE20120054
41. Goldbohm RA, Chorus AM, Galindo Garre F, Schouten LJ, van den Brandt PA. Dairy consumption and 10-y total and cardiovascular mortality: a prospective cohort study in the Netherlands. Am J Clin Nutr. (2011) 93:615–27. doi: 10.3945/ajcn.110.000430
42. Praagman J, Franco OH, Ikram MA, Soedamah-Muthu SS, Engberink MF, van Rooij FJA, et al. Dairy products and the risk of stroke and coronary heart disease: the Rotterdam Study. Eur J Nutr. (2015) 54:981–90. doi: 10.1007/s00394-014-0774-0
43. de Oliveira Otto MC, Mozaffarian D, Kromhout D, Bertoni AG, Sibley CT, Jacobs DR, et al. Dietary intake of saturated fat by food source and incident cardiovascular disease: the Multi-Ethnic Study of Atherosclerosis. Am J Clin Nutr. (2012) 96:397–404. doi: 10.3945/ajcn.112.037770
44. de Oliveira Otto MC, Nettleton JA, Lemaitre RN, Steffen ML, Kromhout D, Rich SS, et al. Biomarkers of dairy fatty acids and risk of cardiovascular disease in the multi-ethnic study of atherosclerosis. J Am Heart Assoc. (2013) 2:e000092. doi: 10.1161/JAHA.113.000092
45. Warensjö E, Jansson J-H, Cederholm T, Boman K, Eliasson M, Hallmans G, et al. Biomarkers of milk fat and the risk of myocardial infarction in men and women: a prospective, matched case-control study. Am J Clin Nutr. (2010) 92:194–202. doi: 10.3945/ajcn.2009.29054
46. de Oliveira Otto MC, Lemaitre RN, Song X, King IB, Siscovick DS, Mozaffarian D. Serial measures of circulating biomarkers of dairy fat and total and cause-specific mortality in older adults: the Cardiovascular Health Study. Am J Clin Nutr. (2018) 108:476–84. doi: 10.1093/ajcn/nqy117
47. Dehghan M, Mente A, Rangarajan S, Sheridan P, Mohan V, Iqbal R, et al. Association of dairy intake with cardiovascular disease and mortality in 21 countries from five continents (PURE): a prospective cohort study. Lancet. (2018) 10161:P2288–97. doi: 10.1016/S0140-6736(18)31812-9
48. Chiu S, Bergeron N, Williams PT, Bray GA, Sutherland B, Krauss RM. Comparison of the DASH (Dietary approaches to stop hypertension) diet and a higher-fat DASH diet on blood pressure and lipids and lipoproteins: a randomized controlled trial. Am J Clin Nutr. (2016) 103:341–7. doi: 10.3945/ajcn.115.123281
49. 2015-2020 Dietary Guidelines Advisory Committee. Appendix E-3: USDA Food Patterns for Special Analyses. (2016) Available online at: https://health.gov/dietaryguidelines/2015-scientific-report/PDFs/15-Appendix-E-3.pdf
50. National Dairy Council. NHANES 2011-2014. Hyattsville, MD (2018). Available online at: https://www.usdairy.com/science-and-research/dairys-role-in-the-diet
51. Ahuja J, Montville J, Omolewa-Tomobi G, Heendeniya K, Martin C, Steinfeldt L, et al. USDA food and nutrient database for dietary studies, 5.0. Beltsville, MD (2012). doi: 10.1016/j.profoo.2013.04.016
52. U.S. Department of Agriculture, Agricultural Research Service. 2016. USDA Food and Nutrient Database for Dietary Studies 2013–2014. Food Surveys Research Group Home Page. Available online at: http://www.ars.usda.gov/nea/bhnrc/fsrg.
53. U.S. Department of Agriculture, Agricultural Research Service. 2018. USDA Food and Nutrient Database for Dietary Studies 2015–2016. Food Surveys Research Group Home Page. Available online at: http://www.ars.usda.gov/nea/bhnrc/fsrg.
54. CFR 101.54. Available online at: https://www.accessdata.fda.gov/scripts/cdrh/cfdocs/cfcfr/CFRSearch.cfm?fr=101.54 (accessed October 10, 2017).
55. Cifelli C, Houchins J, Demmer E, Fulgoni V. Increasing Plant Based Foods or Dairy Foods Differentially Affects Nutrient Intakes: Dietary Scenarios Using NHANES 2007–2010. Nutrients. (2016) 8:422. doi: 10.3390/nu8070422
56. Hess JM, Fulgoni VL, Radlowski EC. Modeling the impact of adding a serving of dairy foods to the healthy mediterranean-style eating pattern recommended by the 2015–2020 dietary guidelines for Americans. J Am Coll Nutr. (2018) 38:59–67. doi: 10.1080/07315724.2018.1485527
57. National Academies of Sciences Engineering and Medicine. Dietary Reference Intakes for Sodium and Potassium. (2019). Available online at: http://www.nationalacademies.org/hmd/Reports/2019/dietary-reference-intakes-sodium-potassium.aspx (accessed May 9, 2019).
58. WWEIA NHANES 2015-2016. Nutrient Intakes from Food and Beverages: Mean Amounts Consumed per Individual, by Gender and Age, in the United States, 2015-2016. (2015). Available online at: www.ars.usda.gov/nea/bhnrc/fsrg (accessed December 16, 2019).
59. Keast D, Fulgoni V, Nicklas T, O'Neil C. Food sources of energy and nutrients among children in the United States: national health and nutrition examination survey 2003–2006. Nutrients. (2013) 5:283–301. doi: 10.3390/nu5010283
60. O'Neil C, Keast D, Fulgoni V, Nicklas T. Food sources of energy and nutrients among adults in the US: NHANES 2003–2006. Nutrients. (2012) 4:2097–120. doi: 10.3390/nu4122097
61. O'Neil CE, Nicklas TA, Fulgoni VL III. Food sources of energy and nutrients of public health concern and nutrients to limit with a focus on milk and other dairy foods in children 2 to 18 years of age: national health and nutrition examination survey, 2011−2014. Nutrients. (2018) 10:1050. doi: 10.3390/nu10081050
62. Scrafford CG, Bi X, Multani JK, Murphy MM, Schmier JK, Barraj LM. Health care costs and savings associated with increased dairy consumption among adults in the United States. Nutrients. (2020) 12:1–21. doi: 10.3390/nu12010233
63. Hamdy O, Ganda OP, Maryniuk M, Gabbay RA, Members of the Joslin Clinical Oversight Committee. CHAPTER 2. Clinical nutrition guideline for overweight and obese adults with type 2 diabetes (T2D) or prediabetes, or those at high risk for developing T2D. Am J Manag Care. (2018) 24:SP226–31. Available online at: http://www.ncbi.nlm.nih.gov/pubmed/29938995 (accessed November 2, 2018).
64. National Heart Foundation of Australia. Heart Healthy Eating Patterns. (2019). Available online at: https://www.heartfoundation.org.au/images/uploads/main/Nutrition_Position_Statement_-_HHEP_FINAL-3.pdf
65. Månsson HL. Fatty acids in bovine milk fat. Food Nutr Res. (2008) 52:1821. doi: 10.3402/fnr.v52i0.1821
66. Mensink RP, Zock PL, Kester AD, Katan MB. Effects of dietary fatty acids and carbohydrates on the ratio of serum total to HDL cholesterol and on serum lipids and apolipoproteins: a meta-analysis of 60 controlled trials. Am J Clin Nutr. (2003) 77:1146–55. Available online at: http://ajcn.nutrition.org/content/77/5/1146.long (accessed August 10, 2015).
Keywords: dairy, dairy products, dietary guidance, dietary patterns, dietary guidelines for Americans
Citation: Hess JM, Cifelli CJ and Fulgoni VL III (2020) Modeling the Impact of Fat Flexibility With Dairy Food Servings in the 2015–2020 Dietary Guidelines for Americans Healthy U.S.-Style Eating Pattern. Front. Nutr. 7:595880. doi: 10.3389/fnut.2020.595880
Received: 17 August 2020; Accepted: 22 September 2020;
Published: 22 October 2020.
Edited by:
Satyanarayan R. S. Dev, Florida Agricultural and Mechanical University, United StatesReviewed by:
Wendy J. Dahl, University of Florida, United StatesTilakavati Karupaiah, Taylor's University, Malaysia
Copyright © 2020 Hess, Cifelli and Fulgoni. This is an open-access article distributed under the terms of the Creative Commons Attribution License (CC BY). The use, distribution or reproduction in other forums is permitted, provided the original author(s) and the copyright owner(s) are credited and that the original publication in this journal is cited, in accordance with accepted academic practice. No use, distribution or reproduction is permitted which does not comply with these terms.
*Correspondence: Julie M. Hess, julie.hess@dairy.org