A Systematic Review and Meta-Analysis of the Potential of Millets for Managing and Reducing the Risk of Developing Diabetes Mellitus
 Seetha Anitha1*
  Joanna Kane-Potaka1
  Takuji W. Tsusaka2
  Rosemary Botha3
  Ananthan Rajendran4
  D. Ian Givens5
  Devraj J. Parasannanavar4
  Kowsalya Subramaniam6
  Kanaka Durga Veera Prasad1
  Mani Vetriventhan1
  Raj Kumar Bhandari7
- 1Smart Food Initiative, International Crops Research Institute for the Semi-Arid Tropics (ICRISAT), Patancheru, India
- 2Organization for Advanced and Integrated Research, Kobe University, Kobe, Japan
- 3Development Strategy and Governance Division, International Food Policy Research Institute (IFPRI), Lilongwe, Malawi
- 4National Institute of Nutrition (NIN), Hyderabad, India
- 5Institute of Food, Nutrition and Health, University of Reading, Reading, United Kingdom
- 6Food Science and Nutrition, Avinashilingam Institute for Home Science and Higher Education for Women, Coimbatore, India
- 7National Technical Board of Nutrition, Government of India (GoI), New Delhi, India
Millets (including sorghum) are known to be highly nutritious besides having a low carbon footprint and the ability to survive in high temperatures with minimal water. Millets are widely recognised as having a low Glycaemic Index (GI) helping to manage diabetes. This systematic review and meta-analyzes across the different types of millets and different forms of processing/cooking collated all evidences. Of the 65 studies that were collected globally, 39 studies with 111 observations were used to analyze GI outcomes and 56 studies were used to analyze fasting, post-prandial glucose level, insulin index and HbA1c outcomes in a meta-analysis. It is evident from the descriptive statistics that the mean GI of millets is 52.7 ± 10.3, which is about 36% lower than in typical staples of milled rice (71.7 ± 14.4) and refined wheat (74.2 ± 14.9). The descriptive, meta and regression analyses revealed that Job's tears, fonio, foxtail, barnyard, and teff were the millets with low mean GI (<55) that are more effective (35–79%) in reducing dietary GI than the control samples. Millets with intermediate GI (55–69) are pearl millet, finger millet, kodo millet, little millet, and sorghum which have a 13–35% lower GI than the control with high GI (>69). A meta-analysis also showed that all millets had significantly (p < 0.01) lower GI than white rice, refined wheat, standard glucose or white wheat bread except little millet which had inconsistent data. Long term millet consumption lowered fasting and post-prandial blood glucose levels significantly (p < 0.01) by 12 and 15%, respectively, in diabetic subjects. There was a significant reduction in HbA1c level (from 6.65 ± 0.4 to 5.67 ± 0.4%) among pre-diabetic individuals (p < 0.01) who consumed millets for a long period. Minimally processed millets were 30% more effective in lowering GI of a meal compared to milled rice and refined wheat. In conclusion, millets can be beneficial in managing and reducing the risk of developing diabetes and could therefore be used to design appropriate meals for diabetic and pre-diabetic subjects as well as for non-diabetic people for a preventive approach.
Introduction
It is estimated that there will be a 51% surge in diabetics globally by 2045, from 463 million in 2019 to 700 million in 2045 (1) with type 2 diabetes accounting for about 90% of the total. Eighty-seven percent of diabetes-related deaths occur in low and middle income countries where there is less diversification of staple foods. It is important to note that apart from a sedentary lifestyle and obesity, the type of food consumed plays a key role in diabetes. Main staples such as refined rice, refined wheat and maize contribute up to 80% of the energy intake in developing countries (2). Diversifying food staples and mainstreaming traditional nutritious and less glucogenic staples in the majority of developing countries is very important to manage and prevent diabetes; millets and sorghum figure first in this list of staples.
The value of a Triple Bottom Line is well-recognised in businesses and has been the stimulus for the creation of new products and impactful investments. Customising it to the Food System is the Smart Food Triple Bottom Line, defining solutions (3) that in unison are good for you (nutritious and healthy), good for the planet (environmentally sustainable) and good for the farmer (resilient). It is an approach being used to analyze the value of millets and sorghum as staples. This is the first analyses focusing on how millets and sorghum are “good for you” in terms of reducing diabetes, and comparing them to rice, wheat and maize, the “Big 3” major staple foods in Asia and Africa. Of these, polished rice, which is inherently deficient in micronutrients, provides 80% of the energy intake (4) in high rice consuming countries. Growing lifestyle diseases like type 2 diabetes make it imperative to explore dietary solutions that include nutrition and tackle major health issues. Diversifying diets by diversifying staples with the right nutritious and healthy foods can play a major role in reducing multiple health related burdens.
There are 13 types of millets available globally (5) which include pearl millet, finger millet, sorghum, little millet, proso millet, kodo millet, barnyard millet, brown top millet, foxtail millet, Guinea millet, Job's tears, fonio, and teff. Except for Job's tears, fonio, and teff, the other millets are widely distributed in India. Finger millet is widely found in India, China and in some Eastern and Southern African countries, whereas fonio is widely distributed in Western Africa and Job's tears in northeast India, southern and eastern Asia and southern China. On the other hand, teff is mainly found in Ethiopia (5). Currently, these crops are mostly grown in Africa and Asia as well as in the USA, which is the largest producer of sorghum. Millets also occur in other parts of the world as feed and fodder or as a minor crop (www.smartfood.org/millets-sorghum-production-trends/).
A systematic review of 19 research articles showed that millets help manage diabetes due to their high fibre, polyphenol, and antioxidant content (6). Millets were traditionally consumed in African and Asian countries and were later largely replaced by rice, wheat and maize. Considering nutrient requirements, rising non-communicable health issues like diabetes and challenges posed by climate change, it is important to popularise smart foods, i.e., foods that fulfil all criteria of being good for you, the planet and the farmer.
Many studies have demonstrated the efficacy of millets in improving glycaemic control, decreasing fasting, and post-prandial rise in blood glucose concentration (7, 8), reducing insulin index and insulin resistance and lessening glycosylated haemoglobin (HbA1c) level (8–12). Glycaemic index (GI) is a measure of how much the carbohydrate present in the food affects the rate and extent of change in post-prandial blood glucose concentration. The general dietary strategy to enhance glycaemic control is to consume low GI food (13). Fasting blood glucose is generally measured following overnight fasting and post-prandial blood glucose is measured at regular intervals of up to 2 h after eating. Hyperinsulinemia is associated with insulin resistance that increases the risk of type 2 diabetes (14). Therefore, along with post-prandial glucose concentration, it is important to measure insulin concentration in order to evaluate a food's ability to reduce insulin resistance. In addition, long term glycaemic control can be measured by HbA1c marker (15).
Although there are several studies on millets related to these outcomes, their information is heterogeneous. Therefore, it is important to collate scientific evidence to determine whether the studies support the glycaemic controlling ability of millets or not, including all the types and forms of processing (including cooking) they undergo, in order to serve as a dietary guide on millets. Considering the growing prevalence of diabetes among high and low socioeconomic groups in both developed and developing countries, this paper for the first time aims to undertake an in-depth systematic review and meta-analysis, simple descriptive statistics, and regression analysis of all the studies conducted to test GI, fasting and post-prandial blood glucose concentrations, insulin response and HbA1c biomarker level in millet-based diets. This includes 11 types of millets, 1 mixed millet and many forms of processing that were tested. This information will form the scientific basis for any claims about millets vis-à-vis diabetes and be useful for the scientific community, dieticians, and nutritionists through to food processors and governments in setting policies and programs on health, nutrition and agriculture. Therefore, this study aims to address the following research question:
Does consuming millet(s)-based food help in managing and reducing the risk of developing type 2 diabetes compared to the consumption of typical staples?
Methods
The systematic review was conducted by: (1) collating all the relevant studies on the glucogenic effect of millets relative to other staple foods; (2) reviewing the methods used to study this; (3) conducting a regression analysis to find the effect of millets in managing diabetes and (4) conducting a meta-analysis to assess the science-based evidence on millets' ability to reduce insulin concentration, HbA1c biomarker and fasting and post-prandial blood glucose concentration and their effect on managing individuals with type 2 diabetes mellitus and pre-diabetic individuals compared to non-millet-based regular diets or other staples.
The following sections describe the methods in detail.
Study Period and Protocol
The systematic review was conducted from October 2017 to February 2021. The study protocol is registered in the Research Registry (Unique Identification Number; reviewregistry1094) and a 27-item PRISMA checklist was used to conduct the systematic review and meta-analysis (16).
Search, Inclusion, and Exclusion Criteria
The search basically selected all the research studies in English conducted from the year 1950 to the last quarter of 2020. An initial scoping study was conducted using PubMed and MEDLINE to check for studies that overlapped with the research question of the systematic review as per the guidelines of Atkinson and Cipriani, 2018 (17). Later, a detailed search was conducted using search engines Google scholar, Scopus, Web of Science, PubMed (MEDLINE), CAB Abstracts ClinicalTrials.gov, grey literature, and other Clinical Trial Registries to find the studies relevant to the research question. The search was conducted using the search strategy and keywords indicated in Table 1, with further screening for study relevance, completeness of information and quality of research based on the inclusion and exclusion criteria.
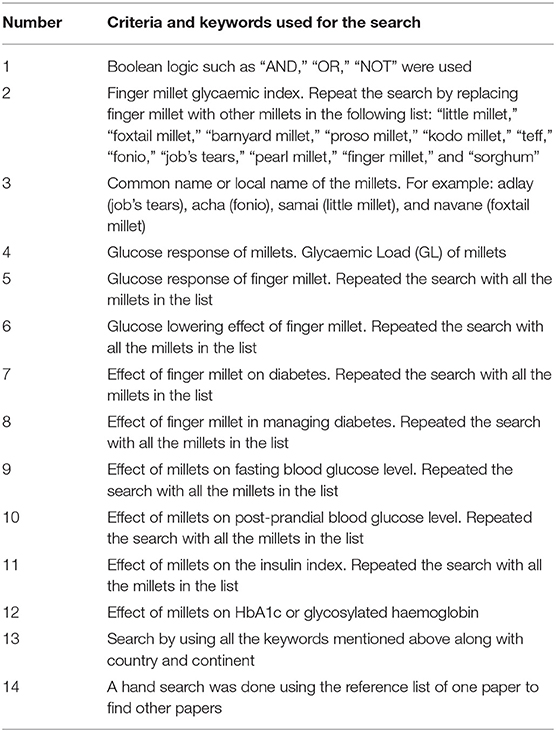
Table 1. Search strategy and keywords used to identify the relevant papers.
Inclusion Criteria
1. Research studies conducted on humans with all types of millets including sorghum, finger millet, pearl millet, little millet, kodo millet, barnyard millet, foxtail millet, proso millet, teff, fonio, and Job's tears. 2. Where there were no or very few human studies on some millets (only for teff and fonio), in-vitro studies were included but these were considered separately. 3. Studies with information on any one or all of the outcomes including GI, fasting, post-prandial glucose level, insulin index and HbA1c of any millets were selected for the next level of screening. 4. A study conducted in any geographical location globally was selected. 5. Both randomised cross-over studies and self-controlled case studies were included. 6. Studies conducted on both normal healthy subjects, pre-diabetic, and type 2 diabetic subjects were included. 7. Only peer-reviewed research articles were selected.
Exclusion Criteria
These included review articles, animal studies and papers where the full information could not be accessed or if the methodologies were identified as weak. Papers representing glucose response values in figures without providing numeric values were excluded from the meta-analysis.
Data Collection Process
The PRISMA flow diagram (Figure 1) shows the study design and the criteria for including and excluding papers. Only relevant papers that addressed the research questions were downloaded. If only the abstract was suitable, then open access articles were downloaded, and the full paper was collected by contacting the authors, editors of the journals, universities that have library facilities and subscription to the journal. Some full papers were purchased. After collecting the full paper, if any information on GI and/or glucose response was missing, the authors were contacted and complete information was requested for use in the meta-analysis. A manual search was done in every article to find more related research articles. References in the selected articles were also searched and the full articles were acquired and included in the study, where appropriate.
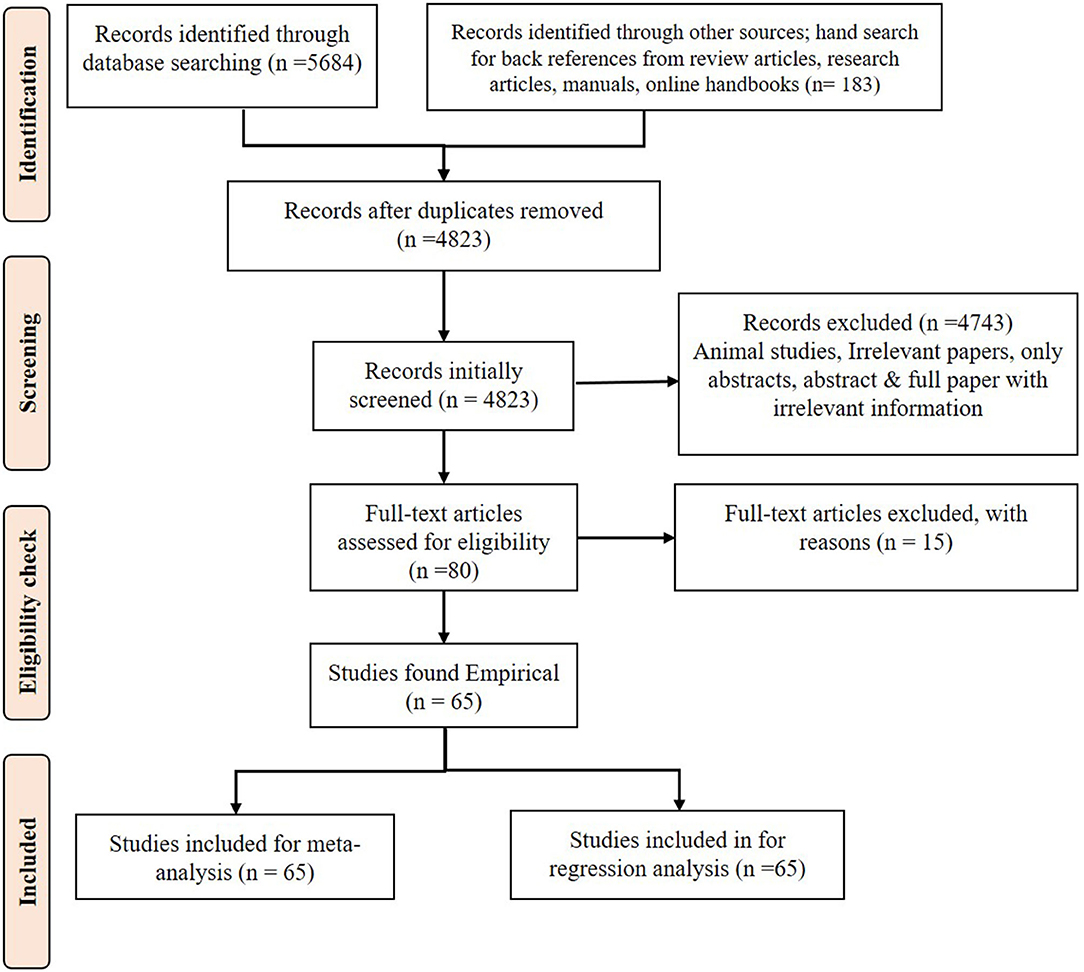
Figure 1. A PRISMA flow diagram of the systematic review.
The data were extracted from the articles and documented in an Excel sheet and then used to conduct the regression analysis, forest plots and publication bias plots.
Study Quality Assessment
Information such as the author's name, year of publication, geographical region of study, name of the study, gender of the subjects, age range, mean age, study type, sample size, dietary assessment methods used, outcomes, level of dietary exposure, and procedures and standards followed to estimate GI, etc., were extracted from the research articles. Using the eight-item Newcastle-Ottawa Scale (NOS), the quality (18, 19) of each study was assessed by two investigators, and any disagreements were resolved by discussing it with a third reviewer. The NOS allows the assessment of a study population and selection with comparable outcomes of interest. The scale ranged from 0 to 9, and studies with scores of <7 were assigned low quality and those >7 were assigned high quality. The researchers also applied the principle of Bell et al. (20) to further strengthen quality assessment.
Data Items and Extraction
Each study was labelled with details of the author and year. The numerical variables considered for the meta-analysis included mean GI with standard deviation (SD), mean fasting, and post-prandial blood glucose concentration with SD, the sample size in both intervention and control and mean insulin level with SD. The respective control samples for each study were identified and appropriate data were extracted. Control samples included those of wheat, refined wheat, rice (white and brown), roots, tubers, and legumes. When a food control was not used, then data for glucose or white bread were used as the control. The numerical variables corresponding to GI were extracted as mean GI with SD. If mean standard error (SEM or SE) values were provided in the study, then the SE values were converted into SD values. If the GI was not provided in the paper, it was either obtained from the author, or if the mean of all subjects Area Under the Curve (AUC) was available, then GI was calculated using the formula F/R × 100, where F is the mean of all subjects' AUC for the test food and R is the mean of all subjects' AUC for the control food (21). Fasting and post-prandial glucose concentrations were extracted into the Excel sheet in mg/dl units as per the guidelines provided by Harrer et al. (22). Where given as mmol/l, the values were converted into mg/dl to maintain uniformity of data. HbA1c was presented in percentage and taken as such. Categorical data was recorded on cooking method (baking/roasting, boiling, steam cooking), information on the cooked product (pancake, flatbread, porridge, cooked grain), the form of the samples used (grain, flour, batter) and the health condition (diabetic, pre-diabetic, and non-diabetic) of the study participants.
Summary Measures and Result Synthesis
A meta-analysis was conducted to estimate the standard mean difference (SMD) and associated heterogeneity (I2) (23). The significance of the result was determined using a fixed effect model for a single source of information and random effect model for other studies. Subgroup analyses were conducted to ascertain the effect of different variables and conditions on fasting and post-prandial glucose levels. In addition, descriptive statistics such as mean, SD for GI, HbA1c, and glucose level were calculated for both intervention and control samples. A regression analysis was conducted to quantify the effect of millets and control samples on glycaemic control keeping GI as a dependent variable and food type, source, processing methods and participants' health (diabetic, pre-diabetic, and non-diabetic) as independent variables.
Data Analysis in Detail
In total, 80 studies were collected on the effect of millets on various outcomes in non-diabetic, pre-diabetic, and diabetic subjects. Of these, only 65 studies had complete information on either of the five key outcomes (GI, fasting, post-prandial blood glucose concentration, insulin concentration, and HbA1c level). The effects of millets and control samples were analysed by segregating them in several ways, such as by the effect of consuming millets on five key outcomes in diabetic, pre-diabetic, and non-diabetic subjects, and by comparing the effect of millets on five key outcomes with that on various staples segregated as rice (white and brown), wheat (whole and refined), roots and tubers, legumes and others, standard glucose and white bread. Descriptive statistics, regression and meta-analysis were conducted. Descriptive statistics calculated mean, standard deviation and percentage values of outcomes. A meta-analysis was conducted to generate evidence on the effects of millets' use on GI, fasting and post-prandial glucose levels compared to the pre intervention values (baseline) or control samples used in the studies which included rice (refined and brown), refined wheat and maize. Regression analysis was conducted to test the correlation between type of crop, cooking type, and GI. Both descriptive and regression analyses were conducted using STATA 16 (24). A meta-analysis was conducted using software R studio version 3.5.1 (2018) to obtain forest plots and estimates of heterogeneity (I2) to evaluate the randomisation of the studies.
Meta-Analysis
Sixty-five human studies using various types and forms of millets were used for the meta-analysis to create forest plots for GI (112 observations) and glucose levels at 0 min (fasting blood glucose) and 120 min (post-prandial blood glucose) in normal, pre-diabetic, and diabetic subjects. The millets were compared with the corresponding control samples used in the study. The heterogeneity of the samples (I2), and overall test results were obtained in forest plots along with p-values to test the significance of effect. Both the random effect model and fixed effect model were tested and used to interpret the results of each of the five outcomes. Wherever heterogeneity was low (I2 <50%), a fixed effect model was used to interpret the result. In addition, where there was only a single source of information from the same population, a fixed effect model was used for the interpretation (25).
Subgroup Analysis
Three subgroup analyses were undertaken by identifying changes that possibly affect the five outcomes. This was done based on the type of control (glucose, refined wheat based, rice based, whole wheat based, pulses and legumes based, maize/corn based, other cereals based, and others) used in each study, participant's health condition (non-diabetic, pre-diabetic, and type 2 diabetic), and type of millet used in the studies. Note that the age group of the participants was given as the mean age in years in many studies. Hence, a subgroup analysis based on age was not conducted.
Risk of Bias
Funnel plots were generated to determine publication bias (23, 26). In addition, each study was scored for biases related to selection, performance, detection, attrition and reporting to generate a risk of bias plot.
Regression Analysis
Regression analysis is a statistical procedure for estimating the relationships between a dependent variable and independent variables. To quantify the effects of crop choice on GI (in all in vivo studies and only 2 in vitro studies), ordinary least squares (OLS) regression (27, 28) with cluster-robust standard errors (29) was performed using the metadata including 267 observations from 63 studies. OLS is the most common linear least square method of estimating the coefficient in a linear regression model. Here the dependent variable was the GI value, the main independent variables were a set of dummy variables representing different crops and the control variables were the grain processing and cooking methods, the Type 2 diabetes mellitus condition of the subjects and the method of GI measurement. More specifically, the OLS equation is expressed as follows:
where yi represents the GI value for the observation i (i = 1, 2, 3, …, 267), β0 is the intercept term, x1ji is the set of 17 dummy variables representing 17 crops compared against maize being the base crop, x2i is the dummy variable that takes the value of one when the food sample is made from a whole grain and zero otherwise, x3li is the set of 3 dummies representing 3 cooking methods compared against raw consumption being the base method, x4i is the dummy that takes one when the subject individual has the type 2 diabetic condition and zero otherwise, x5i is the dummy that takes one when the GI value was estimated using the in vitro digestion rate and zero otherwise, x6ni (n = 1, 2, 3, …, 63) is the set of 63 dummies to control for any literature-specific fixed effects arising from any unobservable factor such as individual-specific food sample preparation practise, researcher-specific GI measurement practise, etc., and εi is the random error term. In addition, the interaction term between the type 2 diabetic condition and crop dummies was also examined.
The 17 crops compared with maize were Job's tears (adlay millet), barnyard millet, finger millet, fonio, foxtail millet, kodo millet, little millet, pearl millet, mixed millet (i.e., a mixture of millets and other crops), sorghum, teff, legume, roots and tubers, rice, refined wheat, wheat-based, and other (any other crops were regarded as one group). The three cooking methods analysed were boiling, steaming, and baking (and/or roasting) which were compared with no cooking. To account for literature-level clustering that results in downward bias in the standard errors stemming from any within-literature correlation, cluster-robust standard errors (29, 30) were adopted to correct for heteroscedasticity.
The most important feature of the multiple regression (there is more than one independent variable) is that the covariates are controlled for in the estimation of the coefficient of a certain variable. In our case, for instance, whether the food was made from whole grain or refined grain was controlled for when estimating the effect of a specific crop on GI. In other words, the estimation process incorporated both whole food and refined food, but only compared it with like variables (whole grain millet vs. whole grain maize, refined millet vs. refined maize, etc.,) where these values are either observed or estimated. Hence, the conclusion only reflects such fair comparisons.
Results
For the meta-analysis, 65 human studies qualified for the five outcomes (GI, fasting blood glucose, post-prandial blood glucose, insulin level, and HbA1c). Some authors conducted studies on more than one type of millet; therefore, the same author contributed to more than one crop studied. This resulted in the identification of 99 studies from 65 authors, which included 19 studies on finger millet, 20 on foxtail millet, 10 each on sorghum and pearl millet, 7 on barnyard millet, 4 each on little and kodo millet, 3 each on teff, fonio and Job's tears, 1 on proso millet, and 15 on a mix of these millets. Apart from this, there were two in vitro studies that were included for teff and fonio, with 11 observations for GI (31, 32).
Descriptive Statistics
Table 2 shows the mean GI of each millet tested in vivo along with refined wheat and milled rice. The overall mean GI of millet, milled rice and refined wheat were 52.7 ± 10.3, 71.7 ± 14.4, and 74.2 ± 14.9, respectively. Except for proso millet, all other millets fell in the low to medium GI food category. Table 2 also shows the in vitro GI of two types of millets.
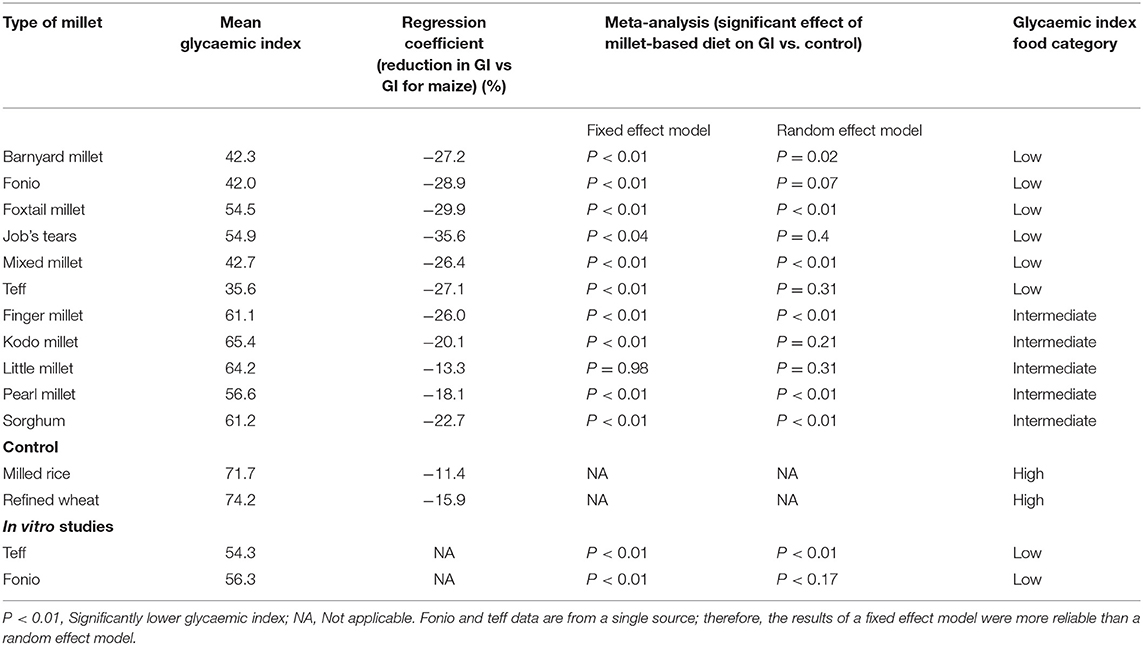
Table 2. A comparison of millets' glycaemic index measured in vivo with control samples using different statistical analyses.
Meta-Analysis
The effect of consuming millet-based food compared to the respective control samples or pre-intervention (baseline) values of participants of each study was determined through five outcomes, namely GI value (Figures 2–4), fasting, post-prandial, HbA1c, insulin level of blood in a meta-analysis and a forest plot was generated. The fixed effect model shows that except for little millet, the other 9 millets had a significantly low GI compared to control samples (Table 3). The fixed effect model was useful in explaining that fonio and teff samples were from a single source. Among 11 types of millets and one mixed millet tested, only little millet did not show a significantly lower GI compared with the control samples in both fixed effect and random effect models. There was no single study that determined GI of proso millet therefore it was not used in meta-analysis. All other studies generally showed a significantly lower GI than the control food tested, which included white refined wheat, rice, maize and glucose. Fonio showed low heterogeneity (0%) due to a single source sample and no randomisation with significantly low (p < 0.01) GI compared to standard glucose. Little millet had high heterogeneity (97%) with GI which was not significantly low (p = 0.31) compared to a rice-based diet. Teff showed moderate heterogeneity (75%) due to a single source sample and less randomisation with significantly low (p < 0.01) GI compared to corn injera (a white leavened Ethiopian flat bread with spongy texture) and white wheat bread. Barnyard millet exhibited high heterogeneity (95%) and significantly low GI (p = 0.04) with 95% confidence interval of −29.18; −0.99. Sorghum exhibited moderate heterogeneity (75%) and significantly low GI (p =0.03) with 95% confidence interval of −2.59; −0.20 with Standardised Mean Difference (SMD) of −1.39. Pearl millet exhibited low heterogeneity (38%) and significantly low GI (p < 0.01) with 95% confidence interval of −2.11; −0.65. Kodo millet exhibited low heterogeneity (50%) and significantly low GI (p < 0.01) with 95% confidence interval of −1.76; −0.70. Foxtail millet exhibited high heterogeneity (89%) and significantly low GI (p < 0.01) with 95% confidence interval of −5.77; −1.44. Finger millet exhibited high heterogeneity (88%) and significantly low GI (p < 0.01) with 95% confidence interval of −5.35; −2.85. Mixed millets exhibited high heterogeneity (93%) and significantly low GI (p < 0.01) with 95% confidence interval of −10.15; −3.73.
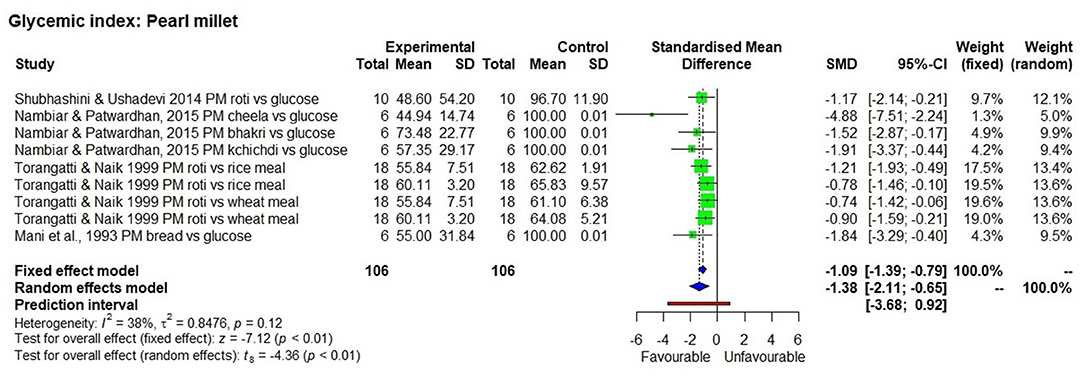
Figure 2. The Glycaemic Index of a pearl millet diet compared to control samples. Abbreviations given in Figures 2–8: PM, Pearl millet; FM, Finger millet; DFM, Decorticated finger millet; ER, Expanded rice; WFM, Whole finger millet; GFM, Germinated finger millet; A vs. B, After vs. Before; SMY, Soya milk yoghurt; FMMY, Finger millet milk yoghurt; P, Probiotic; FTM, Foxtail millet; WB, White bread; KM, Kodo millet; KM-SU, Kodo millet sewai upma; RW-SU, Refined wheat sewai upma; SGG, Split green gram; WGG, Whole green gram; MM, Mixed millet; NM, Non-millet; FMFU, Finger millet flakes upma; FMVU, Finger millet vermicelli upma; RSR, Raw small roasted; RSU, Raw small unroasted; RLR, Raw large roasted; RLU, Raw large unroasted; RPSR, Raw parboiled small roasted; RPSU, Raw parboiled small unroasted; RPLR, Raw parboiled large roasted; RPLU, Raw parboiled large unroasted; FME, Finger millet extruded; FMB, Finger millet ball; SGF, Stone ground flour; KM, Kodo millet; MM, Mixed millet; FTM, Foxtail millet; BM, Barnyard millet. Description of food items in Figures 2–8: Dosa, Indian pan cake; Roti, a flat round bread cooked on a griddle; Chapatti, a thin flat bread of unleavened wholemeal bread cooked on a griddle; Pittu, Portioned steam cooked cake; Khichdi, Pulse, millet, spices mixed, and cooked together; Laddu, an Indian sweet made from a mixture of flour, sugar, and shortening, which is shaped into a ball; Baati, Hard unleavened bread; Burfi, Indian milk based sweet (here prepared with millet); Upma, a breakfast dish made by simmering roasted grain in tampered and spiced boiling water; Cheela, a savoury pan cake; Bhakri, a round flat unleavened bread.
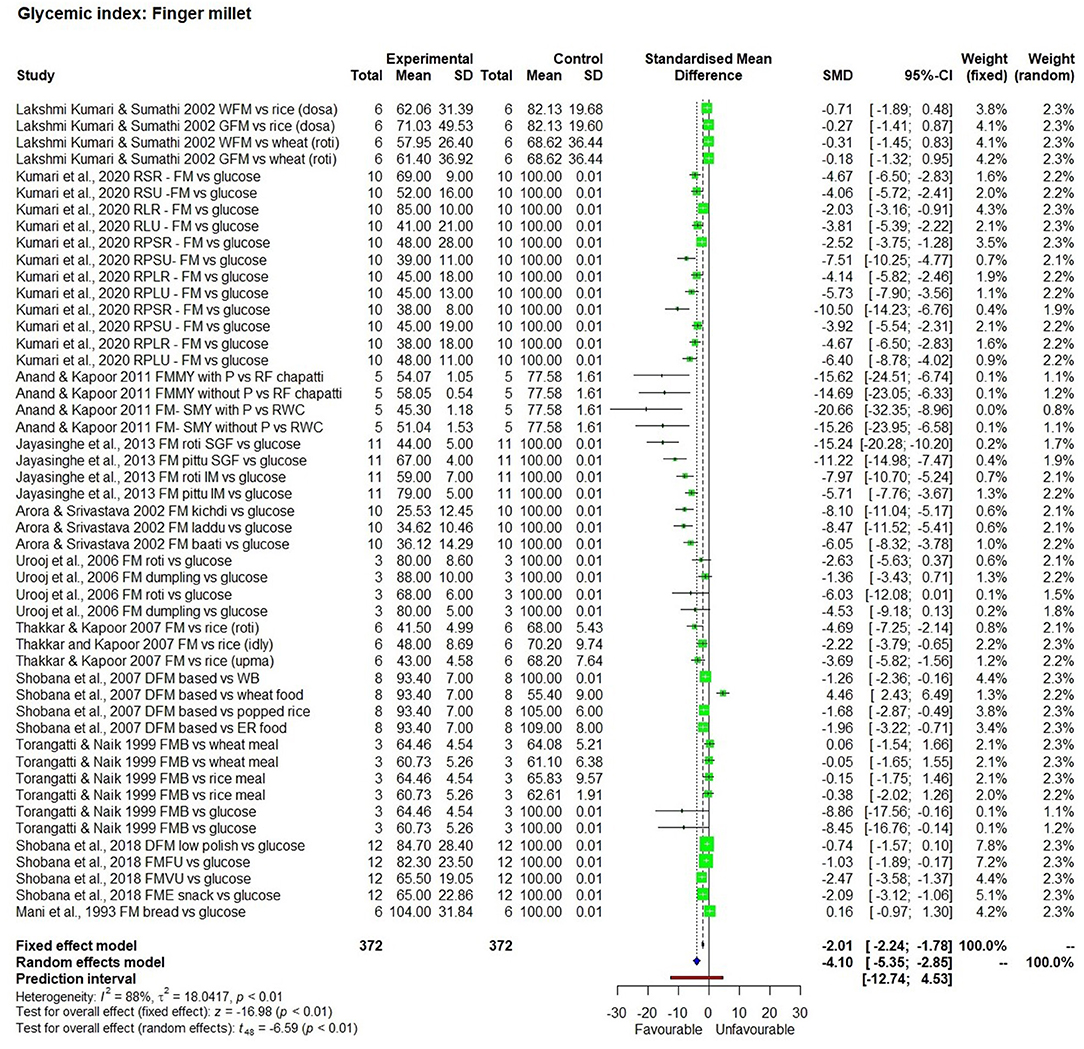
Figure 3. The Glycaemic Index of a finger millet diet compared to control samples.
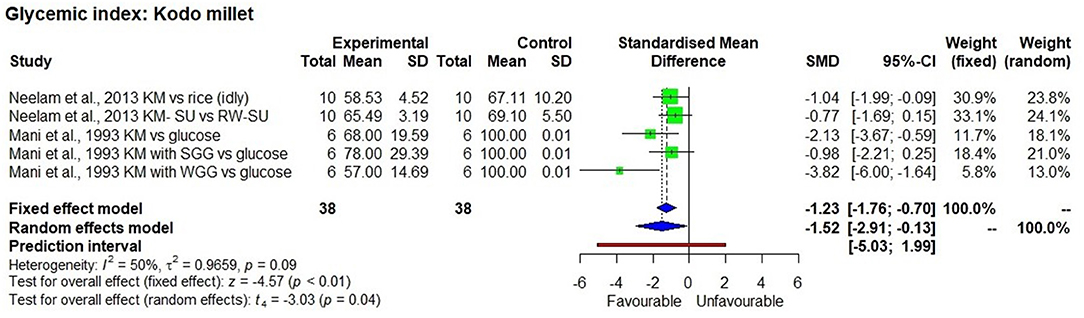
Figure 4. The Glycaemic Index of a kodo millet diet compared to control samples.
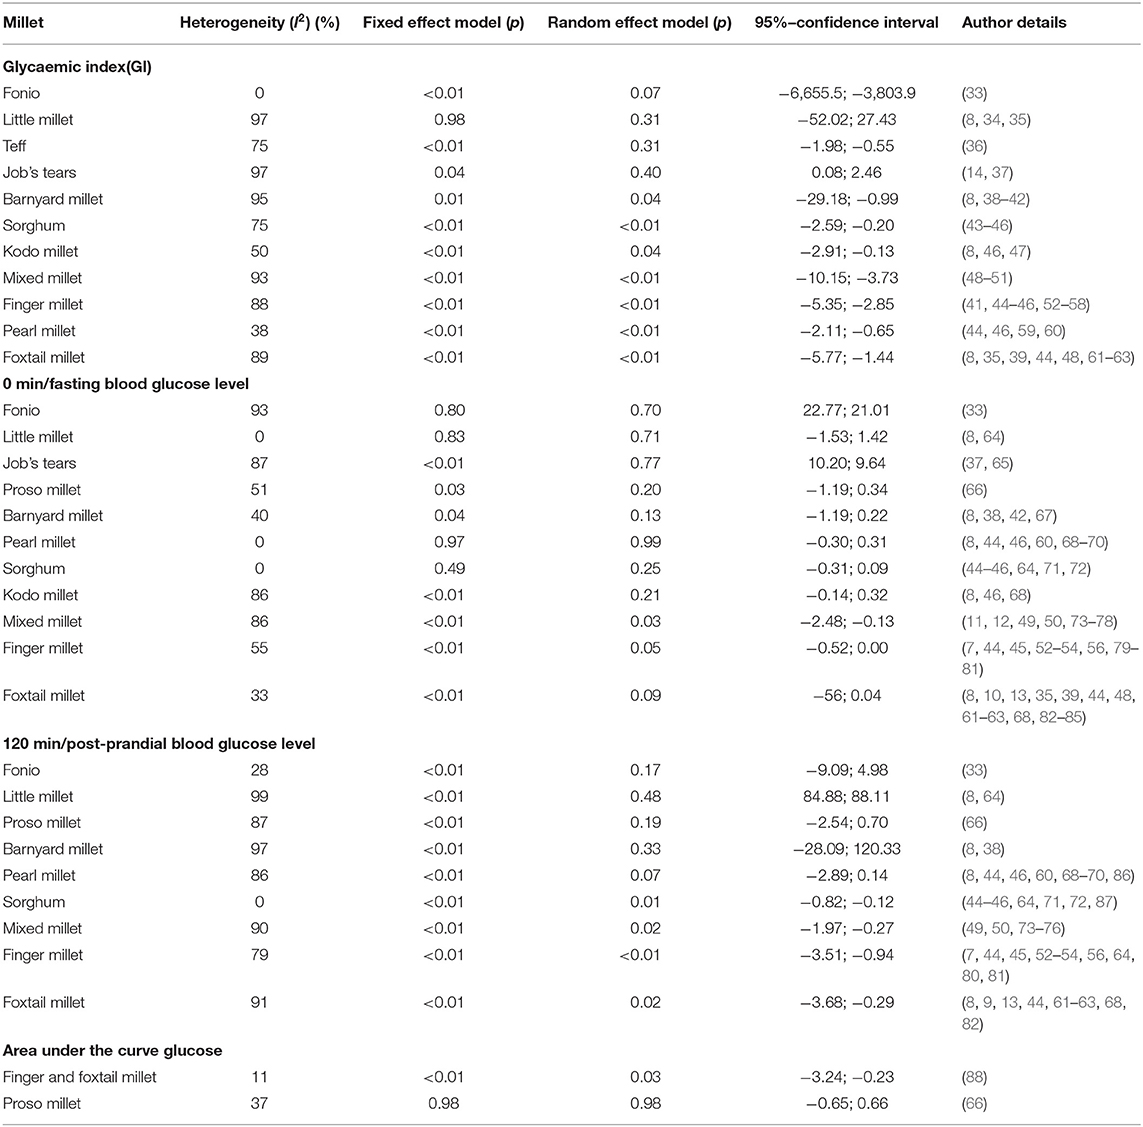
Table 3. Heterogeneity and p values from fixed and random effect models from forest plots on glycaemic index, fasting and post-prandial blood glucose levels.
Fasting and Post-prandial Blood Glucose Level
In short term studies, all the 9 millets tested for post-prandial blood glucose significantly (Table 3) reduced blood glucose concentration compared to the control sample (p < 0.01). However, short term studies with overnight fasting didn't have a significant effect on fasting blood glucose level. In contrast, Figures 5, 6 show the significant effect (p < 0.01) being fed on millets for a long time (one study for 7 days and others were for 4 weeks to several weeks) had on reducing fasting (SMD −0.89 with 95% confidence interval of −1.11; −0.67) and post-prandial (SMD −0.95 with 95% confidence interval of −1.46; −0.44) blood glucose levels. While using a random effect model, kodo millet, little millet, and barnyard millet did not have a significant effect on post-prandial blood glucose levels compared to control samples. However, fonio and proso millet came from a single source of reference and the samples were the same; so only a fixed effect model was used in the interpretation which demonstrated a significant effect in reducing post-prandial blood glucose levels.
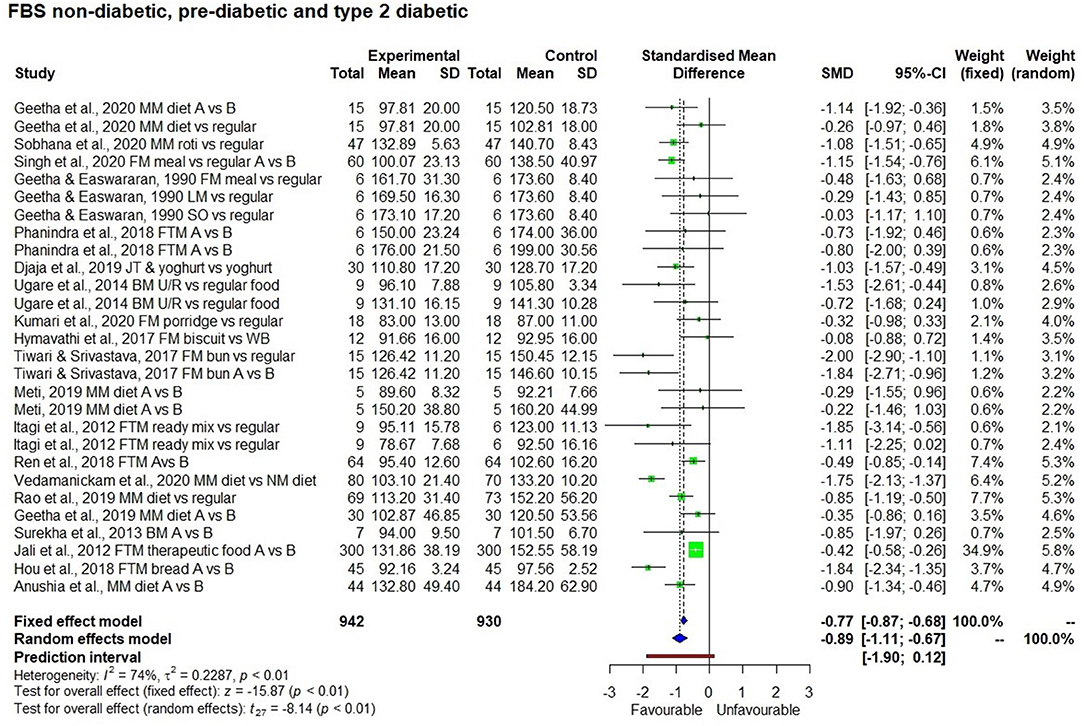
Figure 5. Effect of long term consumption of millet on fasting blood glucose levels in non-diabetic, pre-diabetic, and diabetic subjects compared to the control group consuming a regular diet or pre vs post intervention comparison.
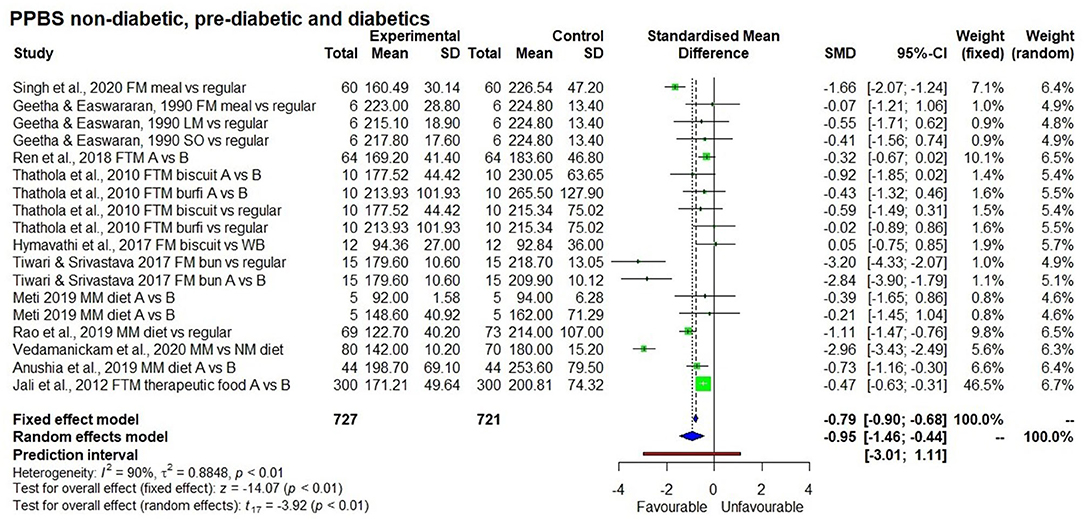
Figure 6. Effect of long term consumption of millet on post-prandial blood glucose levels in non-diabetic, pre-diabetic, and diabetic subjects compared to the control group consuming a regular diet or pre vs post intervention comparison.
HbA1c
There were six long term studies conducted to determine the effect of a millet diet on HbA1c level (Figure 7). All of them showed a reduction in HbA1c levels as a result of long term millet consumption; this reduction was significantly lower compared to when consuming a control rice-based diet or pre-intervention (baseline) HbA1c levels (p < 0.01).
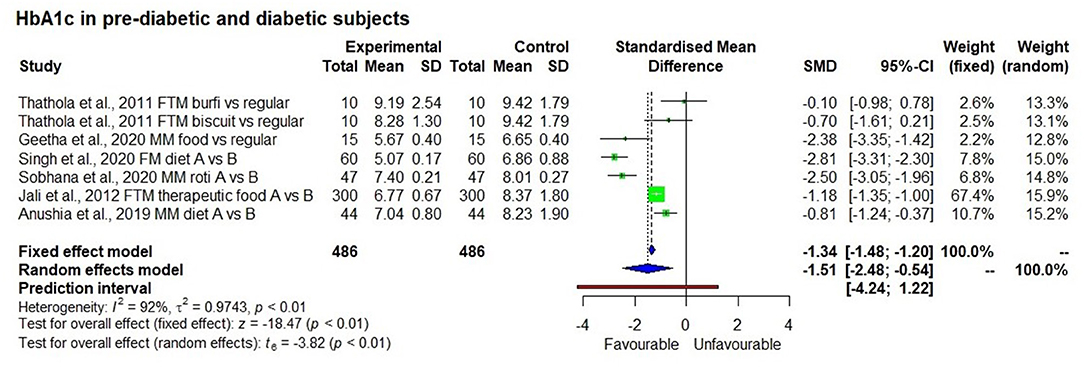
Figure 7. Effect of long term consumption of millet on HbA1c levels in pre-diabetic and diabetic subjects compared to the control group consuming a regular diet or pre vs post intervention comparison.
Insulin Level
Albeit not shown, there were five studies that determined the insulin index (1 study with 5 observations), fasting insulin level (2 studies) and Area Under the Curve of Insulin (AUC) (2 studies) as a co-effect of reduction in GI, and the result showed significant reduction in fasting insulin level (p < 0.01) and insulin index in fixed effect model with no significant effect on AUC insulin (p = 0.24).
Subgroup Analysis
Results of the subgroup analysis (Figure 8) showed that consuming a millet-based diet for a long time (>3 months) had a significant effect on reducing fasting blood glucose levels in all participants regardless of the group (non-diabetic, pre-diabetic, and diabetic) compared to a regular rice or wheat-based diet (p < 0.01). There was no significant difference among groups (p < 0.13). However, when looking at post-prandial blood glucose level, a significant reduction in blood glucose was observed among type 2 diabetic subjects compared to non-diabetic ones and the subgroup effect was significant (p < 0.01). It was not possible to see this difference between diabetic and pre-diabetic subjects due to the small number of studies on the latter. The subgroup effect was not significant (p = 0.69) based on the type of millet in reducing both fasting and post-prandial blood glucose levels; this goes to show that regardless of the type of millet, its long term consumption has the potential to reduce both fasting and post-prandial blood glucose levels.

Figure 8. The effect of long term consumption of millet on non-diabetic, pre-diabetic and diabetic subjects consuming millet compared to a control group consuming a regular diet.
Regression Analysis
GI levels varied among various millets with the average GI of low to intermediate. Various millets and food forms tested in 63 studies with 267 observations on millets and sorghum and 267 observations on maize, wheat, rice, or reference food (glucose or wheat bread). Millets had low GI (≤55%), lower than milled rice, refined wheat flour, white wheat bread, maize, or glucose (reference food).
Table 4 presents the frequency distribution of all the categorical independent factors included in the regression analysis. Finger millet and foxtail millet were the most frequently observed crops, followed by rice, wheat and sorghum. Most cases used food made from a refined grain, while a few cases used food originating from whole grain. Boiling was the most common cooking method, followed closely by baking (and/or roasting). About 14% of the cases used the in vitro estimation of GI values while the rest tested on normal subjects (59%) and type 2 diabetic subjects (27%).
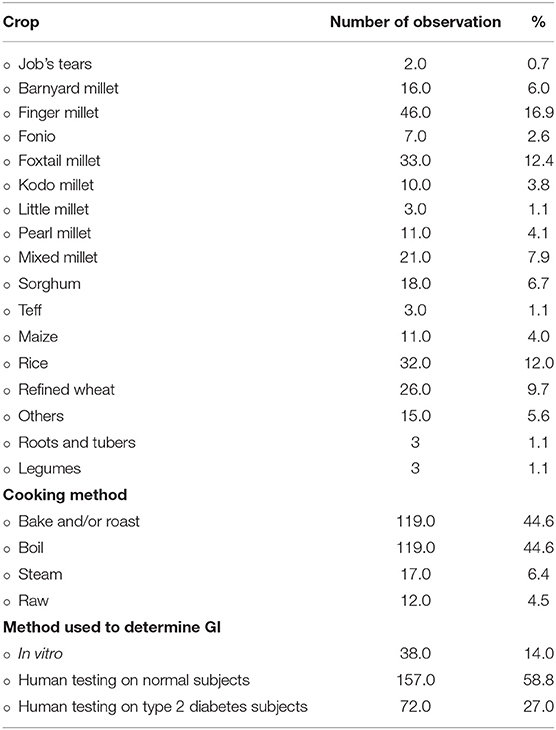
Table 4. Frequency distribution of the independent variables in the regression analysis: crop, cooking method, and method used to determine GI (n = 267).
Table 5 shows the results of the Cluster-Robust OLS analysis of the effects of different crops on GI values. To keep the table succinct, the 63 control variables included controlling for literature fixed effects were dispensed with. The result indicates that 14 out of the 18 analysed crops had negative and statistically significantly lower (p < 0.10) GI values compared to maize flour-based control food. In descending order, the marginal effects were −35.6 for Job's tears, −28.9 for fonio, −29.9 for foxtail millet, −27.1 for teff, −27.2 for barnyard millet, −26.4 for mixed millet, −26.0 for finger millet, −22.7 for sorghum, and −20.1 for kodo millet.
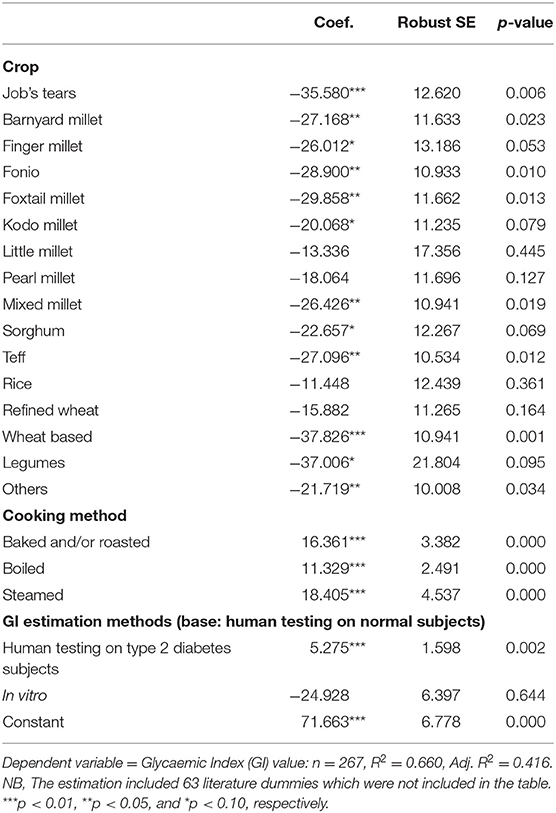
Table 5. The effects of crop choice on GI values compared with maize, using ordinary least squares with cluster-robust standard errors.
Discussion
Most of the studies showed a glucose-lowering effect of various types of millets that were served in various forms compared to the control foods. A variety of processed products and cooking methods were tested and often compared to milled rice, refined wheat and maize-based foods. The regression analysis clearly shows that millets have a lower GI compared to other cereals such as maize, milled rice and refined wheat flour. This means, for instance, that when Job's tears-based food was consumed, the GI value was significantly lower by 36 units on average than when maize-based food was consumed, taking into account that all the other conditions (i.e., processing, cooking methods, type 2 diabetes condition, and GI estimation methods) were equal. Similarly, when foxtail millet-based food was consumed, the GI value was significantly lower by 30% on average than maize-based food (Table 5). It may be noted that Job's tears-based food is comparable with whole wheat-based food and legumes as these two foods lower GI by 37.8 units and 37.0 units, respectively on average than the consumption of maize-based food. Major crops such as milled rice and refined wheat did not show a GI advantage against maize, indicating that they tend to have relatively high GI values. On the other hand, among the broad group of millet crops (millets, sorghum, and teff), all of them showed lower GI values except little and pearl millet, for which the coefficient was negative (−13.3 and −18.1) but not statistically significant (p = 0.445 and 0.127).
All the cooking methods raised GI values. In particular, steaming, baking (including flat bread cooked in a pan) and boiling increased the GI of the food by up to 18.4 units, 16.3 units and 11.3 units, respectively. Despite this, the overall GI of millets was 52.7. This could be due to the addition of other ingredients such as fats and oils in different types of cooking. Somewhat unexpectedly, the use of whole grain millets did not affect GI values significantly compared to decorticated millets. This could be because of the fewer sample numbers that used whole grain.
The coefficient of type 2 diabetes showed that subjects with type 2 diabetes tend to exhibit higher GI (+5.3, p = 0.002) values after a meal compared to those without diabetes. The coefficient of the in vitro estimation was not significant, implying that on an average the GI values were not different when in vitro estimation was used instead of human testing on non-diabetic subjects, which supports the validity of the GI values estimated with in vitro experiments. Although not included in the table, the additional analysis using the interaction terms between the type 2 diabetes condition and crop variables showed that the GI benefits from millets such as barnyard millet, finger millet, fonio, foxtail millet, kodo millet, pearl millet, and sorghum did not differ between type 2 diabetic subjects and non-diabetic subjects. This indicated that these millets may be more effective in lowering GI values compared to major cereals irrespective of whether the subjects were diabetic or not. These findings demonstrate that the consumption of food items made from various millets contribute to keeping the blood glucose level low compared to the food based on maize and milled rice. Moreover, barnyard millet, fonio, foxtail millet, kodo millet, pearl millet, and sorghum were equally beneficial for type 2 diabetes and non-diabetes individuals.
The regression analysis' results were generally supported by the meta-analysis conducted for the data on GI which showed that all the studies except those on little millet had no significant effect on reducing blood glucose levels.
Two forest plots constructed during the meta-analysis were repeated in different ways to determine the effect of removing one study that was identified as an outlier or having an odd Standard Mean Difference (SMD) value. In finger millet, the study conducted by Ruhembe et al. (89) showed highest SMD of 230 while the overall SMD of the study was −1.84. Removing this particular study changed the overall effect with an SMD of −3.38. Similarly in sorghum, the same study showed highest SMD of 311.16 vs. an overall SMD of 14.49; removing the study changed the SMD to −1.2 and the p-value became more significant. These two studies were masking the effect of other studies, and this could be because of the lack of non-random sample selection and allocation, no blinding test (both participants and the testing person) and eventually scored highly critical rank in risk assessment. Therefore, the risk of bias could be reflected in getting small standard deviation between sample and high SMD in the meta-analysis. There were only 5 studies available on little millet, of which 2 didn't have complete data on SD and hence were not used in the meta-analysis. Of the 5 studies, only 1 reported that little millet has high GI (35). The SMD value reported by Malavika et al. (35) deviated highly from all other studies. If that one study was removed, then little millet showed a significant effect on reducing GI in the fixed effect model (p < 0.01). The high GI in little millet was attributed to polishing millets. However, this study needs a detailed evaluation to generate more evidence on little millet given the limited number of studies available. Proso millet was studied by only one author (66) who didn't calculate GI but studied the change in blood glucose level for a period of 2 h after the consumption of proso millet products which showed significant reduction in blood glucose level (p < 0.05).
It may be noted that consuming a millet-based diet for long periods (more than 3 months) was also associated significantly with reduced HbA1c marker levels in both pre-diabetic and diabetic subjects (p < 0.01) compared to consuming a regular rice or wheat-based diet or pre-intervention HbA1c level. HbA1c is a glycated haemoglobin, i.e., it is bound to glucose and is different from free unbound glucose in blood. Unlike fasting blood glucose level which reflects the blood glucose level at a particular point of testing time, HbA1c reflects the average blood glucose level typically over a period of 8 to 12 weeks and is therefore an indicator of long-term glycaemic control. Overall, there was a 15% reduction in HbA1c level (from 8.1 ± 1.0 to 7.0 ± 1.4%). Especially in pre-diabetic subjects, HbA1c levels fell to the normal reference level (from 6.65 ± 0.4 to 5.67 ± 0.4%) (12). The reduction is attributed to the high fibre content and low glycaemic index of the millet-based diet (11) which reduces the availability of glucose to form HbA1c and thereby regulates the HbA1c glycation process. It is evident that a millet- based diet has a positive effect on managing diabetes.
Another study conducted on pre-diabetic subjects (those with impaired glucose tolerance) fed on foxtail millet (82) for a long period (12 weeks) showed that the fasting blood glucose level reduced to normal levels (from 102.6 ± 16.2 to 95.4 ± 12.6 mg/dl) in 64 study subjects (p < 0.001). This is evidence of millets' effect on averting rising blood glucose levels and preventing pre-diabetic individuals from entering the diabetic stage. However, more studies are needed to reconfirm this.
It is important to note that most of the studies were conducted after overnight fasting and the introduction of the test food or control food as breakfast. This was followed by the measurement of fasting and post-prandial blood glucose levels. This method does not give information on how the glycaemic response might change after acclimatisation to millet-based food. However, 21 studies conducted using millet as a test food for long periods of time ranging from 7 days to several weeks after which fasting and post-prandial blood glucose levels were measured, provided information on changes in both levels after acclimatisation to millet-based food. The results show that consuming millet for a long duration has a positive effect of reducing both fasting blood glucose level (p < 0.05) by 12%, with a mean reduction of 16 mg/dl (from 134 mg/dl to 117.9 mg/dl) and post-prandial blood glucose level by 15%, with a mean reduction of 30 mg/dl (from 202 to 172 mg/dl) which is near normal levels for diabetic subjects. While testing after overnight fasting (short term studies) had no significant effect on fasting blood glucose level, there was a significant reduction (p < 0.05) in post-prandial blood glucose level.
There were only two studies (14, 62) that determined insulin index and GI. It may be noted that although Job's tears' GI was low (55), its insulin index was slightly higher (67). The insulin index in Job's tears was less compared to brown rice (81%) and Taro or colacasia esculenta, a root vegetable (73%). The author of these studies ascribed the insulin response of the food increase to the co-injection of protein or fat through the meal. This clearly suggests the need for extreme caution while preparing food for diabetic individuals to ensure it has not just low GI but also a low insulin index to avoid raising insulin levels in the blood; high insulin concentration is associated with insulin resistance and cardiac risk (14). Consuming millet based diet for three months was shown to increase in mean insulin sensitivity from 68.1 ± 4.7 to 88.2 ± 6.0 (11). Ren et al. (62) demonstrated that when foxtail millet was cooked with only water, the insulin index was very low (49.8) compared to processed food, and the ratio of insulin index and GI was <1 compared to the processed products. Hence, it was reported as a suitable product for managing diabetes.
Several studies have shown that resistance starch formation in millets and high fibre in millet retard starch hydrolysis, thereby exhibiting low GI (45) and its potential to reduce blood glucose level. The high presence of a non-starch polysaccharide such as dietary fibre in millets compared to wheat and rice (90) decreases enzymes' activities in the gut and results in incomplete hydrolysis of carbohydrates, protein and fats present in millet-based diets. This delays the absorption of starchy polysaccharides and lowers the rate of absorption of mono and disaccharides (46), thereby exhibiting low glycaemic response. High resistant starch formation in millets is due to the presence of amylose which tends to retrogradation of starch (set back viscosity) which forms resistant starch and thereby is difficult to hydrolyze by digestive enzymes (61), leading to low glycaemic response. Also, fat and protein content in any food slow down the rate of gastric emptying, thereby slowing down the digestion of food in the intestine. Millets are known to have high protein and fat compared to milled rice (90) and thereby contributing to low GI (61), this is because, protein and fat combined with other factors slows down the digestion in small intestine which leads to incomplete digestion and thereby contributes to low GI. Protein content in millet increases insulin sensitivity thereby helping to maintain better glycaemic response.
Lakshmi Kumari and Sumathi (52) and Abdelgadir et al. (87) reported that high fibre content in finger millet gives rise to slower gastric emptying or the formation of non-absorbable complexes with carbohydrates in the gut lumen. Itagi et al. (10), Thilakavathy and Muthuselvi (68), Pathak et al. (48) and Narayanan et al. (13) have also reported the glucose lowering effect of finger millet due to high-soluble dietary fibre in food which reduces gastric emptying, the absorption of glucose after a meal and decreases the activity of digestive enzymes. This results in incomplete hydrolysis of carbohydrates, protein and fats, thereby delaying absorption. Jayasinghe et al. (55) reported that when two different processing methods such as stone milling and industrial milling were used to make flour, the large particles of flour produced make starch gelatinization relatively difficult and slow down enzyme attack. This slows down the release of glucose from food, causing a significant decrease in glycaemic response. Nambiar and Patwardhan (60) reported both high GI of some foods and low GI of others which they attribute to processes like boiling and pressure (steam) cooking that result in faster rates of digestion compared to roasting. This could be the reason for the high GI in khichadi (a mix of pulse, millet, spices) compared to cheela (savoury pancake), thalipeeth (savoury multi-grain flat bread), sorghum bhakri (round flat unleavened bread), and wheat roti. It is further confirmed in current systematic review, that boiling of millet in whole or decorticated form either unprocessed or minimally processed by milling into coarse grain or flour produced average GI of 52.1 ± 3.9 (low GI) compared to milled rice (63.1 ± 10.7) or maize (58.8 ± 18.9). In addition, Ren et al. (82) clearly demonstrates that including foxtail millet in the diet can reduce fasting blood glucose level provided the consumer is restricted to the specified diet, which is important contributing factor in achieving impact.
A risk of bias assessment conducted on all the 65 studies revealed that more than 50% of them had low risk of bias. High risk of bias in the overall effect is contributed by blinding of samples tested. Some studies indicated that blinding was not possible with millet-based foods due to their unique texture, flavour and appearance (66, 82). However, participants were blinded for the proportion of millet in any food tested and the name of the millet (70, 86). The asymmetrical funnel plot obtained was due to the small sample size which created publication bias. This effect on the funnel plot was adjusted and accounted for using trim and fill method until the plot became symmetrical (p < 0.0001; Figure 9).
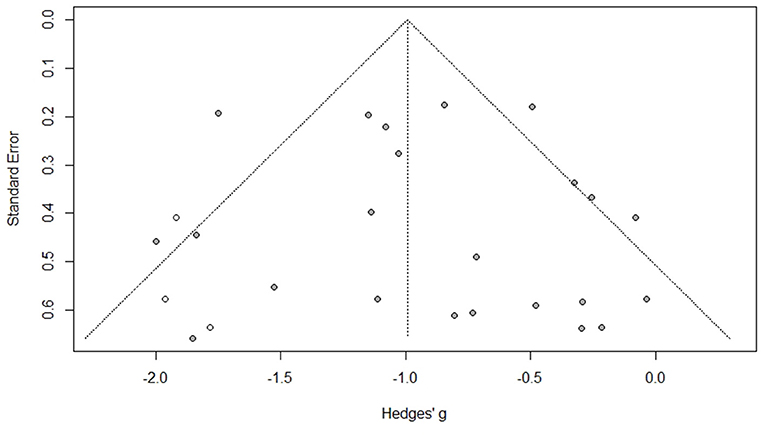
Figure 9. Publication bias assessment of the long term studies used for fasting blood glucose level as an effect of consuming millet-based meal (after applying trim and fill method) (p < 0.0001).
Limitations of the Study
Most of the in vivo studies included in the systematic review did not have the standard number of 8–12 subjects to determine GI, as recommended by FAO/WHO (91). Some studies had as few as three subjects, which is a major limitation; but they were not excluded considering the limited number of studies available for some of the millets and the importance of this information. There were only two studies conducted on pre-diabetic subjects to establish the link between millet-based food and its diabetes preventing effect through the reduction of HbA1c and fasting blood glucose levels from higher to normal range. The great variability in using control food further reduced the sample size corresponding to each control. The age group effect was not analysed as most of the studies presented the age group as mean age group rather than the range, which was another limitation.
Recommendation on Methodology for Future Research
The study captured evidence from the 1990s to 2020. There was no uniformity in method used; only a few studies mentioned having followed 2010 ISO standards. Using this standard to determine GI improves the accuracy of results and uniformity among different studies (regardless of geography and laboratory) as the standard deviation obtained from different laboratories using ISO 2010 is much lower (21).
It may perhaps be helpful to conduct interventions of longer duration by using the continuous glucose monitoring system (92). This system with a sensor can analyze interstitial fluid glucose levels at 15-min intervals for 24 h for 14 consecutive days. It can calculate the mean 24 h interstitial glucose values and incremental area under the curve (iAUC) over the 14 days for an intervention diet and the control diet and iAUC for an individual meal. The use of this system is recommended in future interventions to enhance the accuracy of results in order to generate robust and better evidence on glucose management using millets.
Conclusions
This systematic review and meta-analysis confirm that the millets evaluated have strong potential in dietary management and the prevention of diabetes. Apart from policy implications, it has implications in terms of nutrition sensitive agriculutre interventions with millets and sorghum and on the dissemination of the beneficial effect of millets and sorghum for glycaemic control.
Data Availability Statement
The original contributions generated for the study are included in the article/Supplementary Material, further inquiries can be directed to the corresponding author/s.
Author Contributions
SA and JK-P: conceptualisation. SA, JK-P, and KDVP: review and selection of papers. SA, DIG, RKB, AR, TWT, and MV: writing. JK-P: resource. SA, KS, DJP, KDVP, AR, and MV: data collection, screening, and extraction. SA, RB, and TWT: data extraction, meta-analysis, regression analysis, and risk assessment. SA, JK-P, KDVP, DIG, AR, DJP, KS, RKB, and MV: review and writing. All authors contributed to the article and approved the submitted version.
Funding
This systematic review was supported by the Smart Food Endowment fund.
Conflict of Interest
The authors declare that the research was conducted in the absence of any commercial or financial relationships that could be construed as a potential conflict of interest.
Acknowledgements
The authors would like to acknowledge the following authors and editors of journals who sent in missing data or their full paper to support this meta-analysis: Lily Arsanti Lestari, Bernatal Saragih, Chithra Muthu, Raju Nagaraju, Matthew Mcsweeney, Sun-Ok Lee, Damayanti Korrapati, Neelam Yadav, Radhai Sree, Jali M.V, and Alegbejo Janet. We also thank author Ram B. Singh who clarified having used finger millet in his study. The support rendered in data collection by the staff and library of the Avinashilingam University for Women, Coimbatore, is gratefully acknowledged. Thanks are also due to M. Azim Aijaz, Associate Managing Editor, Journal of Pure and Applied Microbiology (JPAM) for providing the article. Our special thanks goes to Joycelyn M. Boiteau, Division of Nutritional Sciences, Cornell University, Tata-Cornell Institute for Agriculture and Nutrition, United States, for reviewing this paper. The authors acknowledge Ms. Smitha Sitaraman, ICRISAT, for editing the manuscript.
Supplementary Material
The Supplementary Material for this article can be found online at: https://www.frontiersin.org/articles/10.3389/fnut.2021.687428/full#supplementary-material
References
1. International Diabetes Federation. Global Diabetes Data Report 2010–2045. Available online at: diabetesatlas.org
2. Anitha S, Kane-Potaka J, Tsusaka TW, Tripathi D, Upadhyay S, Kavishwar A, et al. Acceptance and impact of millet-based mid-day meal on the nutritional status of adolescent school going children in a peri urban region of Karnataka State in India. Nutrients. (2019) 11:2077. doi: 10.3390/nu11092077
3. Poole N, Kane-Potaka J. The Smart Food Triple Bottom Line – Starting with Diversifying Staples Including Summary of latest Smart Food studies at ICRISAT, Agriculture for Development journal, No. 41. Tropical Agriculture Association (2020). p. 21–3. Available online at: https://taa.org.uk/wp-content/uploads/2021/01/Ag4Dev41_Winter_2020_WEB.pdf
4. Awika JM. Major cereal grains production and use around the world. In: Awika JM, Piironen V, Bean S, editors. Implications to Food Processing and Health Promotion, Advances in Cereal Science. Washington, DC: American Chemical Society (2011). p. 1–13. doi: 10.1021/bk-2011-1089.ch001
5. Vetriventhan M, Vania C, Azevedo R, Upadhyaya HD, Nirmalakumari A, Kane-Potaka J, et al. Genetic and genomic resources, and breeding for accelerating improvement of small millets: current status and future interventions. Nucleus. (2020) 63:217–39. doi: 10.1007/s13237-020-00322-3
6. Almaski A, Shelly COE, Lightowler H, Thondre S. Millet intake and risk factors of type II diabetes: a systematic review. J Food Nutr Disord. (2019) 8:2.
7. Singh RM, Fedacko J, Mojto V, Isaza A, Dewim M, Watanabe S, et al. Effects of millet based functional foods rich diet on coronary risk factors among subjects with diabetes mellitus: a single arm real world observation from hospital registry. MOJ Public Health. (2020) 9:18–25. doi: 10.15406/mojph.2020.09.00318
8. Palanisamy T, Sree R. Efficacy of millets (foxtail, kodo, small, barnyard and pearl millet) varieties on post prandial glycaemic response in patients with type 2 diabetes. Eur J Biomedpharm Sci. (2020) 7:443–9.
9. Thathola A, Srivastava S, Singh G. Effect of foxtail millet (Setaria Italica) supplementation on serum glucose, serum lipids and glycosylated haemoglobin in type 2 diabetics. Diabet Croat. (2011) 40:23–9.
10. Itagi S, Naik R, Bharati P, Sharma P. Readymade foxtail millet mix for diabetics. Int J Sci Nat. (2012) 3:47–50.
11. Sobhana PP, Kandlakunta B, Nagaraju R, Thappatla D, Epparapalli S, Vemula SR, et al. Human clinical trial to assess the effect of consumption of multigrain Indian bread on glycaemic regulation in type diabetic participants. J Food Biochem. (2020) 44:e13465. doi: 10.1111/jfbc.13465
12. Geetha K, Geetha MY, Hulamani S, Hiremath N. Glycaemic index of millet based food mix and its effect on pre diabetic subjects. J Food Sci Technol. (2020) 57:2732–8. doi: 10.1007/s13197-020-04309-5
13. Narayanan J, Sanjeevi V, Rohini U, Trueman P, Viswanathan V. Postprandial glycaemic response of foxtail millet dosa in comparison to a rice dosa in patients with type 2 diabetes. Indian J Med Res. (2016) 144:712–7. doi: 10.4103/ijmr.IJMR_551_15
14. Lin MA, Wu MC, Lu S, Lin J. Glycaemic index, glycaemic load and insulinemic index of Chinese starchy foods. World J Gastroenterol. (2010) 16:4973–9. doi: 10.3748/wjg.v16.i39.4973
15. Selvin E, Marinopoulos S, Berkenblit G, Rami T, Brancati FL, Powe NR, et al. Meta-Analysis: glycosylated hemoglobin and cardiovascular disease in diabetes mellitus. Ann Intern Med. (2004) 141:421–31. doi: 10.7326/0003-4819-141-6-200409210-00007
16. Atkinson LZ, Cipriani A. How to carry out a literature search for a systematic review: a practical guide. BJPsych Adv. (2018) 24:74–82. doi: 10.1192/bja.2017.3
17. Mohar D, Liberati A, Tetzlaff J, Altman DG. Preferred reporting items for systematic reviews and meta-analysis: the PRISMA statement. Open Med. (2009) 3:e1000097. doi: 10.1371/journal.pmed.1000097
18. Luchini C, Stubbs B, Solmi M, Veronese N. Assessing the quality of studies in meta-analyses: advantages and limitations of the Newcastle Ottawa Scale. World J Meta-Anal. (2017) 5:80–4. doi: 10.13105/wjma.v5.i4.80
19. Peterson J, Welch V, Losos M, Tugwell P. The Newcastle-Ottawa Scale (NOS) for Assessing the Quality of Non-Randomised Studies in Meta-Analyses. Ottawa: Ottawa Hospital Research Institute (2011).
20. Bell A, Fairbrother M, Jones K. Fixed and random effects models: making an informed choice. Qual Quant. (2019) 53:1051–74. doi: 10.1007/s11135-018-0802-x
21. Wolever TMS, Meynier A, Jenkins AL, Brand-Miller JC, Atkinson FS, Gendre D, et al. Glycaemic index and insulinemic index of foods: an interlaboratory study using the ISO 2010 method. Nutrients. (2019) 11:2218. doi: 10.3390/nu11092218
22. Harrer M, Cuijpers P, Furukawa TA, Ebert DD. Doing META-analysis in R: A Hands-on Guide. (2019). Available online at: https://bookdown.org/MathiasHarrer/Doing_Meta_Analysis_in_R/
23. Zlowodzki M, Poolman RW, Kerkhoffs GM, Tornetta P, Bhandari M. How to interpret a meta-analysis and judge its value as a guide for clinical practice? Acta Orthopaedica. (2007) 78:598–609. doi: 10.1080/17453670710014284
25. Isreal H, Richter RP. A guide to understanding meta-analysis. J Orthop Sports Phys Ther. (2011) 41:496–504. doi: 10.2519/jospt.2011.3333
26. Balduzzi S, Rücker G, Schwarzer G. How to perform a meta-analysis with R: a practical tutorial? Evid Based Ment Health. (2019) 22:153–60. doi: 10.1136/ebmental-2019-300117
27. Anitha S, Munthali W, Msere HW, Swai E, Muzanila Y, Sichone E, et al. Occurrence of aflatoxins and its management in diverse cropping systems of central Tanzania. Mycotoxin Res. (2017) 33:323–31. doi: 10.1007/s12550-017-0286-x
28. Hutcheson GD, Sofroniou N. The Multivariate Social Scientist: Introductory Statistics Using Generalized Linear Models. Sage Publications (1999).
29. Abadie A, Athey S, Imbens GW, Jeffrey W. When Should You Adjust Standard Errors for Clustering? NBER working paper series. (2017). Available online at: http://www.nber.org/system/files/working_papers/w24003/w24003.pdf
30. Seetha A, Tsusaka TW, Munthali TW, Musukwa M, Mwangwela A, Kalumikiza Z, et al. How immediate and significant is the outcome of training on diversified diets, hygiene and food safety? An effort to mitigate child undernutrition in rural Malawi. Public Health Nutr. (2018) 21:1156–66. doi: 10.1017/S1368980017003652
31. Shumoy H, Bockstaele FV, Devecioglu D, Raes K. Effect of sourdough addition and storage time on in vitro starch digestibility and estimated glycaemic index of tef bread. Food Chem. (2018) 264:34–40. doi: 10.1016/j.foodchem.2018.05.019
32. Olagunju AL, Omoba OS, Enujiugha VN, Aluko RE. Development of value-Added nutritious crackers with high antidiabetic properties from blends of Acha (Digitaria exilis) and blanched pigeon pea (Cajanus cajan). Food Sci Nutr. (2018) 6:1791–1802. doi: 10.1002/fsn3.748
33. Alegbejo J, Ameh DA, Ogala W, Salisu I. Glycaemic index and load of acha (fonio) in healthy and diabetic subjects. J Pure Applied Microbiol. (2011) 5:117–22.
34. Patil KB, Bharati CV, Sunanda I. Glycaemic index and quality evaluation of little millet (Panicum miliare) flakes with enhanced shelf life. J Food Sci Technol. (2015) 52:6078–6082. doi: 10.1007/s13197-014-1663-5
35. Malavika M, Shobana S, Vijayalakshmi P, Ganeshjeevan R, Gayathri R, Kavitha V, et al. Assessment of quality of minor millets available in the south Indian market & glycaemic index of cooked unpolished little & foxtail millet. Indian J Med Res. (2020) 152:401–9. doi: 10.4103/ijmr.IJMR_2309_18
36. Dereje N, Bekele G, Nigatu Y, Worku Y, Holland RP. Glycaemic index and load of selected ethiopian foods: an experimental study. J Diabetes Res. (2019) 2019:1–5. doi: 10.1155/2019/8564879
37. Saragih B. Glycaemic index and functional properties of jelai (Coix lacryma-Jobi L). In: International Conference on Tropical Agrifood, Feed and Fuel (ICTAFF). Samarinda (2018).
38. Joshi S, Srivastava S. Barnyard millet as a substitute of rice in preparation of khichdi for diabetics. Int J Sci Res. (2016) 5:1798–802. doi: 10.21275/v5i6.NOV164628
39. Anju T, Sarita S. Suitability of Foxtail millet and barnyard millet for development of low GI biscuits 361 suitability of foxtail millet (Setaria italica) and barnyard millet (Echinochloa frumentacea) for development of low glycaemic index biscuits. Malays J Nutr. (2010) 16:361–8.
40. Bisht AT, Srivastava S. Efficacy of millets in the development of low glycaemic index sweets for diabetics. Malays J Nutr. (2013) 19:215–22.
41. Arora S, Srivastava S. Suitability of millet-based food products for diabetics. J Food Sci Technol. (2002) 39:423–6.
42. Ugare R, Chimmad B, Naik R, Bharati P, Itagi S. Glycaemic index and significance of barnyard millet (Echinochloa frumentacae) in type II diabetics. J Food Sci Technol. (2014) 51:392–5. doi: 10.1007/s13197-011-0516-8
43. Prasad MPR, Dayakar Rao B, Kalpana K, Vishuvardhana Rao M, Patil JV. Glycaemic index and glycaemic load of sorghum products. J Sci Food Agri. (2014) 95:1626–30. doi: 10.1002/jsfa.6861
44. Torangatti G, Naik R. Glycaemic and lipemic response of composite foods in normal and NIDDM subjects. Int J Diabetic Dev Countries. (1996) 19:161–71.
45. Urooj A, Rupashri K, Puttraraj S. Glycaemic responses to finger millet based indian preparations in non-insulin dependent diabetic and healthy subjects. J Food Sci technol. (2006) 43:620–5.
46. Mani UV, Prabhu BM, Damle SS, Mani I. Glycaemic index of some commonly consumed foods in western India. Asia Pac J Clin Nutr. (1993) 2:111–4.
47. Neelam Y, Kanchan C, Alka S, Alka G. Evaluation of hypoglycaemic properties of kodo millet based food products in healthy subjects. J Pharm. (2013) 3:14–20. doi: 10.9790/3013-32201420
48. Pathak P, Srivastava S, Grover S. Development of food products based on millets, legumes and fenugreek seeds and their suitability in the diabetic diet. Int J Food Sci Nutr. (2000) 51:409–14. doi: 10.1080/096374800427019
49. Gowri Manohari R, Poongodi Vijayakumar T. Characterization and glycaemic load of ready to cook (RTC) prebiotic flour mixture. Int J Sci Nat. (2013) 4:591–7.
50. Nagaraju R, Sobhana PP, Thappatla D, Epparapalli S, Kandlakunta B, Korrapati D. glycaemic index and sensory evaluation of whole grain based multigrain Indian breads (rotis). Prevent Nutr Food Sci. (2020) 25:194–202. doi: 10.3746/pnf.2020.25.2.194
51. Nidhi K, Alka G, Sarita S. Development of low glycaemic foods with the use of pearl millet and finger millet. Int J Sci Res. (2014) 3:193–5. doi: 10.15373/22778179/August2014/55
52. Lakshmi Kumari P, Sumathi S. Effect of consumption of finger millet on hyperglycemia in non-insulin dependent diabetes mellitus (NIDDM) subjects. Plant Foods Human Nutr. (2002) 57:205–13. doi: 10.1023/A:1021805028738
53. Kumari D, Chandrasekara A, Athukorale P, Shahidi F. Finger millet porridges subjected to different processing conditions showed low glycaemic index and variable efficacy on plasma antioxidant capacity of healthy adults. Food Product Proc Nutr. (2020) 2:13. doi: 10.1186/s43014-020-00027-9
54. Anand D, Kapoor R. Attenuation of post prandial glycaemic response of refined flour chapatti with probiotic containing soya based yoghurt. J Dairy Food Home Sci. (2011) 30:252–6.
55. Jayasinghe MA, Ekanayake S, Nugegoda DB. Effect of different milling methods on glycaemic response of foods made with finger millet (Eucenea coracana) flour. Ceylon Med J. (2013) 58:148–52. doi: 10.4038/cmj.v58i4.6305
56. Thakkar R, Kapoor R. Enrichment of rice and finger millet based preparations with gum acacia and their effects on glycaemic response in non-insulin dependent diabetic subjects. J Food Sci Technol. (2007) 44:183–5.
57. Shobana S, Singh R, Kumari U, Malleshi NG, Ali SZ. Glycaemic response of rice, wheat, and finger millet based diabetic food formulations in normoglycaemic subjects. Int J Food Sci Nutr. (2007) 58:363–72. doi: 10.1080/09637480701252229
58. Shobana S, Selvi RP, Kavitha V, Gayathri N, Geetha G, Gayathri R, et al. Development and evaluation of nutritional, sensory and glycaemic properties of finger millet (Eleusine coracana L.) based food products. Asia Pac J Clin Nutr. (2018) 27:84–91. doi: 10.6133/apjcn.032017.18
59. Shubhashini V, Ushadevi C. Estimation of glycaemic index of pearl millet. Int J Adv Res. (2014) 2:922–9.
60. Nambiar VS, Patwardhan T. Assessment of glycaemic index (GI) and glycaemic load (GL) for selected traditional millet-based Indian recipes. Int J Diabetes Dev Countries. (2015) 35:S157–62. doi: 10.1007/s13410-014-0275-y
61. Wahlang B, Joshi N, Ravindra U. Glycaemic index lowering effect of different edible coatings in foxtail millet. J Nutr Health Food Eng. (2018) 8:404–8. doi: 10.15406/jnhfe.2018.08.00303
62. Ren X, Chen J, Molla MM, Wang C, Diaob X, Shen Q. In vitro starch digestibility and in vivo glycaemic response of foxtail millet and its products. Food Funct. (2015) 7:372–9. doi: 10.1039/C5FO01074H
63. Lestari LA, Huriyati E, Marsono Y. The development of low glycaemic index cookie bars from foxtail millet (Setaria italica), arrowroot (Maranta arundinacea) flour, and kidney beans (Phaseolus vulgaris). J Food Sci Technol. (2017) 54:1406–13. doi: 10.1007/s13197-017-2552-5
64. Geetha C, Eswaran P. Hypoglycaemic effect of millet incorporated breakfast items; on selected non-insulin dependent diabetic patients. Ind J Nutr Dietet. (1990) 27:316–20.
65. Djaja N, Permadi I, Witjaksono F, Soewondo P, Abdullah M, Agustina R, et al. The effect of Job's tears-enriched yoghurt on GLP-1, calprotectin, blood glucose levels and weight of patients with type 2 diabetes mellitus. Med J Nutrition Metab. (2019) 12:163–71. doi: 10.3233/MNM-180258
66. McSweeney MB, Ferenc A, Smolkova K, Lazier A, Tucker A, Seetharaman K, et al. Glycaemic response of proso millet-based (Panicum miliaceum) products, Int J Food Sci Nutr. (2017) 68:873–80. doi: 10.1080/09637486.2017.1301890
67. Surekha N, Devi R, Naik RS. Development of value added low glycaemic index barnyard millet (Echinochloa frumentacea Link) noodles. Int J Food Nutr Sci. (2013) 2:20–4.
68. Thilakavathy S, Muthuselvi S. Development and evaluation of millets incorporated chappathi on glycaemic response in type II diabetics. Indian J Nutr Dietet. (2010) 2:42–50.
69. Aliyu L, Tijjani SA, Ameh DA, Babagana A. Glycaemic index of traditional meal (dambu) from pearl millet and maize maimuna. Sci J Anal Chem. (2020) 8:29–32. doi: 10.11648/j.sjac.20200801.15
70. Alyami J, Whitehouse E, Yakubov GE, Pritchard SE, Hoad CL, Blackshaw E, et al. lycaemic gastrointestinal hormonal and appetitive responses to pearl millet or oats porridge breakfasts: a randomized crossover trial in healthy humans. Br J Nutr. (2019) 122:1142–54. doi: 10.1017/S0007114519001880
71. Poquette NM, Gu X, Lee SO. Grain sorghum muffin reduces glucose and insulin responses in men. Food Funct. (2014) 5:894–9. doi: 10.1039/C3FO60432B
72. Lakshmi KB, Vimala V. Hypoglycaemic effect of selected sorghum recipes. Nutr Res. (1996) 16:1651–8. doi: 10.1016/0271-5317(96)00184-4
73. Rao A, Prabhu D, Krishnamurthy V, Thimmaiah AK. Millets in metabolic syndrome- time to tap the potential. J Evid Based Med Healthc. (2019) 6:1284–7. doi: 10.18410/jebmh/2019/266
74. Vedamanickam R, Anandan P, Bupesh G, Vasanth S. Study of millet and non-millet diet on diabetics and associated metabolic syndrome. Biomedicine. (2020) 40:55–8.
75. Meti R. Role of multi-millet mix in reducing blood glucose levels in type II diabetic patients. IJMER. (2019) 4:27.
76. Unnikrishnan V, Chithra R, Sujitha S. Formulation of millets incorporated non-vegetarian foods and study of glycaemic index and glycaemic load. Int J Pure App Biosci. (2018) 6:291–95. doi: 10.18782/2320-7051.6786
77. Geetha K, Geetha Yankanchi M, Hiremath N. Effect of high fibre food mix on lipid profile and body weight in obese subjects. Biomed Res. (2019) 30:655–8. doi: 10.35841/biomedicalresearch.30-19-257
78. Anushia K, Uma Mageshwari J, Trueman P, Viswanathan V. The effect of millet supplementation on weight and lipid profile. TAPI J. (2018) 13:1–7.
79. Hymavathi TV, Rao SK, Boini P, Rajesh P, Rodrigues L, Sampathi S, et al. Profiling of Eleusine coracana biscuits for glycaemic index, stress and lipid. MOJ Drug Design Dev Ther. (2017) 1:52–8. doi: 10.15406/mojddt.2017.01.00010
80. Tiwari N, Srivastava S. Effect of finger millet (Eleusine coracana) buns supplementation on serum glucose and serum lipids level in type 2 diabetics. Asian. J Dairy Food Res. (2017) 36:337–40. doi: 10.18805/ajdfr.DR-933
81. Kavita MS, Prema L. Glycaemic response to selected cereal-based south indian meals in non-insulin-dependent diabetics. J NutrEnviron Med. (1997) 7:287–93. doi: 10.1080/13590849762402
82. Ren X, Yin R, Hou D, Xue Y, Zhang M, Diao X, et al. The glucose-lowering effect of foxtail millet in subjects with impaired glucose tolerance: a self-controlled clinical trial. Nutrients. (2018) 10:1509. doi: 10.3390/nu10101509
83. Phanindra P, Poshadri A, Ramesh P, Naik SS. Efficacy of therapeutic extruded snack food consumption on glycaemic response in type 2 diabetic patients. Int J Sci Eng Res. (2018) 9:1730–40.
84. Jali MV, Kamatar MY, Jali SM, Hiremath MB, Naik RK. Efficacy of value added foxtail millet therapeutic food in the management of diabetes and dyslipidamea in type 2 diabetic patients. Recent Res Sci Technol. (2012) 4:3–4.
85. Hou D, Chen J, Ren X, Wang C, Diao X, Hu X, et al. A whole foxtail millet diet reduces blood pressure in subjects with mild hypertension. J Cereal Sci. (2018) 84:13–9. doi: 10.1016/j.jcs.2018.09.003
86. Alyami J, Ladd N, Pritchard SE, Hoad CL, Sultan AA, Spiller RC, et al. Glycaemic gastrointestinal and appetite responses to breakfast porridge from ancient cereal grains: a MRI pilot study in healthy human. Food Res Int. (2017) 118:49–57. doi: 10.1016/j.foodres.2017.11.071
87. Abdelgadir M, Abbas M, Järvi A, Elbagir M, Eltom M, Berne C. Glycaemic and insulin responses of six traditional sudanese carbohydrate-rich meals in subjects with type 2 diabetes mellitus. Diabetic Med. (2004) 22:213–7. doi: 10.1111/j.1464-5491.2004.01385.x
88. Chhavi A, Sarita S. Evaluation of composite millet breads for sensory and nutritional qualities and glycaemic response. Malays J Nutr. (2012) 18:89–101.
89. Ruhembe CC, Nyaruhucha CNM, Mosha TCE. Glycaemic index of selected staple foods used in the management of type 2 diabetes mellitus in tanzania. Int J Sci Basic Applied Res. (2014) 13:48–62.
90. Longvah T, Ananthan R, Bhaskarachary K, Venkaiah K. Indian Food Composition Table. Hyderabad: National Institute of Nutrition (2017).
91. Wolever TMS, Vorster HH, Bjorck I, Brand-Miller J, Brighenti F, Mann JI, et al. Determination of the glycaemic index of foods: interlaboratory study. Eur J Clin Nutr. (2003) 57:475–82. doi: 10.1038/sj.ejcn.1601551
Keywords: millets, sorghum, diabetes, glycaemic index, glycaemic response, meta-analaysis
Citation: Anitha S, Kane-Potaka J, Tsusaka TW, Botha R, Rajendran A, Givens DI, Parasannanavar DJ, Subramaniam K, Prasad KDV, Vetriventhan M and Bhandari RK (2021) A Systematic Review and Meta-Analysis of the Potential of Millets for Managing and Reducing the Risk of Developing Diabetes Mellitus. Front. Nutr. 8:687428. doi: 10.3389/fnut.2021.687428
Received: 29 March 2021; Accepted: 07 June 2021;
Published: 28 July 2021.
Edited by:
Rakesh Bhardwaj, National Bureau of Plant Genetic Resources (ICAR), IndiaReviewed by:
Maharishi Tomar, Indian Council of Agricultural Research (ICAR), IndiaVenkateswarlu Ronda, Indian Council of Agricultural Research, India
Copyright © 2021 Anitha, Kane-Potaka, Tsusaka, Botha, Rajendran, Givens, Parasannanavar, Subramaniam, Prasad, Vetriventhan and Bhandari. This is an open-access article distributed under the terms of the Creative Commons Attribution License (CC BY). The use, distribution or reproduction in other forums is permitted, provided the original author(s) and the copyright owner(s) are credited and that the original publication in this journal is cited, in accordance with accepted academic practice. No use, distribution or reproduction is permitted which does not comply with these terms.
*Correspondence: Seetha Anitha, s.anitha@cgiar.org; dr.anithaseetha@gmail.com