Sources of Added Sugars Intake Among the U.S. Population: Analysis by Selected Sociodemographic Factors Using the National Health and Nutrition Examination Survey 2011–18
 Laurie Ricciuto
 Victor L. Fulgoni III
 P. Courtney Gaine
 Maria O. Scott
 Loretta DiFrancesco
- 1Department of Nutritional Sciences, University of Toronto, Toronto, ON, Canada
- 2Nutrition Impact, LLC, Battle Creek, MI, United States
- 3The Sugar Association, Inc., Washington, DC, United States
- 4Source! Nutrition, Toronto, ON, Canada
Recent estimates of added sugars intake among the U.S. population show intakes are above recommended levels. Knowledge about the sources of added sugars contributing to intakes is required to inform dietary guidance, and understanding how those sources vary across sociodemographic subgroups could also help to target guidance. The purpose of this study was to provide a comprehensive update on sources of added sugars among the U.S. population, and to examine variations in sources according to sociodemographic factors. Regression analyses on intake data from NHANES 2011–18 were used to examine sources of added sugars intake among the full sample (N = 30,678) and among subsamples stratified by age, gender, ethnicity, and income. Results showed the majority of added sugars in the diet (61–66%) came from a few sources, and the top two sources were sweetened beverages and sweet bakery products, regardless of age, ethnicity, or income. Sweetened beverages, including soft drinks and fruit drinks, as well as tea, were the largest contributors to added sugars intake. There were some age-, ethnic-, and income-related differences in the relative contributions of added sugars sources, highlighting the need to consider sociodemographic contexts when developing dietary guidance or other supports for healthy eating.
Introduction
Recommendations on the intake of added sugars are generally used to inform population-wide dietary guidance. The Institute of Medicine has suggested a maximum daily limit of 25% of calories from added sugars (1). More recent recommendations are lower, with the World Health Organization issuing a guideline of <10% of calories per day from “free sugars” (inclusive of both added sugars and sugars naturally present in 100% fruit juice) and a conditional recommendation for a further reduction to <5% (2). The 2020–2025 Dietary Guidelines for Americans recommend limiting foods and beverages higher in added sugars, and that a healthy dietary pattern limits added sugars to <10% of calories (3).
Estimates of added sugars intake for the U.S. population show that recent intake levels are above current recommendations; however, they are lower than previous intakes: population-wide (2+ years) daily average added sugars intake was approximately 18% of calories in 1999 to 2000 (4) compared to 13% among individuals 1+ years in 2015 to 2016 (5). However, examining added sugars intake levels without considering the sources of added sugars is not sufficient to inform dietary guidance. Furthermore, understanding how added sugars in the diet may vary across sociodemographic subgroups could also help to develop more targeted dietary guidance.
Sources of added sugars and sociodemographic factors have been examined in conjunction with added sugars intake. Such investigations have been carried out for all age groups across the U.S. population using NHANES 2009–12 (6) and for younger age groups using NHANES 2011–14 (7, 8); and results from these studies have shown that sweetened beverages and sweet bakery products are the top two dietary sources of added sugars. Based on later NHANES 2013–16 data, sweetened beverages remain the top source for most age groups (9). However, recent studies of added sugars sources and sociodemographic factors other than age and gender are limited. Factors such as ethnicity and income have been examined previously (data from 1994 to 2010) but mainly in children (10–12) or other specific cohorts (13, 14).
The purpose of the present study was to provide a comprehensive update on sources of added sugars intake among the U.S. population using NHANES 2011–18 and to examine variations in added sugars sources according to the selected sociodemographic factors: age; gender; ethnicity; and, income.
Materials and Methods
Data Source and Participants
The health and nutritional status of the U.S. population is monitored regularly through the NHANES, a cross-sectional survey conducted by the Centers for Disease Control and Prevention National Center for Health Statistics (15). The survey sample is selected through a clustered stratified multistage sampling design, with periodic oversampling of select population groups, and is representative of the non-institutionalized civilian resident population. Data collection for the dietary interview component of NHANES, called What We Eat in America (WWEIA), is conducted by the U.S. Department of Agriculture (USDA) Food Surveys Research Group (FSRG) (16). Dietary interviews are conducted by trained interviewers using the Automated Multiple Pass Method: for children 2–5 years, diet interviews are conducted with a proxy; those 6–11 years receive help from a proxy; and, individuals 12+ years complete the interviews themselves. The first 24-h dietary recall interview is conducted in person and a second 24-h recall is conducted by telephone 3 to 10 days later on a subsample of participants. Details of the NHANES survey design and dietary data collection procedures are reported elsewhere (15, 16).
We used data from four cycles of NHANES (2011–12, 2013–14, 2015–16, and 2017–18) to provide large enough sample sizes for specific groups. Analyses were conducted of added sugars sources among all age groups (2–8, 9–18, 19–50, 51–70, and 71+ years) and by gender, ethnicity, and income for those 2–18 and 19+ years.
NHANES 2011–18 procedure and protocols (#2011–17, #2018–01) were reviewed and approved by the NCHS Research Ethics Review Board. Ethical review and approval were waived for this study, due to the use of secondary data. NHANES obtained written, informed consent for all adult participants.
Added Sugars Intake and Sources
The Food Patterns and Equivalents Database (FPED), developed by the USDA FSRG, converts foods and beverages reported in the 24-h recalls into food pattern equivalents corresponding to those in the Dietary Guidelines for Americans (17). The “added sugars” food pattern component is comprised of caloric sweeteners (syrups, sugars, and others) using the definition of added sugars as “sugars that are added to foods as an ingredient during preparation, processing, or at the table; added sugars do not include naturally occurring sugars such as lactose present in milk and fructose present in whole or cut fruit and 100% fruit juice” (17), which are similarly defined for the nutrition labeling of food (18). While this definition of added sugars has been stable over time, fruit juice concentrates not diluted to single strength juices have been designated as added sugars since 2011–12, which may affect added sugars values for foods such as snack bars, ready-to-eat (RTE) cereals, baby foods, and fruit spreads. More detail on determining added sugars content of foods is provided in FPED documentation (17).
We determined added sugars intake using the FPED for each NHANES cycle. Day 1 intake data were used as these data were collected in person; whereas day 2 intakes were collected by telephone, and a validation of this method, to our knowledge, has never been reported. Furthermore, a single day of intake is sufficient for providing an accurate estimate of population mean intake (19), which was required for our analyses. Mean added sugars intake as a percentage of total calories was calculated for each age group (2–8, 9–18, 19–50, 51–70, and 71+ years) and for two overall age groups (2–18 and 19+ years) using the population ratio method, which required summing the daily added sugars intake for all individuals in a particular age group, and then dividing by the sum of daily calorie intake for the same individuals. The population ratio method was used because it provides an unbiased estimate of population intakes when using 1 day of intake data (20).
In order to facilitate analyses of population food intakes, USDA uses a food grouping scheme for WWEIA, in which foods and beverages are grouped according to their similar nutrient content and common use in the diet; and individual food categories can be combined into larger food groups if required for analytical purposes (21). We analyzed sources of added sugars based on the USDA/WWEIA food categories (Table 1). Within each of the food categories and larger food groups, mean added sugars contribution expressed as grams was determined, and then percentage of total daily added sugars intake was calculated using the population ratio method; food sources were then ranked from highest to lowest.
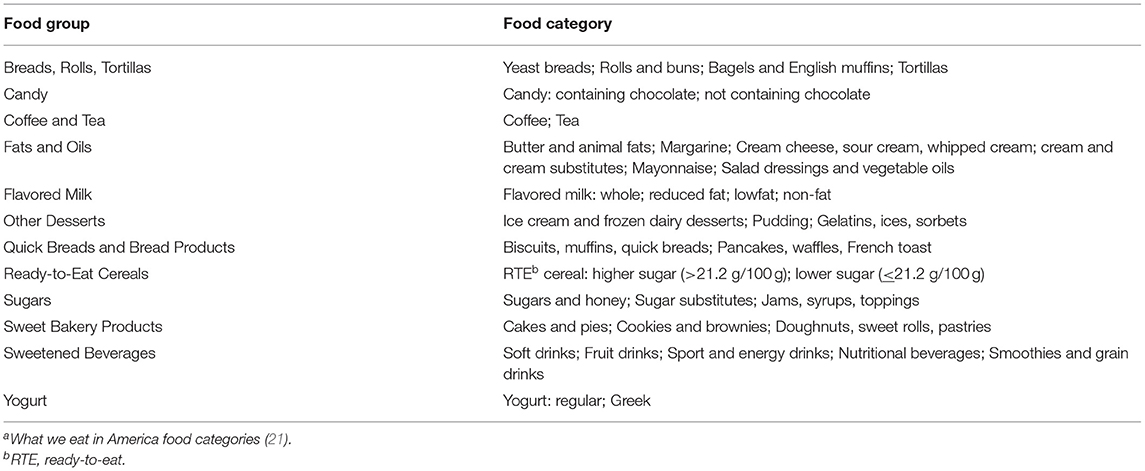
Table 1. Breakdown of food groups into types of foods (categoriesa) that provide added sugars.
Statistical Analyses
Data were analyzed using SAS 9.4 (SAS Institute, Cary, NC, USA), and weighting factors provided by NHANES were applied to adjust for the complex survey sampling design (primary sampling units and strata), non-response rates, and oversampling of certain subgroups (day 1 sample weights). Food sources contributing at least 2% to total daily added sugars intake based on NHANES 2011–12, the reference year, were considered for analysis. Linear regression analyses were used to compare mean added sugars intake from food sources in 2017–18 vs. 2011–12 for each age group, examining both the WWEIA food categories and the larger food groups. Means ± standard errors (SE) were used to present results, which is how NHANES data are typically presented. Given the large sample size used for these analyses and to help ensure extremely small differences were not deemed significant, a more conservative p-value of p < 0.01 was selected.
Additionally, the combined sample (2011–18) was stratified by gender, ethnicity (using the groups as self-defined in NHANES as Asian, Black, Hispanic, and White), and income [household poverty income ratio (PIR) of low, medium, and high (PIR<1.35, 1.35<PIR<1.85, and PIR>1.85, respectively)]. These PIR categories were chosen because similar percentages are used by the U.S. government to determine eligibility for federal programs, such as nutrition assistance and school lunch programs, with the higher values having higher socioeconomic status. Added sugars sources were then examined by gender for each age group, and by ethnicity and PIR for the two overall age groups (2–18 and 19+ years). Again, food sources contributing at least 2% to total daily added sugars intake based on NHANES 2011–12 (the reference year) were considered for analysis and regression analyses were used to compare mean added sugars intake from the WWEIA food categories sources in 2017–18 vs. 2011–12 for each age group using p < 0.01.
Results
Using data from all four cycles of NHANES (2011–18), after exclusions for unreliable dietary data (n = 5,548) as determined by the USDA FSRG, pregnant or lactating females (n = 359), and kilocalories = 0 (n = 3), the final sample size was 30,678. Distributions of sociodemographic characteristics among the final sample are shown in Table 2. The final sample size using data from NHANES 2011–12 was 7,862, and from NHANES 2017–18 was 7,035.
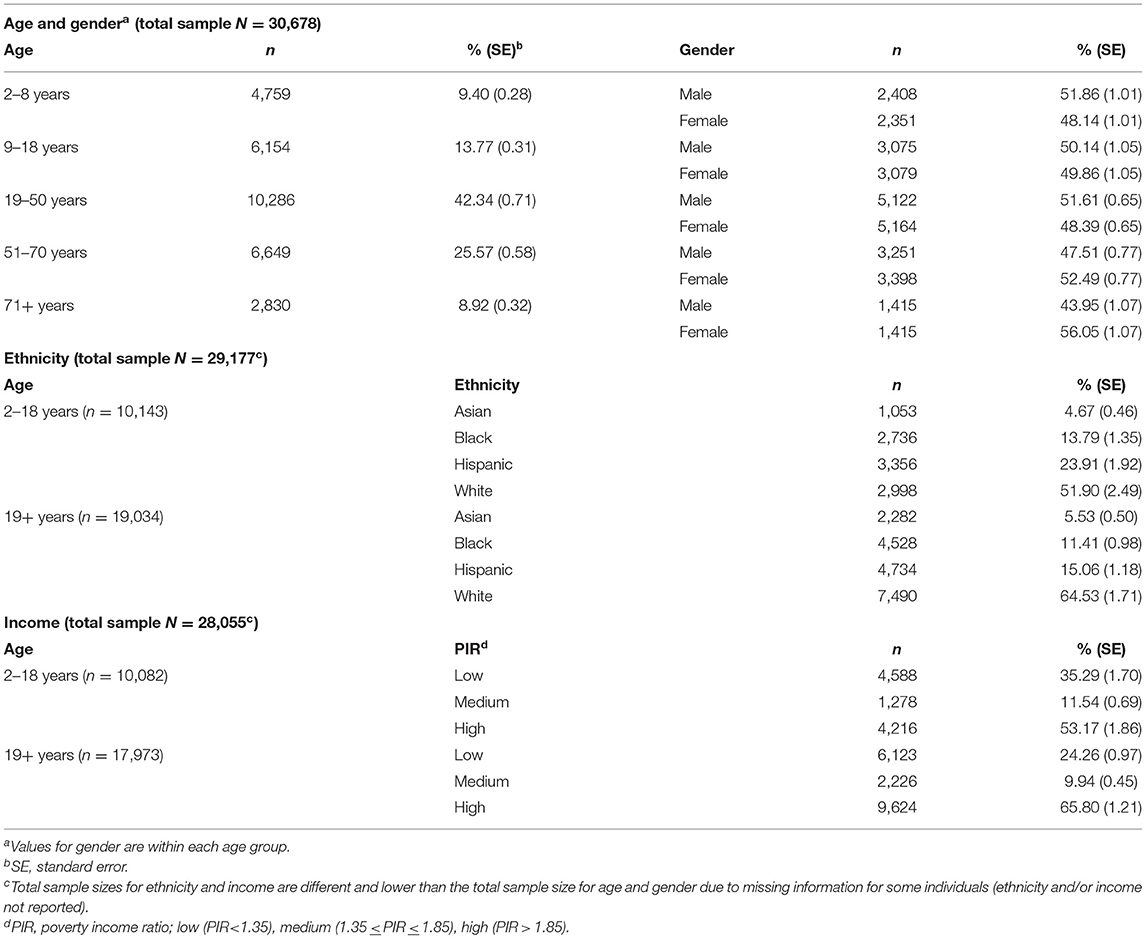
Table 2. Distribution of sociodemographic characteristics for the combined NHANES 2011–18 analytical sample.
In 2017–18, the population mean intake (SE) of added sugars as a percentage of calories was 12.7% (0.3), corresponding to a mean of 67.8 g/day (1.6). Intakes were highest among adolescents and teens 9–18 years at 14.3% (0.3), and lowest among older adults 71+ years at 11.3% (0.4), corresponding to a mean of 73.1 g/day (1.8) and 53.8 g/day (1.5) of added sugars, respectively.
Children 2–8 Years
The top two sources of added sugars among children in 2017–18 were sweetened beverages and sweet bakery products, contributing 22.8 and 19.2%, respectively, to total daily added sugars intake (Table 3). Candy, RTE cereals, and other desserts ranked number three to five, and all together two-thirds (66%) of daily added sugars intake came from the top five food groups. The contribution from sweetened beverages was significantly lower in 2017–18 compared to 2011–12, while the contribution from sweet bakery products was significantly higher; however, they remained the top two sources of added sugars. The contribution from sugars was significantly lower in 2017–18 compared to 2011–12, and it fell in rank from number six to number eight.
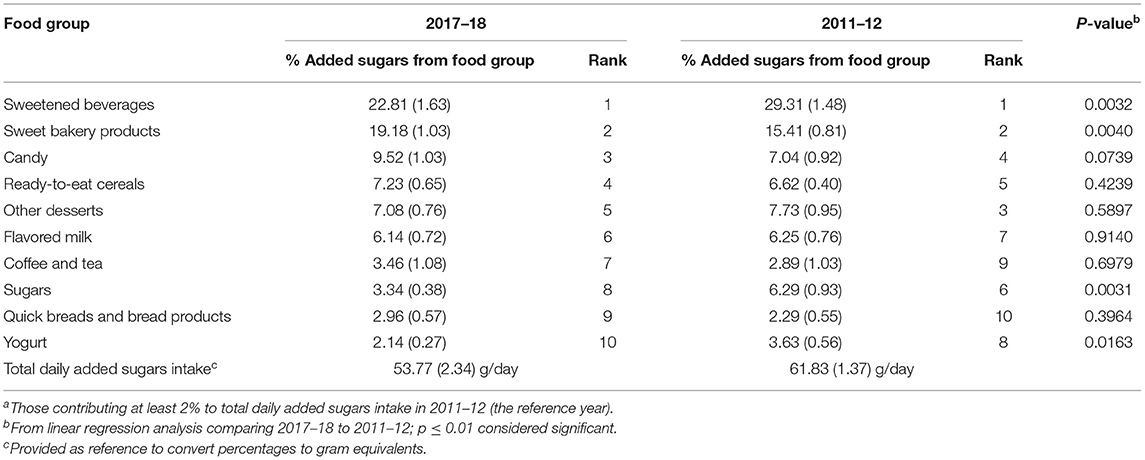
Table 3. Food group sourcesa and ranking of added sugars as a percentage of total daily added sugars intake among children 2–8 years, NHANES 2017–18 (n = 914) compared to NHANES 2011–12 (n = 1,436); values are mean (standard error) based on first day dietary recall.
Within the sweetened beverages food group, fruit drinks and soft drinks accounted for almost all of the added sugars, with fruit drinks contributing slightly more than soft drinks (Supplementary Table 1). The significantly lower contribution from fruit drinks in 2017–18 compared to 2011–12 accounted for the lower contribution from sweetened beverages over this time, while soft drinks consumption remained the same. A decline in the contribution from jams, syrups, toppings in 2017–18 compared to 2011–12 accounted for the lower contribution from sugars over this time.
Adolescents and Teens 9–18 Years
The top two sources of added sugars intake among adolescents and teens in 2017–18 were sweetened beverages and sweet bakery products, contributing 33.5 and 14.3%, respectively, to total daily added sugars intake (Table 4). Compared to the results in younger children, the top two sources were the same; however, sweetened beverages contributed more, and sweet bakery products contributed less to added sugars intake among those 9–18 years. Candy, coffee and tea, and RTE cereals ranked number three to five, while all together nearly two-thirds (62%) of daily added sugars intake came from the top four food groups. The contribution from sweetened beverages was significantly lower in 2017–18 compared to 2011–12; however, it remained the number one source of added sugars, while RTE cereals went up in rank from number seven to number five in 2017–18.
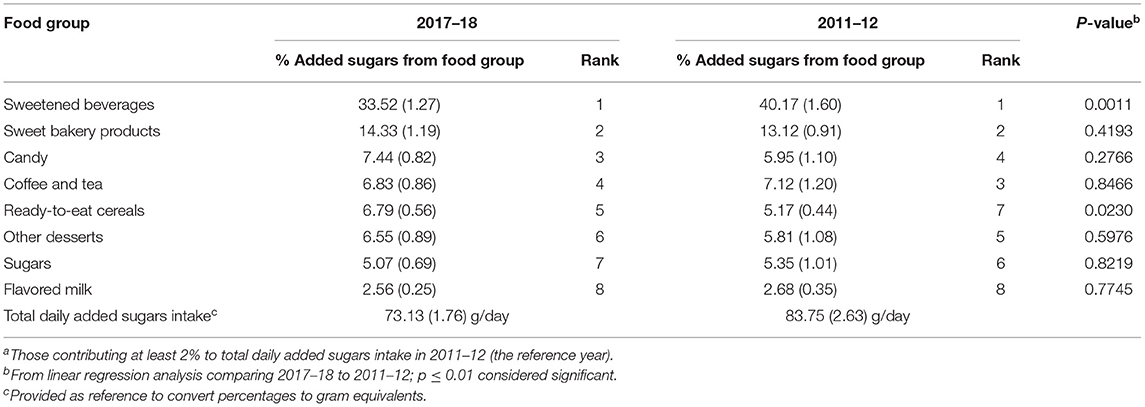
Table 4. Food group sourcesa and ranking of added sugars as a percentage of total daily added sugars intake among adolescents and teens 9–18 years, NHANES 2017–18 (n = 1,345) compared to NHANES 2011–12 (n = 1,549); values are mean (standard error) based on first day dietary recall.
Within the sweetened beverages food group, soft drinks and fruit drinks accounted for almost all of the added sugars, with soft drinks contributing twice as much as fruit drinks (Supplementary Table 2), in contrast to their fairly equal contributions among children. Within the coffee and tea food group, tea accounted for almost all of the added sugars. Unlike the results in children, declines in the contributions from both soft drinks and fruit drinks in 2017–18 compared to 2011–12 accounted for the lower contribution from sweetened beverages over this time. Also in 2017–18, soft drinks contributed twice as much to added sugars intake among those 9–18 years compared to those 2–8 years, and the combined contribution of soft drinks, fruit drinks, and tea was greater among those 9–18 years at 35.9% compared to 24.0% for those 2–8 years.
Adults 19–50 Years
The top two sources of added sugars among younger adults in 2017–18 were sweetened beverages and coffee and tea, contributing 37.7 and 10.4%, respectively, to total daily added sugars intake; sweet bakery products ranked number three at 10.3%, contributing almost the same to added sugars intake as coffee and tea (Table 5). Compared to the results in adolescents and teens, sweetened beverages made a bigger contribution to added sugars intake, while sweet bakery products made a smaller contribution. Sugars and candy ranked number four and five, and 65% of added sugars intake came from the top four food groups. The only significant difference in 2017–18 compared to 2011–12 was a decline in the contribution from breads, rolls, tortillas to below 2%, but their ranking remained the same at number eight.
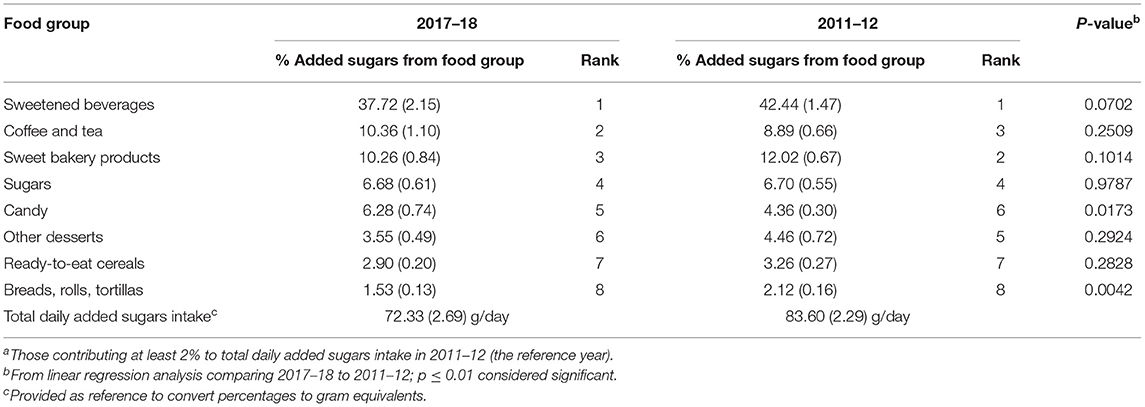
Table 5. Food group sourcesa and ranking of added sugars as a percentage of total daily added sugars intake among adults 19–50 years, NHANES 2017–18 (n = 2,241) compared to NHANES 2011–12 (n = 2,669); values are mean (standard error) based on first day dietary recall.
Within the sweetened beverages food group, soft drinks, fruit drinks, and sport and energy drinks accounted for almost all of the added sugars, with soft drinks contributing five times as much as fruit drinks or sport and energy drinks, both of which contributed fairly equal amounts (Supplementary Table 3). The top five food categories in rank order were soft drinks, tea, sugars and honey, fruit drinks, and sport and energy drinks, and combined they accounted for almost half (46%) of added sugars intake. The contribution from soft drinks to added sugars intake was over two-fold higher than that observed in children, while similar to the results in children, and adolescents and teens, the contribution from fruit drinks declined significantly in 2017–18 compared to 2011–12.
Adults 51–70 Years
The top two sources of added sugars among older adults in 2017–18 were sweetened beverages and sweet bakery products, contributing 28.3 and 14.6%, respectively, to total daily added sugars intake (Table 6). Sugars, coffee and tea, and candy ranked three to five, and almost two-thirds (61%) of added sugars came from the top four food groups. There was a significant decline in the contributions from RTE cereals and breads, rolls, tortillas in 2017–18 compared 2011–12, with both dropping down one rank to number eight and nine, respectively, while the contribution from breads, rolls, tortillas also fell below 2%.
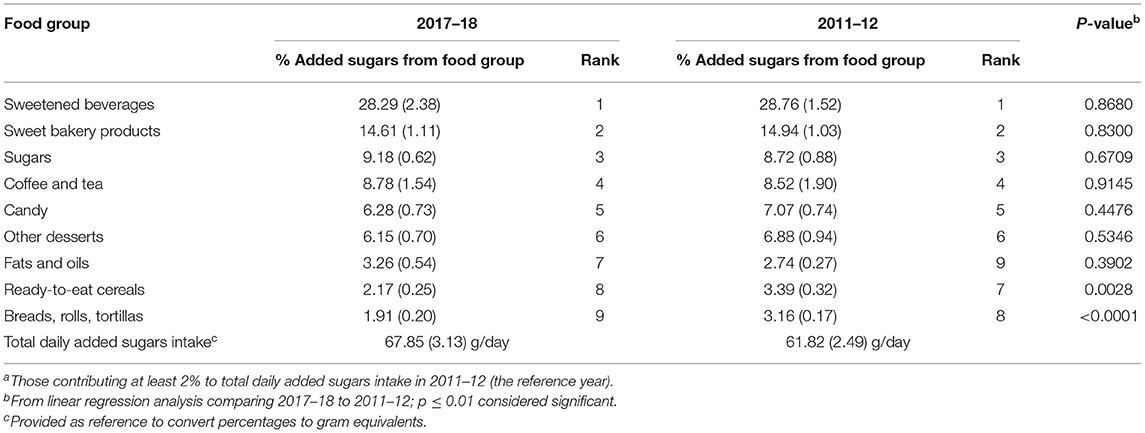
Table 6. Food group sourcesa and ranking of added sugars as a percentage of total daily added sugars intake among adults 51–70 years, NHANES 2017–18 (n = 1,776) compared to NHANES 2011–12 (n = 1,559); values are mean (standard error) based on first day dietary recall.
Within the sweetened beverages food group, soft drinks accounted for approximately 75.4% of the added sugars, with the rest coming mainly from fruit drinks (Supplementary Table 4). The combined added sugars contributions from all categories of beverages, including soft drinks, fruit drinks, sport and energy drinks, and tea was 36.1%, more than twice as much as the contribution from the sweet bakery products food group.
Adults 71+ Years
In contrast to all the other age groups, the top source of added sugars in 2017–18 among older adults 71+ years was sweet bakery products at 20.7% of total daily added sugars intake, while sweetened beverages ranked second at 17.7% (Table 7). Other desserts, sugars, and candy ranked number three to five, and almost two-thirds (63%) of added sugars intake came from the top five sources. Similar to the other adult age groups, the contribution from breads, rolls, tortillas declined significantly in 2017–18 compared to 2011–12.
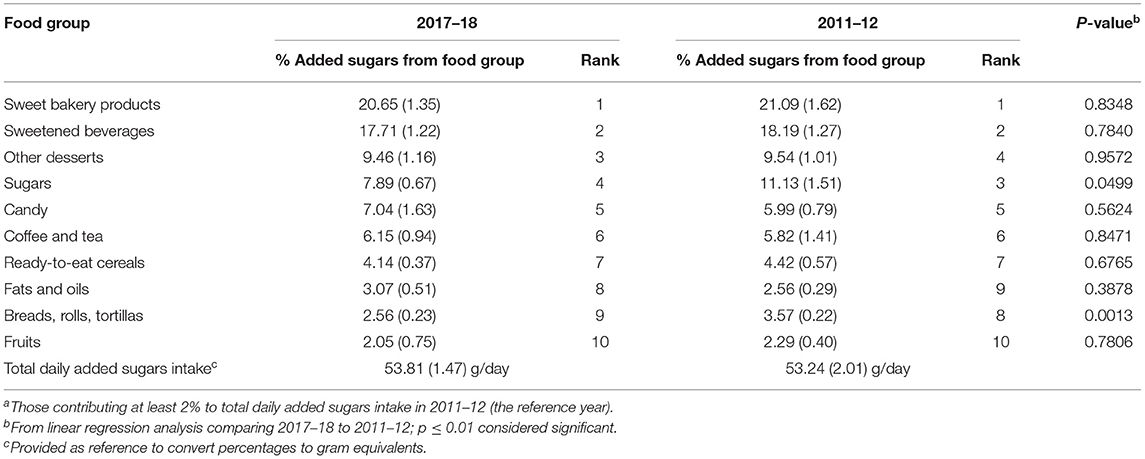
Table 7. Food group sourcesa and ranking of added sugars as a percentage of total daily added sugars intake among adults 71+ years, NHANES 2017–18 (n = 759) compared to NHANES 2011–12 (n = 649); values are mean (standard error) based on first day dietary recall.
Within the sweet bakery products food group, cakes and pies contributed the most to added sugars, followed closely by cookies and brownies, and next by a relatively small contribution from doughnuts, sweet rolls, pastries (Supplementary Table 5). Within the sweetened beverages food group, soft drinks accounted for the majority (70.1%) of added sugars; however, the added sugars contribution from soft drinks was the second lowest of all the age groups (with the lowest being among children 2–8 years). Also, fruit drinks made a very small contribution, which declined significantly in 2017–18 compared to 2011–12. A significantly lower contribution from yeast breads in 2017–18 compared to 2011–12 accounted for the lower contribution from breads, rolls, tortillas over this time.
Gender
Using data from the combined sample (2011–18), rankings of food group sources of added sugars were similar between males and females among all ages, with only some variation in their percentage contributions. In general, males tended to have higher added sugars contributions from soft drinks compared to females, but their ranking was the same (data not shown).
Ethnicity
Using data from the combined sample (2011–18), individuals 2–18 years had a mean intake (SE) of added sugars that ranged from a low of 48.0 g/day (1.4) among Asians to a high of 72.2 g/day (1.5) among Whites (Table 8). Among adults 19+ years, added sugars intake ranged from a low of 39.9 g/day (0.9) among Asians to a high of 78.9 g/day (1.6) among Blacks (Table 9).
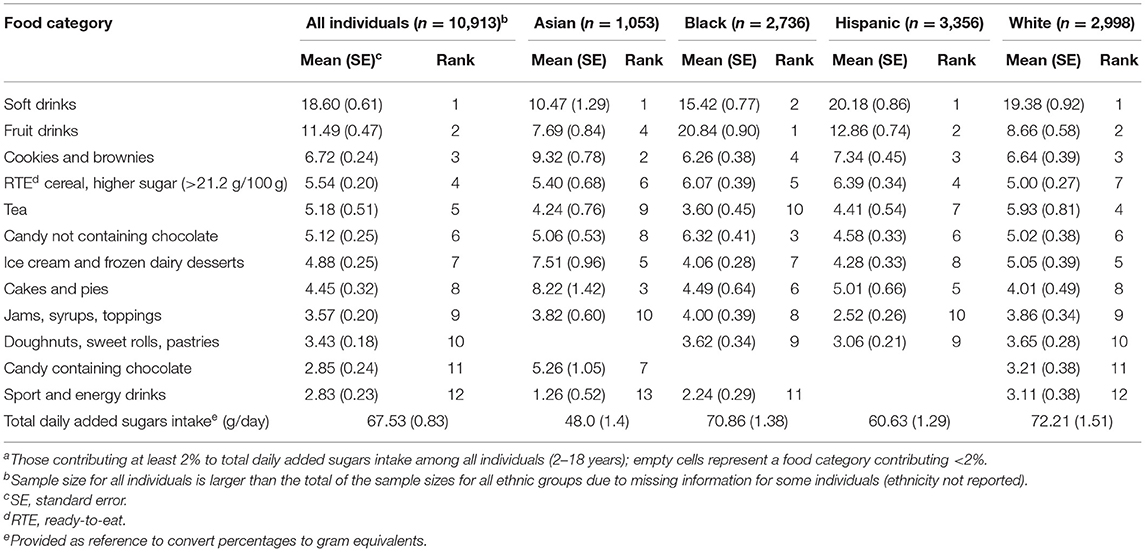
Table 8. Sources of added sugars among children, adolescents, and teens (2–18 years) overall and from four ethnic groups, NHANES 2011–18: food categoriesa and ranking by added sugars as a percentage of total daily added sugars intake; values based on first day dietary recall.
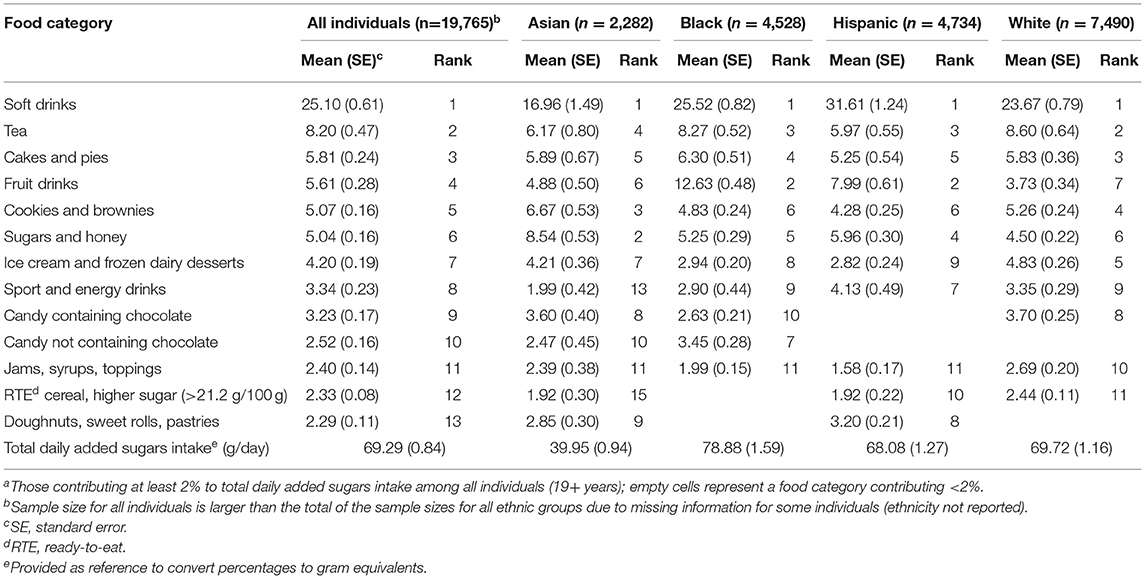
Table 9. Sources of added sugars among adults (19+ years) overall and from four ethnic groups, NHANES 2011–18: food categoriesa and ranking by added sugars as a percentage of total daily added sugars intake; values based on first day dietary recall.
For the two overall age groups (2–18 and 19+ years), sources of added sugars were similar across ethnic groups, with sweetened beverages and sweet bakery products as the top two sources (data not shown); however, some differences across ethnic groups emerged within these food groups.
Among children, adolescents, and teens 2–18 years, soft drinks ranked number one for all ethnicities except Blacks (Table 8). Fruit drinks ranked first among Blacks, second among Hispanics and Whites, and fourth among Asians. Compared to an average of 30.1% among all ethnicities, the contribution to added sugars intake from soft drinks and fruit drinks combined was higher among Blacks (36.3%) and lower among Asians (18.2%). Within the sweet bakery products food group, cookies and brownies accounted for the majority of added sugars, while their ranking was different: second among Asians; third among Hispanics and Whites; and, fourth among Blacks.
Similar to the results in younger individuals, among adults 19+ years, soft drinks were the number one source of added sugars for all ethnicities. Compared to an average of 25.1% among all, the contribution to added sugars intake from soft drinks was higher among Hispanics (31.6%) and lower among Asians (17.0%) (Table 9). Fruit drinks varied in both ranking and added sugars contribution among ethnic groups, ranking second among Blacks and Hispanics, sixth among Asians, and seventh among Whites; and they contributed 12.6, 8.0, 4.9, and 3.7% to added sugars intake, respectively.
Income
Using data from the combined sample (2011–2018), individuals 2–18 years had a mean intake of added sugars that was fairly consistent across PIR groups (Table 10); however, among adults 19+ years, mean intake (SE) was lowest in the high PIR group at 65.3 g/day (1.0), and highest in the low PIR group at 80.4 g/day (1.7) (Table 11).
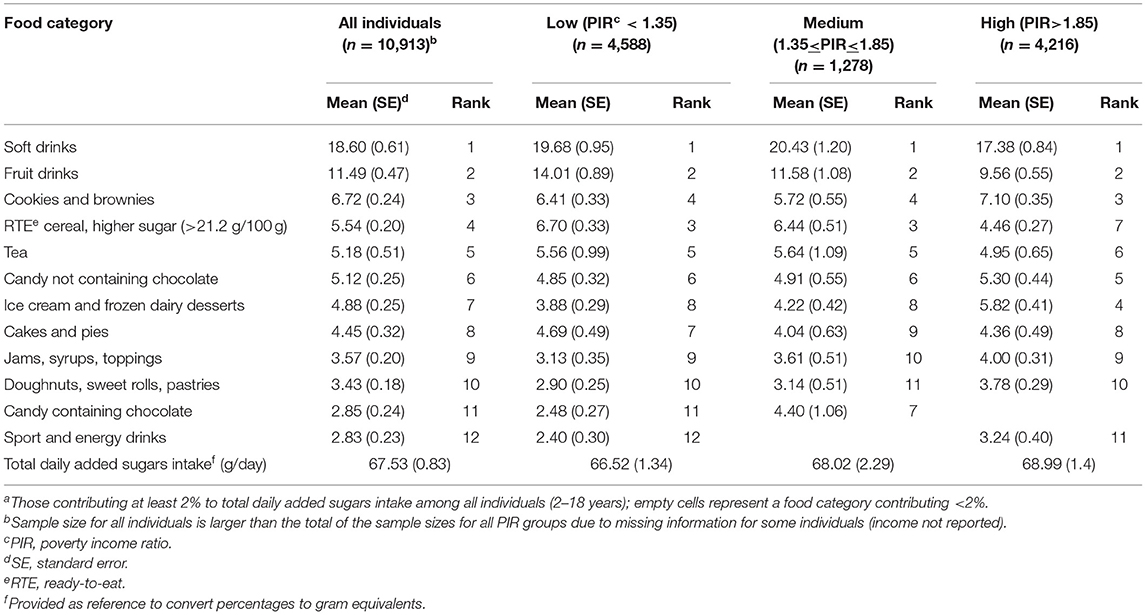
Table 10. Sources of added sugars among children, adolescents, and teens (2–18 years) overall and across income strata, NHANES 2011–18: food categoriesa and ranking by added sugars as a percentage of total daily added sugars intake; values based on first day dietary recall.
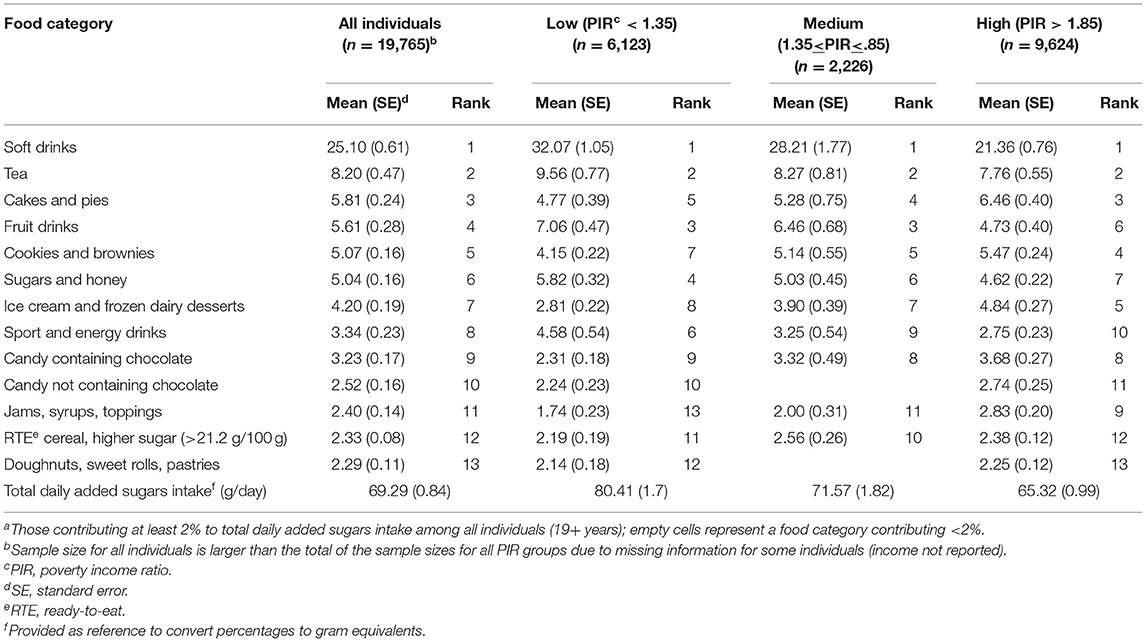
Table 11. Sources of added sugars among adults (19+ years) overall and across income strata, NHANES 2011–18: food categoriesa and ranking by added sugars as a percentage of total daily added sugars intake; values based on first day dietary recall.
For the two overall age groups, sources of added sugars were similar across PIR groups, with sweetened beverages and sweet bakery products as the top two sources (data not shown); however, some differences across PIR groups emerged within these and other food groups.
Among children, adolescents, and teens 2–8 years, soft drinks and fruit drinks ranked first and second among all PIR groups; however, their contributions to added sugars intake varied (Table 10). Compared to an average of 30.1% across all PIR groups, the contribution to added sugars intake from soft drinks and fruit drinks combined was higher in the low and medium PIR groups (33.7 and 32.0%, respectively) and lower in the high PIR group (26.9%). While the contribution from other sweetened beverages (tea, and sport and energy drinks combined) was highest in the low PIR group.
Compared to the results in younger individuals, among adults 19+ years, soft drinks ranked the same at number one across all three PIR groups; however, tea ranked second (Table 11). Percent contributions to added sugars intake from each beverage varied across PIR groups, with the highest contributions from soft drinks and tea in the low PIR group, and the lowest contributions from each in the high PIR group. Compared to an average of 25.1% across all PIR groups, the contribution to added sugars intake from soft drinks was higher in the low PIR group (32.1%) and lower in the high PIR group (21.4%). Fruit drinks varied in both ranking and added sugars contribution across PIR groups; they ranked third in the low and medium PIR groups and sixth in the high PIR group, and contributed 7.1 and 6.5% to added sugars intake in the low and medium PIR groups, respectively, and 4.7% in the high PIR group.
Discussion
Using data from NHANES 2011–18, the results of this study provide a comprehensive update on the sources of added sugars in the American diet and a detailed examination of variations in added sugars sources according to selected sociodemographic factors. We estimated daily average added sugars intake at 12.7% of total calories based on NHANES 2017–18 data, which is similar to the estimate of 13% from a recent analysis using NHANES 2013–16 data (9). In looking at sources, we found the majority of added sugars in the diet came from a few sources, with sweetened beverages and sweet bakery products as the top two contributors, consistent with other studies both in the U.S. over the years 2001 to 2016 (6, 8, 9, 11, 22, 23) and in other countries (24–29). Looking further into sociodemographic factors, we also saw that the list of top added sugars sources was generally similar across age, ethnicity and PIR groups; however, there were differences in their relative contributions among these sociodemographic groups.
Our examination of added sugars sources among children, adolescents, and teens revealed distinct patterns between the younger and older age groups. Soft drinks became a bigger contributor to added sugars intake among those 9–18 years compared to younger children (2–8 years), replacing fruit drinks as the number one source and contributing twice as much to added sugars intake. The top sources of added sugars also changed with age: from two food groups, sweetened beverages (mainly fruit drinks) and sweet bakery products (cookies and brownies) among younger children, to only beverages, as sweetened beverages (mainly soft drinks and to a lesser extent, fruit drinks) and tea among adolescents and teens; and these patterns are consistent with other NHANES analyses (6, 7, 23, 30). A general shift in influence from parents and other caregivers to peers occurs in the transition from childhood to adolescence (3), and so a greater degree of parental control and family influence specifically on children's diets compared to that on the diets of adolescents and teens may explain the differences in added sugars sources that we observed in between the younger (2–8 years) and older (9–18 years) age groups. Research has shown that teens consume more sweetened beverages, and are more likely to skip breakfast and family dinners, which are behaviors that have been associated with poorer diet quality among them compared to younger children (31).
Similarly, we observed a distinct pattern in added sugars sources among adult age groups. Sweetened beverages predominated as the number one source of added sugars among adults 19–50 years and 51–70 years, mainly due to soft drinks, while sweet bakery products was the number one source among adults 71+ years. This difference is consistent with other analyses of NHANES data (23) and analyses of added sugars intakes in other countries (32, 33) and could be explained by the distinct lifestyles that characterize the working years of adulthood vs. retired older adults and the elderly. The oldest group (71+ years) represents individuals living in their retirement years, who are no longer confined by the daily routines and restrictions of working, and have more leisure time, and different social activities and contacts (34), all of which could influence dietary habits. A shift from mainly sweetened beverages to sweet bakery products as sources of added sugars may thus reflect a more leisurely routine to eating that comes with retirement, whether it is eating alone or congregating with others for socialization.
Our examination of the U.S. population stratified by ethnicity (Asians, Blacks, Hispanics, Whites) revealed that added sugars sources were similar across these groups, suggesting that ethnicity may not be an influence. Sweetened beverages and sweet bakery products were the top two sources of added sugars among all four ethnicities in both age groups, 2–18 years and 19+ years, with soft drinks being the top source; and this pattern is consistent with an analysis of earlier NHANES data (11). The one exception to soft drinks as the number one source of added sugars was observed in younger Black individuals (2–18 years), in which fruit drinks was the top source, contributing about twice as much to added sugars intake compared to the other three ethnic groups. A similar finding has been demonstrated previously using NHANES 2003–06 (11) and also more recently using NHANES 2013-16 (9), indicating a persistent pattern. Among Black adults (19+ years), fruit drinks also ranked higher (number two) and contributed more to added sugars intake compared to the other ethnic groups, suggesting fruit drinks is a common choice for this segment of the population. In contrast, added sugars intake from sweetened beverages (soft drinks and fruit drinks) was lowest among Asians of any age compared to the other three ethnic groups. This finding is supported by other research comparing added sugars sources among children (4–13 years) in the U.S., China, and Mexico, which showed Chinese children had the lowest added sugars intake overall and the lowest contributions from soft drinks and fruit drinks (35). Our findings together with those of others suggest a potential cultural basis for the observed differences in added sugars sources among Asians and the other three ethnic groups.
Similar to our findings among ethnic groups, our examination of the U.S. population stratified by income (low, medium, high PIR) revealed that added sugars sources were similar across PIR groups. Sweetened beverages and sweet bakery products were the top two sources of added sugars for all PIR groups among both younger individuals (2–18 years) and adults (19+ years). Furthermore, regardless of income, soft drinks and fruit drinks were the top contributors to added sugars intake among younger individuals, while soft drinks and tea were the top contributors among adults. However, some income differences between these two age groups emerged, with fruit drinks as the highest contributor to added sugars intake among younger individuals in the lowest PIR group, and soft drinks as the highest contributor among adults in the lowest PIR group; and this finding is consistent with a previous analysis using NHANES 2003–06, which also demonstrated a higher contribution to added sugars intake from fruit drinks among younger individuals (2–18 years) in the lowest income group (11). Research on the economics of food choices has demonstrated that added sugars are one of the lowest cost sources of dietary energy (36), and to the extent that fruit drinks and soft drinks are relatively inexpensive sources of energy, this differential may partly contribute to their greater prominence in the diets of lower income individuals. As we found fruit drinks were the top source of added sugars among Black children, income-related patterns in fruit drinks consumption may also be related to ethnicity, given Black children tend to be over-represented in the lowest income stratum (37).
Our study of added sugars sources has some strengths and limitations. One strength is our findings can be generalized to the U.S. population because our analysis is based on nationally representative data. Furthermore, NHANES data provide a rich source of information on sociodemographic variables; and by combining data from several cycles, we were able to conduct a rigorous examination of added sugars sources across segments of the population defined by ethnicity and income. We were also able to analyze added sugars sources within disaggregated age groups; for example, we separated younger individuals into two age groups, 2–8 and 9–18 years, and adults into three age groups, 19–50, 51–70, and 71+ years, allowing us to observe differences that may emerge with transitions into different life stages. Another strength of our study compared to others which required the derivation of added sugars values from algorithms (24, 25) is that our estimates of added sugars intake were based on values from the USDA FPED specific to each NHANES cycle. We also conducted and compared analyses on three different measures of added sugars sources (grams, teaspoon equivalents, and percentage of total daily added sugars intake) and results were consistent across all measures, providing confidence in the validity of our estimates.
As with any analysis of self-reported dietary intake data, our results are subject to error from recall bias and underreporting. To date, no ideal method for adjusting for underreporting effects has been identified or widely adopted (38); thus, no adjustments were applied in our analyses, consistent with the approach of other studies of added sugars sources (6, 8, 9, 11, 22–29, 39), and thereby facilitating comparisons of results across studies. Nonetheless, given that sweets and desserts are more prone to underreporting compared to other foods (40), added sugars intakes and contributions from these foods reported in our study may have been underestimated. Additionally, investigations of underreporting in NHANES samples have shown that it is more likely among older age groups (adolescents and teens vs. children, and older vs. younger adults), among Blacks compared to Whites, and among lower PIR groups (41, 42); and these differences could have contributed to the added sugars results we observed among groups stratified by these characteristics. However, with the exception of older adults, our results showed higher levels of added sugars intake among those groups in which underreporting is more likely (adolescents and teens, Blacks, and lower PIR groups), suggesting that the differences we observed were real and not simply an artifact of underreporting.
In conclusion, regardless of age, ethnicity or income, sweetened beverages and sweet bakery products were the top two sources of added sugars among the U.S. population in 2011–18. More specifically, sweetened beverages, including soft drinks and fruit drinks, as well as tea, were the largest contributors to added sugars intake. There was some variation in the types of beverages and their relative contributions across age, ethnicity, and income groups, highlighting the need to consider particular sociodemographic contexts when developing dietary guidance. For example, dietary guidance related to young children could consider their consumption of fruit drinks as a top contributor to added sugars intake, while guidance for adolescents and teens, and younger adults could consider soft drinks as the top contributor. Likewise, further examination of the factors underlying ethnic- and income-related differences in added sugars sources would contribute to a better understanding of the differences and help to target dietary guidance or other supports for healthy eating.
Data Availability Statement
Publicly available datasets were analyzed in this study. The data used in this study are openly available in the website of the National Health and Nutrition Examination Survey: NHANES Questionnaires, Datasets, and Related Documentation; https://wwwn.cdc.gov/nchs/nhanes/Default.aspx.
Ethics Statement
The NHANES study procedures are approved by an institutional ethics review board, and documented consent is obtained from NHANES participants.
Author Contributions
VF, PG, MS, LR, and LD: conceptualization and writing—review and editing. VF: methodology and formal analysis. LR and LD: writing—original draft preparation. All authors have read and agreed to the published version of the manuscript.
Funding
The authors declare that this study received funding from The Sugar Association, Inc. PG and MS are employed by The Sugar Association, and had input into study design, and reviewed and edited the manuscript.
Disclaimer
The views expressed in the manuscript are those of the authors and do not necessarily reflect the position or policy of The Sugar Association, Inc.
Conflict of Interest
LR and LD as independent consultants provide nutrition and regulatory consulting to various food manufacturers, commodity groups, and health organizations. VF as Vice President of Nutrition Impact, LLC conducts NHANES analyses for numerous members of the food, beverage, and dietary supplement industry. PG and MS are employed by The Sugar Association, Inc.
Acknowledgments
We wish to acknowledge Kristin Fulgoni for preparation of the tables.
Supplementary Material
The Supplementary Material for this article can be found online at: https://www.frontiersin.org/articles/10.3389/fnut.2021.687643/full#supplementary-material
References
1. Food and Nutrition Board, Institute of Medicine. Dietary Reference Intakes for Energy, Carbohydrate, Fiber, Fat, Fatty Acids, Cholesterol, Protein, and Amino Acids. Washington, DC, USA: National Academies Press (2002/2005).
2. World Health Organization. Guideline: Sugars Intake for Adults and Children. (2015). Available online at: http://www.who.int/nutrition/publications/guidelines/sugars_intake/en/ (accessed October 13, 2020).
3. U.S. Department of Agriculture and U.S. Department of Health and Human Services. Dietary Guidelines for Americans, 2020–2025:9th ed. (2020). Available online at: https://www.dietaryguidelines.gov/ (accessed January 4, 2021).
4. Welsh JA, Sharma AJ, Grellinger L, Vos MB. Consumption of added sugars is decreasing in the United States. Am. J. Clin. Nutr. (2011) 94:726–34. doi: 10.3945/ajcn.111.018366
5. Bowman, SA, Clemens JC, Friday JE, Schroeder N, Shimizu M, LaComb RP, et al. Food Patterns Equivalents Intakes by Americans: What We Eat in America, NHANES 2003–2004 and 2015–2016. Available online at: https://www.ars.usda.gov/ARSUserFiles/80400530/pdf/DBrief/20_Food_Patterns_Equivalents_0304_1516.pdf (accessed February 1, 2021).
6. Bailey RL, Fulgoni III VL, Cowan AE, Gaine PC. Sources of added sugars in young children, adolescents, and adults with low and high intakes of added sugars. Nutrients. (2018) 10:102. doi: 10.3390/nu10010102
7. O'Neil CE, Nicklas TA, Fulgoni III VL. Food sources of energy and nutrients of public health concern and nutrients to limit with a focus on milk and other dairy foods in children 2 to 18 years of age: National Health and Nutrition Examination Survey, 2011–2014. Nutrients. (2018) 10:1050. doi: 10.3390/nu10081050
8. Leme AC, Baranowski T, Thompson D, Philippi S, O'Neil C, Fulgoni III V, et al. Top food sources of percentage of energy, nutrients to limit and total gram amount consumed among US adolescents: National Health and Nutrition Examination Survey 2011–2014. Public Health Nutr. (2019) 22:661–71. doi: 10.1017/S1368980018002884
9. Dietary Guidelines Advisory Committee. Scientific Report of the 2020 Dietary Guidelines Advisory Committee: Advisory Report to the Secretary of Agriculture and the Secretary of Health and Human Services. (2020). Available online at: https://www.dietaryguidelines.gov/2020-advisory-committee-report (accessed October 7, 2020).
10. Kranz S, Smiciklas-Wright H, Siega-Riz AM, Mitchell D. Adverse effect of high sugar consumption on dietary intake in American preschoolers. J. Pediatr. (2005) 146:105–11. doi: 10.1016/j.jpeds.2004.08.077
11. Reedy J, Krebs-Smith SM. Dietary sources of energy, solid fats, and added sugars among children and adolescents in the United States. J Am Diet Assoc. (2010) 110:1477–84. doi: 10.1016/j.jada.2010.07.010
12. Slining MM, Popkin BM. Trends in intakes and sources of solid fats and added sugars among US children and adolescents: 1994–2010. Pediatr Obes. (2013) 8:307–24. doi: 10.1111/j.2047-6310.2013.00156.x
13. Sharma S, Wilkens LR, Shen L, Kolonel LN. Dietary sources of five nutrients in ethnic groups represented in the Multiethnic Cohort. Br J Nutr. (2013) 109:1479–89. doi: 10.1017/S0007114512003388
14. Cioffi CE, Figueroa J, Welsh JA. Added sugar intake among pregnant women in the United States: NHANES 2003–2012. J Acad Nutr Diet. (2018) 118:886–95. doi: 10.1016/j.jand.2017.10.021
15. U.S. Department of Health and Human Services, Centers for Disease Control and Prevention, National Center for Health Statistics. National Health and Nutrition Examination Survey: Estimation Procedures, 2011–2014. Available online at: https://www.cdc.gov/nchs/data/series/sr_02/sr02_177.pdf (accessed February 21, 2021).
16. U.S. Department of Agriculture, Agricultural Research Service, Food Surveys Research Group. What We Eat in America—Documentation and Datasets. Available online at: https://www.ars.usda.gov/northeast-area/beltsville-md-bhnrc/beltsville-human-nutrition-research-center/food-surveys-research-group/docs/wweia-documentation-and-data-sets/ (accessed February 21, 2021).
17. Bowman SA, Clemens JC, Shimizu M, Friday JE, Moshfegh AJ. Food Patterns Equivalents Database 2015–2016: Methodology and User Guide. Available online at: https://www.ars.usda.gov/ARSUserFiles/80400530/pdf/fped/FPED_1516.pdf (accessed January 4, 2021).
18. CFR 101.9. Available online at: https://www.accessdata.fda.gov/SCRIPTs/cdrh/cfdocs/cfcfr/CFRSearch.cfm?CFRPart=101&showFR=1 (accessed February 1, 2021).
19. National Institutes of Health, National Cancer Institute. Dietary Assessment Primer—Describing Dietary Intake. Available online at: https://dietassessmentprimer.cancer.gov/approach/intake.html (accessed February 25, 2021).
20. Freedman LS, Guenther PM, Krebs-Smith SM, Kott PS. A population's mean healthy eating index-2005 scores are best estimated by the score of the population ratio when one 24-hour dietary recall is available. J Nutr. (2008) 138:1725–9. doi: 10.1093/jn/138.9.1725
21. U.S. Department of Agriculture, Agricultural Research Service. What We Eat in America—Food Categories. Available online at: https://www.ars.usda.gov/northeast-area/beltsville-md-bhnrc/beltsville-human-nutrition-research-center/food-surveys-research-group/docs/dmr-food-categories/ (accessed October 23, 2020).
22. Bachman JL, Reedy J, Subar AF, Krebs-Smith SM. Sources of food group intakes among the US population, 2001–2002. J Am Diet Assoc. (2008) 108:804–14. doi: 10.1016/j.jada.2008.02.026
23. Drewnowski A, Rehm CD. Consumption of added sugars among US children and adults by food purchase location and food source. Am J Clin Nutr. (2014) 100:901–7. doi: 10.3945/ajcn.114.089458
24. Lei L, Rangan A, Flood VM, Louie JCY. Dietary intake and food sources of added sugar in the Australian population. Br J Nutr. (2016) 115:868–77. doi: 10.1017/S0007114515005255
25. Louie JCY, Moshtaghian H, Rangan AM, Flood VM, Gill TP. Intake and sources of added sugars among Australian children and adolescents. Eur J Nutr. (2016) 55:2347–55. doi: 10.1007/s00394-015-1041-8
26. Sanchez-Pimienta TG, Batis C, Lutter CK, Rivera JA. Sugar-sweetened beverages are the main sources of added sugar intake in the Mexican population. J Nutr. (2016) 146:1888S−96S. doi: 10.3945/jn.115.220301
27. Sluik D, van Lee L, Engelen AI, Feskens EJM. Total, free, and added sugar consumption and adherence to guidelines: the Dutch National Food Consumption Survey 2007–2010. Nutrients. (2016) 8:70. doi: 10.3390/nu8020070
28. Azais-Braesco V, Sluik D, Maillot M, Kok F, Moreno LA. A review of total & added sugar intakes and dietary sources in Europe. Nutr J. (2017) 16:6. doi: 10.1186/s12937-016-0225-2
29. Kovalskys I, Cavagnari BM, Favieri A, Guajardo V, Gerardi A, Previdelli AN, et al. Main sources of added sugar in Argentina. Medicina. (2019) 79:358–66.
30. Welsh JA, Wang Y, Figueroa J, Brumme C. Sugar intake by type (added vs. naturally occurring) and physical form (liquid vs. solid) and its varying association with children's body weight, NHANES 2009–2014. Pediatr Obes. (2018) 13:213–21. doi: 10.1111/ijpo.12264
31. Birch L, Savage JS, Ventura A. Influences on the development of children's eating behaviours: from infancy to adolescence. Can J Diet Pract Res. (2007) 68:s1–56.
32. Ruiz E, Varela-Moreiras G. Adequacy of the dietary intake of total and added sugars in the Spanish diet to the recommendations: ANIBES study. Nutr Hosp. (2017) 34:45S−52S.
33. Chatelan A, Gaillard P, Kruseman M, Keller A. Total, added, and free sugar consumption and adherence to guidelines in Switzerland: results from the first national nutrition survey menuCH. Nutrients. (2019) 11:1117. doi: 10.3390/nu11051117
34. Zantinge EM, van den Berg M, Smit HA, Picavet SJ. Retirement and a healthy lifestyle: Opportunity or pitfall? A narrative review of the literature. Eur J Public. Health. (2014) 24:433–9. doi: 10.1093/eurpub/ckt157
35. Afeiche MC, Koyratty BNS, Wang D, Jacquier EF, Le KA. Intakes and sources of total and added sugars among 4 to 13-year-old children in China, Mexico and the United States. Pediatr Obes. (2018) 13:204–12. doi: 10.1111/ijpo.12234
36. Drewnowski A, Darmon N. The economics of obesity: dietary energy density and energy cost. Am J Clin Nutr. (2005) 82:265S–73S. doi: 10.1093/ajcn/82.1.265S
37. United States Census Bureau. Poverty Rates for Blacks and Hispanics Reached Historic Lows in. (2019). Available online at: https://www.census.gov/library/stories/2020/09/poverty-rates-for-blacks-and-hispanics-reached-historic-lows-in-2019.html (accessed November 13, 2020).
38. Health Canada. Reference Guide to Understanding and Using the Data. (2015). Canadian Community Health Survey—Nutrition. Available online at: https://www.canada.ca/content/dam/hc-sc/documents/services/food-nutrition/food-nutrition-surveillance/ReferenceGuide2015CCHS-Nutr_Eng_Final_06192017.pdf (accessed March 19, 2021).
39. O'Neil CE, Keast DR, Fulgoni VL, Niklas TA. Food sources of energy and nutrients among adults in the US: NHANES 2003–2006. Nutrients. (2012) 4:2097–120. doi: 10.3390/nu4122097
40. National Institutes of Health, National Cancer Institute. Dietary Assessment Primer—Learn More About Misreporting. Available online at: https://dietassessmentprimer.cancer.gov/learn/misreporting.html (accessed March 19, 2021).
41. Murakami K, Livingstone MBE. Prevalence and characteristics of misreporting of energy intake in US adults: NHANES 2003-2012. Br J Nutr. (2015) 114:1294–303. doi: 10.1017/S0007114515002706
Keywords: added sugars, food sources, sociodemographics, NHANES, US
Citation: Ricciuto L, Fulgoni VL III, Gaine PC, Scott MO and DiFrancesco L (2021) Sources of Added Sugars Intake Among the U.S. Population: Analysis by Selected Sociodemographic Factors Using the National Health and Nutrition Examination Survey 2011–18. Front. Nutr. 8:687643. doi: 10.3389/fnut.2021.687643
Received: 29 March 2021; Accepted: 19 May 2021;
Published: 17 June 2021.
Edited by:
Donato Angelino, University of Teramo, ItalyReviewed by:
Claudia Agnoli, Istituto Nazionale dei Tumori (IRCCS), ItalyMarialaura Bonaccio, Istituto Neurologico Mediterraneo Neuromed (IRCCS), Italy
Copyright © 2021 Ricciuto, Fulgoni, Gaine, Scott and DiFrancesco. This is an open-access article distributed under the terms of the Creative Commons Attribution License (CC BY). The use, distribution or reproduction in other forums is permitted, provided the original author(s) and the copyright owner(s) are credited and that the original publication in this journal is cited, in accordance with accepted academic practice. No use, distribution or reproduction is permitted which does not comply with these terms.
*Correspondence: Loretta DiFrancesco, loretta@sourcenutrition.com
†These authors have contributed equally to this work and share first authorship