The Sharp Rise in the Use of Low- and No-Calorie Sweeteners in Non-Alcoholic Beverages in Slovenia: An Update Based on 2020 Data
 Edvina Hafner1,2
  Igor Pravst1,2,3*
- 1Nutrition Institute, Nutrition and Public Health Research Group, Ljubljana, Slovenia
- 2Biotechnical Faculty, University of Ljubljana, Ljubljana, Slovenia
- 3VIST–Higher School of Applied Sciences, Ljubljana, Slovenia
Reducing added sugars in non-alcoholic beverages is an important public health goal, which can result in increased use of low- and no-calorie sweeteners (LNCS). The aim of this study was to investigate recent changes in the use of LNCS in non-alcoholic beverages in the Slovenian food supply. The national branded foods dataset was updated with beverages available in 2020, and compared with previous datasets. The data were extracted from food labels. In 2020, N = 1,650 unique beverages were found in shops from five different retailers, covering the majority of the national market. The use of LNCS increased from 13.2% in 2017 and 15.5% in 2019 to 20.2% in 2020, with a major growth in soft drinks (16.8, 19.6, and 26.7%, respectively). We observed a significant growth of beverages containing both LNCS and added sugar. Results were also consistent with sales data, which showed that increased offer of beverages with LNCS also resulted in similarly increased sales of such beverages. The average energy and total sugar content in non-alcoholic beverages decreased, which reflects both the higher percentage of beverages with LNCS, and also the reduction of the sugar content in beverages with only added sugar. Analyses of product-specific reformulation practices highlighted reduced sugar content in 16.8% of products, and in 3.6% with the use of LNCS. The most commonly used LNCS are acesulfame K, sucralose, and aspartame. Typically, combinations are used, however steviol glycosides, sucralose and saccharin are also used alone, in most cases combined with added sugar. The results indicated rapid changes in the use of LNCS in non-alcoholic beverages in the Slovenian food supply, making further monitoring of this area highly relevant.
Introduction
Low- and no-calorie sweeteners (LNCS) are a group of food additives that provide a sweet taste with no or fewer calories per gram of food, compared to sugar (1). They include both intensive sweeteners and polyols, which can partially or entirely replace sugar in various foods and drinks (2). Since excessive sugar intake is a major public health issue in the modern diet, its reduction is a key step in fighting against the worldwide obesity epidemic (3). The World Health Organization (WHO) recommends keeping free sugar consumption below 10% of the daily energy intake, and preferably even below 5% (4, 5).
Sugar-sweetened beverages are one of the major contributors to sugar intake (6–8), with sugar often being the only source of energy (9). Reduction of the intake of sugar-sweetened beverages is considered an important public health goal (10). In addition to raising public awareness, national authorities also encourage food manufacturers to reformulate their products to reduce added sugars. Some governments have implemented a sugar/soda tax (e.g., UK, Ireland, France, Mexico), and already results show a rapid increase in reformulation and decreased sales of sugary drinks (11–13). Since sugar is an important ingredient that provides a desired taste, its reduction could decrease consumers' interest in the product. Therefore, LNCS are often a convenient alternative, allowing formulation of products with reduced sugar and energy content, while achieving the same level of sweetness (3, 14). Consumer awareness and reformulation activities can result not only in increased availability, but also in increased intake of products with added LNCS (2, 15, 16). Although the use of LNCS is carefully regulated (17, 18), some studies have suggested possible risks related to the excessive consumption of LNCS, i.e., impacts on the microbiome (19), and increased risk of metabolic syndrome (20) and diabetes (21). However, it should be noted that because different LNCS have very different chemical structures, generalizations of health risks are not appropriate (22, 23).
With consideration of abovementioned issues, careful monitoring of changes in the food supply is crucial. Out of all foods and drinks, non-alcoholic beverages have been shown to be one of the major contributors to LNCS availability (15) and intake (24, 25). In Slovenia, monitoring of the use of LNCS in non-alcoholic beverages was undertaken for products available in 2017, following by further data collection in 2019 (26). While no significant differences were observed in a comparative study (26), signs of increased use of LNCS were found, making this area very interesting for further research. In Slovenia, there are currently no legislative restrictions or taxations for the content of sugars in sugary drinks. However, the government is promoting a reduction of added sugar through mass media and voluntary pledges (27). Although food reformulation in general is encouraged, the National Program on Nutrition and Health Enhancing Physical Activity 2015–2025 (28) specifically mentions that the use of LNCS should be also reduced. Given that a major part of the Slovenian food market consists of branded foods imported from other countries, the monitoring of the food supply will provide important insights into the European food supply. Furthermore, such insights are very important nationally for efficient, evidence-based policy decisions in the future.
Monitoring of the composition of the foods in the food supply is very challenging, because thousands of different products are available on the market, their compositions can change, and notable differences can be observed in different regions (29). This complicates data collection, and available datasets are commonly focused on nutritional food components, which are part of mandatory nutrition declarations, and less commonly on other food constituents, such as additives. It should also be mentioned that nationally representative branded food datasets are only available in some countries, and that different data collection approaches are used. A standard approach is cross-sectional food monitoring studies in food stores, where data is extracted from food labels. This methodological approach was harmonized within the Global Food Monitoring Group (30) and INFORMAS initiative (31, 32). In Slovenia, food monitoring studies are conducted within the government funded national research programme “Nutrition and Public Health,” and are supported by the HORIZON2020 “Food Nutrition Security Cloud” project (FNS-Cloud; www.fns-cloud.eu), which is funded by the European Commission.
The present study aimed to investigate recent changes in the use of LNCS in non-alcoholic beverages in the Slovenian food supply. The national branded foods dataset was updated with beverages available in 2020. The dataset, containing both nutrition declaration and ingredients data, was compared with previous datasets compiled in 2017 and 2019. The use of repeated cross-sectional studies also enabled investigation of product-specific reformulation practices.
Materials and Methods
Data Collection and Processing
This repeated cross-sectional study used new data collected in Slovenia in 2020, and previously reported data collected in 2017 and 2019 (26). In all 3 years, the data were collected using the Composition and Labeling Information System (CLAS, Nutrition Institute, Ljubljana, Slovenia) (33). In Slovenia, CLAS collect information on prepacked foods and drinks available at major retailers that represent most of the market share. The details regarding data collection are described elsewhere (34). In brief, pictures of all pre-packed foods and drinks with a unique European Article Number (EAN) barcode available at the time of sampling were collected. All the information on the nutritional composition and ingredients needed for the study were extracted from photographs using the online CLAS tool. The 2020 data were collected from all major retailers with nationwide networks of shops. The following shops in Ljubljana (Slovenia) were included in the data collection: two mega markets (Mercator Center, Interspar), two supermarkets (Tuš, Spar), and three discount markets (Hofer, Lidl, Eurospin). With the exception of Eurospin, the same shops were also included in the data collection in 2017 and 2019. Products were classified based on previously developed global categorisations by Dunford et al. (35), with minor adaptations considering the specifics of the European market. This study examined five categories of non-alcoholic beverages: juices, nectars, soft drinks, energy drinks, and sports drinks. Details regarding product categorization have been previously described (26).
The LNCS and added sugar were identified from the ingredient list on the food packaging. We examined the use of all 19 LNCS that are currently authorized for use in food products in European regulations (35). LNCS were identified by their name and/or their E number. Similarly, we identified added sugar, which was defined as all mono- and disaccharides added to foods, excluding fruit juices and purees. Based on this, beverages were segmented into four groups: (1) with added LNCS; (2) added sugar; (3) with added LNCS and added sugar; (4) without added LNCS and without added sugar. To further examine these four groups with consideration of market-share differences, we compared the availability of such products in the food supply with sales data. We were able to obtain nation-wide 12-month sales data for 2017 and 2020 from retailers, representing over 50% of the national food supply. Sales data was provided in universal form including EAN barcode number, number of products sold per year, and package quantity (L). We matched products in the food supply dataset with those in sales data dataset. EAN barcode numbers were used as unique product identifiers for the matching process. There were 705 (68%) matches found in the 2017 dataset, and 1,007 (61%) in the 2020 dataset.
To provide insights into reformulation practices, we also matched products (using EAN barcode numbers) in the 2020 dataset with those in the 2017/2019 datasets. A similar approach was used by Bernstein et al. (36). All products available in the 2020 dataset were searched for matches in the 2017/2019 datasets. For those matches, we calculated the difference in total sugar content (TSC) between 2017 and 2020. If a product was not available in the 2017 dataset, we used the sugar content from the 2019 dataset.
Statistical Analysis
Data were collected and processed using the Composition and Labeling Information System (CLAS) (Nutrition Institute, Ljubljana, Slovenia) and MicrosoftTM Excel 2019. Statistical analysis was performed using IBM SPSS v.26. Descriptive statistics were used for reporting the prevalence of beverages with added LNCS, added sugar, both, or neither. We also assessed the prevalence of individual LNCS and their combinations. A two-tailed z-test was used to compare changes in the LNCS use between time periods. A t-test was used to compare the mean energy value (EV) and TSC within each category between time periods. For sale-weighting, we calculated the total amount (L) of beverages sold per year (separately for years 2017, and 2020) using package quantity (L) and the number of sold products. We presented the sale-weighted proportions and compared them with the food supply offer (products available at the time of sampling).
Results
Presence of LNCS and Their Effect on Energy Value and Total Sugar Content
The 2020 dataset consisted of N = 1,650 non-alcoholic beverages. The between category distribution was similar to that observed in 2017 and 2019 (26). Soft drinks had the largest share in the sample (N = 898; 54.5%), followed by juices (N = 350; 21.2%), nectars (N = 229; 13.8%), energy drinks (N = 136; 8.2%), and sports drinks (N = 37; 2.2%) (Table 1). At least one LNCS was present in 333 products. The proportion of products with LNCS therefore increased from 15.5% in 2019 to 20.2% in 2020 (p < 0.01). The biggest difference between 2019 and 2020 was observed in soft drinks; the LNCS beverages increased from 19.6% to 26.7% (p < 0.01). A comparison with the 2017 data also provided interesting insights. In energy drinks, the proportion of products with LNCS increased between 2017 and 2019 (from 16.9% to 41.8%) (26), and stayed at a comparable level in 2020 (41.2%). Interestingly, the overall number of nectars increased considerably (from 135 in 2017 to 229 in 2020), but the number of such products with LNCS stayed almost the same (n < 20), which resulted in a decreased proportion of nectars with LNCS (p < 0.05). Beverages with LNCS are most often sports (67.6%) and energy drinks (41.2%), but due to the small number of products, they do not contribute much to the overall supply of non-alcoholic beverages with LNCS. No use of LNCS was observed in juices.
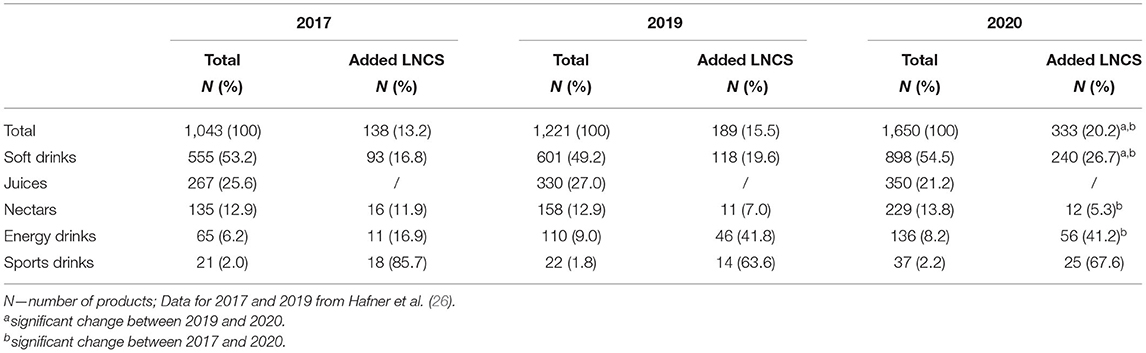
Table 1. Sample description and availability of non-alcoholic beverages with added low- and/or no-calorie sweeteners (LNCS) in the Slovenian food supply in 2017, 2019, and 2020.
The results of the segmentation of beverages based on added sugar and/or LNCS are presented in Table 2. The largest contribution to the increase in the use of LNCS was made by beverages that use a combination of LNCS and added sugar. In 2017 and 2019, the proportions of such products were 7.6 and 7.5, respectively, increasing to 11.0% in 2020 (p < 0.01, comparison with 2017 data). Notable changes were also observed in the use of LNCS alone (5.7, 7.9, and 9.2, respectively).Similar trends were also observed, when 12-months sales values were considered, to account for market-share differences between different beverages in the food supply (Supplementary Figure 1). Increased availability of beverages with LNCS was also reflected in the increased sales of such beverages. From 2017 to 2020 the sale-weighted proportion of beverages with LNCS increased from 10.8 to 18.2%. Sales increased both for beverages with added only LNCS (from 4.1 to 8.8%) as well as for beverages with added LNCS and sugar (from 6.7 to 9.4%). The largest market share represented beverages with added sugar, but their share fell from 81.5% in 2017 to 72.2% in year 2020, when notably increased sales of beverages with LNCS were observed. Beverages without added sugar and LNCS, despite representing a large proportion of the available beverages, represented only 7.7% of the volume sales-market in 2017, and 9.6% in 2020.
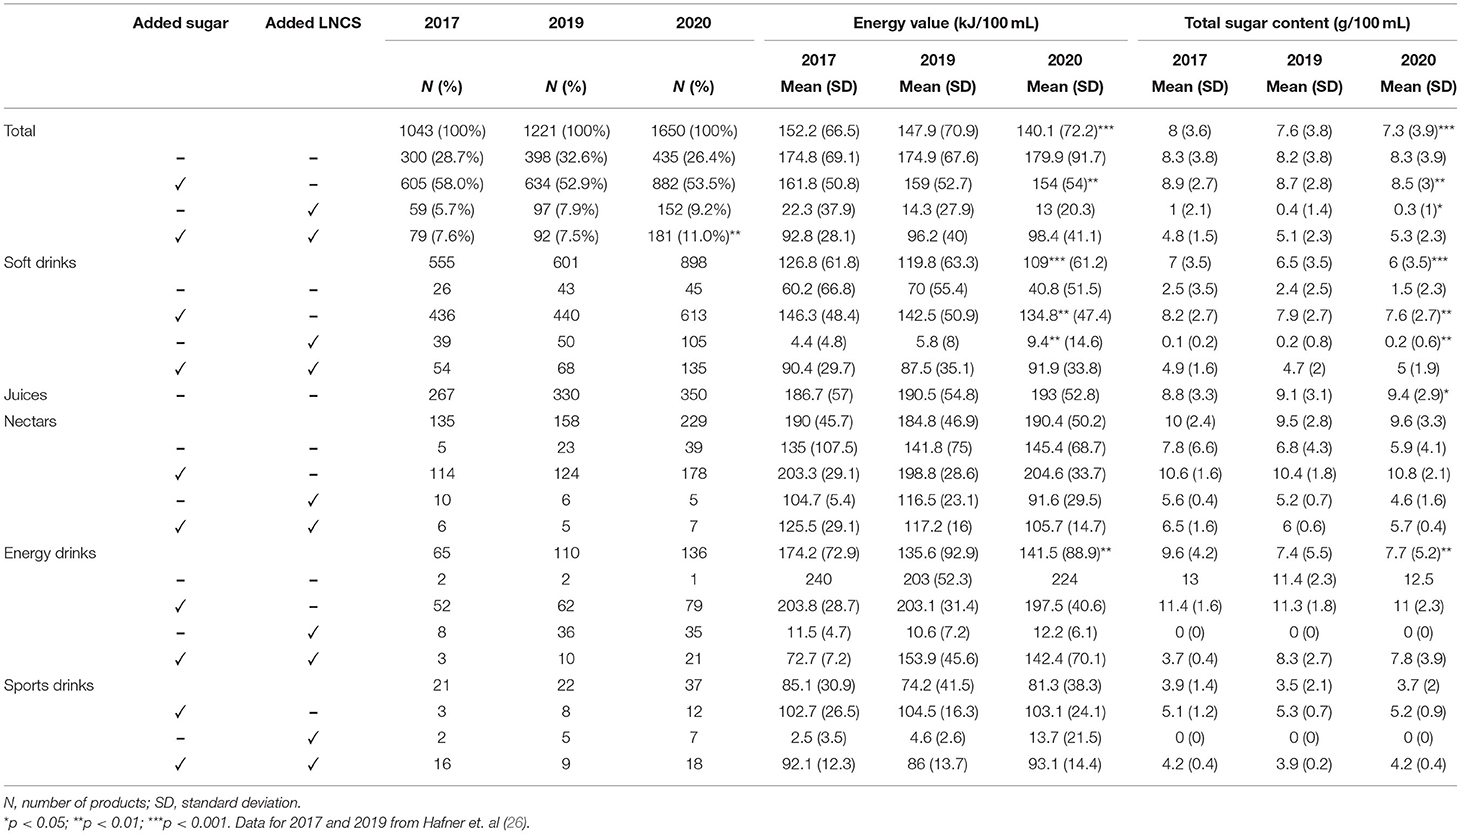
Table 2. Comparison of the energy value and total sugar content in non-alcoholic beverages, based on the presence of added sugar and low and/or no-calorie sweeteners (LNCS).
We also observed that the energy and sugar content of the beverages also changed in the last few years (Table 2). Taking the whole 2020 dataset into account, the average content of energy and sugar in the non-alcoholic beverages was 140.1 kJ and 7.3 g/100 mL, respectively. The EV and TSC therefore significantly fell from 2017 (152.2 kJ and 8 g of sugar per 100 mL; p < 0.001) (Table 2). This reduction is the result of both increased use of LNCS and a reduction in TSC in other beverages. The results showed that both the EV and the TSC were considerably reduced when the sugars were partially replaced by LNCS, while the difference was even more pronounced when only LNCS were used for sweetening. Encouragingly, a decrease in the EV and TSC was also observed in beverages with only added sugar (p < 0.01). The amount of TSC also dropped slightly in beverages with only added LNCS (p < 0.05). In individual categories, considerable changes were observed in soft drinks, which, due to their abundance, contributed the most to the changes in the overall sample. The mean EV and TSC in soft drinks decreased both in the whole category (p < 0.001), and also specifically in soft drinks with only added sugar (p < 0.01). In other categories, we observed a decrease in the mean EV and TSC for energy drinks (p < 0.01), which was mostly due to the increased use of LNCS, as after segmentation based on added LNCS and added sugar, no differences were observed in the four segments. A slight increase in TSC was also observed in juices (p < 0.05), which could mean that the supply of juices from sweeter fruits is on the rise. Juices were also the category with the highest EV and TSC.
The food matching method was used to provide insights into reformulation practices in specific products. Analyses was undertaken with N = 859 non-alcoholic beverages in the 2020 dataset, for which matches were found in previous datasets. For 680 (79.2%) products, no change in TSC was observed. Out of 179 products with changed compositions, 144 (16.8%) showed a reduction and 35 (4.1%) an increase in TSC (Figure 1). It should be noted that 31 (3.6%) products with reduced TSC also contained LNCS, and 20 (2.3%) did not contain LNCS in previous years. Most products with reduced sugar content were in the category of soft drinks (N = 107); this trend was particularly notable in fruit drinks. Interestingly, the average TSC in sugar-reduced reformulated beverages was quite high (7.4 g per 100 mL, in comparison to the overall 2020 average of 7.3 g per 100 mL). The mean sugar reduction for products without LNCS was −1.1 g per 100 ml, and −3.3 g for products with added LNCS. Products reformulated with increased TSC had on average 1.0 g more sugar per 100 ml. Interestingly, we found four energy drinks that did not contain LNCS in previous datasets, where LNCS were added in 2020, but their sugar content remained the same.
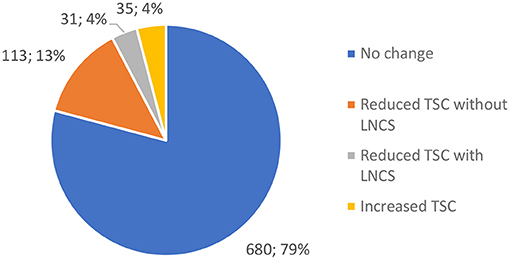
Figure 1. Changes in the total sugar content (TSC) in beverages available in 2020, which were also found in the 2017/2019 dataset (N = 859; LNCS–low- and/or no-calorie sweeteners).
Prevalence of Different LNCS and Their Combinations
An overview of the use of specific sweeteners showed no significant differences in comparison with the previous data collection in 2019 (Figure 2). However, some interesting trends identified in a previous study (26) continued in 2020. We observed a further increase in the use of sucralose, and a consequently lower use of most other sweeteners. Consistent with the results from 2019, the most common sweetener in 2020 remained acesulfame K (N = 191; 57.3%), followed by sucralose (N = 139; 41.7%) and aspartame (N = 102; 30.6%).
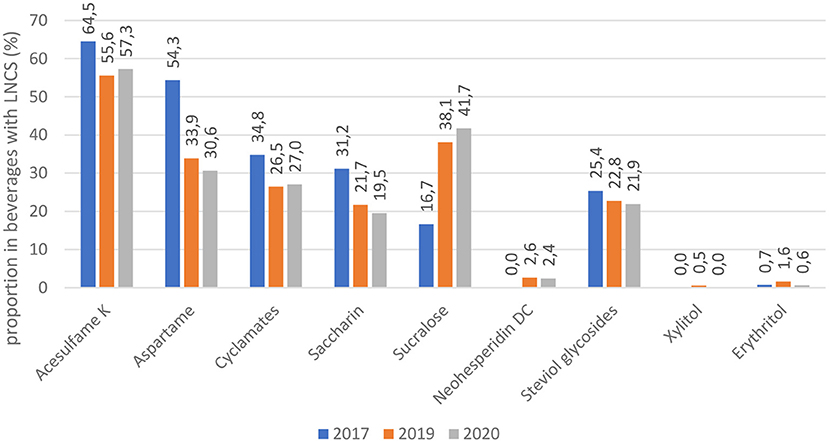
Figure 2. Frequency of different low and no-calorie sweeteners (LNCS) in beverages with LNCS [data for 2017 and 2019 from Hafner et. al (26)].
In beverages with LNCS, the use of multiple sweeteners at the same time is still prevalent (65%), while the use of only one LNCS (35%) is limited to the use of steviol glycosides (N = 59), sucralose (N = 51), and saccharin (N = 6) (Supplementary Table 1). Even though steviol glycosides and saccharin were used as single LNCS, they were always combined with added sugar. Meanwhile, sucralose was used as single LNCS without added sugar in 16 products. Drinks with LNCS most commonly contained a mix of two LNCS (N = 128, 38.4%). The most common combination was acesulfame K and sucralose (N = 54), followed by the combination of acesulfame K and aspartame (N = 42). Interestingly when mixing three or more LNCS, acesulfame K was always present in the mixture. Even for products containing only two LNCS, products that did not contain acesulfame K were in the minority (N = 26), and were usually combined with added sugar or fruit juices/concentrates. The results also suggested that as the number of sweeteners increases, the frequency of added sugar decreases.
Discussion
This study showed that the market for non-alcoholic beverages has changed rapidly in recent years. While a previous study found the first signs of growing use of LNCS in non-alcoholic beverages in Slovenia (26), this trend was clear when the latest data were taken into account. Our results showed a significant increase in the availability of beverages with LNCS, from 13.2% in 2017 and 15.5% in 2019, to 20.2% in 2020. In the period of 2017–2019 the changes mostly affected energy drinks; use of LNCS increased significantly. This trend stopped in 2020. On the other hand, in 2020 there was a marked growth in soft drinks with LNCS (from 19.6% in 2019 to 26.7% in 2020; p < 0.01), which is the most widespread category of non-alcoholic beverages in the Slovenian market.
We should note that the frequency of the use of LNCS in non-alcoholic beverages in Slovenia (20.2%) is still lower than in most other countries where it has been investigated (16, 37, 38). However, given the observed rapid changes, Slovenia is quickly approaching the proportion of beverages with LNCS in the US (23%; 2015–2017) (38) and Hong Kong (25%; 2019) (39). Even more frequent use of LNCS in beverages was reported in Spain (39%; 2013) (37), but the latter study was conducted with a very different methodological approach, using food consumption survey data. Very recently, a study with a methodological approach similar to our study was also conducted in Spain (15), but because only foods with LNCS were investigated, the proportion of use of LNCS was not calculated.
In our study, growth in the use of LNCS occurred particularly in the availability of beverages with both added sugar and LNCS. We also observed that increased sales-volume market-share for beverages with LNCS reflected the increase in the availability of such products. Increased sales for beverages with LNCS were also reported in a US study, which highlighted, that from 2002 to 2018, sales of products containing both added sugar and LNCS increased by almost 30% (40). The current study, as well as others (26, 38), observed that partially replacing sugar with LNCS can help reduce energy by almost half, while using only LNCS for sweetening leads to an even greater reduction. The increased supply of beverages with LNCS, therefore, impacted the overall mean EV and TSC, which decreased significantly from 2017 (p < 0.001). Encouragingly, the reduction of the average sugar content in the available non-alcoholic beverages was also influenced by the reduction of sugars in beverages sweetened only with added sugar (p < 0.01). This particularly applied to sugar-sweetened soft drinks.
Results of analyses of product-specific reformulations showed that 144 (16.8%) out of 859 matched products reduced their sugar content. Interestingly, a minority of these beverages were reformulated with the help of LNCS (N = 31; 3.6%). This is a promising result, since the Slovenian nutrition policy programme (28) encourages reformulation without LNCS, to reduce the preference for sweetness in the population. At the same time, it should be pointed out that products that used LNCS reduced their sugar content much more (−3.3 g per 100 ml) compared to those that did not use them (−1.1 g per 100 ml). However, the reformulated products still had a fairly high average sugar content (7.4 g per 100 ml), which was similar to the overall average (7.3 g), indicating that reformulation is particularly focused on products with a higher sugar content. Most of the reformulated beverages were soft drinks (N = 107), more precisely fruit drinks, which is the group of beverages that has been the most reformulated in Portugal in the past decade (41). It is also important to note that we also observed cases of increased TSC (N = 35), and those where added LNCS was not accompanied by lower TSC (N = 4). In such cases, the sweetness was increased without any health benefits, which is in clear conflict with public health goals.
Among the specific LNCS, the use of acesulfame K predominated in 2020, followed by sucralose and aspartame, which is aligned with the 2019 results. Most beverages contained multiple LNCS, while sole LNCS occurred mostly in beverages with sucralose and steviol glycosides, and occasionally saccharin. During recent years, the use of LNCS has shifted toward the increased use of sucralose and the decreased use of aspartame. Reduced occurrence of aspartame has also been observed in Portugal (41) and the US (40). Even though aspartame has been re-evaluated for safety (42), its use still remains controversial (43). This raises doubts in consumers, which is why manufacturers have replaced aspartame with novel, less notorious LNCS, such as sucralose and steviol glycosides (40). The use of sucralose is also increasing in Slovenia. In the US, the intake of sucralose increased by over 30% in a 16 year period, which could also be due to the increased supply of prepackaged products containing sucralose (40). Sucralose is relatively new to the market. Its use has rapidly increased because of its sucrose-like taste and good stability (44). Due to these properties, it appears both alone and in combination with other sweeteners. Increased use of sucralose has aroused the interest of researchers, who have begun to focus on its impact on health. Even though sucralose is currently considered safe, some studies indicate possible adverse effects on glucose metabolism, even in low amounts (15% of Acceptable Daily Intake, ADI) (45), and increased cardiovascular risk (46). A combination of carbohydrates and sucralose in beverages was highlighted as particularly risky (47). Interestingly, our study showed that use of steviol glycosides is slowly stagnating; they are only in fifth place among the most common sweeteners, used in 21.9% of beverages with LNCS. On the contrary, a considerable increase in the use of this sweetener has been reported from other countries (40, 41). In Chile, steviol glycosides are the second most used LNCS in the food supply, which has raised concerns that ADI value could be exceeded in some vulnerable groups, such as children (16), but a subsequent study indicated that this is not the case (48). A Portuguese study highlighted steviol glycosides as most commonly present in iced teas (41), which are a popular choice for children (49). Therefore, careful monitoring of this is crucial. In Slovenia, the frequency of use of steviol glycosides is currently relatively low, but given the rapid changes in LNCS use, this could change in the coming years. Steviol glycosides are commonly perceived by consumers as a natural sweetener, and are therefore rarely mixed with other LNCS (16, 50). However, the use of mixes of LNCS is still predominant in beverages. For the first time, we also reviewed LNCS combinations. We found out that combination of two LNCS is the most common, with acesulfame K and sucralose emerging as the most frequent blend. The same result was also reported in Spain, across the whole food supply (15). Blends can intensify the sweet taste of individual LNCS and prevent an unpleasant aftertaste (50). Our results indicated that with the increased number of LNCS, the frequency of added sugar has decreased. Therefore, beverages with only one LNCS in most cases also contained added sugars, while beverages with a blend of five LNCS did not contain any. This suggests that blends of LNCS could help to notably reduce sugar content in beverages.
It should be noted that in Slovenia beverages account for the largest share of sugar sold in the country (27), and are also the biggest contributor to free sugar intake (32% in adolescents, 34% in adults, and 31% in the elderly) (8). However, a reduction in TSC in beverages has occurred much slower than in some other countries, where sugar taxes have been implemented. For example, in Portugal, 1 year after tax implementation in 2017, 50% of soft drinks above the taxation level (8 g sugar/100 ml) reduced their TSC below this limit (51), and now only 15% exceed it (41). Meanwhile, in Slovenia (2020), about one third (N = 310; 34.5%) of soft drinks have a TSC above 8 g/100 ml. Although similar benefits of taxation have been seen in other countries, such reformulations might considerably increase the use of LNCS (52), and this could affect health risk analyses. At the same time, LNCS maintain or even intensify the sweetness of drinks, which hinders the main public health message to reduce the preferences for sweetness in our diets. Policy approaches for lowering the TSC in beverages are desirable, however, attention should be paid to possible excessive substitution of sugar with LNCS.
Strengths and Limitations
As the main strength of this study, we should highlight the representativeness of the sample, which included beverages from all major retailers, representing a vast majority of the Slovenian food market. A repeated cross-sectional approach with the use of the same methodology and three time points allowed us to make meaningful comparisons and identify changes in the food supply. It is also noteworthy that there are only a few countries in Europe where the infrastructure enables such studies, which is why this study provided important insights to better understand the common European market. Some study limitations should be also mentioned. First, the data collection in 2020 included one discount retailer which was not included in monitoring in 2017/2019. We carefully checked that this did not have a major effect on the study results. In the whole 2020 dataset LNCS were present in 20.2% beverages; after exclusion of products found only at the additional retailer (N = 103), it was 19.8%. Another limitation is that sales data were not available for all beverages, however we covered 68% and 61% of the 2017 and 2020 sample, respectively. To exclude the possibility of the error due to the missing sales data, the offer of products included in sale-weighting were compared with the whole sample; no notable differences were observed between both samples. A limitation of the present study is also that all the information was extracted from food labels, which may differ from the actual chemical compositions of the beverages. We also only investigated the use of (declared) LNCS, and not their quantity, as this information is not indicated on the label. Finally, we used EAN barcodes for food matching in the analyses of product-specific reformulations. In case that the product has changed its EAN barcode, we were unable to match it with the previous formulation.
Conclusions
This study explored the use of LNCS in non-alcoholic beverages in the 2020 edition of Slovenian branded foods database, for comparison with previous data. We showed that the use of LNCS in beverages increased for more than half (+53%)–from 13.2% in year 2017 to 20.2% in year 2020, with even more notable growth in soft drinks (for 59%–from 16.8% in 2017 to 26.7% in year 2020). Increased availability of beverages with LNCS also reflected in even higher increase in sales volumes; market-share of beverages with LNCS increased for 69%–from 10.8% in 2017 to 18.2% in year 2020. While study results also indicated some changes in the content of energy and sugars in both reformulated and newly launched beverages, most beverages in the Slovenian food supply still have very high energy/sugar content. To achieve public-health goals, more efficient reformulation activities are needed. Further monitoring of the composition of beverages in the food supply is needed also to assess the efficiency of such activities.
Data Availability Statement
The raw data supporting the conclusions of this article will be made available by the authors, without undue reservation.
Author Contributions
IP: conceptualization, and manuscript writing—review and editing. EH: data analyses, formal analysis, writing—original draft preparation. IP and EH: methodology. All authors have read and agreed to the published version of the manuscript.
Funding
Data collection for this study was supported by the national research programme Nutrition and Public Health (P3-0395, funded by the Slovenian Research Agency) and research project L3-9290, funded by the Ministry of Health of Republic of Slovenia and Slovenian Research Agency. The study was conducted within the Food Nutrition Security Cloud project (FNS-Cloud), which received funding from the European Union's Horizon 2020 Research and Innovation programme (H2020-EU.3.2.2.3.—A sustainable and competitive agri-food industry) under grant agreement no. 863059. Information and views in this report do not necessarily reflect the official opinion or position of the European Union. Neither European Union institutions and bodies, nor any person acting on their behalf, may be held responsible for the use that may be made of the information contained herein.
Conflict of Interest
The authors declare that the research was conducted in the absence of any commercial or financial relationships that could be construed as a potential conflict of interest.
Publisher's Note
All claims expressed in this article are solely those of the authors and do not necessarily represent those of their affiliated organizations, or those of the publisher, the editors and the reviewers. Any product that may be evaluated in this article, or claim that may be made by its manufacturer, is not guaranteed or endorsed by the publisher.
Acknowledgments
We thank the retailers for granting access to their stores to collect data for the study. We also acknowledge the support of Maša Hribar, Sanja Krušič, Hristo Hristov, Živa Lavriša, Anita Kušar, and Katja Žmitek (Nutrition Institute, Ljubljana, Slovenia) in conducting the food supply studies, and to students from the Biotechnical Faculty (University of Ljubljana) and BIC (Ljubljana) for their help with the data collection.
Supplementary Material
The Supplementary Material for this article can be found online at: https://www.frontiersin.org/articles/10.3389/fnut.2021.778178/full#supplementary-material
References
1. Fujimaru T. Park Jh, Fau-Lim J, Lim J. Sensory characteristics and relative sweetness of tagatose and other sweeteners. J Food Sci. (2012) 77:S323–8. doi: 10.1111/j.1750-3841.2012.02844.x
2. Sylvetsky AC, Rother KI. Trends in the consumption of low-calorie sweeteners. Physiol Behav. (2016) 164:446–50. doi: 10.1016/j.physbeh.2016.03.030
3. Tahmassebi JF, BaniHani A. Impact of soft drinks to health and economy: a critical review. Eur Arch Paediatr Dent. (2020) 21:109–17. doi: 10.1007/s40368-019-00458-0
4. World Health Organization. Diet, Nutrition and the Prevention of Chronic Diseases—Report of the Joint WHO/FAO Expert Consultation. Geneva, Switzerland: World Health Organization (2003)
5. World Health Organization. Guideline: Sugars Intake for Adults and Children. Geneva, Switzerland: World Health Organization (2015).
6. Drewnowski A, Rehm CD. Consumption of added sugars among US children and adults by food purchase location and food source. Am J Clin Nutr. (2014) 100:901–7. doi: 10.3945/ajcn.114.089458
7. Azaïs-Braesco V, Sluik D, Maillot M, Kok F, Moreno LA. A review of total & added sugar intakes and dietary sources in Europe. Nutr J. (2017) 16:6. doi: 10.1186/s12937-016-0225-2
8. Zupanič N, Hristov H, Gregorič M, Blaznik U, Delfar N, Koroušić Seljak B, et al. Total and free sugars consumption in a slovenian population representative sample. Nutrients. (2020) 12:1729. doi: 10.3390/nu12061729
9. Ferruzzi MG, Tanprasertsuk J, Kris-Etherton P, Weaver CM, Johnson EJ. Perspective: the role of beverages as a source of nutrients and phytonutrients. Adv Nutr. (2020) 11:507–23. doi: 10.1093/advances/nmz115
10. Lobstein T. Reducing Consumption of Sugar-Sweetened Beverages to Reduce the Risk of Childhood Overweight and Obesity. London, World Health Organization (2014) Available onile at: https://www.who.int/elena/titles/bbc/ssbs_childhood_obesity/en/.
11. Pell D, Mytton O, Penney TL, Briggs A, Cummins S, Penn-Jones C, et al. Changes in soft drinks purchased by British households associated with the UK soft drinks industry levy: controlled interrupted time series analysis. BMJ. (2021) 372:n254. doi: 10.1136/bmj.n254
12. Bandy LK, Scarborough P, Harrington RA, Rayner M, Jebb SA. Reductions in sugar sales from soft drinks in the UK from 2015 to 2018. BMC Med. (2020) 18:20. doi: 10.1186/s12916-019-1477-4
13. Sánchez-Romero LM, Canto-Osorio F, González-Morales R, Colchero MA, Ng S-W, Ramírez-Palacios P, et al. Association between tax on sugar sweetened beverages and soft drink consumption in adults in Mexico: open cohort longitudinal analysis of health workers cohort study. BMJ. (2020) 369:m1311. doi: 10.1136/bmj.m1311
14. Popkin BM, Hawkes C. Sweetening of the global diet, particularly beverages: patterns, trends, and policy responses. Lancet Diabetes Endocrinol. (2016) 4:174–86. doi: 10.1016/S2213-8587(15)00419-2
15. de Lourdes Samaniego-Vaesken M, González-Fernández B, Partearroyo T, Urrialde R, Varela-Moreiras G. Updated database and trends of declared low- and no-calorie sweeteners from foods and beverages marketed in Spain. Front Nutr. (2021) 8:670422. doi: 10.3389/fnut.2021.670422
16. Sambra V, Lopez-Arana S, Caceres P, Abrigo K, Collinao J, Espinoza A, et al. Overuse of non-caloric sweeteners in foods and beverages in chile: a threat to consumers' free choice? Front Nutr. (2020) 7:68. doi: 10.3389/fnut.2020.00068
17. Dusemund B, Gilbert J, Gott D, Kenigswald H, König J, Lambré C, et al. Food additives and nutrient sources added to food: developments since the creation of EFSA. EFSA J. (2012) 10:s1006. doi: 10.2903/j.efsa.2012.s1006
18. Serra-Majem L, Raposo A, Aranceta-Bartrina J, Varela-Moreiras G, Logue C, Laviada H, et al. Ibero?american consensus on low- and no-calorie sweeteners: safety, nutritional aspects and benefits in food and beverages. Nutrients. (2018) 10:818. doi: 10.3390/nu10070818
19. Ruiz-Ojeda FJ, Plaza-Diaz J, Saez-Lara MJ, Gil A. Effects of sweeteners on the gut microbiota: a review of experimental studies and clinical trials. Adv Nutr. (2019) 10(Suppl. 1):S31–48. doi: 10.1093/advances/nmy037
20. Zhang X, Li X, Liu L, Hong F, Zhao H, Chen L, et al. Dose–response association between sugar- and artificially sweetened beverage consumption and the risk of metabolic syndrome: a meta-analysis of population-based epidemiological studies. Public Health Nutr. (2020) 24:3892–904. doi: 10.1017/S1368980020003614
21. de Koning L, Malik VS, Rimm EB, Willett WC, Hu FB. Sugar-sweetened and artificially sweetened beverage consumption and risk of type 2 diabetes in men. Am J Clin Nutr. (2011) 93:1321–7. doi: 10.3945/ajcn.110.007922
22. Hunter SR, Reister EJ, Cheon E, Mattes RD. Low Calorie Sweeteners Differ in Their Physiological Effects in Humans. Nutrients. (2019) 11:2717. doi: 10.3390/nu11112717
23. Pang MD, Goossens GH, Blaak EE. The Impact of Artificial Sweeteners on Body Weight Control and Glucose Homeostasis. Front Nutr. (2021) 7:333. doi: 10.3389/fnut.2020.598340
24. Dewinter L, Casteels K, Corthouts K, Van de Kerckhove K, Van der Vaerent K, Vanmeerbeeck K, et al. Dietary intake of non-nutritive sweeteners in type 1 diabetes mellitus children. Food Addit Contam Part A Chem Anal Control Expo Risk Assess. (2016) 33:19–26. doi: 10.1080/19440049.2015.1112039
25. Garavaglia MB, Rodríguez García V, Zapata ME, Rovirosa A, González V, Flax Marcó F, et al. Non-nutritive sweeteners: children and adolescent consumption and food sources. Arch Argent Pediatr. (2018) 116:186–91. doi: 10.5546/aap.2018.eng.186
26. Hafner E, Hribar M, Hristov H, Kušar A, Žmitek K, Roe M, et al. Trends in the use of low and no-calorie sweeteners in non-alcoholic beverages in Slovenia. Foods. (2021) 10:387. doi: 10.3390/foods10020387
27. Zupanič N, Hribar M, Fidler Mis N, Pravst I. Free sugar content in pre-packaged products: does voluntary product reformulation work in practice? Nutrients. (2019) 11:2577. doi: 10.3390/nu11112577
29. Dunford EK, Mhurchu CN, Huang L, Vandevijvere S, Swinburn B, Pravst I, et al. A comparison of the healthiness of packaged foods and beverages from 12 countries using the health star rating nutrient profiling system, 2013-2018. Obes Rev. (2019) 20:107–15. doi: 10.1111/obr.12879
30. Dunford E, Webster J, Metzler AB, Czernichow S, Ni Mhurchu C, Wolmarans P, et al. International collaborative project to compare and monitor the nutritional composition of processed foods. Eur J Prev Cardiol. (2012) 19:1326–32. doi: 10.1177/1741826711425777
31. Neal B, Sacks G, Swinburn B, Vandevijvere S, Dunford E, Snowdon W, et al. Monitoring the levels of important nutrients in the food supply. Obesity Reviews. (2013) 14:49–58. doi: 10.1111/obr.12075
32. Rayner M, Vandevijvere S. INFORMAS Protocol: Food Labelling Module. Auckland: The University of Auckland (2017).
33. NUTRIS. Podatkovna Baza CLAS Kot Orodje za Vrednotenje Sprememb na Podrocju Ponudbe Predpakiranih Živil. Sloveniji (2021). Available onilne at: https://www.nutris.org/clas/.
34. Pivk Kupirovič U, Miklavec K, Hribar M, Kušar A, Žmitek K, Pravst I. Nutrient Profiling Is Needed to Improve the Nutritional Quality of the Foods Labelled with Health-Related Claims. Nutrients. (2019) 11:287. doi: 10.3390/nu11020287
35. European Commission. Regulation (EC) No 1333/2008 of the European Parliament and of the Council of 16 December 2008 on food additives. Official Journal of the European Union (2008.)
36. Bernstein JT, Christoforou AK, Weippert M, L'Abbé MR. Reformulation of sugar contents in Canadian prepackaged foods and beverages between 2013 and 2017 and resultant changes in nutritional composition of products with sugar reductions. Public Health Nutr. (2020) 23:2870–8. doi: 10.1017/S1368980020001159
37. Samaniego-Vaesken ML, Ruiz E, Partearroyo T, Aranceta-Bartrina J, Gil A, Gonzalez-Gross M, et al. Added Sugars and Low- and No-Calorie Sweeteners in a Representative Sample of Food Products Consumed by the Spanish ANIBES Study Population. Nutrients. (2018) 10:1265. doi: 10.3390/nu10091265
38. Dunford EK, Taillie LS, Miles DR, Eyles H, Tolentino-Mayo L, Ng SW. Non-nutritive sweeteners in the packaged food supply-an assessment across 4 countries. Nutrients. (2018) 10:257. doi: 10.3390/nu10020257
39. BYS Coyle DH, Dunford EK, Wu JHY, Louie JCY. The use of non-nutritive and low-calorie sweeteners in 19,915 local and imported pre-packaged foods in Hong Kong. Nutrients. (2021) 13:1861. doi: 10.3390/nu13061861
40. Dunford EK, Miles DR, Ng SW, Popkin B. Types and amounts of nonnutritive sweeteners purchased by us households: a comparison of 2002 and 2018 nielsen homescan purchases. J Acad Nutr Diet. (2020) 120:1662–71. doi: 10.1016/j.jand.2020.04.022
41. Silva PD, Cruz R, Casal S. Sugars and artificial sweeteners in soft drinks: a decade of evolution in Portugal. Food Control. (2021) 120:107481. doi: 10.1016/j.foodcont.2020.107481
42. EFSA Panel on Food Additives and Nutrient Sources added to Food (ANS). Scientific Opinion on the re-evaluation of aspartame (E 951) as a food additive. EFSA J. (2013) 11:3496-759.
43. Czarnecka K, Pilarz A, Rogut A, Maj P, Szymańska J, Olejnik Ł, et al. Aspartame—true or false? Narrative review of safety analysis of general use in products. Nutrients. (2021) 13:1957. doi: 10.3390/nu13061957
44. Shankar P, Ahuja S, Sriram K. Non-nutritive sweeteners: Review and update. Nutrition. (2013) 29:1293–9. doi: 10.1016/j.nut.2013.03.024
45. Romo-Romo A, Aguilar-Salinas CA, Brito-Córdova GX, Gómez-Díaz RA, Almeda-Valdes P. Sucralose decreases insulin sensitivity in healthy subjects: a randomized controlled trial. Am J Clin Nutr. (2018) 108:485–91. doi: 10.1093/ajcn/nqy152
46. Risdon S, Battault S, Romo-Romo A, Roustit M, Briand L, Meyer G, et al. Sucralose and cardiometabolic health: current understanding from receptors to clinical investigations. Adv Nutr. (2021) 12:1500–13. doi: 10.1093/advances/nmaa185
47. Dalenberg JR, Patel BP, Denis R, Veldhuizen MG, Nakamura Y, Vinke PC, et al. Short-term consumption of sucralose with, but not without, carbohydrate impairs neural and metabolic sensitivity to sugar in humans. Cell Metab. (2020) 31:493–502. doi: 10.1016/j.cmet.2020.01.014
48. Martínez X, Zapata Y, Pinto V, Cornejo C, Elbers M, van der Graaf M, et al. Intake of non-nutritive sweeteners in chilean children after enforcement of a new food labeling law that regulates added sugar content in processed foods. Nutrients. (2020) 12:1594. doi: 10.3390/nu12061594
49. Smith LH, Baumker E. Sugar-sweetened beverage behaviors of tennessee school children: how do parent- and child-report compare on school days and nonschool days? J Spec Pediatr Nurs. (2019) 24:e12231. doi: 10.1111/jspn.12231
51. Goiana-da-Silva F, Morais Nunes A, Miraldo M, Bento A, Breda J, Ferreira Araújo F. Using pricing policies to promote public health: the sugar sweetened beverages taxation experience in portugal. Acta Med Port. (2018) 31:191–5. doi: 10.20344/amp.10222
Keywords: low-and no-calorie sweeteners, beverages, reformulation, added sugar, food composition, database
Citation: Hafner E and Pravst I (2021) The Sharp Rise in the Use of Low- and No-Calorie Sweeteners in Non-Alcoholic Beverages in Slovenia: An Update Based on 2020 Data. Front. Nutr. 8:778178. doi: 10.3389/fnut.2021.778178
Received: 16 September 2021; Accepted: 25 October 2021;
Published: 19 November 2021.
Edited by:
Alessandra Durazzo, Council for Agricultural Research and Economics, ItalyReviewed by:
Malgorzata Grembecka, Medical University of Gdańsk, PolandHasnah Binti Haron, National University of Malaysia, Malaysia
Ewa Czarniecka-Skubina, Warsaw University of Life Sciences, Poland
Copyright © 2021 Hafner and Pravst. This is an open-access article distributed under the terms of the Creative Commons Attribution License (CC BY). The use, distribution or reproduction in other forums is permitted, provided the original author(s) and the copyright owner(s) are credited and that the original publication in this journal is cited, in accordance with accepted academic practice. No use, distribution or reproduction is permitted which does not comply with these terms.
*Correspondence: Igor Pravst, igor.pravst@nutris.org