The relationship between ultra-processed food intake and cardiometabolic risk factors in overweight and obese women: A cross-sectional study
 Dorsa Hosseininasab1
  Farideh Shiraseb2
  Sahar Noori1 Shahin Jamili3 Fatemeh Mazaheri-Eftekhar1 Mahshid Dehghan4
  Alessandra da Silva5
  Josefina Bressan5
  Khadijeh Mirzaei2*
- 1Department of Nutrition, Science and Research Branch, Islamic Azad University, Tehran, Iran
- 2Department of Community Nutrition, School of Nutritional Sciences and Dietetics, Tehran University of Medical Sciences (TUMS), Tehran, Iran
- 3Department of Surgery, Shahid Beheshti University of Medical Sciences, Tehran, Iran
- 4Population Health Research Institute, McMaster University and Hamilton Health Sciences, Hamilton, ON, Canada
- 5Department of Nutrition and Health, Universidade Federal de Viçosa, Viçosa, MG, Brazil
Background: Cardiovascular diseases (CVDs) are the leading cause of death globally. Based on recent studies, one of the factors that can have detrimental effects on CVD is the consumption of ultra-processed foods (UPFs). The current study investigated the relationship between UPF intake and cardiometabolic risk factors among Iranian women.
Methods: The current cross-sectional study was conducted on 391 women aged 18–65 years with a body mass index (BMI) ≥ 25 kg/m2. Dietary intake was assessed using a 147-item food frequency questionnaire (FFQ). Anthropometric and biochemistry parameters were also collected. UPFs were identified using the NOVA classification.
Results: In the present study, women had a mean (standard deviation) age of 36.67 (9.10) years and the mean BMI of 31.26 (4.29) kg/m2. According to our findings, there was a significant association between UPF consumption and transforming growth factor (TGF) (β: 0.101, 95% CI: 0.023, 0.180, p = 0.012), atherogenic coefficient (AC) (β: 0.011, 95% CI: 0.001, 0.032, p = 0.034), visceral fat level (VFL) (β: 0.006, 95% CI: −0.017, 0.029, p = 0.076), and the quantitative insulin sensitivity check index (QUICKI) (β: −3.775, 95%CI: 0.001, 0.001, p = 0.042).
Conclusion: In conclusion, an increase in consumption of one gram of UPFs is associated with an increase in TGF, AC, and VFL but with a decrease in QUICKI. Despite this, further experimental studies are necessary to draw a more definite conclusion and disentangle the mechanisms by which UPFs may affect health.
Introduction
Cardiovascular diseases (CVDs) are the leading cause of death globally; an estimated 17.9 million people died from CVDs in 2019, representing 32% of all global deaths (1). About 85% of the deaths were due to heart attack and stroke (1). According to previous studies conducted in 2016 and 2017, CVD has been the major cause of mortality in Iran, accounting for 46% of all deaths and 20–23% of the disease burden (2, 3).
The global consumption of ultra-processed foods (UPF) has risen exponentially. UPFs account for between 25 and 60% of total daily energy consumption, according to the Nationwide Food Surveys (4–14). According to the NOVA classification system, UPFs are defined as foods made up entirely or predominantly from unhealthy components containing higher levels of total fat, saturated fat, added sugar, energy density, and salt, and lower quantities of fiber and vitamin density (15). UPF packaging contains materials that come into contact with food, such as Bisphenol A, which, according to a meta-analysis of observational studies, may increase the risk of cardiometabolic disorders, even though prospective cohort studies are still limited (16, 17). Some studies reported that consumption of UPF is associated with adverse health outcomes, including CVDs, and obesity (18–20). Srour et al. reported a higher risk of CVD associated with the consumption of ultra-processed foods (21).
Given the high prevalence of CVDs in Iran, it is necessary to find dietary factors that may associate with the disease (22). The main objective of this study was to investigate the relationship between UPF intake and cardiometabolic risk factors among Iranian women, and the secondary objectives were to exhibit the association between UPF consumption, food groups, and demographic variables.
Methods
Study population
The research was conducted in Tehran, Iran, using a multi-stage cluster random sampling procedure on 391 overweight and obese women with a body mass index (BMI) ranging from 25 to 40 kg/m2 and aged 18–48 years, recruited from the community health center of the Tehran University of Medical Sciences (TUMS) in 2018. We used the sample size formula N =([(Z 1−α+Z1−β)1-r2]/r)2+2), β = 95%, and α = 0.05, r = 0.25. Participants were excluded from the study if they reported a total daily energy intake outside of 800–4,200 kcal (17,556–3,344 kJ) (23) or if they reported a history of diseases such as CVD, diabetes, cancer, kidney disease, thyroid disease, menopause, pregnancy, and breastfeeding. In addition, individuals on lipid-lowering agents, individuals on blood glucose-lowering agents, and those who consumed alcohol or smoked were excluded from the study. Furthermore, the food frequency questionnaire (FFQ) did not include individuals who did not respond to more than 70 questions and had significant fluctuations in their weight over the past year. After learning about the study's objectives, all the participants signed an informed consent form. The Human Ethics Committee of Tehran University of Medical Sciences approved the study protocol (Ethics number: IR.TUMS.VCR.REC.1398.142, Date of reference number: 5 April 2019).
Dietary assessment and NOVA calculation
To evaluate the food consumption of participants during the previous year, we used a validated semi-quantitative FFQ, whose validity and reliability have already been authorized (24, 25). Trained dietitians were responsible for applying the FFQ. In total, one hundred forty-seven food items were included in this FFQ with a standard serving size, and participants assessed their consumption frequency according to four categories: daily, weekly, monthly, and infrequent. Using home measures, the portion sizes of the consumed foods were converted to grams (23). Nutrient and energy intakes were calculated using NUTRITIONIST IV software (version 7.0; N-Squared Computing, Salem, OR). The following food and beverage items are classified as UPFs in the NOVA food group classification, which is the subject of this research, and are grouped into the FFQ into seven food groups (daily intake was calculated as grams): (1) Non-dairy beverages (coffee, cola, nectar, and industrial sweet drink), (2) dairy beverages (ice cream, pasteurized and non-pasteurized, chocolate milk, and cocoa milk), (3) cakes and cookies (cookies, biscuits, pastries (creamy and non-creamy), cake, pancake, industrial bread, toasted bread, noodles, and pasta), (4) fast food and processed meat (burger, sausage, pizza, and bologna), (5) salty snacks (chips, crisps, crackers, and cheese puff), (6) oil and sauce (mayonnaise, margarine, and ketchup), (7) sweets (Gaz, Sohan, Noghl, sesame halva, chocolate, candies, rock candies, jam, and sweets) (26). All the NOVA components were adjusted for energy intake.
Anthropometry and body composition
Participants were advised to fast for 12 h the night before the assessment and avoid unusual physical activity for 72 h before the anthropometrics and body composition assessments. A digital stadiometer (Seca) was used to measure height (m) with a precision of 0.5 cm. The waist circumference (WC) (cm) and hip circumference (HC) (cm) with an accuracy of 0.5 cm were measured within the largest and the littlest circumference separately. The waist-to-hip ratio (WHR) was computed as WC (cm)/HC (cm).
A multi-frequency bioelectric impedance analyzer (BIA) (Inbody Co., Seoul, Korea) scanner evaluated body composition. This electrical impedance analyzer measures the resistance of body tissues to the passage of an electrical signal given through the feet and hands. The body composition analyzer was used to assess the individuals' weight, BMI, fat mass (FM), fat-free mass (FFM), body fat percentage (%), and the others, according to a predetermined methodology. The participants were instructed to urinate before measuring their body composition according to the fabricant recommendations.
Biochemical assessment
The blood samples were obtained between 8:00 and 10:00 a.m. at the Nutrition and Biochemistry lab of the School of Nutritional Sciences and Dietetics, TUMS, after an overnight fast and deposited in tubes containing 0.1 percent ethylenediaminetetraacetic acid (EDTA). The serum was centrifuged, aliquoted, and stored at −70°C. The glucose oxidase phenol 4-aminoantipyrine peroxidase (GOD/PAP) technique determined fasting blood glucose levels (FBG). To evaluate blood triglyceride (TG) levels, enzyme colorimetric assays with GPO–PAP were utilized. Total cholesterol was assessed using phenol 4-aminoantipyrine peroxidase (CHOD–PAP), low-density lipoprotein (LDL), and high-density lipoprotein (HDL) were measured using the direct approach and immunoinhibition. The serum high-sensitivity C-reactive protein (hs-CRP) was measured using an immunoturbidimetric method. The Enzyme-Linked Immunosorbent Assays (ELISA) technique was used to evaluate the levels of IL-1β and PA-I (Human PAI-1*96 T ELIZA kit Crystal Company). The serum insulin concentrations were determined using the enzyme-linked immunosorbent assay (ELISA kit). The ELISA kit was also used to quantify serum MCP-1 levels (Zell Bio GmbH, Germany, assay range:5 ng/L−1,500 ng/L, sensitivity:2.4 ng/L, CV10 percent inter-assay variability). All of the kits were given by Pars Azmoon (Pars Azmoon Inc. Tehran, Iran). Insulin resistance was assessed using a homeostasis model (HOMA–IR). The index was computed using the algorithm (plasma glucose mmol/ l / × fasting plasma insulin mIU/ l)/22.5 (27). The quantitative insulin sensitivity check index (QUICKI) was also used to evaluate insulin resistance through the formula 1/[log (fasting insulin) + log (fasting glucose)] (27). From biochemical parameters, FBG, TG, HDL, LDL, hs-CRP, and IL_1β variables are considered as CVD risk factors in this study.
The atherogenic index of plasma (AIP) was calculated using the logarithmic of (TG/HDL-C). TC/HDL, LDL/HDL, and (TC-HDL) /LDL were used to determine castelli's risk index 1 (CRI- I), castelli's risk index 2 (CRI- II), and atherogenic coefficient (AC), respectively. The following formula was used to compute CHOLIndex: CHOLIndex = LDL-C – HDL-C (TG <400) = LDL-C – HDL-C + 1/5 TG (TG >400). (28). Ln (FBG (mg/dl) * TG (mg/dl)/2) was used to determine triglyceride–glucose index (TyG index) (29). The terms triglyceride glucose-waist circumference (TyG–WC) and triglyceride glucose–body mass index (TyG–BMI) were obtained through the formulas: [Ln (FBG (mg/dl) * TG (mg/dl)/2)] * WC and [Ln (FBG (mg/dl) * TG (mg/dl)/2)] * BMI), respectively (30).
Blood pressure assessment
Blood pressure was measured using an automated sphygmomanometer according to standard procedures (OMRON, Germany).
Other collected data
General information about the participants, such as their age, job status (employed, unemployed), education level (illiterate, under diploma, diploma, and bachelor and higher) (what are the categories? Detail the methodology here, as well as the other variables), marital status (single and married), economic status (low, middle, and high class), standard questionnaires, were collected. The physical activity status was obtained using the validated International Physical Activity Questionnaire (IPAQ). Afterward, metabolic equation hours per day (MET-min/week) were calculated for each subject. After that, each subject's metabolic equation hours per day score (MET-min/week) was calculated. Trained professionals were responsible for applying the questionnaires (31, 32).
Statistical analyses
The Kolmogorov–Smirnov test was used to check the quantitative variable's normality (P > 0.05). Categorical data were reported as absolute and relative frequencies, and quantitative data were reported as means and standard deviation (SD). According to the NOVA score, the participants were categorized into tertiles of UPF consumption in grams. To compare the mean difference of quantitative and frequency of categorical variables across UPF tertiles, a one-way analysis of variance (ANOVA) and Pearson chi-square (χ2) tests were performed, respectively. Analysis of covariance (ANCOVA) adjusted for potential confounders (age, BMI, energy intake, and physical activity) and considering BMI as a collinear variable for anthropometrics and body composition variables were performed. The Bonferroni post-hoc test was used to detect the statistically significant difference among UPF tertiles. Linear regression was performed to evaluate the association of the UPF consumption (independent variable) with cardiometabolic risk factors (dependent variable). Model 1 was adjusted for age, BMI, physical activity, total energy intake, supplements intake, and job status. Model 2 was further adjusted for legumes and vegetables. This analysis was presented as the β-value and a confidence interval of 95% (CI). SPSS v.26 software (SPSS Inc., IL, USA) was used for statistical analysis. The significance level was set at p < 0.05.
Results
A total of 391 participants were included in the present study. Women had a mean (SD) age of 36.67 (9.10) years and a mean BMI of 31.26 (4.29) kg/m2. The majority of women were employed (97%), 47% were highly educated (bachelor's degree and higher), and 45.5% had a middle income. The mean of UPF intake in our sample was 442.47 (127.91) g or 96.8 %.
The general characteristics of participants among UPF tertiles are presented in Table 1. The average UPF consumption in tertile 1 was <383,681 g, in tertile 2 was from 383,681 g to 467,713 g, and in tertile 3 was >467,713 g. The mean of age (P = 0.003) was statistically different between UPF tertiles in the crude model and after controlling for confounding variables. The mean height (P = 0.047) was statistically different between UPF tertiles in the crude model. According to the Bonferroni's post-hoc test, the significant mean difference in age was between T2 and T3, and the mean difference was higher in T2 than in T3. In the categorical variables, the supplementation intake (P = 0.057) and job status (P = 0.073) were marginally significant between UPF tertiles after controlling for cofounders. There was no significant difference for other variables (Table 1).
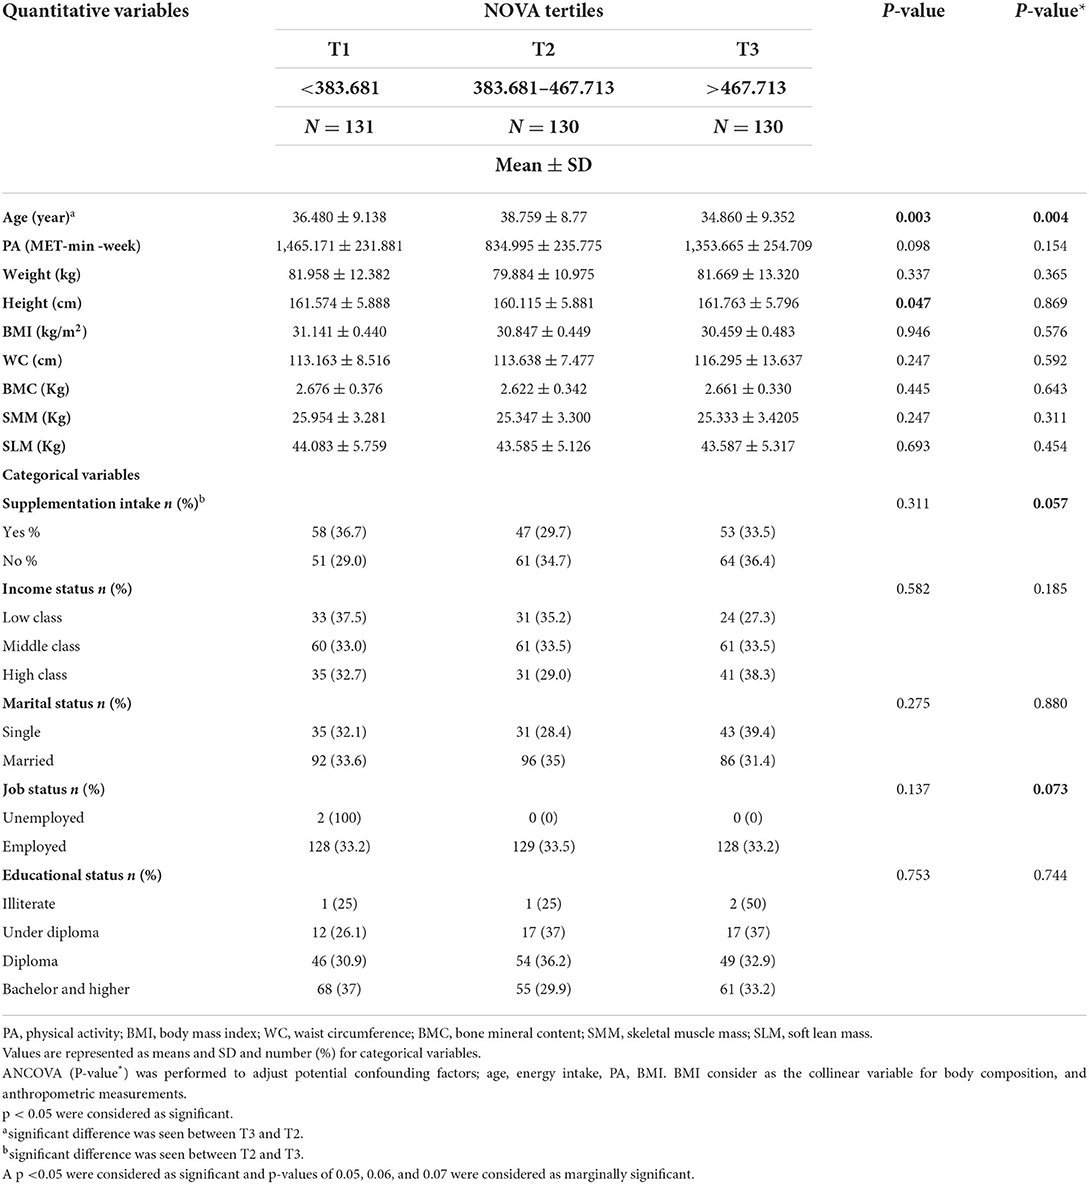
Table 1. General characteristics among tertiles of NOVA score in obese and overweight women (n = 391).
Dietary intakes among the UPF tertiles
Dietary intakes of all the participants among tertiles of UPF consumption are presented in Table 2. The mean of non-dairy beverages (P = 0.001), dairy beverages (P = 0.001), cookies (cakes) (P = 0.001), potato chips (salty) (P = 0.001), processed meat (fast food) (P = 0.001), oil (sauce group) (P = 0.005), sweet (P = 0.001) were statistically different among UPF tertiles, with it being higher in the third tertile. With increasing UPF consumption, non-dairy beverages, cookies (cakes), dairy beverages, potato chips (salty), processed meat (fast food), oil, sauce, and sweet have increased in the crude and adjusted model.
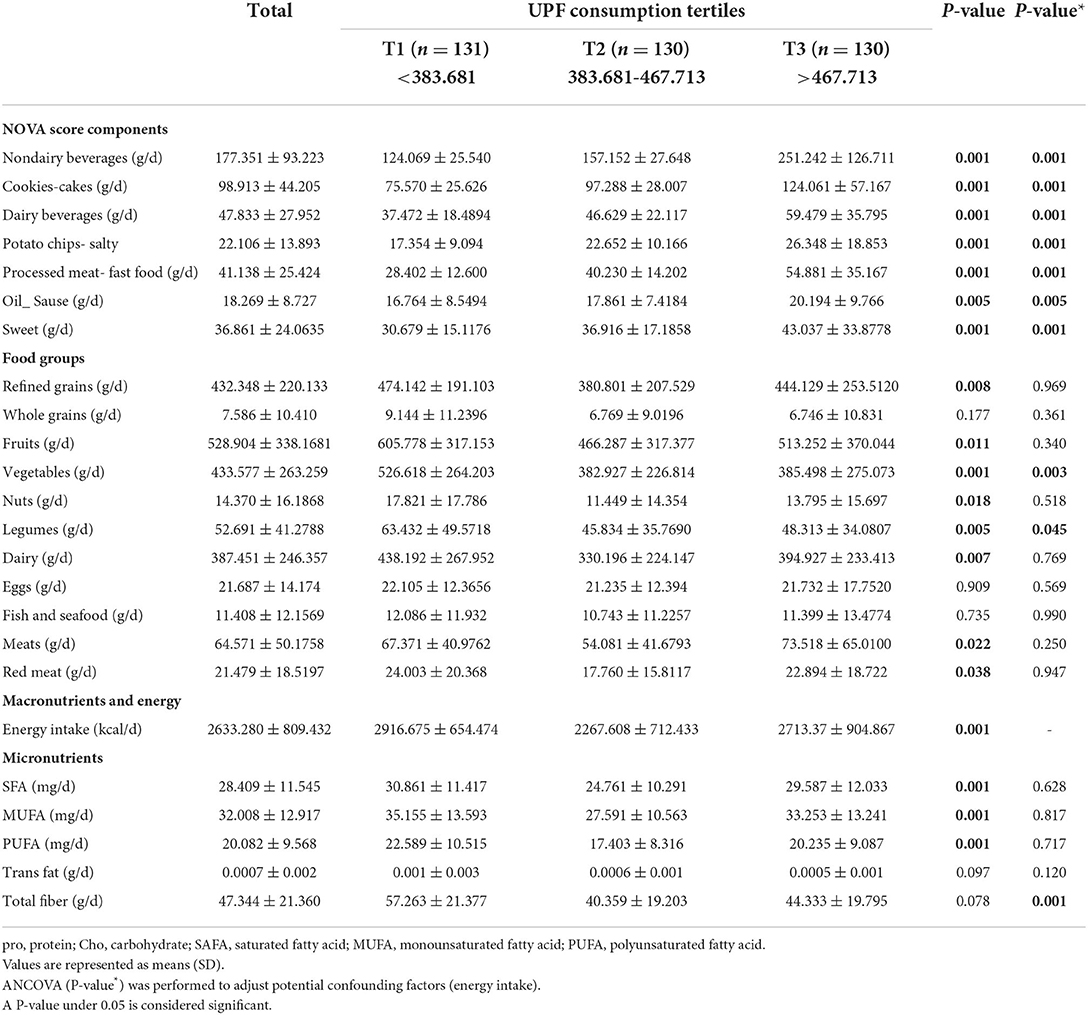
Table 2. Dietary intakes among tertiles of the NOVA score in obese and overweight women (n = 391).
CVD risk factors among the UPF tertiles
The association of CVD risk factors among UPF consumption tertiles is shown in Table 3. UPF consumption was associated with the HOMA–IR index (P = 0.024), hs-CRP (P = 0.001), and TYG–WC (P = 0.026). On the contrary, it was marginally associated with the markers TGF (P = 0.077), AC (P = 0.072), CRI-1 (P = 0.062), and NC (P = 0.068).
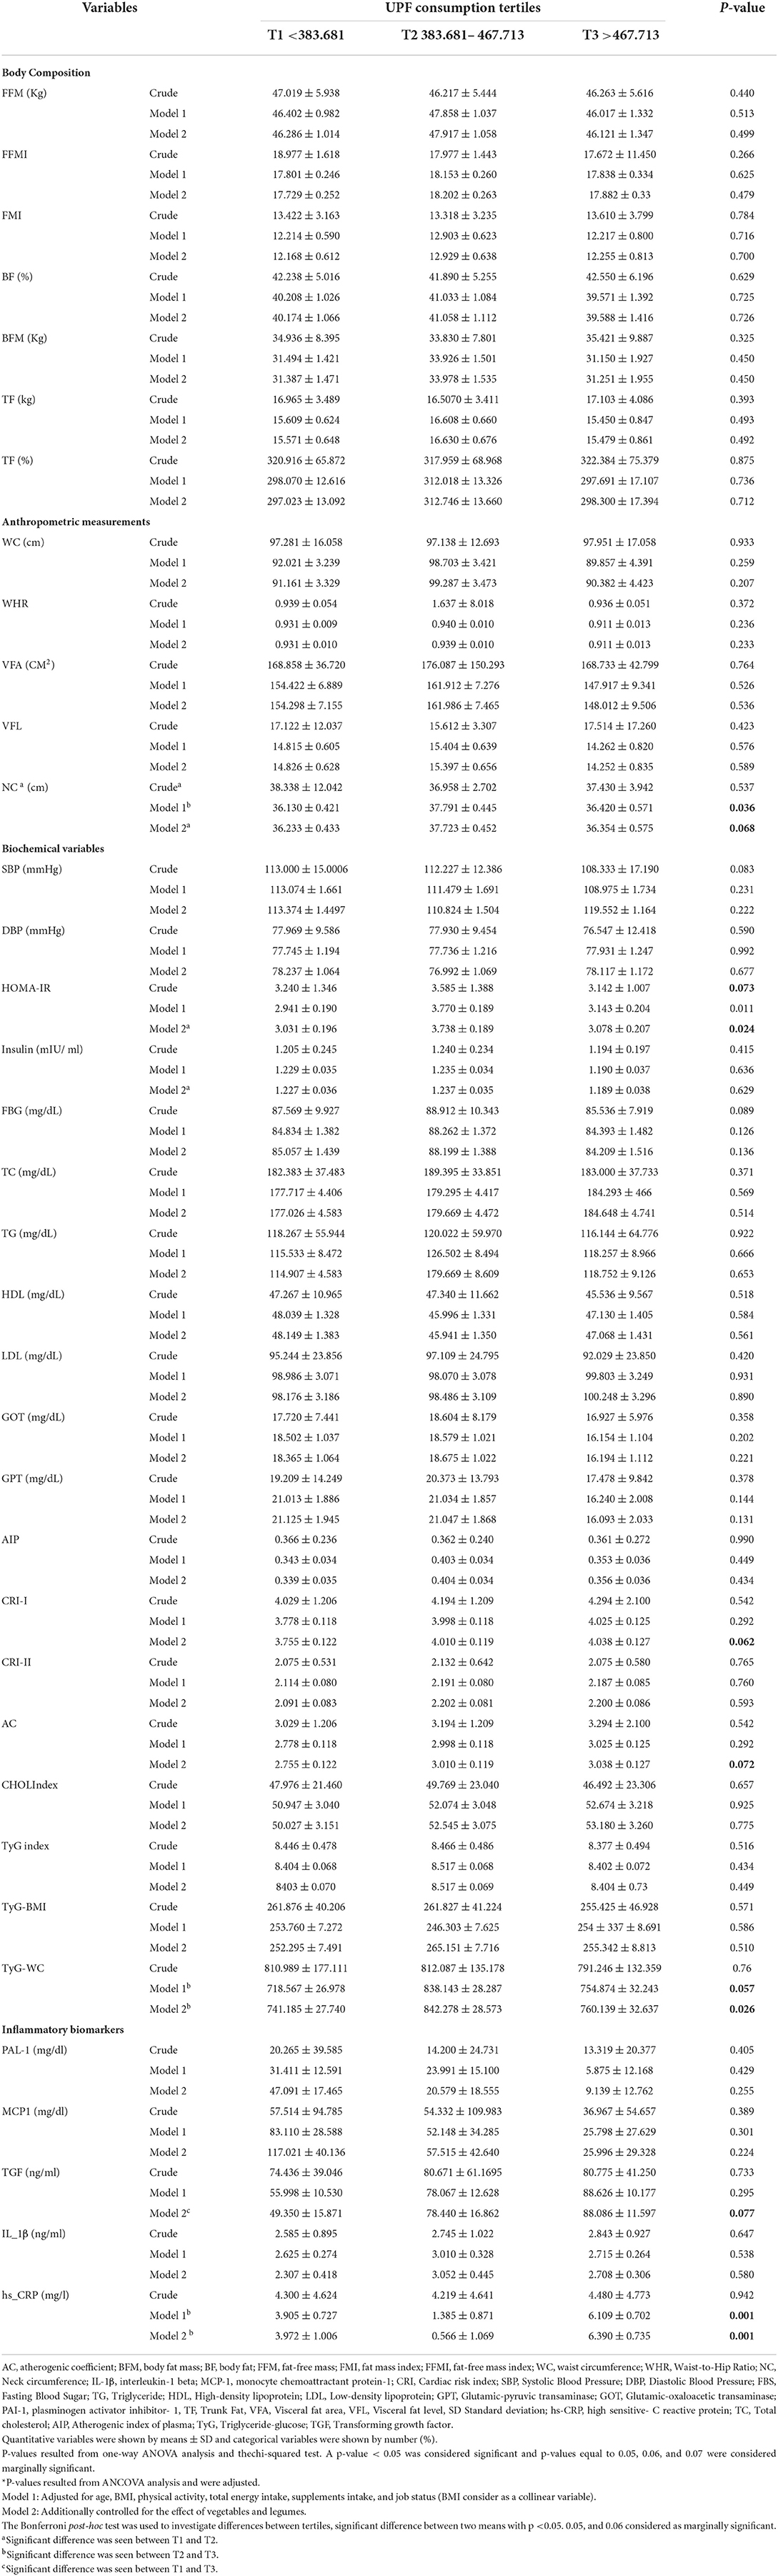
Table 3. CVD risk factors consist of anthropometric measurements and body composition, biochemical variables, and inflammatory factors among tertiles of NOVA score in obese and overweight women (n = 391).
Association between UPF consumption and CVD risk factors, anthropometric measurements, body composition, biochemical variables, and inflammatory factors
Association between UPF consumption and CVD risk factors, anthropometric measurements, body composition, biochemical variables, and inflammatory factors in crude and adjusted models present with β-value and a 95% CI is shown in Table 4. In the model 1, there was a significant association between UPF consumption and TGF (β: 0.101, 95% CI: 0.023, 0.180, p = 0.012). Also, there was a significant association between UPF consumption and AC (β: 0.011, 95%CI: 0.001, 0.032, p = 0.034), VLF (β: 0.006, 95% CI: −0.017, 0.029, p = 0.076), and ISQIUKI (β: −3.775, 95% CI: 0.001, 0.001, P = 0.042). With increasing one gram of UPF intake, AC increases to 0.011, VFL increases by 0.006, and QUICKI is significantly reduced by −3.775 mg/lit. The other variables in Table 3 had no significant association.
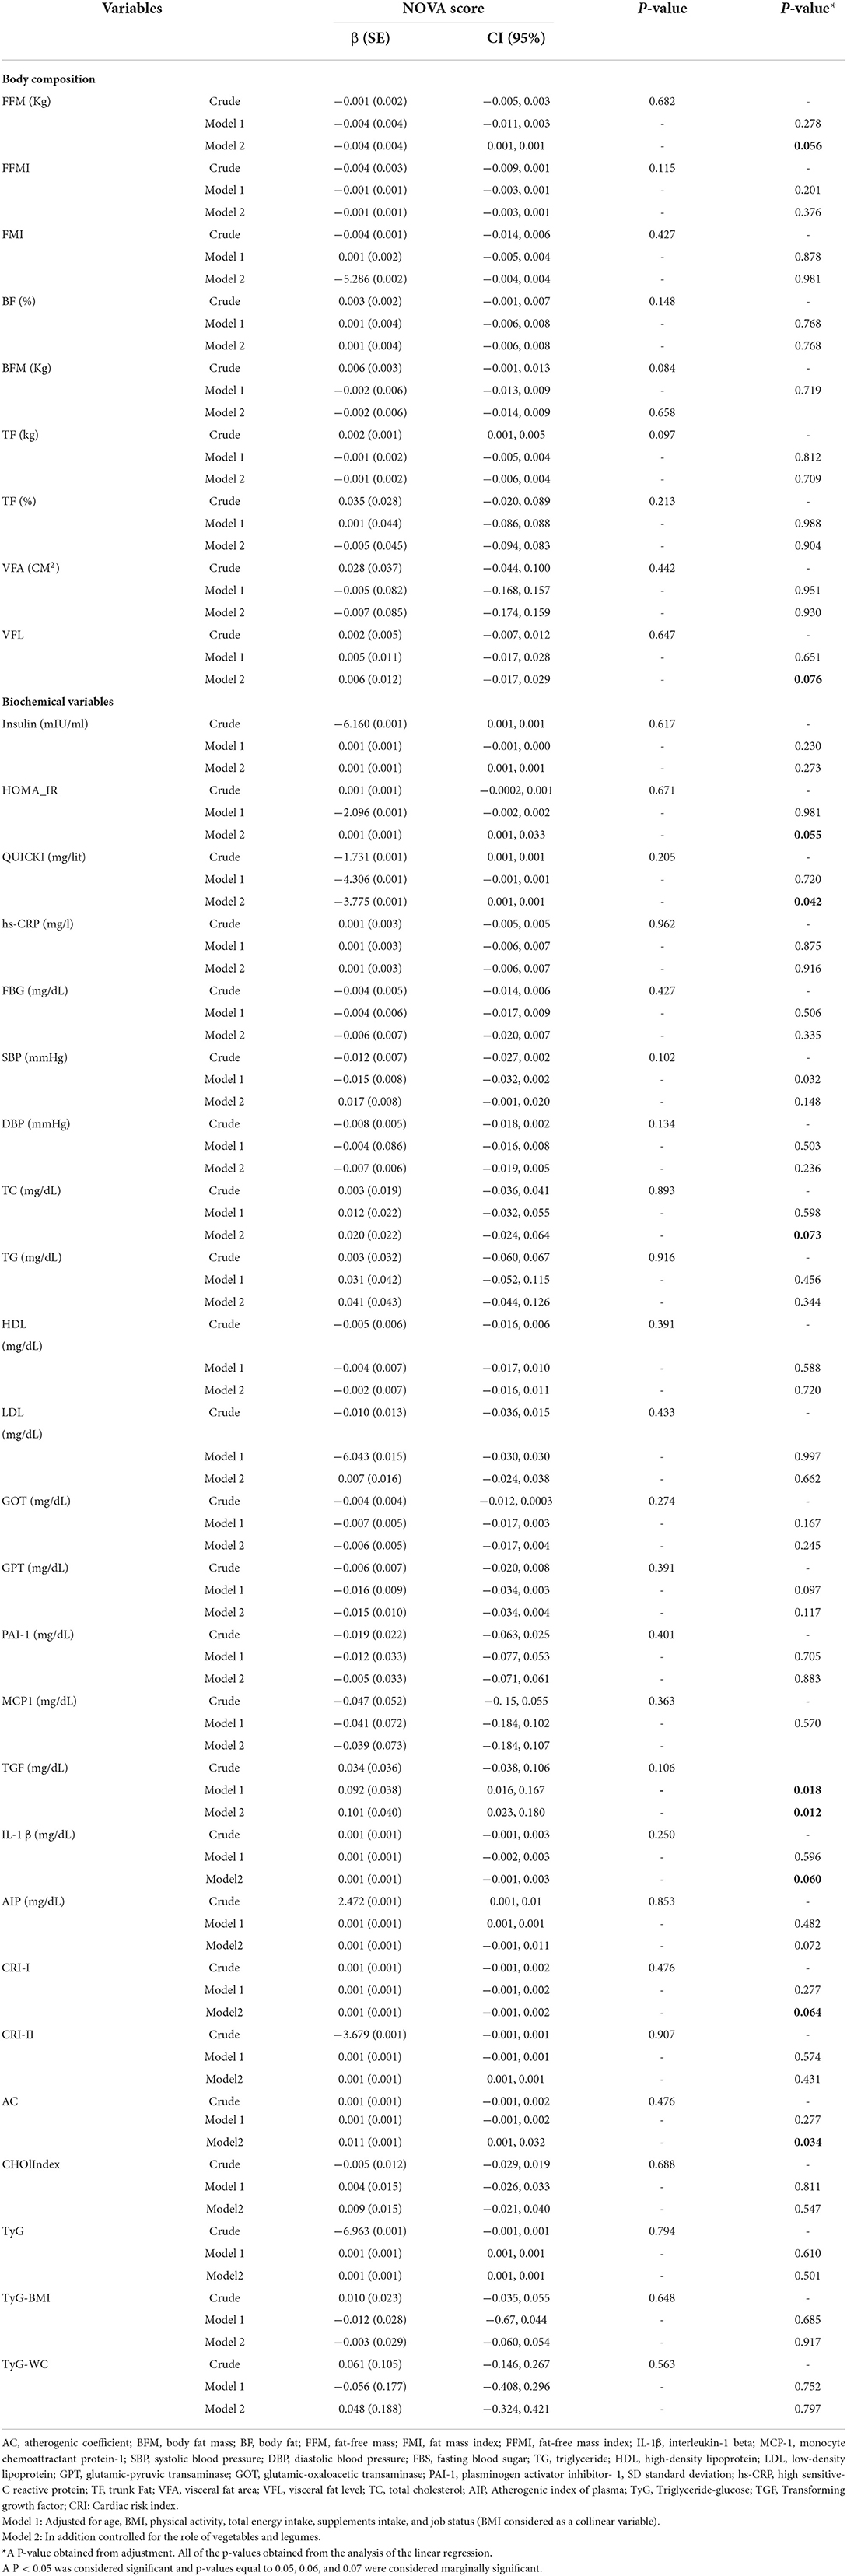
Table 4. Association between NOVA score and CVD risk factors, anthropometric measurements, body composition, biochemical variables, and inflammatory factors in obese and overweight women (n = 391).
Discussion
To the best of our knowledge, this is the first study investigating the relationship between UPF intake and cardiometabolic risk in overweight and obese Iranian women.
In the current study, we found an inverse association between the NOVA score and FFM. In addition, we observed a positive association between the NOVA score and VFL, AC, the HOMA-IR-index, QUICKI, TC, TGF, IL-1B, and the CRI-I levels. In other words, participants who had higher NOVA scores and consumed higher amounts of UPF had higher levels of VFL, AC, the HOMA-IR-index, QUICKI, TC, TGF, IL-1B, and CRI-I. The positive association observed between UPFs and mentioned markers might be partly explained by their poorer nutritional quality compared with the NOVA scores' lower tertiles. In fact, UPFs tend to be higher in saturated fats, sugar, and energy, and poorer in dietary fiber (5, 9, 21, 33). The positive association between consumption of UPF and inflammatory markers that have been seen among women may be explained by the greater accumulation of body fat in women (34). In line with our study, in 2021, a systematic review and meta-analysis of 7 cohort studies (207,291 adults) showed a significant positive association between UPF consumption and the risk of CVDs among adults with a BMI of more than 25 kg/m2 (35). Moreover, a recent narrative review study by Matos et al. (36) concluded that the consumption of UPFs is positively associated with the prevalence of chronic complications, including obesity, hypertension, CVDs, type 2 diabetes, and consequently the risk of all-cause mortality (36). The mechanism by which UPF is associated with CVD is summarized in Figure 1.
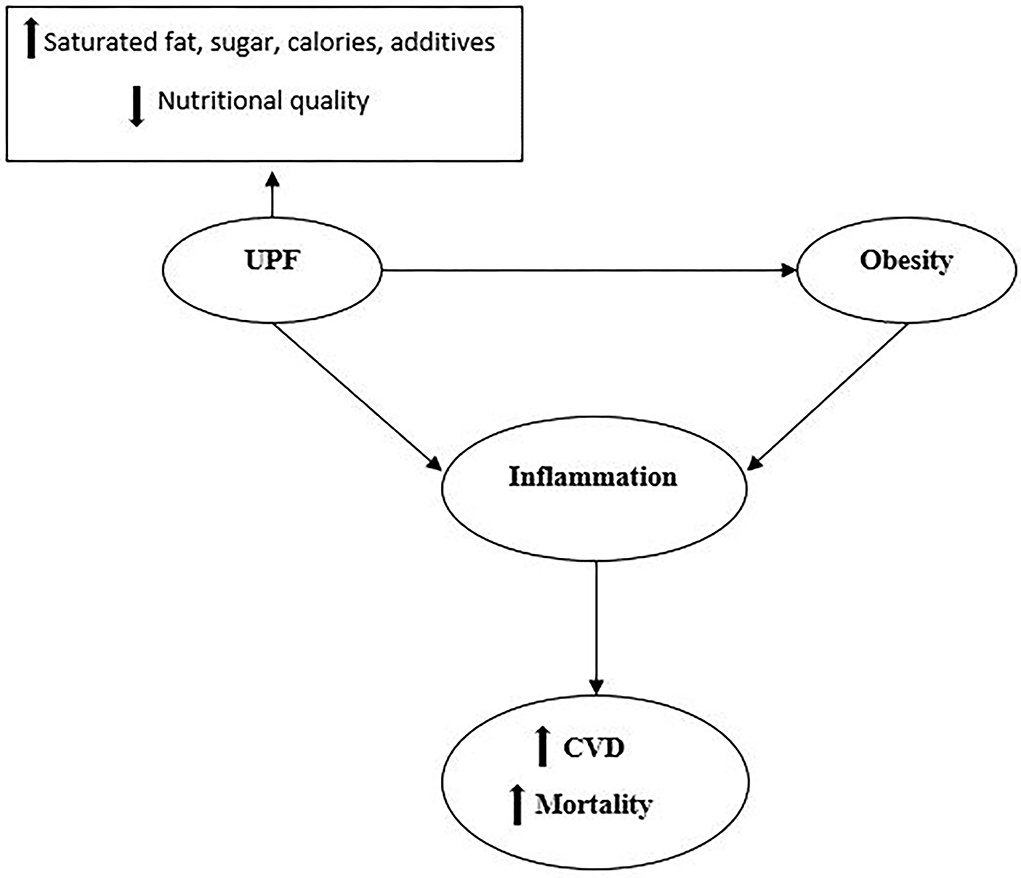
Figure 1. UPFs have higher levels of saturated fats, sugar, salt, additives, calories, and lower nutritional quality. Consumption of UPFs is suggested to have associations with obesity. Both obesity and consumption of UPFs could stimulate the whole chronic inflammation cascade and enhance the risk of CVD and all-cause mortality.
In our study, individuals at higher tertiles of NOVA (compared to tertile 1) had higher NC, AC, TyG-WC, HOMA-IR-INDEX, CRI-I, TGF, and hs-CRP levels. Beslay et al., in a large observational prospective study of 110,260 adults, indicated that higher consumption of UPF was associated with a gain in BMI and higher risks of overweight and obesity (37). Also, a prospective cohort of healthy subjects in Italy showed that adults in the highest quartile of UPF consumption had a higher risk of CVD (38). It is well known that adipose tissue produces cytokines that induce inflammatory markers production (39). Thus, the association between the consumption of UPFs and the inflammatory response is expected to be mostly dependent on adiposity. A cross-sectional study displayed that there might be a direct association between consumption of ultra-processed foods and CRP levels, under the assumption that the high-glycemic index of these food products could stimulate the whole chronic inflammation cascade, along with an indirect association mediated by obesity. They suggest that decreased consumption of UPFs can reduce chronic low-grade inflammation, perhaps by reducing obesity (40).
In the present study, participants with higher NOVA scores had higher consumption of cakes and sweets, processed meats, and fast foods. Bonaccio et al., in 2021, indicated that a high proportion of UPF in the diet was associated with an increased risk of CVD and all-cause mortality, probably because of its high dietary content of sugar (38). Rising evidence suggests that the consumption of UPF products determined by the low-nutritional quality and high-calorie content adversely contribute to an unhealthy dietary pattern, which enhances the risk of all-cause mortality as a substantial risk factor (36). In addition, additives in such foods containing noncaloric artificial sweeteners, emulsifiers, and thickening agents cause numerous chronic disorders such as metabolic dysfunction, systemic inflammation, endothelial dysfunction, and disrupted immune response (41–43). More than that, synthetic compounds used in the packaging of UPFs, such as bisphenol A, can act as xenohormones. Particularly, bisphenol A has been indicated to impair reproductive function and augment the risk of cancer-cause mortality (44, 45). Recently, a study conducted in the US displayed that UPF consumption was related to increased exposure to phthalates (44), which has suggested associations with obesity (46). Some food additives specific to UPFs might be involved in obesity etiology. For instance, saccharin, an artificial sweetener, could potentiate glucose-stimulated insulin release from isolated pancreatic β-cells (47), leading to insulin resistance and possibly weight gain. Several emulsifiers (such as carboxymethyl cellulose and polysorbate-80) induced metabolic perturbations, alterations to the gut microbiota, and low-grade inflammation in mice (48). Carrageenan, in the top 20 used additives, might augment insulin resistance and inhibit insulin signaling in mouse liver and human HepG2 cells (49, 50), which might, in turn, induce weight gain (51). Trans fatty acids found in UPFs containing hydrogenated oils have been associated with cardiovascular disease (52) and obesity (53), apparently by altering nutrient handling in the liver, the adipose tissues, and the skeletal muscle (54). Acrylamide, a neo-formed compound created during thermal processing of food as a result of the Maillard reaction, was shown to induce adipocyte differentiation and obesity in mice (55).
The present study possesses some strengths and limitations. At first, to the best of our knowledge, this is the first study to have evaluated the association between processed food intake and CVD risk in overweight and obese Iranian women. Second, dietary intake was assessed using a validated questionnaire. Third, in the current study, we assessed several inflammatory markers, other biochemical parameters, and body composition as risk factors for CVD.
Nevertheless, despite these strengths, we must acknowledge some limitations in the present study. First, the cross-sectional nature of this study limited the ability to suggest a causal relationship between UPF intake and the risk of cardiovascular diseases. Second, some errors may be present in the dietary assessment, mostly due to recall bias and misclassification errors; to overcome such errors, we evaluated biomarkers such as vitamin C to better capture individuals' variability in intakes. Third, our result may not be generalizable to normal-weight women. At final, although we considered known potential confounders, residual confounding cannot be ruled out.
Conclusion
In conclusion, an increase of one gram of UPFs consumption is associated with an increase in TGF, AC, and VFL but with a decrease in QUICKI. Higher consumption of UPF is significantly associated with an enhanced risk of adult inflammation and cardiometabolic risk factors. Further large studies involving participants of different ages and genders are highly warranted, in addition to experimental studies, to draw a more definite conclusion and disentangle the mechanisms by which UPFs may affect health.
Data availability statement
Participants of this study disagreed on their data being shared publicly, so supporting data is not available. Further inquiries can be directed to the corresponding author KM, mirzaei_kh@tums.ac.ir; mirzaei_kh@sina.tums.ac.ir.
Ethics statement
The studies involving human participants were reviewed and approved by Tehran University of Medical Sciences, Tehran, Iran. The patients/participants provided their written informed consent to participate in this study.
Author contributions
DH and SN wrote the paper. FS and FM-E performed the statistical analyses. SJ, MD, AS, and JB critically reviewed and revised the manuscript. KM had full access to all of the data in the study and took responsibility for the integrity and accuracy of the data. All authors read and approved the final manuscript.
Funding
This study is funded by grant from the Tehran University of Medical Sciences (TUMS) (Grant ID: 97-03-161-41017).
Acknowledgments
We are grateful to all the participants for their contribution to this research.
Conflict of interest
The authors declare that the research was conducted in the absence of any commercial or financial relationships that could be construed as a potential conflict of interest.
Publisher's note
All claims expressed in this article are solely those of the authors and do not necessarily represent those of their affiliated organizations, or those of the publisher, the editors and the reviewers. Any product that may be evaluated in this article, or claim that may be made by its manufacturer, is not guaranteed or endorsed by the publisher.
References
1. World Health Organization (WHO). Cardiovascular Diseases (2021). Available online at: https://www.who.int/news-room/fact-sheets/detail/cardiovascular-diseases-(cvds)
2. Mozaffarian D. Dietary and policy priorities for cardiovascular disease, diabetes, and obesity: a comprehensive review. Circulation. (2016) 133:187–225. doi: 10.1161/CIRCULATIONAHA.115.018585
3. Sarrafzadegan N, Mohammmadifard N. Cardiovascular disease in Iran in the last 40 years: Prevalence, mortality, morbidity, challenges and strategies for cardiovascular prevention. Arch Iran Med. (2019) 22:204–10.
4. Luiten CM, Steenhuis IH, Eyles H, Ni Mhurchu C, Waterlander WE. Ultra-processed foods have the worst nutrient profile, yet they are the most available packaged products in a sample of New Zealand Supermarkets. Public Health Nutr. (2016) 19:530–8. doi: 10.1017/S1368980015002177
5. Adams J, White M. Characterisation of Uk diets according to degree of food processing and associations with socio-demographics and obesity: cross-sectional analysis of uk national diet and nutrition survey (2008-12). Int J Behav Nutr Phys Act. (2015) 12:160. doi: 10.1186/s12966-015-0317-y
6. Cediel G, Reyes M, da Costa Louzada ML, Martinez Steele E, Monteiro CA, Corvalán C, et al. Ultra-Processed Foods and Added Sugars in the Chilean Diet (2010). Public Health Nutr. (2018) 21:125–33. doi: 10.1017/S1368980017001161
7. Costa Louzada ML, Martins AP, Canella DS, Baraldi LG, Levy RB, Claro RM, et al. Ultra-processed foods and the nutritional dietary profile in Brazil. Rev Saude Publica. (2015) 49:38. doi: 10.1590/S0034-8910.2015049006132
8. Martínez Steele E, Baraldi ML LG, Louzada, Moubarac JC, Mozaffarian D, Monteiro CA. Ultra-processed foods and added sugars in the Us diet: evidence from a nationally representative cross-sectional study. BMJ Open. (2016) 6:e009892. doi: 10.1136/bmjopen-2015-009892
9. Moubarac JC, Batal M, Louzada ML, Martinez Steele E, Monteiro CA. Consumption of ultra-processed foods predicts diet quality in Canada. Appetite. (2017) 108:512–20. doi: 10.1016/j.appet.2016.11.006
10. Moubarac JC, Martins AP, Claro RM, Levy RB, Cannon G, Monteiro CA. Consumption of ultra-processed foods and likely impact on human health. Evid Can Public Health Nutr. (2013) 16:2240–8. doi: 10.1017/S1368980012005009
11. Poti JM, Mendez MA, Ng SW, Popkin BM. Is the degree of food processing and convenience linked with the nutritional quality of foods purchased by us households? Am J Clin Nutr. (2015) 101:1251–62. doi: 10.3945/ajcn.114.100925
12. Slimani N, Deharveng G, Southgate DA, Biessy C, Chajès V, van Bakel MM, et al. Contribution of highly industrially processed foods to the nutrient intakes and patterns of middle-aged populations in the european prospective investigation into cancer and nutrition study. Eur J Clin Nutr. (2009) 63 (Suppl)4:S206–25. doi: 10.1038/ejcn.2009.82
13. Marrón-Ponce JA, Sánchez-Pimienta TG, Louzada M, Batis C. Energy contribution of nova food groups and sociodemographic determinants of ultra-processed food consumption in the Mexican Population. Public Health Nutr. (2018) 21:87–93. doi: 10.1017/S1368980017002129
14. Baraldi LG, Martinez Steele E, Canella DS, Monteiro CA. Consumption of ultra-processed foods and associated sociodemographic factors in the USA between 2007 and 2012: evidence from a nationally representative cross-sectional study. BMJ Open. (2018) 8:e020574. doi: 10.1136/bmjopen-2017-020574
15. Zinöcker MK, Lindseth IA. The western diet-microbiome-host interaction and its role in metabolic disease. Nutrients. (2018) 10:365. doi: 10.3390/nu10030365
16. DeJarnett N, Conklin DJ, Riggs DW, Myers JA, O'Toole TE, Hamzeh I, et al. Acrolein exposure is associated with increased cardiovascular disease risk. J Am Heart Assoc. (2014) 3:e000934. doi: 10.1161/JAHA.114.000934
17. Rancière F, Lyons JG, Loh VH, Botton J, Galloway T, Wang T, et al. Bisphenol a and the risk of cardiometabolic disorders: a systematic review with meta-analysis of the epidemiological evidence. Environ Health. (2015) 14:46. doi: 10.1186/s12940-015-0036-5
18. Costa CS, Del-Ponte B, Assunção MCF, Santos IS. Consumption of ultra-processed foods and body fat during childhood and adolescence: a systematic review. Public Health Nutr. (2018) 21:148–59. doi: 10.1017/S1368980017001331
19. Juul F, Martinez-Steele E, Parekh N, Monteiro CA, Chang VW. Ultra-processed food consumption and excess weight among us adults. Br J Nutr. (2018) 120:90–100. doi: 10.1017/S0007114518001046
20. Marti A. Ultra-Processed foods are not “real food” but really affect your health. Nutrients. (2019) 11:1902. doi: 10.3390/nu11081902
21. Srour B, Fezeu LK, Kesse-Guyot E, Allès B, Méjean C, Andrianasolo RM, et al. Ultra-processed food intake and risk of cardiovascular disease: prospective cohort study (nutrinet-santé). Bmj. (2019) 365:l1451. doi: 10.1136/bmj.l1451
22. Amini M, Parvaresh E. Prevalence of macro- and microvascular complications among patients with type 2 diabetes in Iran: a systematic review. Diabetes Res Clin Pract. (2009) 83:18–25. doi: 10.1016/j.diabres.2008.10.010
23. Azizi F, Ghanbarian A, Madjid M, Rahmani M. Distribution of blood pressure and prevalence of hypertension in Tehran adult population: tehran lipid and glucose study (Tlgs), 1999–2000. J Hum Hypertens. (2002) 16:305–12. doi: 10.1038/sj.jhh.1001399
24. Toorang F, Sasanfar B, Esmaillzadeh A, Ebrahimpour-Koujan S, Zendehdel K. Comparison of validity of the food frequency questionnaire and the diet history questionnaire for assessment of energy and nutrients intakes in an Iranian Population. East Mediterr Health J. (2020) 26:1062–9. doi: 10.26719/emhj.19.099
25. Mirmiran P, Esfahani FH, Mehrabi Y, Hedayati M, Azizi F. Reliability and relative validity of an Ffq for nutrients in the Tehran lipid and glucose study. Public Health Nutr. (2010) 13:654–62. doi: 10.1017/S1368980009991698
26. Edalati S, Bagherzadeh F, Jafarabadi MA, Ebrahimi-Mamaghani M. Higher Ultra-processed food intake is associated with higher DNA damage in healthy adolescents. Br J Nutr. (2021) 125:568–76. doi: 10.1017/S0007114520001981
27. Gutch M, Kumar S, Razi SM, Gupta KK, Gupta A. Assessment of insulin sensitivity/resistance. Indian J Endocrinol Metab. (2015) 19:160. doi: 10.4103/2230-8210.146874
28. Olamoyegun MA, Oluyombo R, Asaolu SO. Evaluation of dyslipidemia, lipid ratios, and atherogenic index as cardiovascular risk factors among semi-urban dwellers in Nigeria. Ann Afr Med. (2016) 15:194. doi: 10.4103/1596-3519.194280
29. Guerrero-Romero F, Simental-Mendía LE, González-Ortiz M, Martínez-Abundis E., Ramos-Zavala MaG, Hernández-González SO, et al. The product of triglycerides and glucose, a simple measure of insulin sensitivity comparison with the euglycemic-hyperinsulinemic clamp. J Clin Endocrinol Metabol. (2010) 95:3347–51. doi: 10.1210/jc.2010-0288
30. Zheng S, Shi S, Ren X, Han T, Li Y, Chen Y, et al. Triglyceride glucose-waist circumference, a novel and effective predictor of diabetes in first-degree relatives of type 2 diabetes patients: cross-sectional and prospective cohort study. J Transl Med. (2016) 14:1–10. doi: 10.1186/s12967-016-1020-8
31. Hagströmer M, Oja P, Sjöström M. The international physical activity questionnaire (Ipaq): a study of concurrent and construct validity. Public Health Nutr. (2006) 9:755–62. doi: 10.1079/PHN2005898
32. Ainsworth BE, Haskell WL, Herrmann SD, Meckes N, Bassett DR, Tudor-Locke C, et al. 2011 Compendium of physical activities: a second update of codes and met values. Med Sci Sports Exerc. (2011) 43:1575–81. doi: 10.1249/MSS.0b013e31821ece12
33. Luiten CM, Steenhuis IH, Eyles H, Ni Mhurchu C, Waterlander WE. Ultra-processed foods have the worst nutrient profile, yet they are the most available packaged products in a sample of New Zealand supermarkets–corrigendum. Public Health Nutr. (2016) 19:539. doi: 10.1017/S1368980015002840
34. Khera A, McGuire DK, Murphy SA, Stanek HG, Das SR, Vongpatanasin W, et al. Race and gender differences in C-reactive protein levels. J Am Coll Cardiol. (2005) 46:464–9. doi: 10.1016/j.jacc.2005.04.051
35. Suksatan W, Moradi S, Naeini F, Bagheri R, Mohammadi H, Talebi S, et al. Ultra-processed food consumption and adult mortality risk: a systematic review and dose-response meta-analysis of 207,291 participants. Nutrients. (2021) 14:174. doi: 10.3390/nu14010174
36. Matos RA, Adams M, Sabaté J. Review: The consumption of ultra-processed foods and non-communicable diseases in latin America. Front Nutr. (2021) 8:622714. doi: 10.3389/fnut.2021.622714
37. Beslay M, Srour B, Méjean C, Allès B, Fiolet T, Debras C, et al. Ultra-processed food intake in association with bmi change and risk of overweight and obesity: a prospective analysis of the french nutrinet-santé cohort. PLoS Med. (2020) 17:e1003256. doi: 10.1371/journal.pmed.1003256
38. Bonaccio M, Di Castelnuovo A, Costanzo S, De Curtis A, Persichillo M, Sofi F, et al. Ultra-processed food consumption is associated with increased risk of all-cause and cardiovascular mortality in the moli-Sani study. Am J Clin Nutr. (2021) 113:446–55. doi: 10.1093/ajcn/nqaa299
39. Brooks GC, Blaha MJ, Blumenthal RS. Relation of C-reactive protein to abdominal adiposity. Am J Cardiol. (2010) 106:56–61. doi: 10.1016/j.amjcard.2010.02.017
40. Lopes A, Araújo LF, Levy RB, Barreto SM, Giatti L. Association between consumption of ultra-processed foods and serum C-reactive protein levels: cross-sectional results from the Elsa-Brasil study. São Paulo Med J. (2019) 137:169–76. doi: 10.1590/1516-3180.2018.0363070219
41. Martino JV, Van Limbergen J, Cahill LE. The role of carrageenan and carboxymethylcellulose in the development of intestinal inflammation. Front Pediatr. (2017) 5:96. doi: 10.3389/fped.2017.00096
42. Suez J, Korem T, Zilberman-Schapira G, Segal E, Elinav E. Non-caloric artificial sweeteners and the microbiome: findings and challenges. Gut Microbes. (2015) 6:149–55. doi: 10.1080/19490976.2015.1017700
43. Chassaing B, Koren O, Goodrich JK, Poole AC, Srinivasan S, Ley RE, et al. Dietary emulsifiers impact the mouse gut microbiota promoting colitis and metabolic syndrome. Nature. (2015) 519:92–6. doi: 10.1038/nature14232
44. Buckley JP, Kim H, Wong E, Rebholz CM. Ultra-processed food consumption and exposure to phthalates and bisphenols in the US National Health and Nutrition Examination Survey, 2013-2014. Environ Int. (2019) 131:105057. doi: 10.1016/j.envint.2019.105057
45. Cimmino I, Fiory F, Perruolo G, Miele C, Beguinot F, Formisano P, et al. Potential Mechanisms of Bisphenol a (Bpa) contributing to human disease. Int J Mol Sci. (2020) 21:5761. doi: 10.3390/ijms21165761
46. Vafeiadi M, Myridakis A, Roumeliotaki T, Margetaki K, Chalkiadaki G, Dermitzaki E, et al. Association of early life exposure to phthalates with obesity and cardiometabolic traits in childhood: sex specific associations. Front Public Health. (2018) 6:327. doi: 10.3389/fpubh.2018.00327
47. Kyriazis GA, Soundarapandian MM, Tyrberg B. Sweet taste receptor signaling in beta cells mediates fructose-induced potentiation of glucose-stimulated insulin secretion. Proc Natl Acad Sci U S A. (2012) 109:E524–32. doi: 10.1073/pnas.1115183109
48. Roca-Saavedra P, Mendez-Vilabrille V, Miranda JM, Nebot C, Cardelle-Cobas A, Franco CM, et al. Food additives, contaminants and other minor components: effects on human gut microbiota-a review. J Physiol Biochem. (2018) 74:69–83. doi: 10.1007/s13105-017-0564-2
49. Bhattacharyya S, O-Sullivan I, Katyal S, Unterman T, Tobacman JK. Exposure to the common food additive carrageenan leads to glucose intolerance, insulin resistance and inhibition of insulin signalling in Hepg2 cells and C57bl/6j Mice. Diabetologia. (2012) 55:194–203. doi: 10.1007/s00125-011-2333-z
50. Bhattacharyya S, Feferman L, Tobacman JK. Carrageenan Inhibits Insulin Signaling through Grb10-Mediated Decrease in Tyr(P)-Irs1 and through Inflammation-Induced Increase in Ser(P)307-Irs1. J Biol Chem. (2015) 290:10764–74. doi: 10.1074/jbc.M114.630053
51. Kahn SE, Hull RL, Utzschneider KM. Mechanisms Linking Obesity to Insulin Resistance and Type 2 Diabetes. Nature. (2006) 444:840–6. doi: 10.1038/nature05482
52. Mozaffarian D, Katan MB, Ascherio A, Stampfer MJ, Willett WC. Trans fatty acids and cardiovascular disease. N Engl J Med. (2006) 354:1601–13. doi: 10.1056/NEJMra054035
53. Thompson AK, Minihane AM, Williams CM. Trans fatty acids and weight gain. Int J Obes (Lond). (2011) 35:315–24. doi: 10.1038/ijo.2010.141
54. Dorfman SE, Laurent D, Gounarides JS, Li X, Mullarkey TL, Rocheford EC, et al. Metabolic Implications of Dietary Trans-Fatty Acids. Obesity (Silver Spring). (2009) 17:1200–7. doi: 10.1038/oby.2008.662
Keywords: ultra-processed food, cardiovascular diseases, obesity, overweight, cardiometabolic risk
Citation: Hosseininasab D, Shiraseb F, Noori S, Jamili S, Mazaheri-Eftekhar F, Dehghan M, da Silva A, Bressan J and Mirzaei K (2022) The relationship between ultra-processed food intake and cardiometabolic risk factors in overweight and obese women: A cross-sectional study. Front. Nutr. 9:945591. doi: 10.3389/fnut.2022.945591
Received: 16 May 2022; Accepted: 29 June 2022;
Published: 09 August 2022.
Edited by:
Mainul Haque, National Defence University of Malaysia, MalaysiaReviewed by:
Iffat Jahan, Eastern Medical College and Hospital, BangladeshSusmita Sinha, Khulna City Medical College and Hospital, Bangladesh
Copyright © 2022 Hosseininasab, Shiraseb, Noori, Jamili, Mazaheri-Eftekhar, Dehghan, da Silva, Bressan and Mirzaei. This is an open-access article distributed under the terms of the Creative Commons Attribution License (CC BY). The use, distribution or reproduction in other forums is permitted, provided the original author(s) and the copyright owner(s) are credited and that the original publication in this journal is cited, in accordance with accepted academic practice. No use, distribution or reproduction is permitted which does not comply with these terms.
*Correspondence: Khadijeh Mirzaei, mirzaei_kh@tums.ac.ir; mirzaei_kh@sina.tums.ac.ir