Association between dietary caffeine, coffee, and tea consumption and depressive symptoms in adults: A systematic review and dose-response meta-analysis of observational studies
 Kimia Torabynasab1,2
  Hossein Shahinfar
 Shima Jazayeri
- 1Student Research Committee, Iran University of Medical Sciences, Tehran, Iran
- 2Department of Nutrition, School of Public Health, Iran University of Medical Sciences, Tehran, Iran
- 3Department of Community Nutrition, School of Nutritional Sciences and Dietetics, Tehran University of Medical Sciences (TUMS), Tehran, Iran
Background: Recent studies have reported an association between dietary caffeine intake (coffee and tea) and the presence of depressive symptoms. However, the findings are not conclusive.
Purpose: This study aimed to examine the correlation between the consumption of dietary caffeine (coffee and tea) and the presence of depressive symptoms in adults.
Methods: PubMed and Scopus databases were searched until December 2021. Two investigators analyzed data from identified studies and rated the quality of the evidence using the GRADE approach. Using the random-effects models, we estimated the relative risks (RRs) and 95% confidence intervals (CIs). We also modeled the dose-response associations through a one-stage, weighted mixed-effects meta-analysis.
Results: A total of 29 eligible studies included a total of 422,586 participants. On comparing the highest with the lowest category in cohort studies, we identified an inverse association between the intake of coffee and depressive symptoms (RR: 0.89, 95%CI: 0.82–0.95; I2 = 63.7%, GRADE = low). There was a 4% reduction in the risk of depression associated with an increase in coffee intake of 240 ml/day (RR: 0.96, 95%CI: 0.95, 0.98; I2 = 22.7%). By comparing the highest category with the lowest category in cohort studies, we discovered that caffeine intake was inversely associated with depressive symptoms (RR: 0.86, 95%CI: 0.79, 0.93; I2 = 0.0%, GRADE = moderate). Based on our data analysis, no correlation exists between tea consumption and depressive symptoms.
Conclusion: According to our findings, coffee and dietary caffeine may have a protective effect against the development of depression. However, no evidence suggesting a link between tea consumption and reduced depressive symptoms has been found. Therefore, further longitudinal studies are needed to substantiate the causal relationship between coffee, tea, and caffeine and the risk of depression.
1. Introduction
As a leading cause of disability, depression has received considerable attention as a common mental disorder. The prevalence of depression has progressively increased in recent years, making it a public health concern throughout the world. According to a study by Our Word in Data, approximately 3.4% (with a margin of error of 2–6%) of the global population suffers from depression (1).
There are some strong associations between lifestyle factors and depression. Several studies suggest that an unhealthy lifestyle, including poor dietary patterns, alcohol consumption, and a sedentary lifestyle, substantially leads to the risk of depression (2–7). Other studies also demonstrated that obesity and depression have a bidirectional relationship, suggesting that depression can contribute to the development of obesity and that obesity can exacerbate the symptoms of depression (8). It was also indicated that inflammation and oxidation have a fundamental role in depression pathophysiology (9), and subsequently, attention was paid to anti-inflammatory compounds and antioxidant-rich foods as depression relievers. Studies conducted to examine the relationship between anti-inflammatory compounds and antioxidant-rich foods supported the mentioned hypothesis by exploring the effect of Mediterranean or plant-based dietary patterns on the risk of developing depression, as it resulted in a significant reduction (10–12). It is worth considering that a recent systematic review had also revealed evidence in support of the aforementioned studies showing that depression is negatively correlated with high adherence to diet recommendations, including avoiding processed foods, eating an anti-inflammatory diet, consuming magnesium and folic acid various fatty acids, and consuming fish (13).
Coffee and tea are among the most popular beverages in the world, and they are common sources of caffeine (14). It is suggested that caffeine is related to depression as it modulates dopaminergic transmission and facilitates serotonin release (15, 16). In addition to caffeine, there are some anti-inflammatory and antioxidant compounds in coffee, such as chlorogenic acid and catechins, which demonstrate potential beneficial effects against depression. In addition to caffeine, tea contains neuroprotective compounds such as L-theanine and polyphenols (17–19). A recent study also illustrated that during the COVID-19 pandemic, tea consumption increased (70 vs. 30%), effectively improving mood, focus, and performance and, as a result, relieving stress; this improvement is believed to be due to the presence of the compounds theanine and caffeine in tea (20).
Therefore, we performed a systematic review of observational studies to examine the correlation and the dose-response relationship between depression risk and the intake of coffee, tea, and caffeine.
2. Methods
2.1. Protocol and registration
We followed the Preferred Reporting Items for Systematic Reviews and Meta-Analyses (PRISMA-2020) guideline when we submitted this meta-analysis (21), and the protocol of the systematic review was registered at PROSPERO (registration number: CRD42022298824).
2.2. Literature search and selection
This investigation was carried out in accordance with the PRISMA reporting guidelines for systematic reviews and meta-analyses. The databases of PubMed and Scopus were systematically searched for relevant studies published in the English language up to December 2021. All the terms relevant to coffee, tea, caffeine, depression, and study design were applied to detect potentially eligible studies (Supplementary Table 1). We also checked the reference lists of the included studies and manually reviewed other studies to ensure that we did not miss any relevant studies.
2.3. Eligibility criteria
The inclusion and exclusion criteria were defined by adhering to the PICOS (population, intervention/exposure, comparator, outcome, and study design) framework. The criteria for inclusion were as follows: (1) cross-sectional, case-control, or prospectively designed studies conducted in the general population aged 18 years or older; (2) evaluating the association between coffee, tea, or caffeine intake as exposure and depression as the outcome; (3) assessing and reporting hazard ratios (HRs) or odds ratios (ORs) and the corresponding 95% confidence interval (CI) for ≥2 quantitative categories of dietary coffee, tea, and caffeine intake. For dose-response meta-analyses, it was also necessary to consider the number of cases and non-cases in each category of dietary exposures and ranges of intake. Studies reporting continuous estimation from the associations were also eligible. Review studies, interventional studies, and studies focusing on children, adolescents (under 18 years of age), and pregnant and lactating women were excluded.
2.4. Data extraction
Two independent investigators (KT and HSH) extracted the following data from the identified studies: the first author's last name, year of publication, country, and region where the study was conducted, the percentage of women who participated in the study, the sample size (total number of participants and number of cases), the study design, follow-up years, the age range of the study population at baseline, coffee, tea, and caffeine intake categories, the ORs with their 95% CI for each category of coffee, tea, and caffeine intake, exposure and outcome assessment tools, and covariates adjusted for in the multivariable analysis. We extracted the ORs that reflect the greatest degree of adjustment for potential confounders.
2.5. Quality assessment
Following the Robins-I tool framework, we evaluated the quality of the included (22). All studies were evaluated for confounding, participant selection, exposure assessment, misclassification during follow up, missing data, measurement of the outcome, and selective reporting of the results. The mentioned domains were classified as having a low, moderate, or serious risk of bias due to their characteristics. Supplementary Table 2 provides information about the domains of the Robins-I tool and how the judgment was made for each domain.
2.6. Statistical analysis
In the present meta-analysis, a random-effects model was performed to estimate the RR and its 95% CI as the effect size (23). For studies reporting the effect size as the odds ratio or hazard ratio, we considered them to be equal to HR (24). In the first step, a meta-analysis was conducted to compare the risk ratios of caffeine, coffee, and tea consumption in primary studies based on high vs. low intake categories. Whenever there are sex-specific effect sizes, we used a fixed-effect model to combine the estimates and then applied the combined effect size to the analysis. Cochran's Q (25) and I2 statistics (26) were used to test for heterogeneity.
To identify potential sources of heterogeneity, subgroup analyses were conducted based on geography, follow-up duration, number of participants, and adjustments for main confounders such as energy intake, body mass index (BMI), smoking, drinking alcohol, and exercising. With at least ten primary studies available, we used Egger's test to determine the presence of publication bias (27) in addition to visually inspecting funnel plots (25). Additionally, we conducted a sensitivity analysis to assess the impact of individual studies on the overall estimate by excluding them one by one.
Based on the method presented by Greenland and colleagues, we also conducted a random-effect dose-response meta-analysis for studies whose data were sufficient for dose-response meta-analyses of depression for a specific amount of increase in coffee, caffeine, and tea consumption (28, 29). It was required to calculate the median point in each category, as well as the distribution of cases and person-years based on dietary caffeine, coffee, and tea. Our final approach was to perform a one-stage linear mixed-effects meta-analysis to clarify dose-response relationships (30). Based on Harrell's recommended percentiles of 10, 50, and 90%, we used restricted cubic splines with three knots to model the exposures (31). We combined the study-specific estimates by using a one-stage linear mixed effects meta-analysis to take into account correlations within each category of relative risks (30). As a result of this method, the study-specific slope lines were estimated in a single step and combined to obtain an overall average slope (28, 32). Due to the limited number of studies (n ≤ 2) included in the analysis, we used the best-fitting second-order fractional polynomial to model curvilinear associations (30). Statistical analyses were conducted using STATA version 16.0. A P-value of less than 0.05 was considered significant.
2.7. Grading the evidence
The quality of the evidence was assessed by two independent authors (HSH and KT) using the GRADE approach (33). This tool classifies evidence as strong, moderate, low, or very low quality. The evidence used in this study was classified as low quality, as it was based on observational studies such as prospective cohort studies and cross-sectional studies. Depending on pre-specified criteria, they can be downgraded or upgraded. Evidence that has been downgraded includes limitations of the study, inconsistency, indirectness, imprecision, and publication bias, whereas evidence that has been upgraded includes a significant degree of association, a dose-response gradient, and attenuation caused by plausible confounding. Disagreements were resolved with a consensus.
3. Results
A total of 1,348 studies were identified at baseline from databases (PubMed 295 and Scopus 1,053), and five articles were found through manual search. We removed 228 duplicate studies. Of the 1,125 remaining studies, 1,063 were excluded on the basis of title and abstract screening. Sixty-two articles were screened by reading their full text. Of those, 33 were excluded as 11 were review articles and 22 articles reported irrelevant outcomes. Ultimately, our systematic review ultimately included 29 studies that met the inclusion criteria established for this study. The process through which studies were selected and identified is summarized in Supplementary Figure 1.
3.1. Study characteristics
The study included a total of 422,586 participants, ranging in age from 18 to 97 years. Eligible studies were published between 2005 and 2021. Table 1 shows detailed information extracted from articles. Among them, five studies considered coffee consumption as the main variable, seven studies considered tea (39, 41, 42, 44, 49, 58, 61) or coffee (40, 45, 51, 53, 62) as the main variable, seven considered caffeine (35, 38, 54, 55, 63), and 10 studies considered coffee, tea, or caffeine altogether (34, 36, 37, 43, 46, 48–50, 52, 56, 57). In addition, twenty studies had a cross-sectional design (34–36, 38, 42, 43, 45, 48–52, 54–57, 61–64), seven studies were prospective cohorts (37, 39, 40, 44, 46, 53, 58), and two studies evaluated both cross-sectional and prospective data (44, 47). Depression was identified by validated depression questionnaires such as the Beck Depression Inventory (BDI) (34), the Geriatric Depression Scale (GDS) (36, 41, 50), the Center for Epidemiological Studies Depression Scale (CES-D) (39, 42–44, 56, 61, 64), the Patient Health Questionnaire (PHQ-9) (49, 51, 54, 55), the Hospital Anxiety and Depression Scale (HADS) (38, 62), the Depression Anxiety Stress Scale (DASS-21) (48), and the Minimum Data Set-based Depression Rating Scale (MDS-DRS) (63). In 21 studies, depression was assessed using standardized scales, while in other studies, varied methods were used, such as physician diagnosis (40, 46, 53), self-report of depression (40, 45, 46, 57), the International Classification of Diseases (ICD) criteria (37), the Diagnostic and Statistical Manual of Mental Disorders (DSM) criteria (35), the MINI (Mini-International Neuropsychiatry Interview) (47), and antidepressant use (40, 53). Coffee, tea, and caffeine intake were assessed with validated questionnaires such as the Food Frequency Questionnaire (FFQ) (40, 45, 46, 53, 57, 62), the 4-day food record (37), 24-hr recall (54, 55, 64), the Brief Dietary History Questionnaire (BDHQ) (43, 56), an interview or by asking participants (34–36, 38, 39, 42, 44, 47–52, 61, 63), and observation as well (58). Studies have been carried out in Finland (34, 37), Virginia (35), Japan (43, 56), the United Kingdom (38, 57), China (39, 42, 49, 50, 61), the United States (40, 46, 54, 55, 64), Japan (36, 57, 62), Taiwan (44), Korea, France (47), Tripoli (48), Atlantic Canada (51), Korea (45, 52), Navara (53), the Netherlands (57, 63), Germany (57), Spain, Singapore (41, 58), and Palestine (60). By gender, three studies included only women (39, 40, 56), and one study included only men (37), while 25 other studies included both genders (34–36, 38, 41–46, 48–52, 54, 55, 57, 58, 61–64).
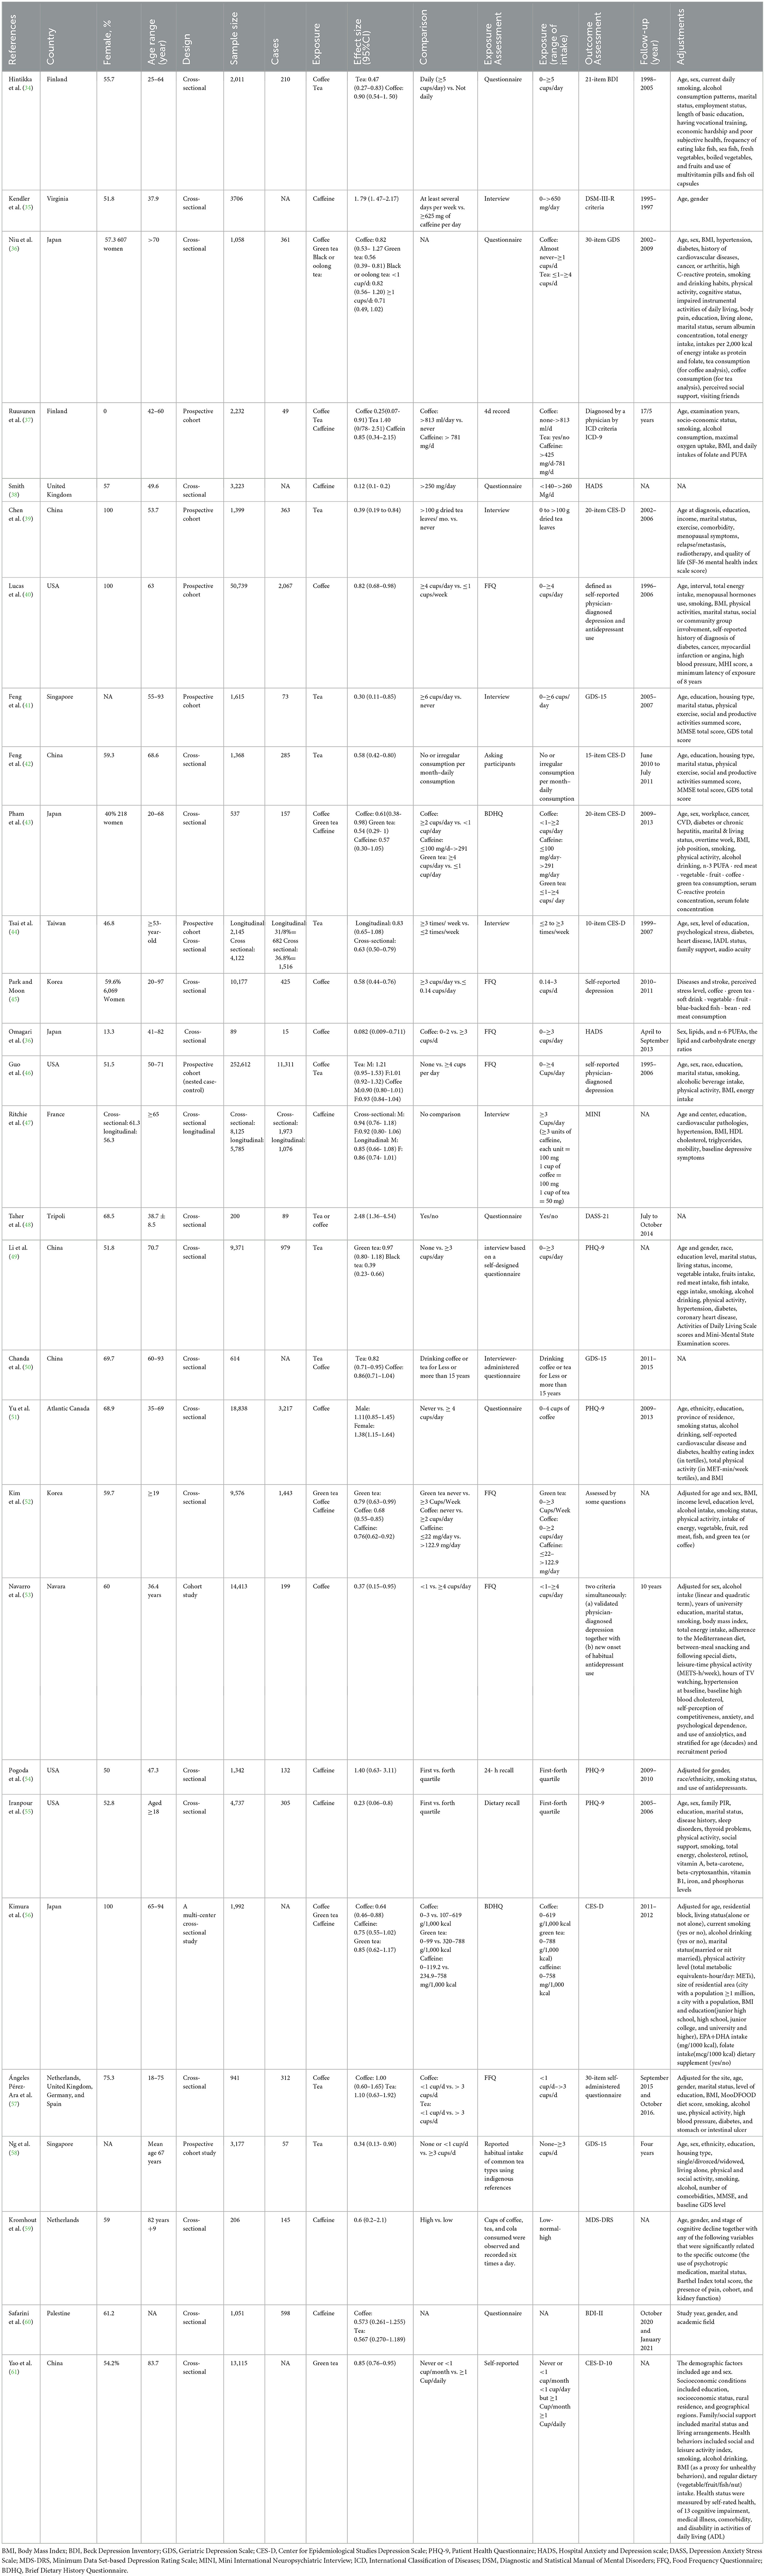
Table 1. Characteristics of included studies.
Due to confounding, four studies were rated to have a moderate risk of bias (36, 46, 52, 53), while the others were rated to have a serious risk of bias. Regarding the exposure assessment, 11 studies were classified as moderate risk (37, 43, 45, 46, 52, 53, 56, 57, 59, 62, 65), and others presented a serious risk of bias. For the selection of participants, seven studies were rated as having a moderate risk (43, 48, 53, 56, 57, 62, 65), two studies were rated as having a serious risk (59, 60), and others were rated as having a low risk of bias. Considering misclassifications during follow-up, almost all studies were classified as having a moderate risk of bias, while three studies were at low risk (47, 58, 65). Due to missing data, a moderate risk of bias was assessed in six studies (46, 47, 52, 53, 58, 65) and a low risk in the remaining studies. Two studies had serious outcome measurement bias (52, 65), while other studies were at moderate risk. All 29 studies were judged to be at low risk of bias due to selective reporting of results, and, ultimately, the overall judgment of two studies showed a moderate risk of bias (46, 53), while 27 were at serious risk (Table 2).
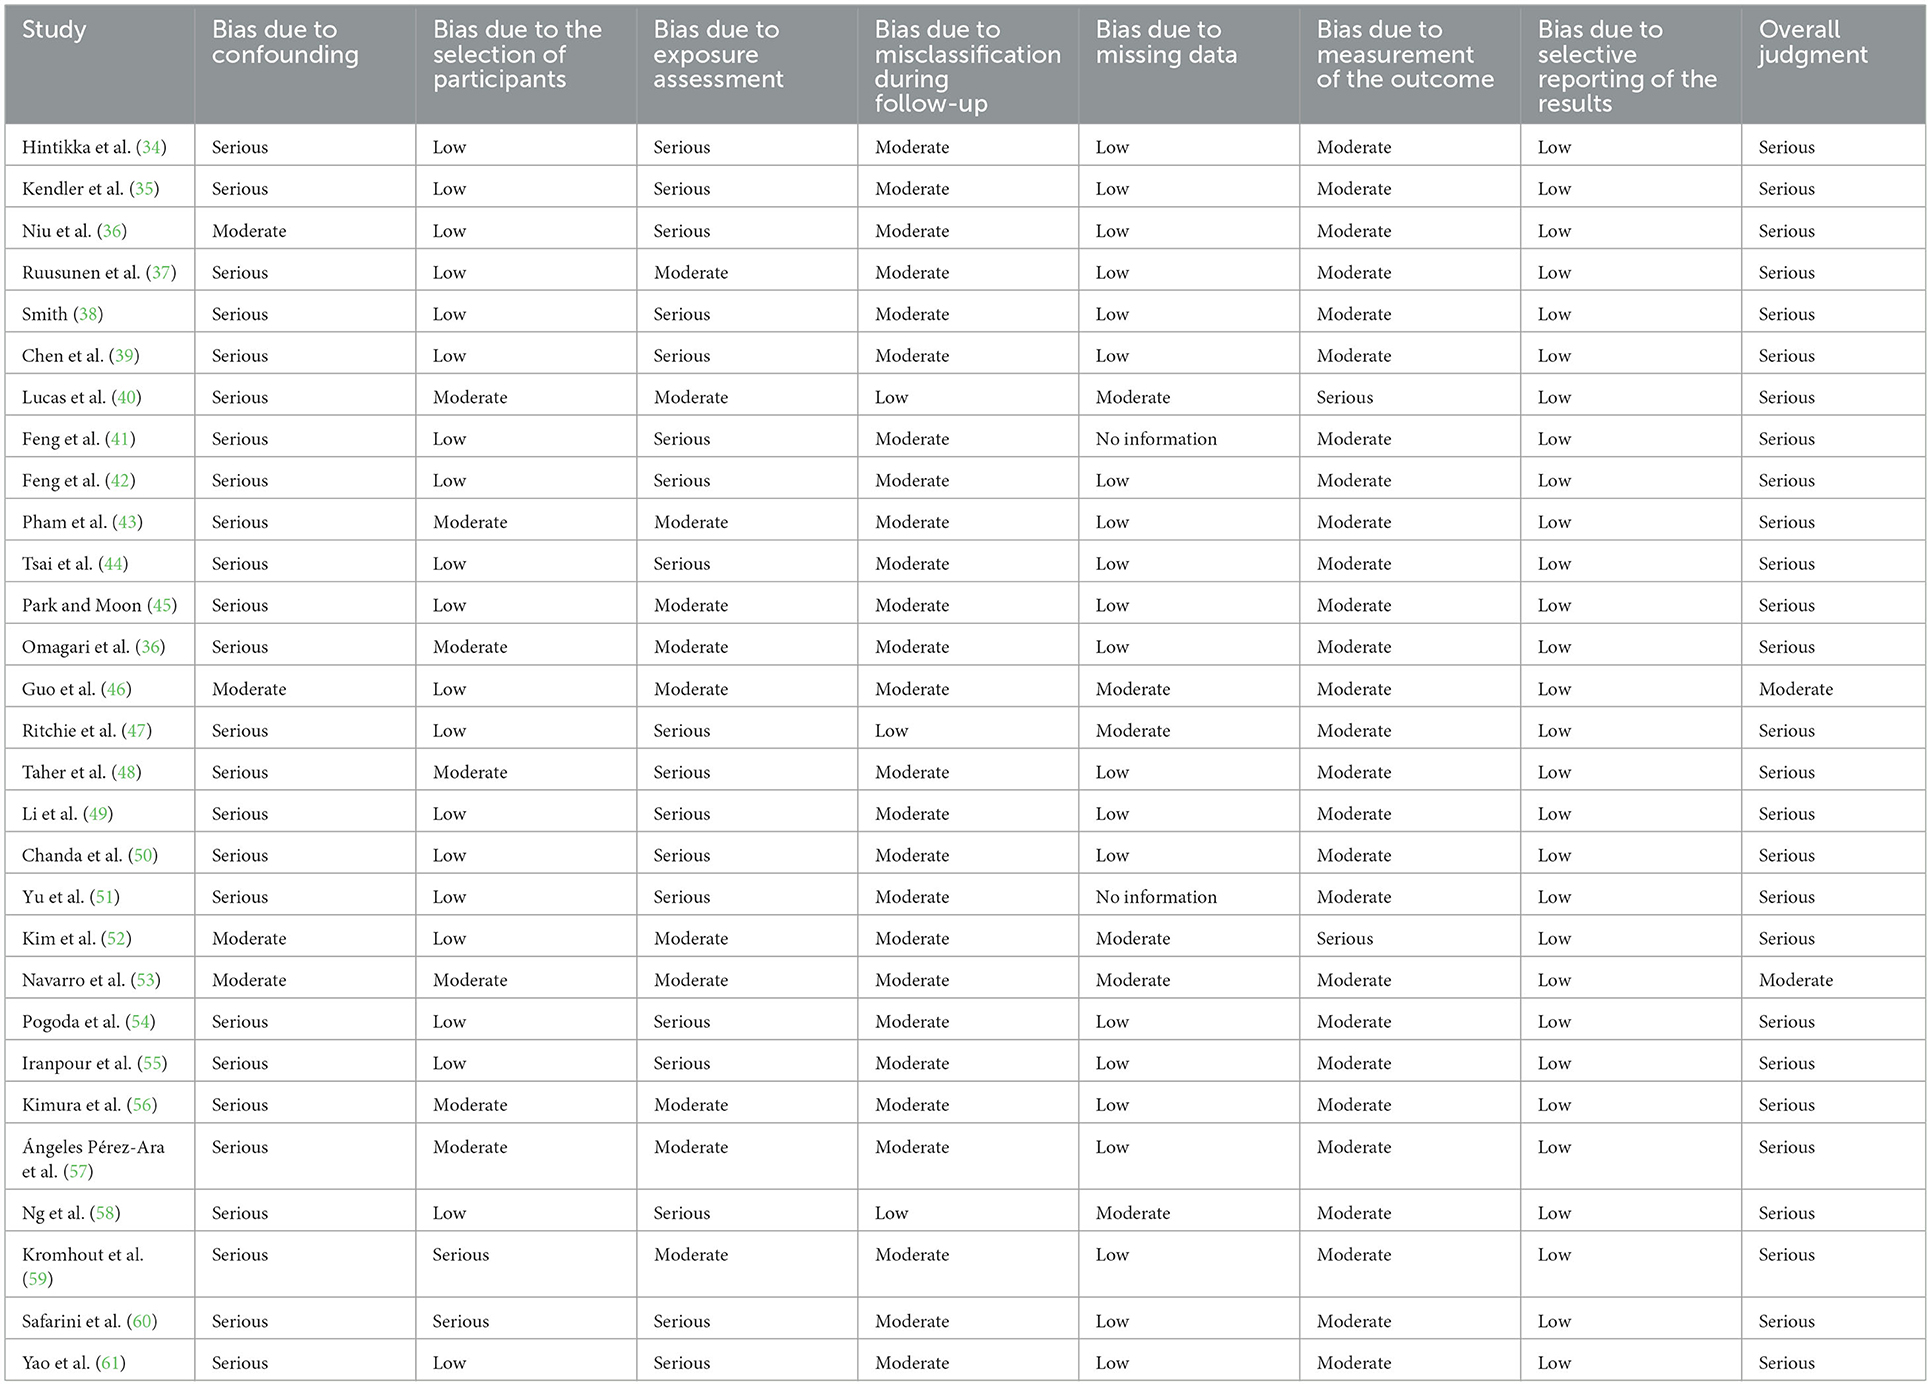
Table 2. ROBINS-I judgment for each domain and overall.
3.2. Association of coffee consumption with depression
Four cohort studies with a total of 319,996 participants and 13,583 cases reported information about coffee consumption and depressive symptoms (37, 46, 53, 65). Comparing the highest with the lowest category, there was an inverse association between intake of coffee and depressive symptoms (RR:0.89, 95% CI: 0.82–0.95; I2 = 63.7%, Pheterogeneity = 0.04; Figure 1). Four studies were eligible for the linear dose-response analysis (37, 46, 53, 65). An increase in coffee intake of 240 ml per day was associated with a 4% lower risk of developing depression (RR: 0.96, 95% CI: 0.95, 0.98; I2 = 22.7%, Pdose−response < 0.001) (Figure 2). We did not find a nonlinear association between coffee intake and depression risk (Pnon − linearity = 0.89) (Figure 2). Our subgroup analyses suggested that there were potential sources of heterogeneity based on geographical region, follow-up duration, and the number of participants (Supplementary Table 3). Based on a visual inspection of the funnel plot, we found some asymmetry (Supplementary Figure 2). Egger's regression test indicated possible publication bias (P = 0.001). Findings from other sensitivity analyses revealed that excluding any single study from the analysis did not appreciably alter the pooled effect sizes.
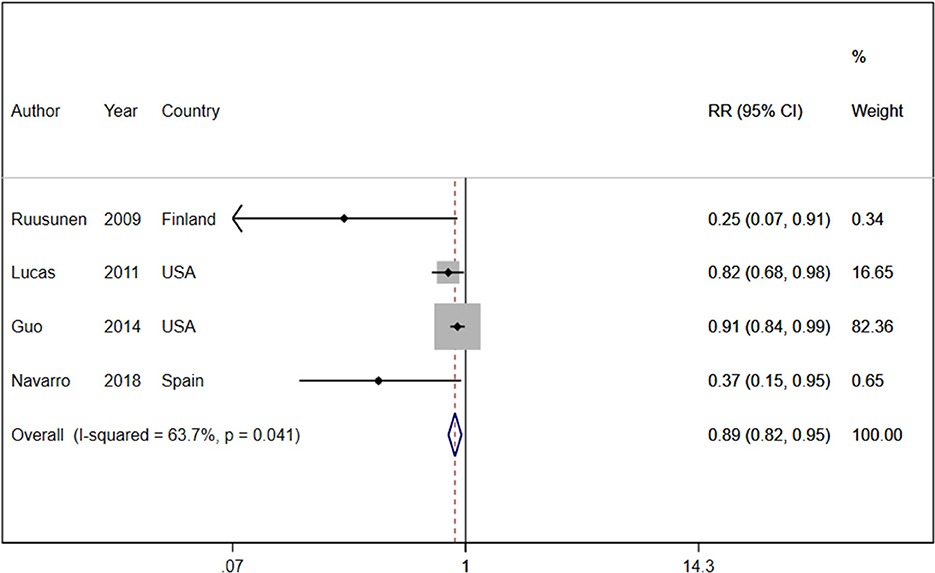
Figure 1. Relative risk of depressive symptoms for the highest compared with the lowest category of coffee intake. RR, relative risk.
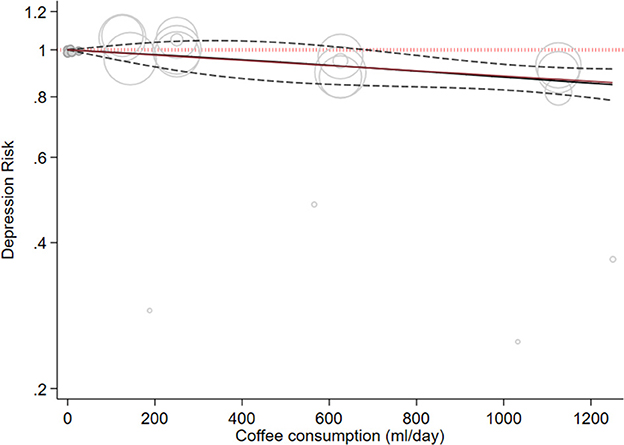
Figure 2. Dose-response association between coffee intake and depressive symptoms. The solid line represents a non-linear dose response, and the dotted lines represent a 95% confidence interval. Circles represent hazard ratio point estimates for coffee intake categories from each study with circle size proportional to the inverse of standard error.
Ten cross-sectional studies with a total of 45,883 participants reported information about coffee consumption and depressive symptoms (34, 36, 43, 45, 50, 51, 57, 62, 66, 67). Comparing the highest with the lowest category, coffee intake had an inverse association with depressive symptoms (RR: 0.78, 95% CI: 0.62, 0.98; I2 = 81.3%, Pheterogeneity = 0.001; Supplementary Figure 3). Our subgroup analyses showed heterogeneity based on geographical region, smoking status, physical activity, energy intake, alcohol consumption, and BMI (Supplementary Table 4).
3.3. Association of tea consumption with depression
Six cohort studies with a total of 263,180 participants and 12,471 cases reported information about tea consumption and depressive symptoms (37, 39, 41, 44, 46, 58). On comparing the highest category with the lowest category in random effects analysis, there was no significant inverse association between tea consumption and depressive symptoms (RR: 0.74, 95%CI: 0.51, 1.08; I2 = 77.6%, Pheterogeneity = 0.001; Figure 3). In the linear dose-response analysis of tea consumption and depression risk, based on four cohort studies, an increase in tea intake of 240 ml/day was not associated with the risk of depression (RR: 0.99, 95%CI: 0.97, 1.01; I2 = 58%). We did not find a dose-response association between tea consumption and the risk of depression (Pdose − response = 0.405) (Figure 4). There was no non-linear association between tea intake and the risk of depression (Pnon − linearity = 0.89) (Figure 4). Our subgroup analyses showed heterogeneity based on the BMI, alcohol consumption, geographical region, follow-up duration, number of participants, and smoking status. The subgroup analysis indicated a significant inverse association in studies conducted in Asia (RR: 0.73, 95%CI: 0.58, 0.92; I2 = 67%, n = 3) as well as a significant inverse association in studies that did not adjust for alcohol intake (RR: 0.77, 95%CI: 0.60, 0.98; I2 = 71%, n = 2), BMI (RR: 0.73, 95%CI: 0.58, 0.92; I2 = 67%, n = 3), or smoking (RR: 0.77, 95%CI: 0.60, 0.98; I2 = 71%, n = 2) (Supplementary Table 5). Based on the visual inspection of the funnel plot, we found asymmetry (Supplementary Figure 4); however, when we did Egger's regression tests, no significant publication bias was observed (P = 0.07). Upon excluding the study by Ruusunen et al. (37) from the analysis, there was a significant negative association between tea consumption and depression (RR: 0.64, 95% CI: 0.41–0.99).
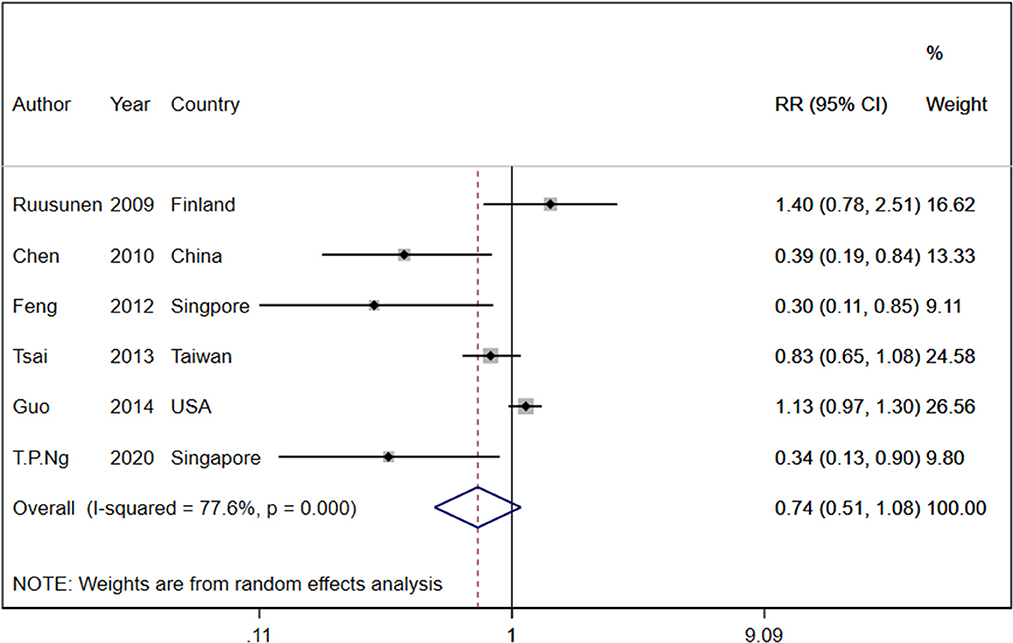
Figure 3. Relative risk of depressive symptoms for the highest compared with the lowest category of tea intake. RR, relative risk.
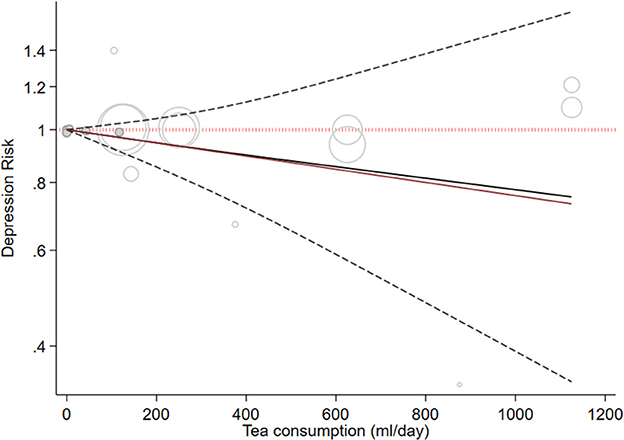
Figure 4. Dose-response association between tea intake and depressive symptoms. The solid line represents a non-linear dose response, and the dotted lines represent a 95% confidence interval. Circles represent hazard ratio point estimates for coffee intake categories from each study with circle size proportional to the inverse of standard error.
Twelve cross-sectional studies with a total of 47,882 participants reported information about tea consumption and depressive symptoms (34, 36, 42–44, 49, 50, 52, 56–58, 61). On comparing the highest category with the lowest category, total tea, green tea, and black tea consumption had an inverse association with depressive symptoms (RR:0.73, 95%CI: 0.65, 0.81; I2 = 61.0%, Pheterogeneity = 0.025, RR:0.84, 95%CI: 0.78, 0.90; I2 = 45.3%, Pheterogeneity = 0.103, RR:0.58, 95%CI: 0.43, 0.79; I2 = 70.1%, Pheterogeneity = 0.067; respectively Supplementary Figure 5). Our subgroup analyses showed heterogeneity based on the number of participants (Supplementary Table 6).
3.4. Association of caffeine consumption with depression
Two cohort studies with a total of 8,017 participants and 1,125 cases reported information about caffeine intake and depressive symptoms (37, 47). On comparing the highest category with the lowest category, caffeine intake was inversely associated with depressive symptoms (RR: 0.86, 95%CI: 0.79, 0.93; I2 = 0.0%, Pheterogeneity = 0.980; Figure 5). One cohort study was eligible for dose-response analysis (37). An increase in caffeine intake of 200 mg/day was not associated with the risk of depression (RR: 1.05, 95%CI: 0.80, 1.36; I2 = 0%). A non-linear dose-response meta-analysis performed on one cohort study indicated a non-statistically significant increasing association with intake of 200–600 mg of caffeine (Pdose − response = 0.163 Figure 6) and an inverse association with higher intake (Pdose − response = 0.18, Figure 6); however, there was a nonlinear association (Pnon − linearity = 0.01 Figure 6).
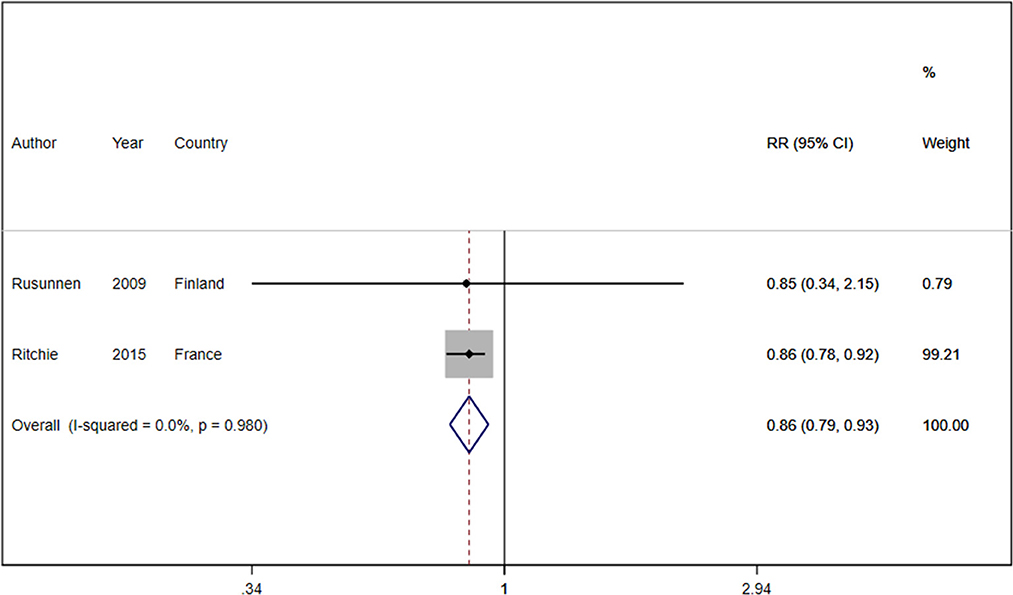
Figure 5. Relative risk of depressive symptoms for the highest compared with the lowest category of caffeine intake. RR, relative risk.
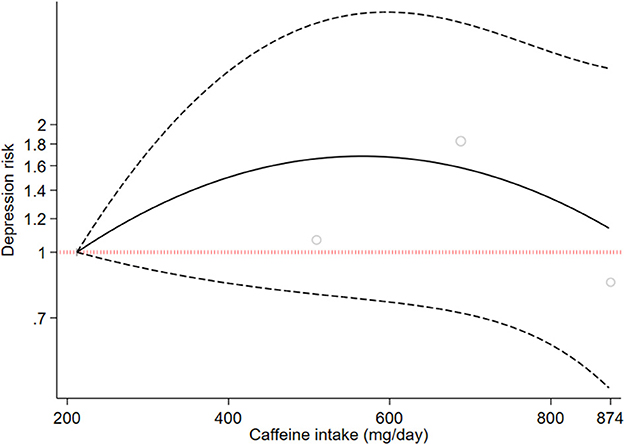
Figure 6. Dose-response association between caffeine intake and depressive symptoms. The solid line represents a non-linear dose response, and the dotted lines represent a 95% confidence interval. Circles represent hazard ratio point estimates for coffee intake categories from each study with circle size proportional to the inverse of standard error.
Ten cross-sectional studies with a total of 34,495 participants reported information about caffeine intake and depressive symptoms (35, 38, 43, 47, 52, 54–56, 59). Comparing the highest with the lowest category, caffeine intake did not have an inverse association with depressive symptoms (RR: 0.64, 95% CI: 0.40, 1.01; I2 = 95.3%, Pheterogeneity < 0.001; Supplementary Figure 6). Based on a visual inspection of the funnel plot, we found some asymmetry (Supplementary Figure 7); however, when we did Egger's regression tests, no significant publication bias was observed (P = 0.34). The overall effect size depended on the studies of Kendler et al. (35) and Pogoda et al. (54). By excluding these studies, a significant negative association was found between caffeine and depression risk (RR: 0.55, 95% CI: 0.34–0.88, RR: 0.58, 95%CI: 0.36–0.95, respectively).
3.5. Grading the evidence
We applied the GRADE tool to make a judgment on the quality of the evidence. The quality of evidence was rated low for coffee intake due to devaluations for risk of bias and inconsistency, very low for tea intake due to downgrades for risk of bias, inconsistency, and imprecision, and moderate for dietary caffeine intake associated with downgrades for risk of bias (Supplementary Table 7).
4. Discussion
Our systematic review and dose-response meta-analysis of observational studies revealed that a higher intake of caffeine, coffee, and tea was inversely associated with the risk of depressive symptoms. Higher coffee consumption was associated with an 11 and 22% lower risk of depressive symptoms in the cohort and cross-sectional studies, respectively, and there was also a significant linear dose-response relationship. When we compared higher tea consumption to lower consumption in cohort studies, we found that the risk of depressive symptoms was reduced by 26%, and this inverse association was replicated in cross-sectional studies; however, we did not find a dose-response association. An analysis of cohort and cross-sectional study results investigating the association between caffeine intake and the risk of depressive symptoms found that a higher caffeine intake was associated with a 14 and 13% lower risk of depressive symptoms, respectively.
These results provide supportive evidence consistent with the findings of previous meta-analyses of observational studies examining the association between coffee, tea consumption, and depression. Grosso et al. suggested that coffee and tea consumption act as protective factors for depression. It was noted that the caffeine content may account for some of the beneficial effects, but this does not fully explain the established relationship (68). Kang et al. also showed quantitative evidence for the inverse association between high coffee and tea consumption and the risk of developing depression but concluded that it is difficult to determine the causality of this association because of the observational design of the studies and insufficient prospective studies for this topic (69). Regarding the association between coffee and caffeine consumption and depression, Wang et al. conducted a meta-analysis of observational studies and also identified a strong inverse association (70). Dong et al. also performed a meta-analysis of observational studies focusing on the relationship between tea consumption and depression, which led to the identification of tea as a potential preventive factor against depression (71). A recent study by Fisicaro et al. (72) found that higher mocha coffee consumption was associated with a higher level of psycho-cognitive functioning in elderly non-smokers in Italy with chronic subcortical ischaemic vascular disease (SIVD) and cognitive profile of mild vascular cognitive impairment (mVCI). This finding is consistent with previous findings and further supports the fact that coffee has positive effects on the cognitive process as well (72).
Moreover, the results of some studies are inconsistent with the results of the present meta-analysis. In the study conducted by Kendler et al., it was shown that caffeine consumption by people who are highly vulnerable to caffeine dependence may make them more prone to chronic symptoms of anxiety and depression (35). A meta-analysis by Pogoda et al. did not report caffeine to be protective against depression (54). Jee et al. (73) showed that the beneficial and/or harmful effects of caffeine on several neurological and psychiatric disorders may differ depending on gender. Women may be more likely to experience a reduction in stroke risk with caffeine consumption. However, caffeine consumption may also increase the risk of sleep disorders for both sexes equally. A greater reduction in dementia risk was also observed in women than in men, according to a review. However, caffeine had a greater protective effect against Parkinson's disease in men than in women (73). A cohort study on 3,323 students aged 11 to 17 years found that the impact of caffeine on anxiety varied between sexes, with no significant effects observed in girls, while in boys, caffeine consumption was associated with an increase in anxiety levels (73, 74). Different kinds of disease, different disease types, and different dosages of caffeine or different kinds of tea or coffee may be the reasons for these contradictions. Therefore, further research is needed to expand the existing knowledge in this field.
The mechanisms underlying the inverse association between the consumption of caffeine (coffee and tea) and the risk of developing depression are not yet fully determined; however, some possible biological explanations have been suggested. The first favorable effect can be mediated by caffeine. Caffeine stimulates the central nervous system since it is a non-specific adenosine A1/A2A receptor antagonist, generating psychostimulant effects through modulating dopaminergic transmission by increasing calcium signaling (15, 75, 76). Caffeine metabolites have an effect on adenosine receptors in the brain, which helps to alleviate depression (76). The second important mechanism that had been suggested to play a protective role against depression is related to a complex mixture of chemicals with anti-inflammatory activities. It is common knowledge that the pathophysiology of depression is correlated with low-grade inflammation and oxidative stress dysregulation (9, 77–79). Specific phenolic compounds in coffee, called chlorogenic acid and caffeic acid, play an anti-inflammatory and antioxidant role, leading to the reduction of oxidative stress (Supplementary Figure 8) (80–82).
Tea shares similar effects as it is the main source of polyphenols, particularly catechins. Epigallocatechin gallate (EGCG) is known to be the most potent tea component, counteracting depression through powerful antioxidant activity (17). Another antidepressant measure taken by EGCG is monoamine oxidase (MAO) inhibition, leading to a higher dopamine and serotonin concentration in the brain (83, 84). In addition to the properties mentioned, some studies demonstrated a probable antidepressant effect of EGCG via an increase in brain-derived neurotrophic factor, neuronal survival, and plasticity (83). The benefits of tea are not only related to its caffeine and polyphenol content. Theanine, the main amino acid found in the tea has beneficial effects against depression by increasing serotonin and dopamine in the brain, which are considered to be two key neurotransmitters in the etiology of depression (Supplementary Figure 8) (18, 19).
The strengths of our study deserve consideration. First, we applied the best-fitting second-order fractional polynomial to model curvilinear associations when restricted cubic splines could not be calculated because of the limited number of studies (n ≤ 2) included in the analyses. Second, we also considered all studies carried out from 2015 to 2021, including 12 cross-sectional studies and two prospective cohort studies in our analysis, which were not considered in previous systematic reviews and meta-analyses. Finally, the GRADE system was applied to rate the overall quality of the evidence.
Our study also has some potential limitations. The current study is based on observational studies with potentially unknown confounders that affect estimates of effects, but most studies were adjusted for potential confounders such as age, gender, health status, dietary intake, smoking status, physical activity, and socioeconomic conditions. Nonetheless, unmeasured confounders might have biased evaluations and results, such as family or social support. Due to the cross-sectional design, we cannot ensure whether caffeine, coffee, and tea consumption have reduced the risk of developing depression or whether individuals with depression symptoms consume less than non-depressed individuals. Various methods have been used to measure caffeine, tea, and coffee consumption (e.g., grams, cups, and times). Regarding depression assessment, a variety of instruments were used, from specific questionnaires to patient reports.
5. Conclusion
In summary, our results suggest that consuming coffee, tea, and dietary caffeine may have protective effects against depression and may lower the risk of developing depression. However, it is crucial to conduct well-designed prospective studies using harmonized tools in the future for both exposure and outcome assessments.
Data availability statement
The data analyzed in this study is subject to the following licenses/restrictions: The datasets generated or analyzed during the current study are not publicly available but are available from the corresponding author on reasonable request. Requests to access these datasets should be directed to SJ, jazayeri.sh@iums.ac.ir.
Ethics statement
This research was conducted in accordance with the Research Ethics Committees of the Iran University of Medical Sciences (Ethics No. IR.IUMS.REC.1401.814).
Author contributions
KT and HS designed the project, performed the literature search, and wrote the first draft of the manuscript. HS analyzed the data and interpreted the results. KT, NP, and SJ revised the subsequent drafts for important intellectual content. SJ was the guarantor. All authors read and approved the final version of the manuscript.
Funding
This study was supported by the Student Research Committee of the Iran University of Medical Sciences (Grant No: 24730).
Conflict of interest
The authors declare that the research was conducted in the absence of any commercial or financial relationships that could be construed as a potential conflict of interest.
Publisher's note
All claims expressed in this article are solely those of the authors and do not necessarily represent those of their affiliated organizations, or those of the publisher, the editors and the reviewers. Any product that may be evaluated in this article, or claim that may be made by its manufacturer, is not guaranteed or endorsed by the publisher.
Supplementary material
The Supplementary Material for this article can be found online at: https://www.frontiersin.org/articles/10.3389/fnut.2023.1051444/full#supplementary-material
References
1. Saloni Dattani, H.R.a.M.R. Mental Health. (2021). Available online at: https://ourworldindata.org/mental-health
2. Krogh J, Nordentoft M, Sterne JAC, Lawlor DA. The effect of exercise in clinically depressed adults: systematic review and meta-analysis of randomized controlled trials. J Clin Psychiatry. (2010) 71:5500. doi: 10.4088/JCP.08r04913blu
3. Zhai L, Zhang Y, Zhang D. Sedentary behaviour and the risk of depression: a meta-analysis. Br J Sports Med. (2015) 49:705–709. doi: 10.1136/bjsports-2014-093613
4. Breslau N, Peterson EL, Schultz LR, Chilcoat HD, Andreski P. Major depression and stages of smoking: A longitudinal investigation. Arch Gen Psychiatry. (1998) 55:161–6. doi: 10.1001/archpsyc.55.2.161
5. Wang P-W, Lin H-C, Yeh Y-C, Liu T-L, Yen C-F. The relation of substance use with different levels of depressive symptoms and the moderating effect of sex and age in Taiwanese adolescents. Compr Psychiatry. (2012) 53:1013–20. doi: 10.1016/j.comppsych.2012.02.010
6. Li Y, Lv MR, Wei YJ, Sun L, Zhang JX, Zhang HG Li B. Dietary patterns and depression risk: a meta-analysis. Psychiatry Res. (2017) 253:373–82. doi: 10.1016/j.psychres.2017.04.020
7. Lopez-Garcia E, Schulze MB, Fung TT, Meigs JB, Rifai N, Manson JE, et al. Major dietary patterns are related to plasma concentrations of markers of inflammation and endothelial dysfunction. Am J Clin Nutr. (2004) 80:1029–35. doi: 10.1093/ajcn/80.4.1029
8. Luppino FS, de Wit LM, Bouvy PF, Stijnen T, Cuijpers P, Penninx BWJH, et al. Overweight, obesity, and depression: a systematic review and meta-analysis of longitudinal studies. Arch Gen Psychiatry. (2010) 67:220–9. doi: 10.1001/archgenpsychiatry.2010.2
9. Behr GA, Moreira JC, Frey BN. Preclinical and clinical evidence of antioxidant effects of antidepressant agents: implications for the pathophysiology of major depressive disorder. Oxidat Med Cell Longev. (2012) 2012:609421. doi: 10.1155/2012/609421
10. Lai JS, Hiles S, Bisquera A, Hure AJ, McEvoy M, Attia J, et al. systematic review and meta-analysis of dietary patterns and depression in community-dwelling adults. Am J Clin Nutr. (2014) 99:181–97. doi: 10.3945/ajcn.113.069880
11. Rahe C, Unrath M, Berger K. Dietary patterns and the risk of depression in adults: a systematic review of observational studies. Eur J Nutr. (2014) 53:997–1013. doi: 10.1007/s00394-014-0652-9
12. Murakami K, Sasaki S. Dietary intake and depressive symptoms: a systematic review of observational studies. Molec Nutr Food Res. (2010) 54:471–488. doi: 10.1002/mnfr.200900157
13. Ljungberg T, Bondza E, Lethin C. Evidence of the importance of dietary habits regarding depressive symptoms and depression. Int J Environ Res Public Health. (2020) 17:1616. doi: 10.3390/ijerph17051616
14. Popkin BM, Armstrong LE, Bray GM, Caballero B, Frei B, Willett WC, et al. new proposed guidance system for beverage consumption in the United States. Am J Clin Nutr. (2006) 83:529–42. doi: 10.1093/ajcn.83.3.529
15. Kaasinen V, Aalto S, Någren K, Rinne JO. Dopaminergic effects of caffeine in the human striatum and thalamus. Neuroreport. (2004) 15:281–5. doi: 10.1097/00001756-200402090-00014
16. Godos J, Pluchinotta FR, Marventano S, Buscemi S, Volti GL, Galvano F, et al. Coffee components and cardiovascular risk: beneficial and detrimental effects. Int J Food Sci Nutr. (2014) 65:925–36. doi: 10.3109/09637486.2014.940287
17. Zhu W-L, Shi H-S, Wei Y-M, Wang S-J, Sun C-Y, Ding Z-B, et al. Green tea polyphenols produce antidepressant-like effects in adult mice. Pharmacol Res. (2012) 65:74–80. doi: 10.1016/j.phrs.2011.09.007
18. Kimura K, Ozeki M, Juneja LR, Ohira H. L-Theanine reduces psychological and physiological stress responses. Biol Psychol. (2007) 74:39–45. doi: 10.1016/j.biopsycho.2006.06.006
19. Nagasawa K, Aoki H, Yasuda E, Nagai K, Shimohama S, Fujimoto S. Possible involvement of group I mGluRs in neuroprotective effect of theanine. Biochem Biophys Res Commun. (2004) 320:116–22. doi: 10.1016/j.bbrc.2004.05.143
20. Castellana F, De Nucci S, De Pergola G, Di Chito M, Lisco G, Triggiani V, et al. Trends in coffee and tea consumption during the COVID-19 pandemic. Foods. (2021) 10:2458. doi: 10.3390/foods10102458
21. Page MJ, McKenzie JE, Bossuyt PM, Boutron I, Hoffmann TC, Mulrow CD, et al. The PRISMA 2020 statement: an updated guideline for reporting systematic reviews. Bmj. (2021) 372:n71. doi: 10.1136/bmj.n71
22. Sterne JA, Hernán MA, Reeves BC, Savović J, Berkman ND, Viswanathan M, et al. ROBINS-I: a tool for assessing risk of bias in non-randomised studies of interventions. Bmj. (2016) 355:i4919. doi: 10.1136/bmj.i4919
23. DerSimonian R, Laird N. Meta-analysis in clinical trials. Contr Clin Trials. (1986) 7:177–188. doi: 10.1016/0197-2456(86)90046-2
24. Symons M, Moore D. Hazard rate ratio and prospective epidemiological studies. J Clin Epidemiol. (2002). 55:893–899. doi: 10.1016/S0895-4356(02)00443-2
25. Cumpston M, Li T, Page MJ, Chandler J, Welch VA, Higgins JP, et al. Cochrane Handbook for Systematic Reviews of Interventions. London: John Wiley & Sons. (2019).
26. Higgins JP, Thompson SG. Quantifying heterogeneity in a meta-analysis. Stat Med. (2002) 21:1539–1558. doi: 10.1002/sim.1186
27. Irwig L, Macaskill P, Berry G, Glasziou P. Bias in meta-analysis detected by a simple, graphical test. BMJ. (1997) 315:629–34. doi: 10.1136/bmj.315.7109.629
28. Greenland S, Longnecker MP. Methods for trend estimation from summarized dose-response data, with applications to meta-analysis. Am J Epidemiol. (1992) 135:1301–1309. doi: 10.1093/oxfordjournals.aje.a116237
29. Orsini N, Bellocco R, Greenland S. Generalized least squares for trend estimation of summarized dose–response data. The Stata J. (2006) 6:40–57. doi: 10.1177/1536867X0600600103
30. Crippa A, Discacciati A, Bottai M, Spiegelman D, Orsini N. One-stage dose–response meta-analysis for aggregated data. Stat Methods Med Res. (2019) 28:1579–96. doi: 10.1177/0962280218773122
31. Harrell FE. Regression Modeling Strategies: With Applications to Linear Models, Logistic and Ordinal Regression, and Survival Analysis. New York: Springer. (2015). doi: 10.1007/978-3-319-19425-7
32. Orsini N, Li R, Wolk A, Khudyakov P, Spiegelman D. Meta-analysis for linear and nonlinear dose-response relations: examples, an evaluation of approximations, and software. Am J Epidemiol. (2012) 175:66–73. doi: 10.1093/aje/kwr265
33. Guyatt GH, Oxman AD, Vist GE, Kunz R, Falck-Ytter Y, Alonso-Coello P, et al. GRADE: an emerging consensus on rating quality of evidence and strength of recommendations. BMJ. (2008) 336:924–6. doi: 10.1136/bmj.39489.470347.AD
34. Hintikka J, Tolmunen T, Honkalampi K, Haatainen K, Koivumaa-Honkanen H, Tanskanen A, et al. Daily tea drinking is associated with a low level of depressive symptoms in the Finnish general population. Eur J Epidemiol. (2005) 20:359–63. doi: 10.1007/s10654-005-0148-2
35. Kendler KS, Myers J, Gardner CO. Caffeine intake, toxicity and dependence and lifetime risk for psychiatric and substance use disorders: an epidemiologic and co-twin control analysis. Psychol Med. (2006) 36:1717–25. doi: 10.1017/S0033291706008622
36. Niu K, Hozawa A, Kuriyama S, Ebihara S, Guo H, Nakaya N, et al. Green tea consumption is associated with depressive symptoms in the elderly. Am J Clin Nutr. (2009) 90:1615–22. doi: 10.3945/ajcn.2009.28216
37. Ruusunen A, Lehto SM, Tolmunen T, Mursu J, Kaplan GA, Voutilainen S. Coffee, tea and caffeine intake and the risk of severe depression in middle-aged Finnish men: the Kuopio Ischaemic Heart Disease Risk Factor Study. Public Health Nutr. (2010) 13:1215–20. doi: 10.1017/S1368980010000509
38. Smith AP. Caffeine cognitive failures and health in a non-working community sample. Human Psychopharmacol. (2009) 24:29–34. doi: 10.1002/hup.991
39. Chen X, Lu W, Zheng Y, Gu K, Chen Z, Zheng W, et al. Exercise, tea consumption, and depression among breast cancer survivors. J Clin Oncol. (2010) 28:991–8. doi: 10.1200/JCO.2009.23.0565
40. Lucas M, Mirzaei F, Pan A, Okereke OI, Willett WC, O'Reilly ÉJ, et al. Coffee„caffeine, and risk of depression among women. Arch Intern Med. (2011) 171:1571–8. doi: 10.1001/archinternmed.2011.393
41. Feng L, Li J, Kua EH, Lee TS, Yap KB, Rush AJ, et al. Association of tea consumption with depressive symptoms in older Chinese adults. J Am Geriatr Soc. (2012) 60:2358–60. doi: 10.1111/jgs.12011
42. Feng L, Yan Z, Sun B, Cai C, Jiang H, Kua E-H, et al. Tea consumption and depressive symptoms in older people in rural China. J Am Geriatr Soc. (2013) 61:1943–7. doi: 10.1111/jgs.12496
43. Pham NM, Nanri A, Kurotani K, Kuwahara K, Kume A, Sato M, et al. Green tea and coffee consumption is inversely associated with depressive symptoms in a Japanese working population. Public Health Nutr. (2014) 17:625–33. doi: 10.1017/S1368980013000360
44. Tsai AC, Chi SH, Wang JY. Cross-sectional and longitudinal associations of lifestyle factors with depressive symptoms in ≥ 53-year old Taiwanese - results of an 8-year cohort study. Prev Med. (2013) 57:92–7. doi: 10.1016/j.ypmed.2013.04.021
45. Park RJ, Moon JD. Coffee and depression in Korea: The fifth Korean National Health and Nutrition Examination Survey. Eur J Clin Nutr. (2015) 69:501–504. doi: 10.1038/ejcn.2014.247
46. Guo X, Park Y, Freedman ND, Sinha R, Hollenbeck AR, Blair A, et al. Sweetened beverages, coffee, and tea and depression risk among older US adults. PLoS ONE. (2014) 9:e94715. doi: 10.1371/journal.pone.0094715
47. Ritchie K, Ancelin ML, Amieva H, Rouaud O, Carrière I. The association between caffeine and cognitive decline: examining alternative causal hypotheses. Int Psychoger. (2014) 26:581–90. doi: 10.1017/S1041610213002469
48. Taher YA, Samud AM, Hashemi MM, Kabuoli NF. Prevalence of depression, anxiety and stress among Libyan primary and secondary schoolteachers: A cross-sectional study. Jordan J Pharmac Sci. (2016) 9:129–40. doi: 10.12816/0033311
49. Li F-D, He F, Ye X-J, Shen W, Wu Y-P, Zhai Y-J, et al. Tea consumption is inversely associated with depressive symptoms in the elderly: A cross-sectional study in eastern China. J Affect Disord. (2016) 199:157–62. doi: 10.1016/j.jad.2016.04.005
50. Chanda W, Joseph TP, Guo X-F, Wang W-D, Liu M, Vuai MS, et al. Effectiveness of omega-3 polyunsaturated fatty acids against microbial pathogens. J Zhejiang Univ Sci B. (2018) 19:253–62. doi: 10.1631/jzus.B1700063
51. Yu ZM, Parker L, Dummer TJB. Associations of coffee, diet and non-nutritive sweetener use with depression among populations in eastern Canada. Sci Rep. (2017) 7:6255. doi: 10.1038/s41598-017-06529-w
52. Kim J, Kim J. Green tea, coffee, and caffeine consumption are inversely associated with self-report lifetime depression in the Korean population. Nutrients. (2018) 10:1201. doi: 10.3390/nu10091201
53. Navarro AM, Abasheva D, Martínez-González MÁ, Ruiz-Estigarribia L, Martín-Calvo N, Sánchez-Villegas A, et al. Coffee consumption and the risk of depression in a middle-aged cohort: The Sun project. Nutrients. (2018) 10:1333. doi: 10.3390/nu10091333
54. Pogoda JM, Patricio G, McEligot AJ. Association between Caffeine Consumption and Depression in NHANES 2009–2010. Calif J Health Promot. (2018) 16:16–23. doi: 10.32398/cjhp.v16i1.2120
55. Iranpour S, Sabour S. Inverse association between caffeine intake and depressive symptoms in US adults: data from National Health and Nutrition Examination Survey (NHANES) 2005–2006. Psychiatry Res. (2019). 271:732–739. doi: 10.1016/j.psychres.2018.11.004
56. Kimura Y, Suga H, Kobayashi S, Sasaki S. Group T-GSoWoDaHS Intake of coffee associated with decreased depressive symptoms among elderly japanese women: a multi-center cross-sectional study. J Epidemiol. (2020) 30:338–44. doi: 10.2188/jea.JE20190010
57. Pérez-Ara MÁ, Gili M, Visser M, Penninx BWJH, Brouwer IA, Watkins E, et al. Associations of non-alcoholic beverages with major depressive disorder history and depressive symptoms clusters in a sample of overweight adults. Nutrients. (2020) 12:1–15. doi: 10.3390/nu12103202
58. Ng TP, Gao Q, Gwee X, Chua DQL. Tea consumption and depression from follow up in the singapore longitudinal ageing study. J Nutr Health Aging. (2021) 25:295–301. doi: 10.1007/s12603-020-1526-x
59. Kromhout MA, Ottenheim NR, Putter H, Numans ME, Achterberg WP. Caffeine consumption and behavioral symptoms in nursing home residents: a cross-sectional analysis. J Nutr Health Aging. (2021) 25:100–7. doi: 10.1007/s12603-020-1436-y
60. Safarini OA, Taya H, Abu Elhija Y, Qadous M, Farhoud A, Thabaleh A, et al. Assessment of the relationship of depression with tobacco and caffeine use among university students: a cross-sectional study. Cureus. (2021) 13:e19098. doi: 10.7759/cureus.19098
61. Yao Y, Chen H, Chen L, Ju SY, Yang H, Zeng Y, et al. Type of tea consumption and depressive symptoms in Chinese older adults. BMC Geriatr. (2021) 21:331. doi: 10.1186/s12877-021-02203-z
62. Omagari K, Sakaki M, Tsujimoto Y, Shiogama Y, Iwanaga A, Ishimoto M, et al. Coffee consumption is inversely associated with depressive status in Japanese patients with type 2 diabetes. J Clin Biochem Nutr. (2014) 55:135–42. doi: 10.3164/jcbn.14-30
63. Kromhout D, Spaaij CJK, de Goede J, Weggemans RM. The 2015 Dutch food-based dietary guidelines. Eur J Clin Nutr. (2016) 70:869–78. doi: 10.1038/ejcn.2016.52
64. Kuczmarski AV, Cotugna N, Mason MA, Evans MK, Zonderman AB. Depression and cognitive impairment are associated with low education and literacy status and smoking but not caffeine consumption in Urban African Americans and White adults. J Caffeine Res. (2015) 5:31–41. doi: 10.1089/jcr.2014.0019
65. Berkowitz SA. Coffee, caffeine, and risk of depression among women. Arch Intern Med. (2011) 171:1571–8. doi: 10.1001/archinternmed.2011.427
66. Kim JW, Byun MS, Yi D, Lee JH, Jeon SY, Jung G, et al. Coffee intake and decreased amyloid pathology in human brain. Translat Psychiat. (2019) 9:270. doi: 10.1038/s41398-019-0604-5
67. Kim H, Park J, Lee S, Lee SA, Park E-C. Association between energy drink consumption, depression and suicide ideation in Korean adolescents. Int J Soc Psychiat. (2020) 66:335–43. doi: 10.1177/0020764020907946
68. Grosso G, Micek A, Castellano S, Pajak A, Galvano F. Coffee, tea, caffeine and risk of depression: A systematic review and dose–response meta-analysis of observational studies. Mol Nutr Food Res. (2016) 60:223–34. doi: 10.1002/mnfr.201500620
69. Kim YY. Non-alcoholic beverage consumption and risk of depression: epidemiological evidence from observational studies. Eur J Clin Nutr. (2018) 72:1506–16. doi: 10.1038/s41430-018-0121-2
70. Wang L, Shen X, Wu Y, Zhang D. Coffee and caffeine consumption and depression: A meta-analysis of observational studies. Austr New Zealand J Psychiat. (2016) 50:228–42. doi: 10.1177/0004867415603131
71. Dong X, Yang C, Cao S, Gan Y, Sun H, Gong Y, et al. Tea consumption and the risk of depression: A meta-analysis of observational studies. Austr New Zealand J Psychiat. (2015) 49:334–45. doi: 10.1177/0004867414567759
72. Fisicaro F, Lanza G, Pennisi M, Vagli C, Cantone M, Falzone L, et al. Daily mocha coffee intake and psycho-cognitive status in non-demented non-smokers subjects with subcortical ischaemic vascular disease. Int J Food Sci Nutr. (2022) 73:821–8. doi: 10.1080/09637486.2022.2050999
73. Jee HJ, Lee SG, Bormate KJ, Jung Y-S. Effect of caffeine consumption on the risk for neurological and psychiatric disorders: sex differences in human. Nutrients. (2020) 12:3080. doi: 10.3390/nu12103080
74. Botella P, Parra A. Coffee increases state anxiety in males but not in females. Hum Psychopharmacol. (2003) 18:141–3. doi: 10.1002/hup.444
75. Ferré S. An update on the mechanisms of the psychostimulant effects of caffeine. J Neurochemist. (2008) 105:1067–1079. doi: 10.1111/j.1471-4159.2007.05196.x
76. Morelli M, Carta AR, Kachroo A, Schwarzschild MA. Pathophysiological roles for purines: adenosine, caffeine and urate. Prog Brain Res. (2010) 183:183–208. doi: 10.1016/S0079-6123(10)83010-9
77. Bufalino C, Hepgul N, Aguglia E, Pariante CM. The role of immune genes in the association between depression and inflammation: a review of recent clinical studies. Brain Behav Immun. (2013) 31:31–47. doi: 10.1016/j.bbi.2012.04.009
78. McNally L, Bhagwagar Z, Hannestad J. Inflammation, glutamate, and glia in depression: a literature review. CNS Spectr. (2008) 13:501–10. doi: 10.1017/S1092852900016734
79. Liu T, Zhong S, Liao X, Chen J, He T, Lai S, et al. A meta-analysis of oxidative stress markers in depression. PLoS ONE. (2015) 10:e0138904. doi: 10.1371/journal.pone.0138904
80. Dórea JG, da Costa THM. Is coffee a functional food? Br J Nutr. (2005) 93:773–782. doi: 10.1079/BJN20051370
81. dos Santos MD, Almeida MC, Lopes NP, de Souza GEP. Evaluation of the anti-inflammatory, analgesic and antipyretic activities of the natural polyphenol chlorogenic acid. Biol Pharmac Bull. (2006) 29:2236–40. doi: 10.1248/bpb.29.2236
82. Natella F, Nardini M, Giannetti I, Dattilo C, Scaccini C. Coffee drinking influences plasma antioxidant capacity in humans. J Agric Food Chem. (2002) 50:6211–6. doi: 10.1021/jf025768c
83. Trebaticka J, Duračková Z. Psychiatric disorders and polyphenols: can they be helpful in therapy? Oxid Med Cell Longev. (2015) 2015:248529. doi: 10.1155/2015/248529
Keywords: caffeine, coffee, tea, depressive symptoms risk, observational studies, dose response meta-analysis
Citation: Torabynasab K, Shahinfar H, Payandeh N and Jazayeri S (2023) Association between dietary caffeine, coffee, and tea consumption and depressive symptoms in adults: A systematic review and dose-response meta-analysis of observational studies. Front. Nutr. 10:1051444. doi: 10.3389/fnut.2023.1051444
Received: 22 September 2022; Accepted: 17 January 2023;
Published: 09 February 2023.
Edited by:
Roberta Zupo, National Institute of Gastroenterology S. de Bellis Research Hospital (IRCCS), ItalyReviewed by:
Sara De Nucci, National Institute of Gastroenterology “Saverio de Bellis”, ItalyMariagiovanna Cantone, Gaspare Rodolico Hospital, Italy
Copyright © 2023 Torabynasab, Shahinfar, Payandeh and Jazayeri. This is an open-access article distributed under the terms of the Creative Commons Attribution License (CC BY). The use, distribution or reproduction in other forums is permitted, provided the original author(s) and the copyright owner(s) are credited and that the original publication in this journal is cited, in accordance with accepted academic practice. No use, distribution or reproduction is permitted which does not comply with these terms.
*Correspondence: Shima Jazayeri,  jazayeri.sh@iums.ac.ir