Predictors of micronutrient deficiency among children aged 6–23 months in Ethiopia: a machine learning approach
- 1Department of Statistics, College of Natural Science, Wollo University, Dessie, Ethiopia
- 2Department of Pediatrics, Cincinnati Children’s Hospital Medical Center, University of Cincinnati, College of Medicine, Cincinnati, OH, United States
Introduction: Micronutrient (MN) deficiencies are a major public health problem in developing countries including Ethiopia, leading to childhood morbidity and mortality. Effective implementation of programs aimed at reducing MN deficiencies requires an understanding of the important drivers of suboptimal MN intake. Therefore, this study aimed to identify important predictors of MN deficiency among children aged 6–23 months in Ethiopia using machine learning algorithms.
Methods: This study employed data from the 2019 Ethiopia Mini Demographic and Health Survey (2019 EMDHS) and included a sample of 1,455 children aged 6–23 months for analysis. Machine Learning (ML) methods including, Support Vector Machine (SVM), Logistic Regression (LR), Random Forest (RF), Neural Network (NN), and Naïve Bayes (NB) were used to prioritize risk factors for MN deficiency prediction. Performance metrics including accuracy, sensitivity, specificity, and Area Under the Receiver Operating Characteristic (AUROC) curves were used to evaluate model prediction performance.
Results: The prediction performance of the RF model was the best performing ML model in predicting child MN deficiency, with an AUROC of 80.01% and accuracy of 72.41% in the test data. The RF algorithm identified the eastern region of Ethiopia, poorest wealth index, no maternal education, lack of media exposure, home delivery, and younger child age as the top prioritized risk factors in their order of importance for MN deficiency prediction.
Conclusion: The RF algorithm outperformed other ML algorithms in predicting child MN deficiency in Ethiopia. Based on the findings of this study, improving women’s education, increasing exposure to mass media, introducing MN-rich foods in early childhood, enhancing access to health services, and targeted intervention in the eastern region are strongly recommended to significantly reduce child MN deficiency.
1 Introduction
Micronutrient (MN) deficiencies are a major public health problem around the world, contributing to childhood morbidity and mortality. The burden of this problem is disproportionately high in low- and middle-income countries, particularly in Sub-Saharan Africa, including Ethiopia (1, 2). MN deficiencies mainly occur when people lack access to MN-rich foods like fruits, vegetables, animal products, and fortified foods. MN deficiencies lower immune capabilities and increase the overall risk of infection-related mortality, particularly diarrhea, measles, malaria, and pneumonia, which are among the world’s top ten leading causes of death (1, 3). MNs are only minimally required; however, their lack in the diet has a severe impact on the survival and development of children. Furthermore, MN deficiency contributes to stunting, wasting, weakened immunity, and delays in cognitive development (1, 3, 4).
Vitamin A (VA) and Iron are essential micronutrients that are crucial for the growth and development of children and their deficiency causes significant public health problem in children (5). Iron deficiency is a primary cause of anemia and has serious health consequences for both women and children. VA plays an important role in maintaining the epithelial tissue in the body. Its severe deficiency causes eye damage and is the leading cause of preventable childhood blindness. Moreover, VA deficiency increases the severity of infections such as measles and diarrheal disease in children and slows recovery from illness. It is common in dry environments where fresh fruits and vegetables are not readily available (3).
According to the 2019 United Nations Children’s Fund report, 340 million children globally suffered from hidden hunger as a result of MN deficiency (6). In Africa, less than one-third and one-half of children aged between 6 and 23 months met the minimum criteria for dietary diversity and meal frequency, respectively. According to the 2019 Ethiopian Mini Demographic Health Survey (EMDHS) report, the consumption of foods rich in VA and iron, which are the major MN deficiency indicators, remains low among young children in Ethiopia. Thirty-nine percent of children aged 6–23 months consumed foods rich in VA during the 24 h before the interview, whereas 24% consumed iron-rich foods (3).
Empirical studies have identified several factors associated with insufficient minimum dietary diversity, including limited access to media such as newspapers, magazines, and radio; lower education level of fathers; fewer antenatal care visits; younger child age; working in agriculture, and poorest household wealth index (1, 4, 6–8). However, the typical logistic and multilevel models employed in these studies were unable to identify the most important predictors. Identifying predictors of MN deficiency and taking corrective action are critical in reducing MN deficiency. Prioritizing predictors based on their contribution in predicting MN deficiency will be cost effective and simple to implement but has not yet been considered. Machine learning (ML) algorithms, which intersects statistical learning and artificial intelligence research, are used to explore large amounts of data to discover unknown patterns or relationships and show the share of predictors for a particular problem (9, 10). In addition, ML helps to develop predictive models and the selection of the most important predictors.
Hence, the ML algorithm is the ideal candidate statistical model for addressing these statistical modeling issues. These models have demonstrated high performance in solving classification problems compared to the conventional statistical models applied to select the most important predictors. The availability of diverse alternative models to be selected as the best fit for a predictive model is one of the most important features behind the use of ML algorithms. Among others, the five widely used ML models considered in this study are Support Vector Machine (SVM), Logistic Regression (LR), Neural Network (NN), Random Forest (RF), and Naïve Bayes (NB) (9–14).
The most significant predictors of MN deficiency were determined after evaluating these multiple models and choosing the model that best fit the data under consideration in this study. This enables health professionals, policy designers and implementers, and interventions geared towards addressing challenges posed by MN deficiency to concentrate their efforts on the most reliable predictors and take corrective actions. To the best of our knowledge, no previous study has used ML modeling to determine the factors that predict MN deficiency in Ethiopia and other East African nations. The main objective of this study was to identify the most important predictors of childhood MN deficiency in Ethiopia by evaluating various ML algorithms that most accurately and efficiently predict micronutrient deficiency.
2 Materials and methods
2.1 Data source and sampling procedure
This analysis involved the Ethiopia Mini Demographic and Health Survey (EMDHS), which was collected through a nationally representative, cross-sectional, and household-based survey conducted in Ethiopia in 2019. The data collection used a two-stage cluster sampling design with stratification into urban and rural regions. Twenty-one sampling strata were obtained after stratifying each region into urban and rural areas. In the first stage, 305 Enumeration Areas (EAs) (93 urban EAs and 212 rural EAs) were chosen with a probability proportional to the EA size in each stratum. In the second stage, 30 households were randomly selected from each EA using an equal probability method from the fresh list of households, resulting in a total of 8,663 households with 1,463 children aged 6–23 months (3).
2.2 Study variables and measurements
2.2.1 Outcome variable
The outcome variable in this study was the MN deficiency status of children aged 6–23 months, which was derived based on the MN intake status from respondents’ report. It was mainly computed from the VA and Iron rich foods consumed in the last 24 h prior to the data collection among children aged 6–23 months. We classified children’s MN deficiency status into two groups: “Yes” outcomes if the respondent reported that the child did not consume any of the minimum recommended MNs, and “No” outcomes if the child had consumed at least one of the minimum recommended MNs (1).
A child was grouped in the MN deficient category in VA if he or she had not consumed any of the seven VA-rich foods in the 24 h prior to the data collection. The seven VA rich foods include: i. eggs; ii. meat (beef, hog, lamb, or chicken); iii. Pumpkin, carrots, and squash; iv. any dark green leafy vegetables; v. mangoes, papayas, and other fruits containing VA; vi. liver, heart, and other organs; and vii. Fish or shellfish. Similarly, a child was deemed MN deficient in Iron if she or he did not eat anything from the four food groups that were high in Iron: eggs, meat (beef, hog, lamb, or chicken), liver, heart, and other organs, fish, or shellfish. Hence, in this study, the MN deficiency status of the child was determined as MN deficient if the child was MN deficient in both groups (VA and Iron) and labeled “Yes” and “No” otherwise. The outcome variable is MN deficiency (Y), which is defined for an individual child as:
2.2.2 Predictors in the model
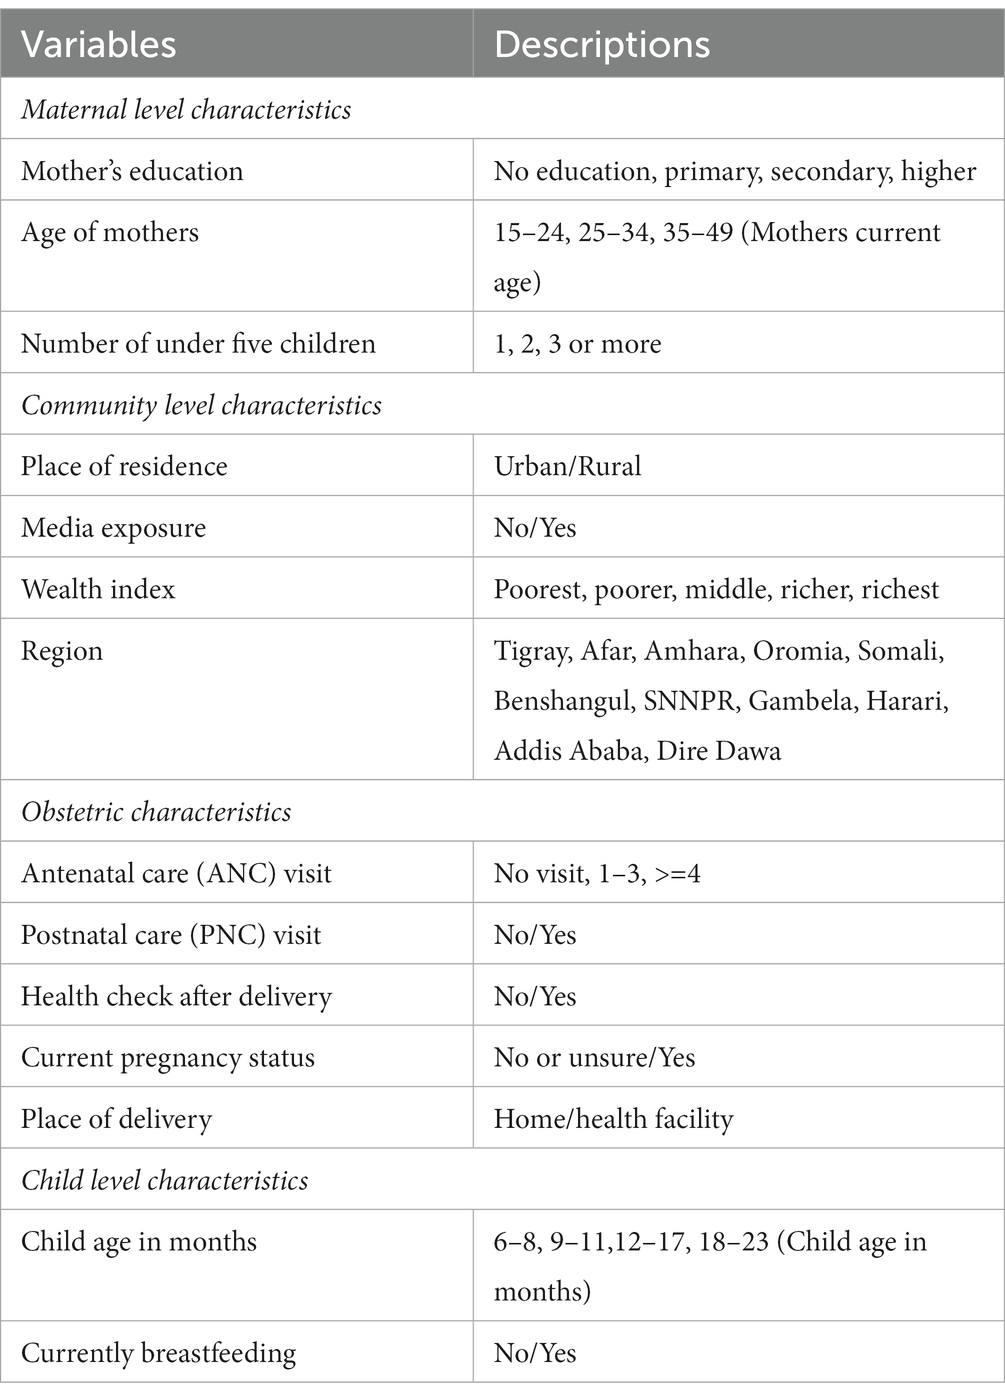
The MN deficiency predictor variables or features included in the models were child age in months, age of mothers, number of children under five, mother’s education, antenatal care (ANC) visit, postnatal care (PNC) visit, health check after delivery, place of delivery, current pregnancy status, currently breastfeeding, wealth index, region, place of residence, and media exposure (See details in Table 1). Moreover, the administrative region shapefiles were used to investigate the spatial variation in the prevalence of child MN deficiency.
2.2.3 Feature selection
Feature selection is a critical step in predicting and interpreting high-dimensional datasets. We employed the Recursive Feature Elimination (RFE) method as a feature selection technique that uses a wrapper approach to select the most relevant features for a given ML model by recursively removing features from the dataset and training the model on the remaining features until the desired number of features is obtained (15). RFE is a valuable tool for identifying the most important features of MN deficiency in children and improving the predictive power of our ML models. Therefore, ML algorithms were applied to determine their predictive power and identify the most important determinants of child MN deficiency.
2.3 Machine learning methods
Machine Learning (ML) methods that were used in this study include SVM, LR, NN, RF, and NB. ML models have been used to rank relevant predictors of MN deficiency and to identify important predictors of health outcomes and other variables of interest.
We used the R programming language (version 4.2.2) and R packages sf (16), caret (17), and pROC (18) for data preprocessing and analysis. The performance of the ML algorithms was evaluated using metrics such as accuracy and the Area Under the Receiver Operating Characteristic curve (AUROC).
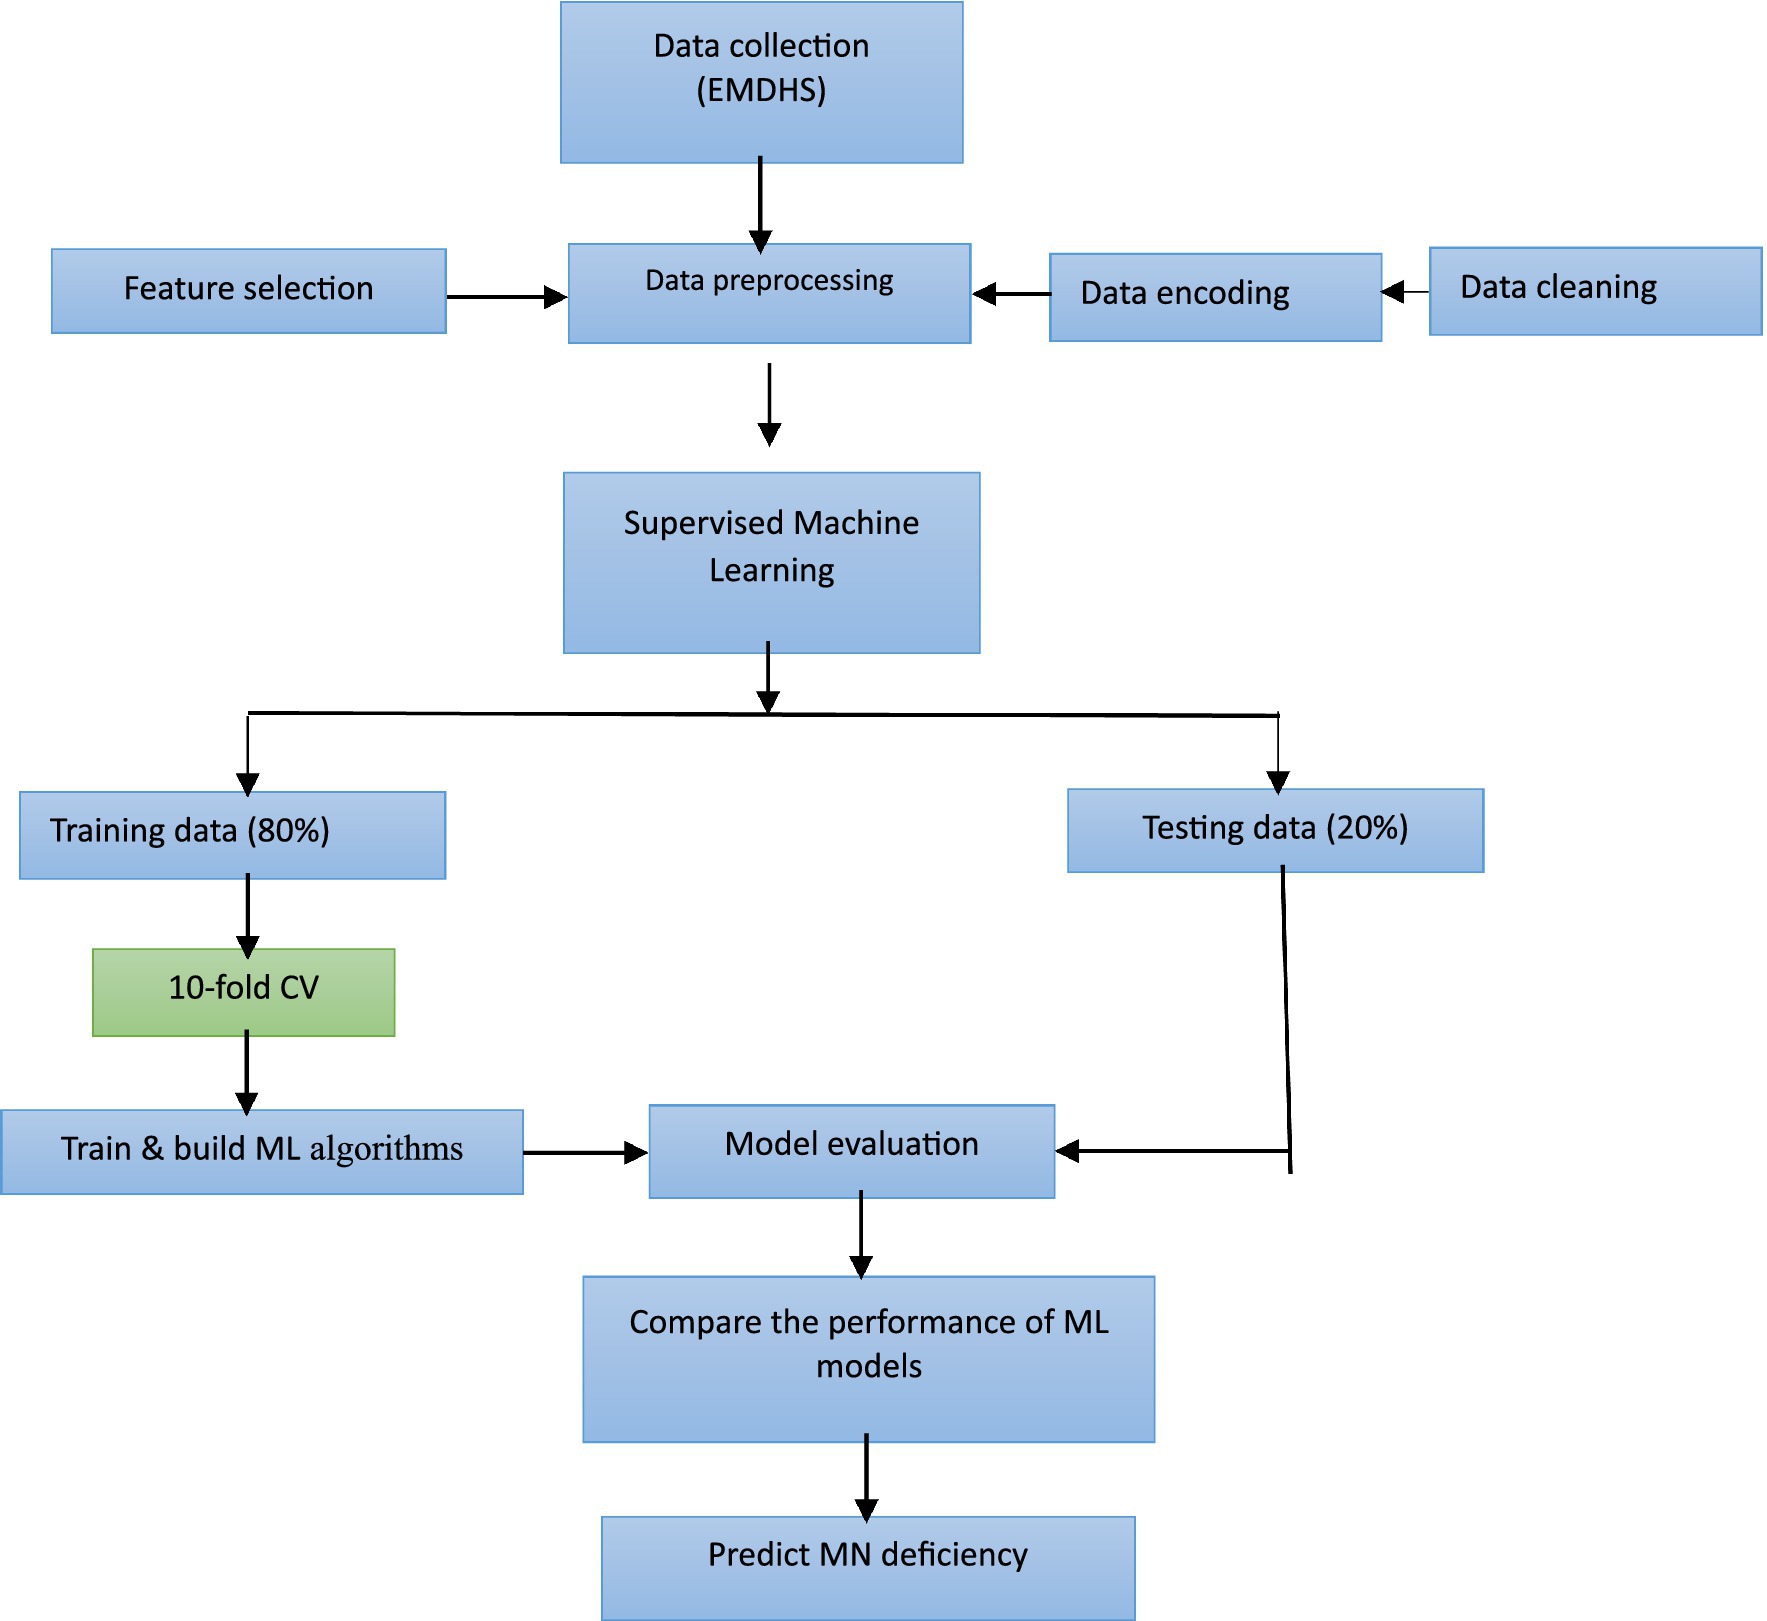
In this study, we employed ML approaches by randomly dividing the dataset into two sets: 80% of it for the training set and 20% for the test set. The training set was used to train the model and the test set was used to evaluate the performance of the model. Standard ML accuracy measures were used to evaluate the prediction power of popular supervised ML algorithms, including SVM (13), LR (11, 14), NN (11–14, 19), RF (10–14, 20, 21), and NB (19). The ML algorithms were trained based on 10-fold cross-validation to optimize models. The overall pipeline of this study is shown in Figure 1. Figure 1 depicts the ML approach for predicting MN deficiency using EMDHS data. The approach involves several steps, including data collection, preprocessing, data cleaning and encoding, feature selection, building and evaluating ML algorithms, and comparing the performance of different models. The best-performing model was then used to predict MN deficiency. Following this approach, this study aimed to develop accurate and reliable predictive models that can inform public health policies and promote child development in Ethiopia.
Support Vector Machine (SVM) is a supervised ML model used for regression and classification that creates a hyperplane or set of hyperplanes in a high- or infinite-dimensional space. The objective is to maximize the margin between the nearest training points or support vectors of each class and the separating hyperplane. The best separation border is represented by the hyperplane with the largest available margin. To conduct linear separation, data must be transformed into higher dimensions using kernel functions. Non-linear classification tasks can be successfully completed using SVM, which is successful on complicated issues with little training data because of its generalization capabilities (22).
Logistic Regression (LR) is a statistical machine learning algorithm for binary classification problems that models the probability of an input data point belonging to a particular class. LR applies a logistic sigmoid function to the weighted sum of input predictors to estimate the probabilities, then thresholds the output to make a binary prediction. Moreover, it assumes a linear relationship between the log-odds of the outcome and the input predictors and can handle numerous predictor variables. It does not require linear relationships between dependent and independent variables, and penalization can control overfitting. The interpretability of model coefficients and probabilities makes logistic regression a popular starting classifier for machine learning applications involving binary prediction (23, 24).
The Random Forest (RF) is a popular algorithm for supervised ML that is used to solve classification and regression issues. It generates decision trees from randomly chosen data samples, gets predictions from each tree, and uses a majority vote to determine the optimal solution. RF also ranks the significance of each predictor using the mean decrease in accuracy (24–26).
The Neural Network (NN), also known as an Artificial Neural Network (ANN), is an ML model that uses a network of functions to recognize and translate a data input of one form into a desired output. The notion of NN was based on the biology of humans and how neurons work together in the human brain to understand information from the senses. NNs learn from labeled training data by adjusting the connection weights between layers of simple processing units, which enables them to model complex nonlinear relationships for applications in prediction, classification, and clustering (24, 27).
Naive Bayes (NB) is a supervised machine learning algorithm classifier based on Bayes’ theorem with independence assumptions between the features that simplifies the computation needed to estimate likelihood and posterior probability, making Naive Bayes a fast, scalable classifier that tends to perform very well on a variety of data despite its simplicity and restrictive assumptions (28).
2.4 Model performance evaluation
Different model performance metrics, including precision, recall or sensitivity, specificity, accuracy, F1 score, Receiver Operating Characteristics (ROC) curves, and ROC Area Under the Curve (ROC AUC) scores, were used to compare the performance of ML models or classifiers (24, 29).
A confusion matrix for binary classification is a two-by-two matrix that displays the values of True Positives (TP), False Negatives (FN), False Positives (FP), and True Negatives (TN) resulting from the predicted classes of data. By analyzing the confusion matrix, we can calculate various performance metrics such as recall (or sensitivity), specificity, and accuracy. The TP and TN represent correct classifications by the model, whereas FN and FP are incorrect predictions.
Recall (sensitivity) also called True Positive Rate (TPR) measures how many of the positive samples are captured by the positive predictions
Specificity is another performance metric used in binary classification that measures the proportion of negative samples that are correctly identified by the model. Specifically, it measures the ability of the model to correctly predict negative samples as negative.
Accuracy is a commonly used performance metric in binary classification that measures the proportion of samples that are correctly classified by the model out of all the samples it has predicted. It is calculated as:
Precision also called positive predictive value (PPV) measures how many of the samples predicted as positive are actually positive.
The F1 score is the harmonic mean of precision and recall
The Receiver Operating Characteristic (ROC) curve is another standard tool used with binary classifiers, which plots sensitivity versus (1 − specificity). Measuring the Area Under the Curve (AUC) is one method of comparing classifiers. AUC provides an aggregated value that illustrates the likelihood that each ML algorithm will accurately classify a random sample. The better the classifier, the more closely the ROC curve will hug the top left corner (24, 30).
3 Results
3.1 Descriptive results
Data from 1,455 children aged 6 to 23 months were included in the analysis to assess the MN deficiency status in Ethiopia. Overall, 62.1% of them had not received any of the minimum recommended micronutrients and were therefore MN deficient. According to Table 2, the prevalence of MN deficiency was significantly higher among children whose mothers had no education (70.53%) compared to those with higher education (36.53%).
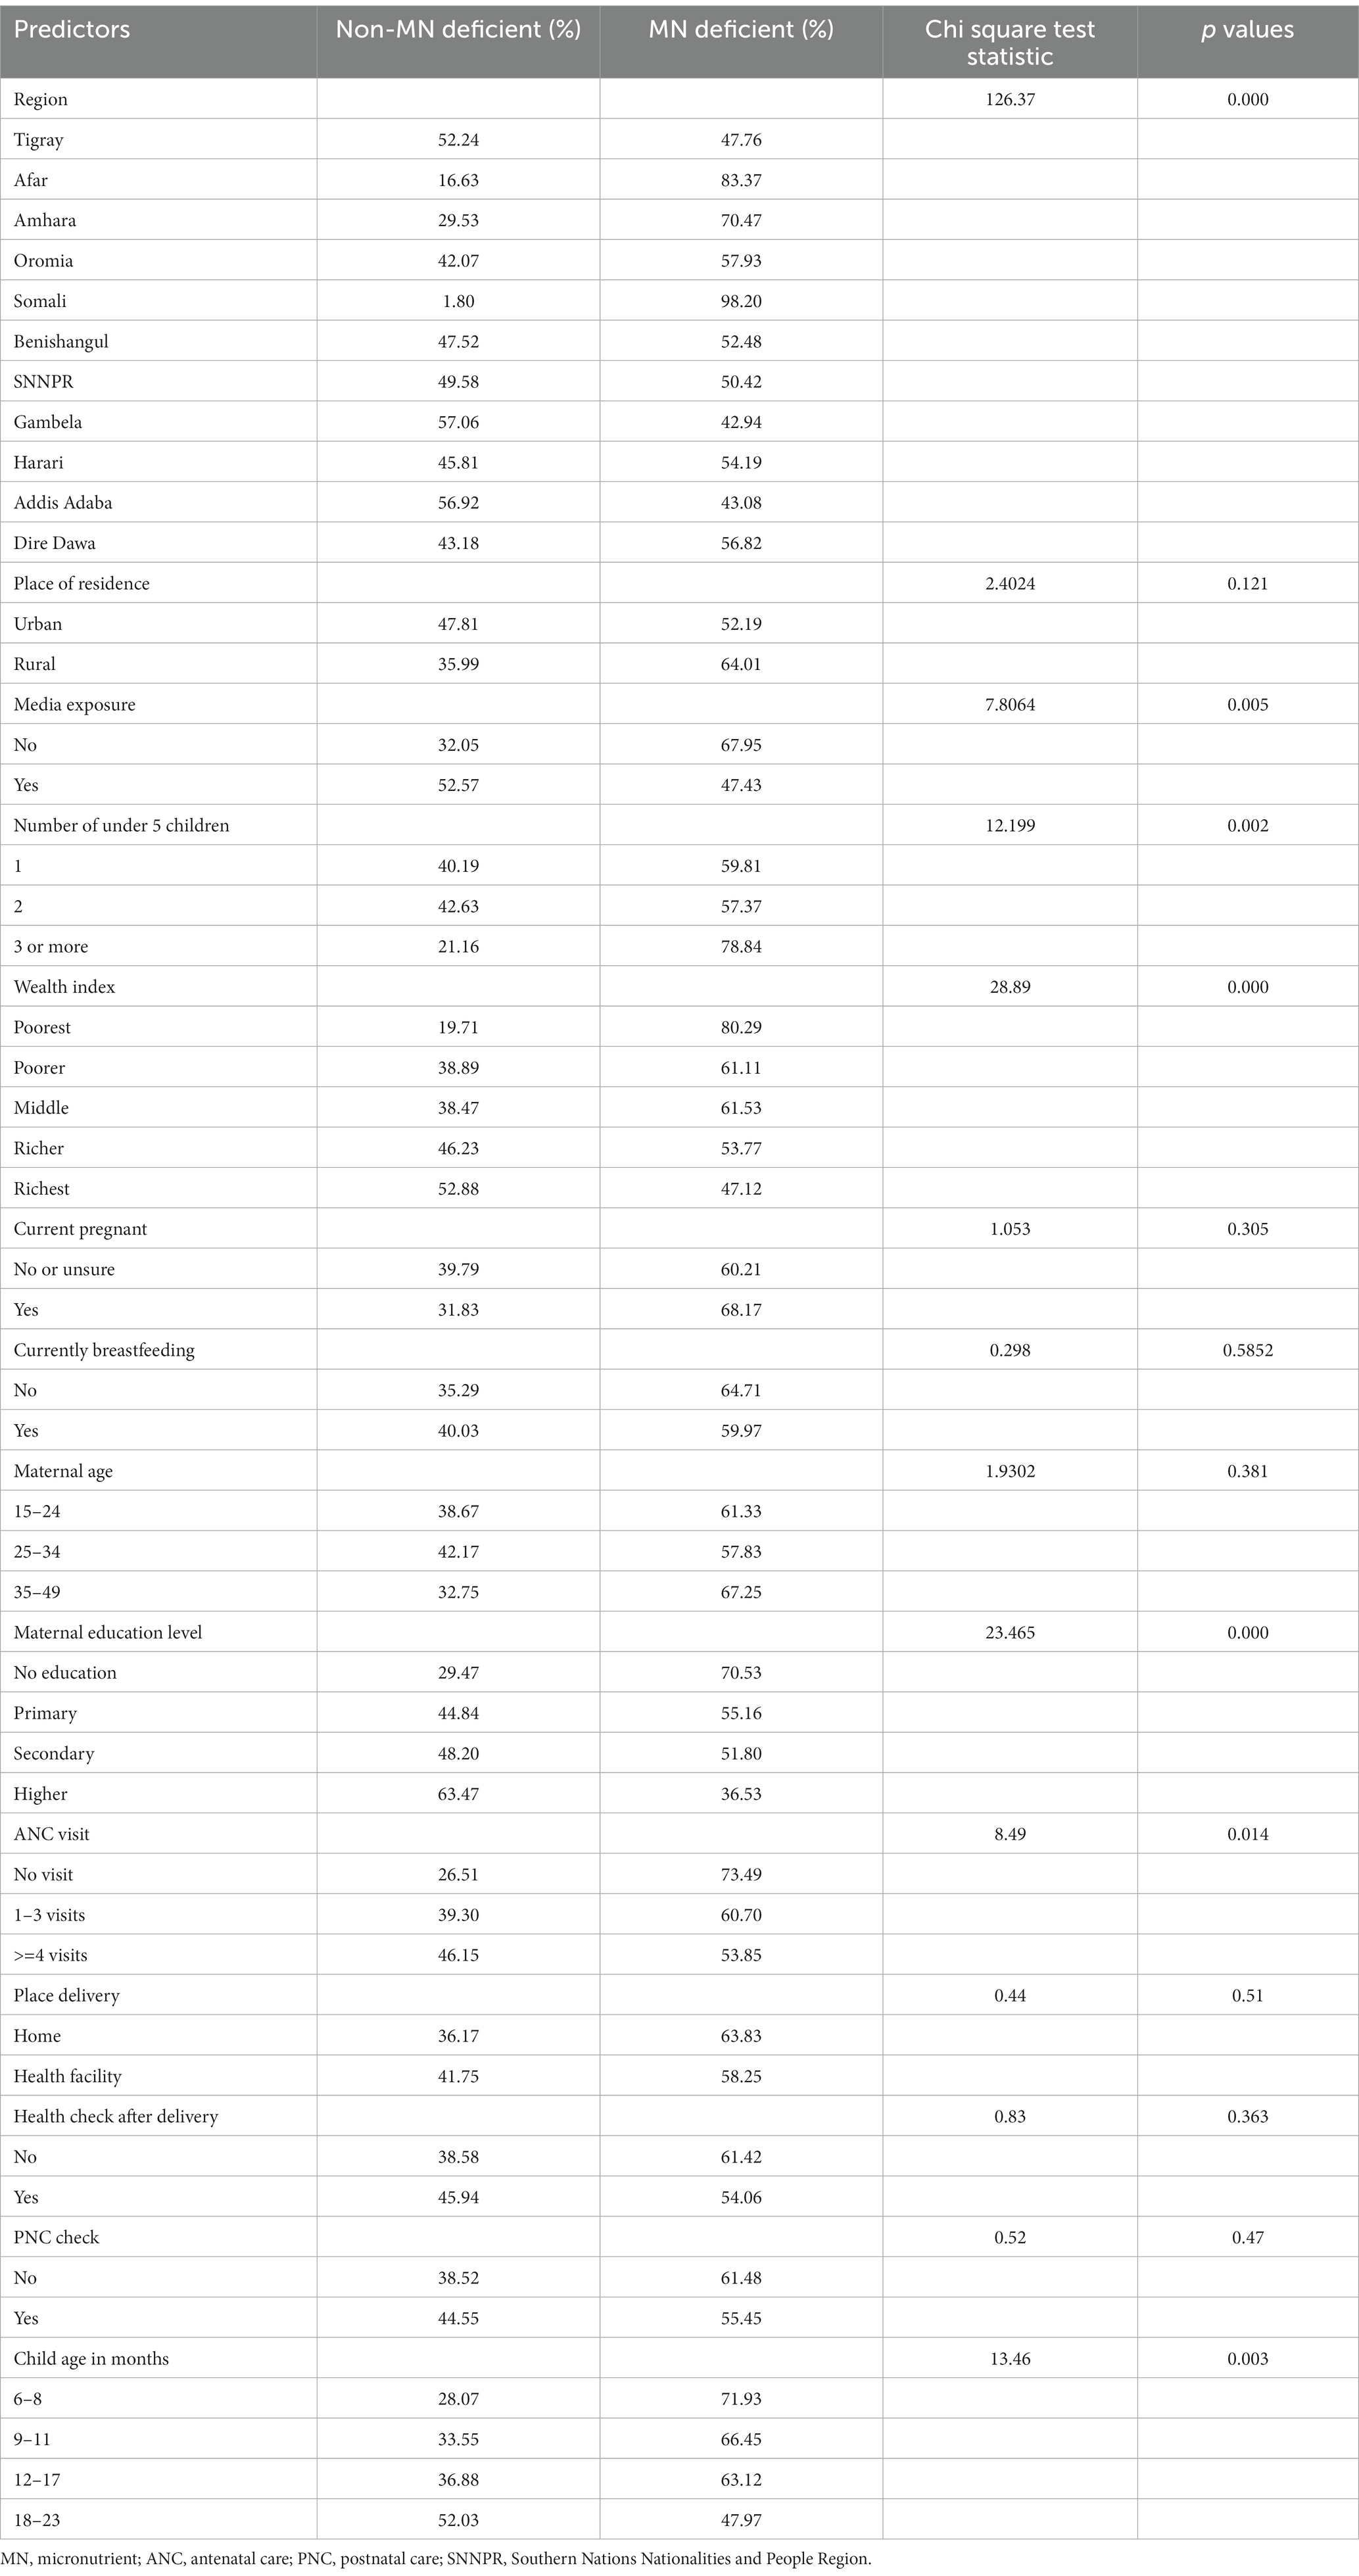
Table 2. Weighted prevalence and chi-square statistics of MN deficiency by demographic and other characteristics among children aged 6–23 months in Ethiopia (n = 1,455).
The prevalence of MN deficiency decreases as the child’s age increases, with the lowest percentage of deficiency found in the 18–23 month age group (47.97%). MN deficiency is also significantly prevalent among children whose mothers have no media exposure (67.95%) compared to those with media exposure (47.43%). The results also suggest that as the wealth quintile increases, the prevalence of MN deficiency decreases, with the lowest percentage of deficiency found in the richest wealth quintile (47.12%) and the highest in the poorest (80.3%). The prevalence of MN deficiency also varies widely across regions, with the highest percentage of deficiency found in the Somali region (98.20%) and the lowest percentage of deficiency found in the Gambela region (42.94%) (Table 2).
According to Table 2, children whose mothers did not attend any ANC visits were more likely to have a MN deficiency (73.49%), compared to mothers who attended 1–3 ANC visits (60.70%) and those attended 4 or more visits (53.85%). Additionally, households with three or more children are more likely to experience a MN deficit (78.84%) than households with one or two children (59.81 and 57.3%, respectively).
3.2 Spatial distribution of childhood MN deficiency
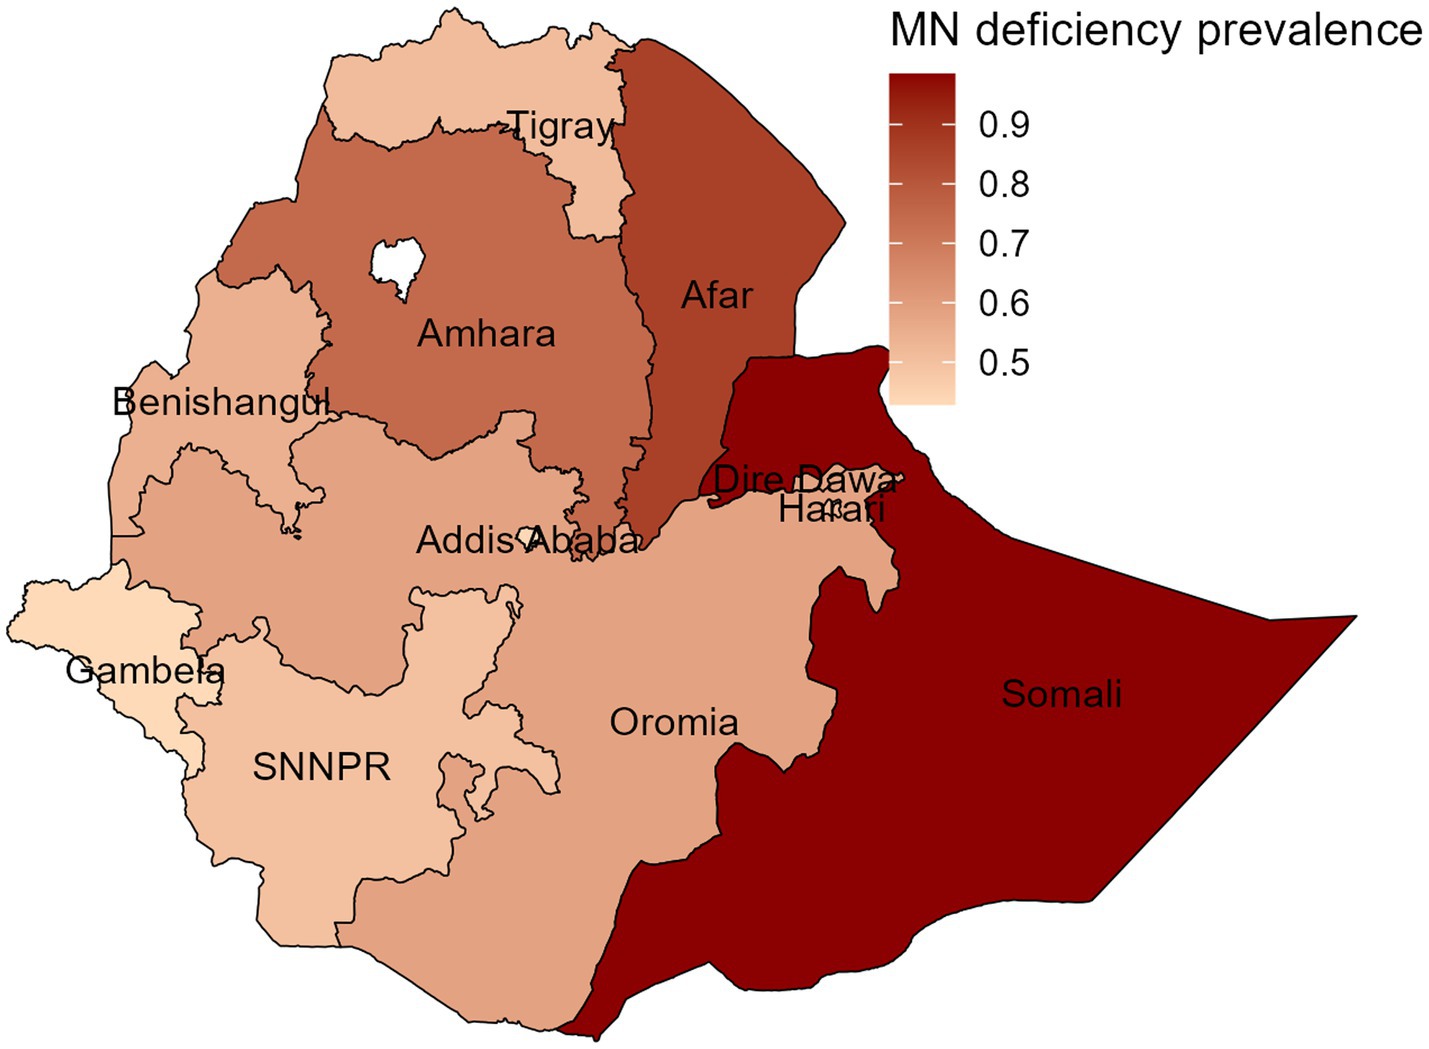
As per the findings presented in Figure 2, the spatial variation of childhood MN deficiency was most prevalent in Somali, Afar, and Amhara regions, while Gambela, Addis Ababa, and Southern Nations, Nationalities, and Peoples (SNNP) were the least affected regions. The findings suggest that the eastern part of Ethiopia, which includes the Somali and Afar regions, and the Amhara region were severely affected by MN deficiency.
3.3 Predictive algorithms for child micronutrient deficiency
The Recursive Feature Elimination (RFE) method was used to identify the features required to develop the ML algorithms on the training dataset. The results showed that RF had a relatively higher accuracy of 72.41% (95% CI: 66.89, 77.48), indicating its ability to correctly classify positive and negative cases. RF also achieved an AUROC of 80.01, suggesting good discriminative ability in distinguishing between positive and negative cases. The NPV of RF was found 69.23%, indicating its effectiveness in correctly identifying children without micronutrient deficiency. Additionally, the F1 score of RF was 79.59, indicating a balanced performance in terms of precision and recall, while NN had a slightly lower AUROC (79.84%) and accuracy (71.03%) compared to RF. Moreover, RF has the highest sensitivity (86.67%), meaning 86.67% of the children who are actually MN deficient are correctly identified by the model. In comparison to the other classifiers, Generalized Linear Model (GLM) had a slightly lower accuracy (70.69%) compared to RF, NN, and SVM and a relatively high AUROC score of 79.53% next to RF and NN. However, its sensitivity score of 80% was lower than those of RF and SVM. Finally, RF had the highest AUROC score (80.01%), whereas NB had the lowest (78.18%) (Figure 3). Based solely on the results presented in Table 3, RF, NN, and SVM were the top-performing algorithms, respectively, in terms of accuracy (Table 3). Thus, among all the algorithms utilized in our investigation, the RF algorithm performed the best in predicting the MN-deficient status of the cases, as evidenced by performance measures.
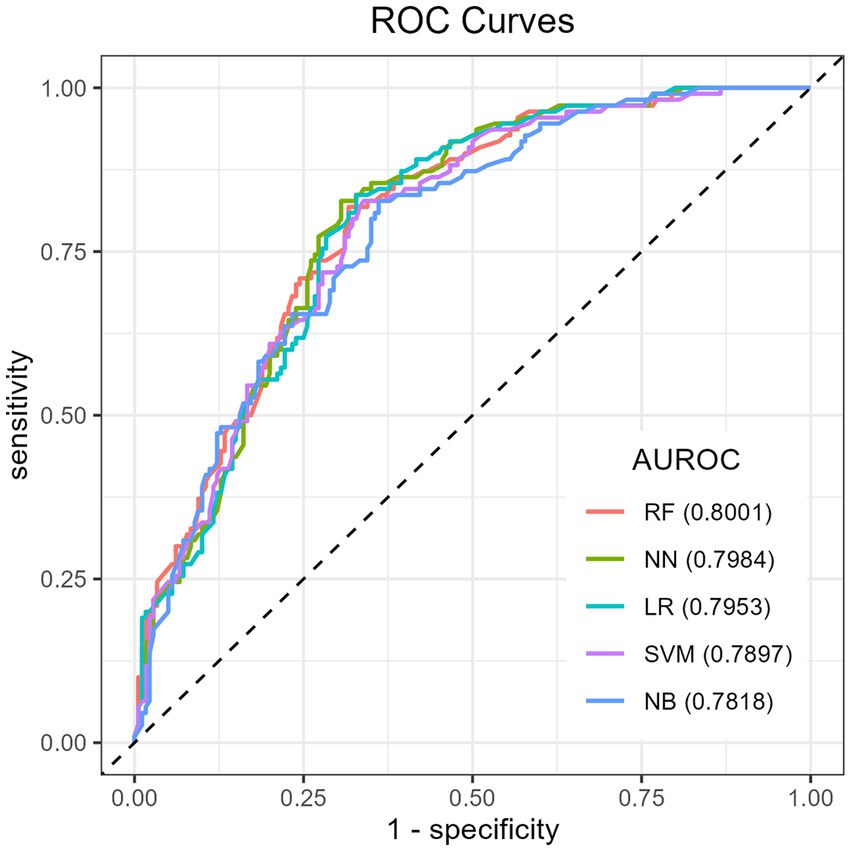
Figure 3. ROC curve for machine learning models in predicting childhood micronutrient deficiency. ROC, receiver operating characteristic; AUROC: area under the receiver operating characteristics.
3.4 The important predictors of micronutrient deficiency
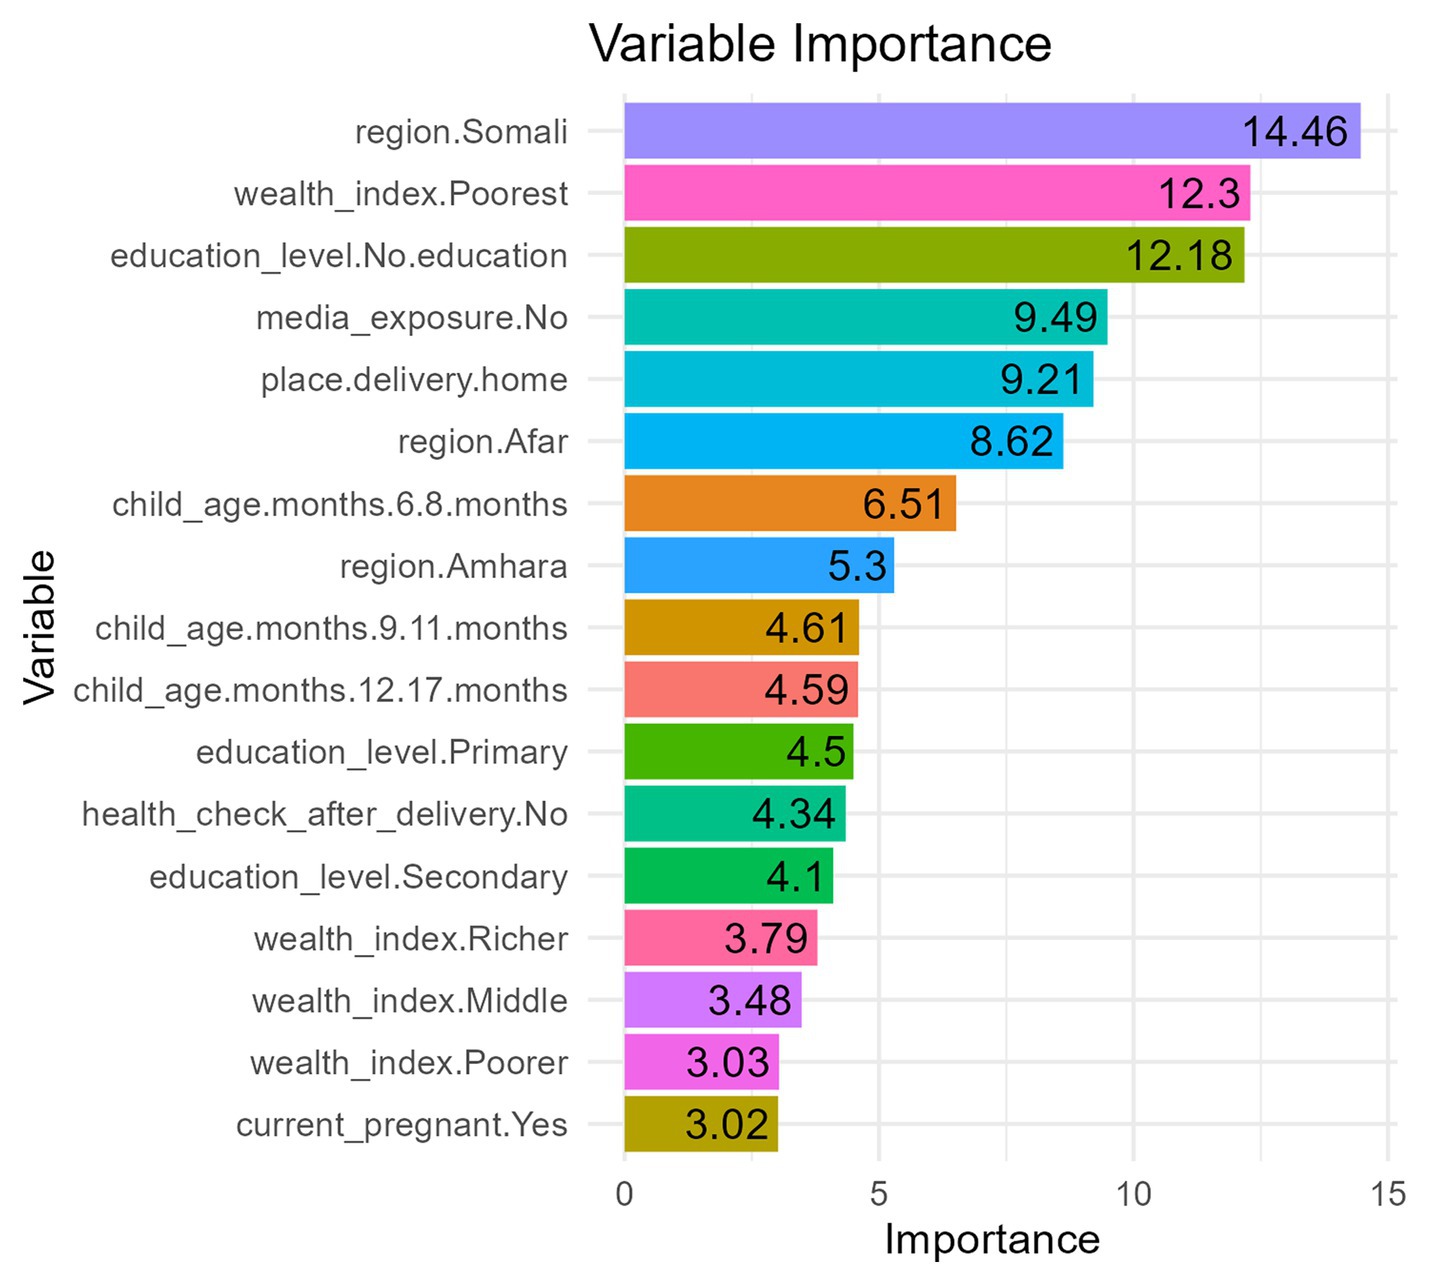
The model evaluation findings, as discussed above, demonstrated that the random forest classifier was the best classifier in terms of accuracy and area under the receiver operating characteristics (AUROC) curve. Based on the most accurate classifier (RF), the top important predictors are presented according to their mean decrease accuracy (MDA) (Figure 4). Among the proposed predictors, the Somali region, the poorest wealth index, no maternal education, no media exposure, home delivery, the Afar region, and children aged 6–8 months were the top important predictors in their order of importance for MN deficiency among children aged 6–23 months in Ethiopia.
3.5 Spatial mapping of actual vs. predicted childhood MN deficiency prevalence
The spatial variation in Figures 5A,B depicts the actual and predicted prevalence of childhood MN deficiency for each region in the test data, respectively. To predict the regional prevalence of MN deficiency, our best predictive model (RF) was employed. Upon visual inspection of the map, we observed that while some discrepancies existed between a few regions, the overall patterns of the observed prevalence were consistent with the predicted prevalence of child MN deficiency. This suggests that our predictive model (RF) was reliable and can be used to predict the childhood MN deficiency prevalence in areas where data are lacking.
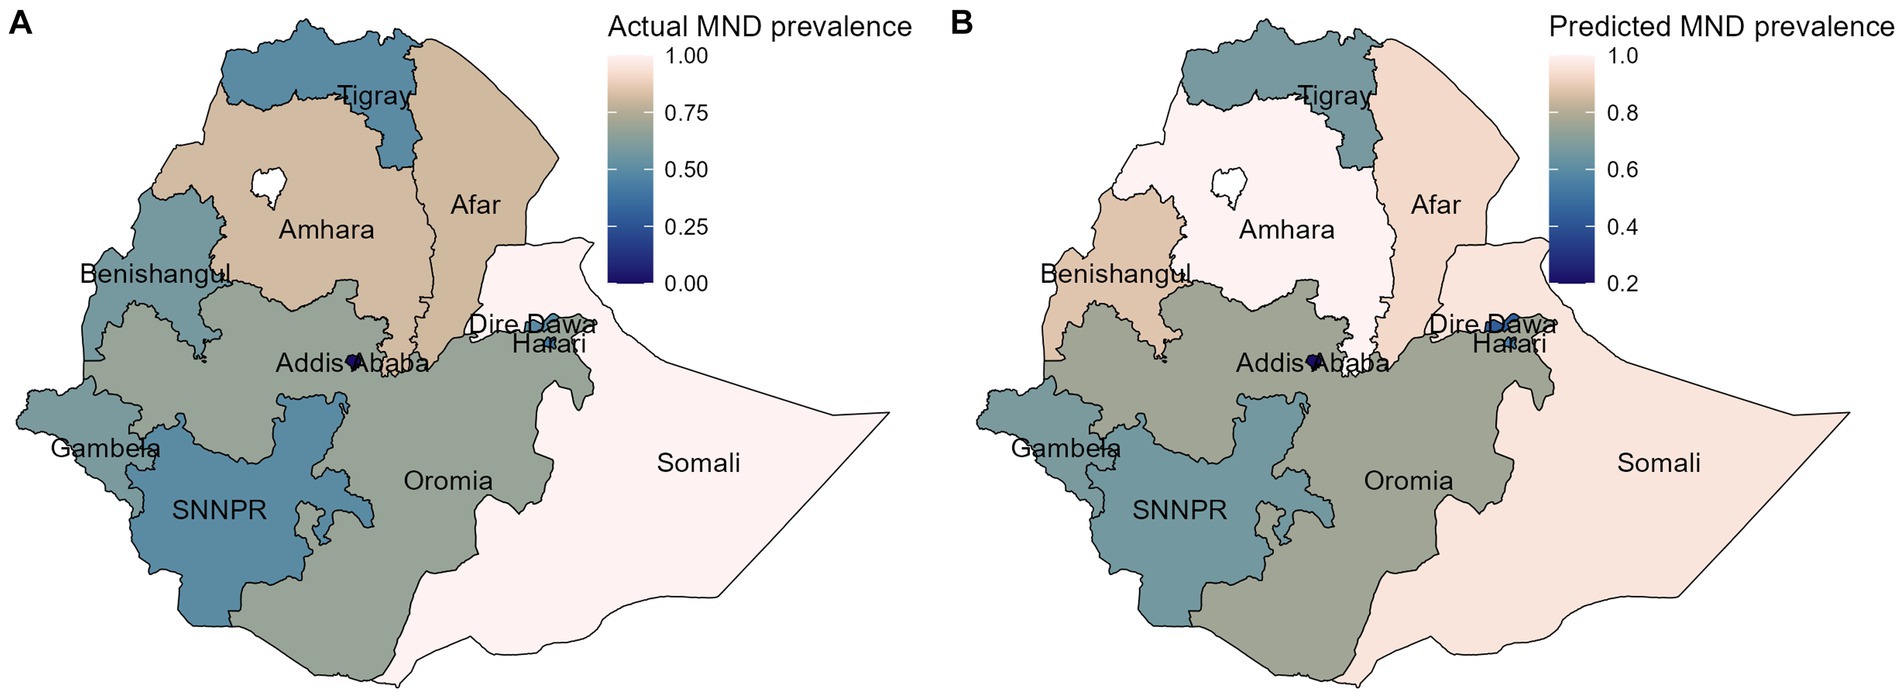
Figure 5. The spatial distribution of the actual (A), and predicted (B) of MN deficiency prevalence on the test data. MND, micronutrient deficiency.
3.6 Classical logistic regression analysis
In contrast to the machine learning models, the traditional logistic regression model provides interpretable odds ratios for each predictor. Based on the results presented in Table 4, the region where the child lives, wealth index, maternal education level, and child age in months were found to be significant predictors of micronutrient deficiency among children aged 6–23 months in Ethiopia. Specifically, children living in the Somali and Afar region had 31.20 and 4.75 times higher odds of MN deficiency, respectively, compared to children in the SNNP region. Children in the poorest wealth index category had 4.75 times higher odds of micronutrient deficiency compared to children in the richest wealth index category. Moreover, the study found that a lower maternal education level and a younger child’s age were significantly associated with higher odds of micronutrient deficiency in children. Specifically, no education, primary, and secondary education in mothers were associated with 2.50, 1.96, and 1.91 times higher odds, respectively, compared to higher education. Children aged 6–11 months had 1.78 times higher odds of MN deficiency compared to those aged 18–23 months (Table 4).
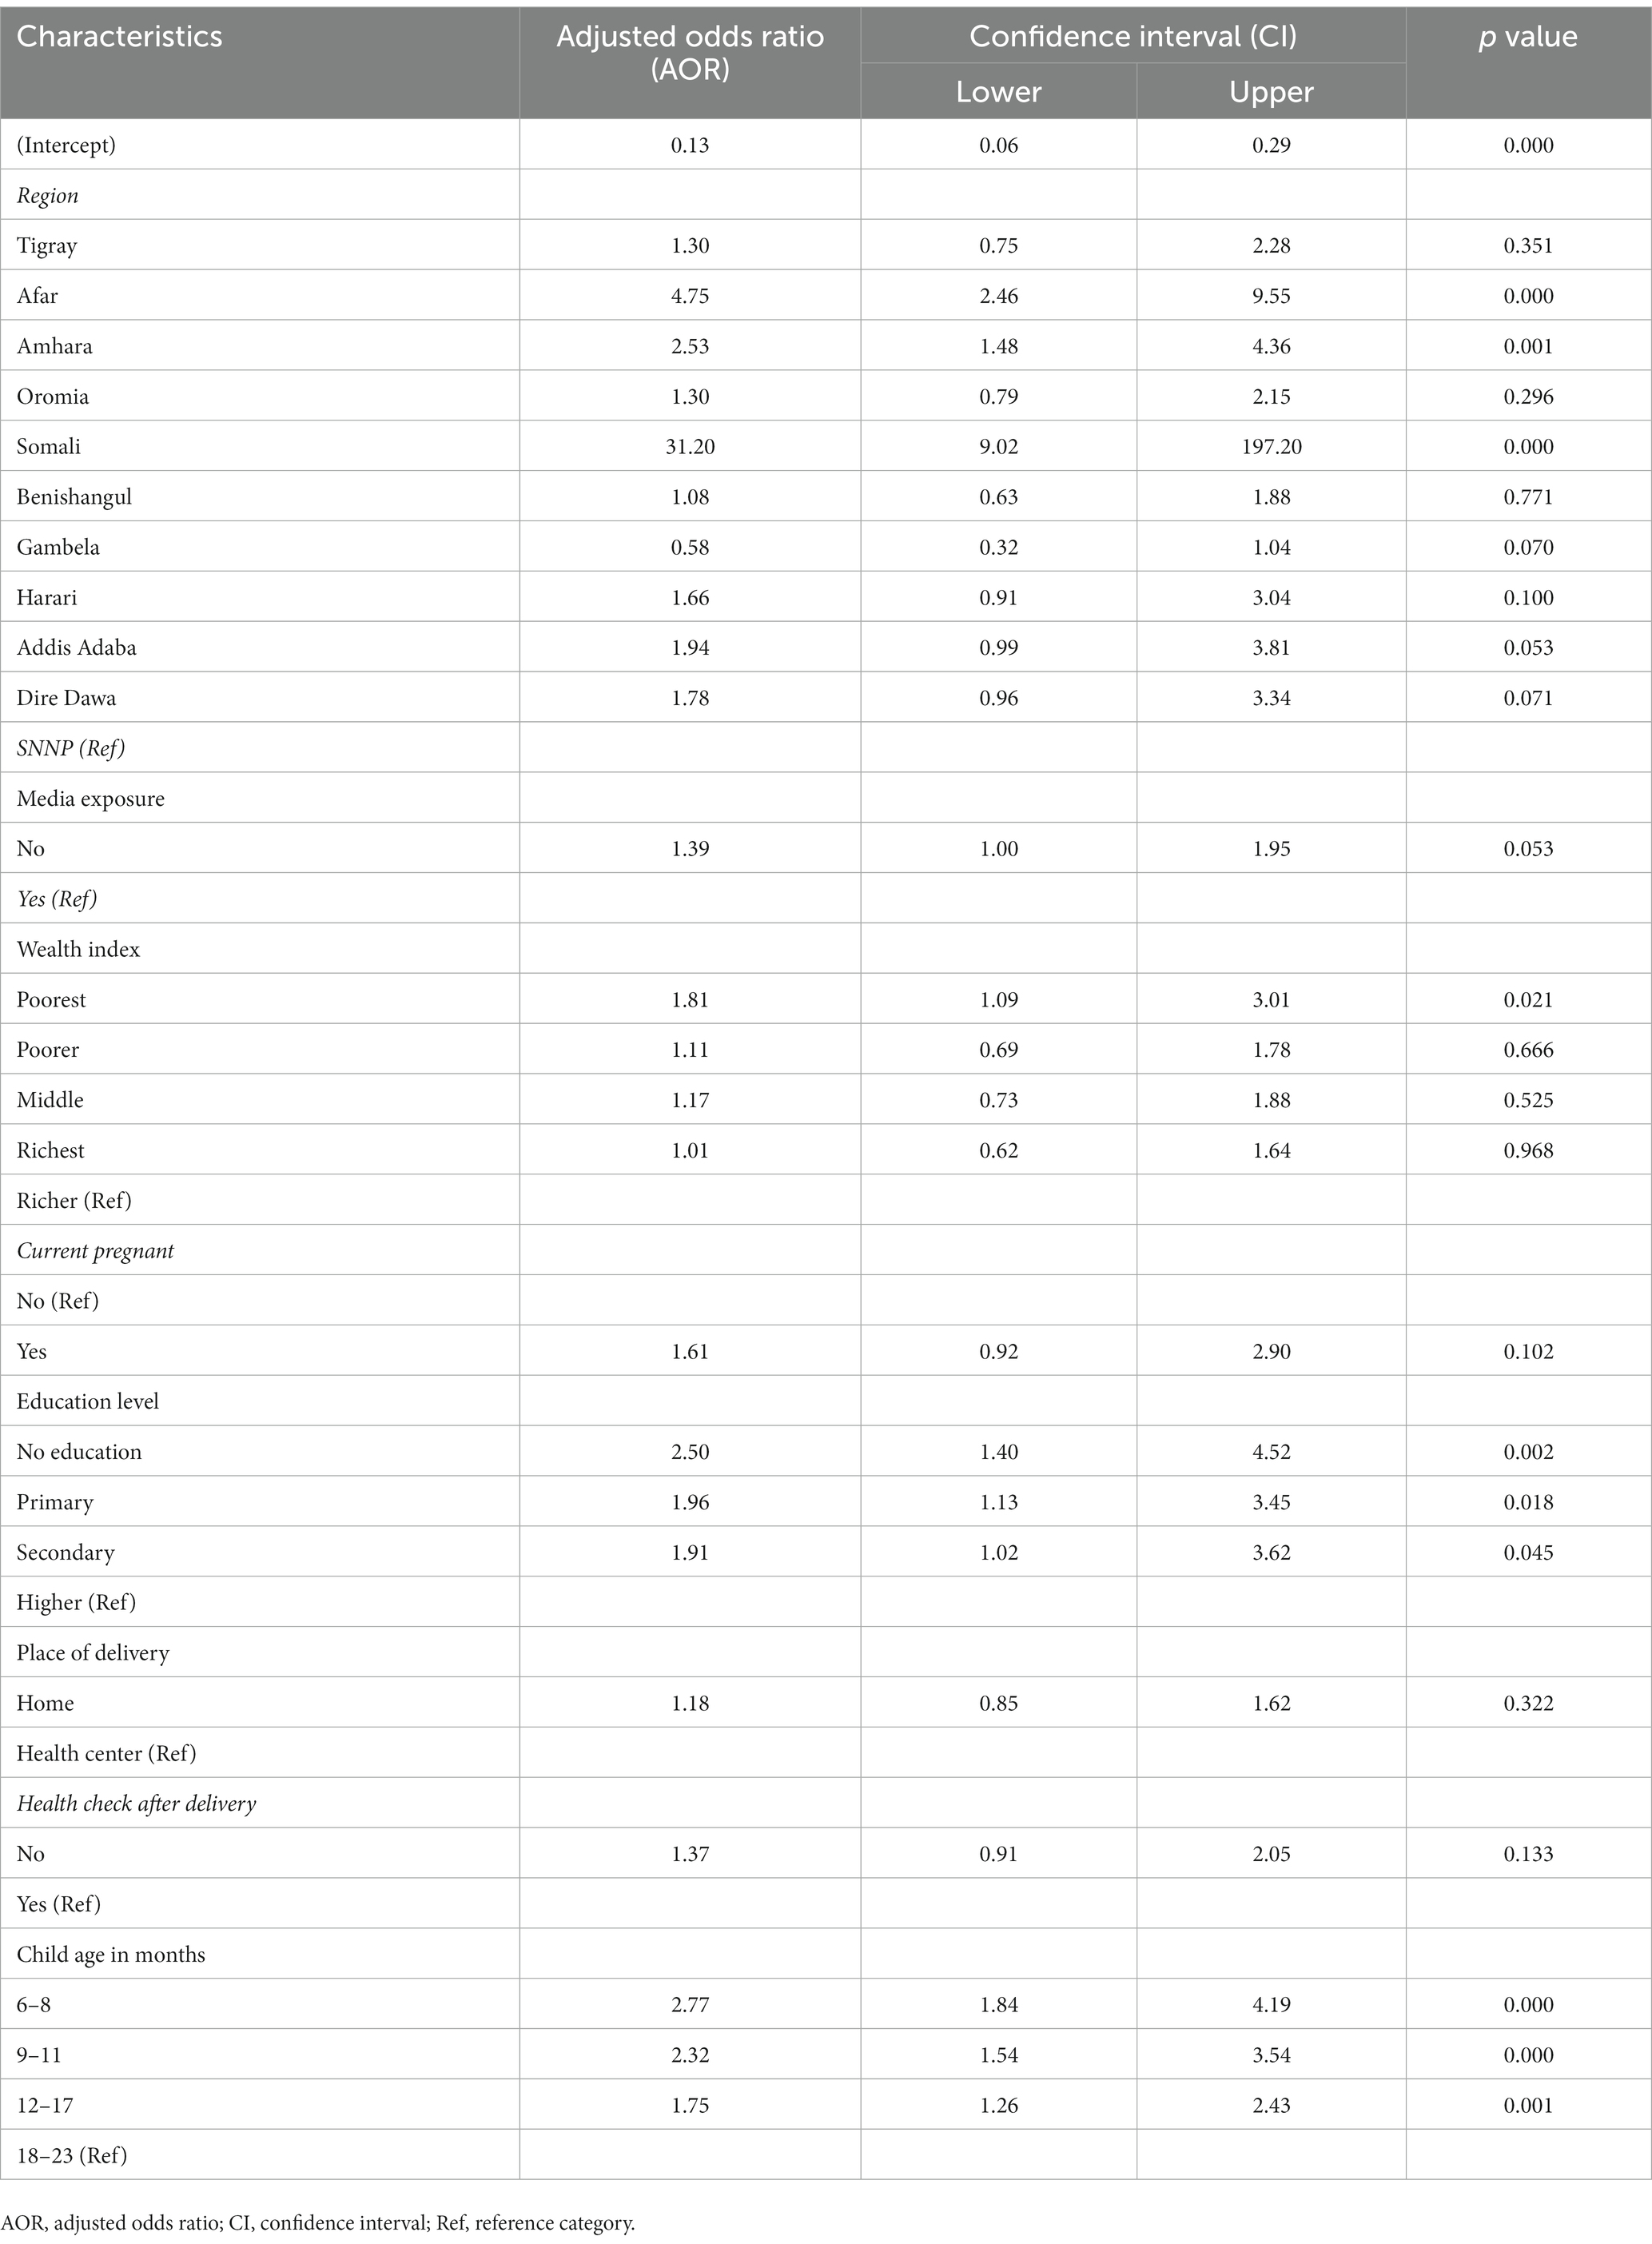
Table 4. Logistic regression model results for factors associated with child MN deficiency (based on training data).
4 Discussion
In this study, we found that children aged 6–23 months had a significant prevalence of MN deficiency, which accounted for 62.1% of children in Ethiopia. This finding highlights the highest MN deficiency compared with other studies conducted in East Africa (31), including Ethiopia (1). The difference in results can be explained by the influence of sample size because the current survey was a mini-demographic survey. Moreover, we found strong associations between certain demographic and socio-economic factors and the prevalence of micronutrient deficiency, such as poverty, lack of media exposure, young age, low maternal education, and larger household size. This finding is consistent with other studies in this area (1, 32, 33).
The findings of this study also showed considerable variations in MN deficiency among children across Ethiopian regions, as illustrated in the spatial map. MN deficiency is most prevalent in the eastern regions, such as Somalia and Afar, and in Amhara region, but least prevalent in the south-west, southern, and central regions in Gambella, SNNP, and Addis Ababa, respectively. Evidence of similar geographical variabilities in MN deficiency has been shown (1, 31, 34). These findings highlight the need for targeted interventions that address the specific needs of different population groups in the eastern regions of Ethiopia.
In terms of predictive ML algorithms, the random forest algorithm was found to have the highest accuracy and AUROC score for predicting micronutrient deficiency. However, it is worth noting that while the logistic regression algorithm (GLM) had slightly lower accuracy compared to other algorithms such as NN, RF, and SVM, its advantage lies in producing more interpretable results in terms of the predictors estimated in the algorithm. Numerous machine learning (ML) approaches have been applied to health issues, including nutritional status (11, 14, 21, 35), asthma risk prediction (20), and childhood anemia (9). These studies have demonstrated high-quality and valid predictions, highlighting the potential of the ML approach in predicting health outcomes. Findings from the RF classifier reveal that the Somali region, the poorest wealth index, children of mothers who have no education, children whose mothers have no media exposure, home delivery, the Afar region, and children aged 6–8 months were the top important variables in their order of importance for predicting MN deficiency among children aged 6–23 months in Ethiopia (1, 31, 32).
The findings of this study indicated that the poorest household wealth index was an important predictor of child MN deficiency. This aligns with evidence that poverty and the poorest wealth index status contribute to childhood MN deficiency (31, 33). Children from low-income households often have limited access to nutritious food, which can lead to deficiencies in essential micronutrients. The implications of these findings highlight the need for targeted interventions aimed at addressing MN deficiency in low-income households. Besides, this study finds that home delivery was a significant risk factor for micronutrient deficiency. This suggests that women who give birth at home may not receive the same level of support and education on proper nutrition and infant care that they would receive in a healthcare facility (36).
Likewise, the significance of a child’s age in predicting micronutrient deficiency has been well documented in the literature (1, 31, 33), which supports the results of this study. Additionally, it seems that children aged 6 to 11 months are more vulnerable to micronutrient deficiencies. These findings suggest that there is a strong association between child age and micronutrient deficiency, with younger children being at a higher risk of deficiency. This highlights the importance of early interventions to promote optimal nutrition and prevent micronutrient deficiency in infants and young children in Ethiopia.
Furthermore, the results indicate that a lack of maternal education increases the risk of childhood micronutrient deficiency. Conversely, children of educated women have significantly lower rates of micronutrient deficiency (31, 33). These findings have important implications for addressing child micronutrient deficiency and further emphasize the need to improve women’s education in developing countries to promote better outcomes for children’s micronutrient status. Moreover, the findings indicate that parents who lack media exposure are also important predictors of childhood micronutrient deficiency, which is consistent with previous research conducted in India (35). This indicates that parental access to media can play a significant role in promoting good nutritional outcomes for children.
Additionally, this study investigated the spatial variation of the actual and predicted prevalence of MN deficiency using RF model, which highlighted the overall patterns of the observed prevalence that were consistent with the predicted prevalence of MN deficiency in children. This suggests that our predictive model (RF) was reliable and can be used to predict the prevalence of childhood MN deficiency in areas where data is lacking.
Moreover, the findings from the best-performing ML model (RF) are largely consistent with the traditional logistic regression analysis. Both the eastern region where the child lives, the wealth index, maternal education level, and child age in months were found to be significant predictors of micronutrient deficiency among children aged 6–23 months in Ethiopia. However, home delivery and media exposure emerged as important predictors in the ML models but not in conventional logistic regression. This suggests that the ML models may reveal previously unknown insights beyond traditional logistic regression approaches. Specifically, ML models could identify new influential variables for policy decision making that are missed by standard statistical methods (37). While the core findings aligned, ML provided the additional benefit of highlighting novel and potentially crucial MN deficiency factors not captured by traditional logistic regression.
5 Conclusion
The aim of this study was to evaluate the effectiveness of various ML algorithms and identify the most accurate and efficient algorithm for predicting micronutrient deficiencies. Accuracy and AUROC were used to evaluate the predictive power of the ML algorithms. The random forest algorithm was identified as the best model, achieving an accuracy of 72.41% and an AUROC of 80.01% on the test data. Thus, the Somali region, the poorest wealth index, children of uneducated moms, children whose parents have no media exposure, home delivery, the Afar region, and children aged 6–8 months were found to be the most important predictors of child MN deficits in their order of importance. Furthermore, the findings demonstrated considerable regional variations in the frequency of child MN deficit, particularly in Ethiopia’s eastern region. Although the RF model and traditional logistic regression model displayed more similar important predictors, the RF model was able to discover some crucial predictors that the conventional logistic regression model had missed. As a result, our model may provide better policy suggestions for children with MN deficiency. These findings underscore the importance of socioeconomic and spatial factors in the incidence of micronutrient deficiencies among Ethiopian children. Addressing these issues may result in better health outcomes for children within an age category of 6–23 months. The regional variation in the prevalence of MN deficiency emphasizes the need for targeted interventions that account for differences in the prevalence and risk factors of micronutrient deficiencies across different regions in Ethiopia.
Data availability statement
The datasets presented in this study can be found in online repositories. The names of the repository/repositories and accession number(s) can be found at: https://www.dhsprogram.com/Data/.
Ethics statement
This research has obtained approval to access the Datasets. Subsequent to the submission and request of the study concept, consent was granted by the Data Archivist of The Demographic and Health Surveys (DHS) Program. All data used adhere to the ethical standards of research. Furthermore, the data was managed in accordance with the Helsinki Declaration of the World Medical Association.
Author contributions
LGG: Conceptualization, Data curation, Formal analysis, Funding acquisition, Methodology, Investigation, Software, Validation, Visualization, Writing – original draft. EYD: Conceptualization, Data curation, Methodology, Validation, Visualization, Writing – review & editing. JAY: Conceptualization, Data curation, Formal analysis, Methodology, Validation, Visualization, Writing – review & editing.
Funding
The author(s) declare financial support was received for the research, authorship, and/or publication of this article. This research was supported by Wollo University research and community service vice president’s office.
Acknowledgments
The datasets utilized in this study were acquired from the DHS program thanks to the authorization obtained to download the dataset from the program’s website.
Conflict of interest
The authors declare that the research was conducted in the absence of any commercial or financial relationships that could be construed as a potential conflict of interest.
Publisher’s note
All claims expressed in this article are solely those of the authors and do not necessarily represent those of their affiliated organizations, or those of the publisher, the editors and the reviewers. Any product that may be evaluated in this article, or claim that may be made by its manufacturer, is not guaranteed or endorsed by the publisher.
References
1. Gebremedhin, T, Aschalew, AY, Tsehay, CT, Dellie, E, and Atnafu, A. Micronutrient intake status and associated factors among children aged 6–23 months in the emerging regions of Ethiopia: a multilevel analysis of the 2016 Ethiopia demographic and health survey. PLoS One. (2021) 16:e0258954. doi: 10.1371/journal.pone.0258954
2. Harika, R, Faber, M, Samuel, F, Kimiywe, J, and Mulugeta, A. Micronutrient status and dietary intake of Iron, vitamin a, iodine, folate and zinc in women of reproductive age and pregnant women in Ethiopia, Kenya, Nigeria and South Africa: a systematic review of data from 2005 to 2015. Nutrients. (2017) 9:1096. doi: 10.3390/nu9101096
3. EPHI, ICF. Ethiopia mini demographic and health survey 2019: Final report. Rockville, Maryland, USA: EPHI and ICF2021.
4. Bush, LA, Hutchinson, J, Hooson, J, Warthon-Medina, M, and Hancock, N. Measuring energy, macro and micronutrient intake in UK children and adolescents: a comparison of validated dietary assessment tools. BMC Nutrition. (2019) 5:53. doi: 10.1186/s40795-019-0312-9
5. Eshete, T, Kumera, G, Bazezew, Y, Mihretie, A, and Marie, T. Determinants of inadequate minimum dietary diversity among children aged 6–23 months in Ethiopia: secondary data analysis from Ethiopian demographic and health survey 2016. Agric Food Security. (2018) 7:66. doi: 10.1186/s40066-018-0219-8
6. UNICEF. The state of the world’s children 2019: children, food and nutrition: growing well in a changing world. UNICEF. (2019)
7. Geda, NR, Feng, CX, Henry, CJ, Lepnurm, R, and Janzen, B. Multiple anthropometric and nutritional deficiencies in young children in Ethiopia: a multi-level analysis based on a nationally representative data. BMC Pediatr. (2021) 21:11. doi: 10.1186/s12887-020-02467-1
8. Mulat, E, Alem, G, Woyraw, W, and Temesgen, H. Uptake of minimum acceptable diet among children aged 6–23 months in orthodox religion followers during fasting season in rural area, DEMBECHA, North West Ethiopia. BMC Nutrition. (2019) 5:18. doi: 10.1186/s40795-019-0274-y
9. Khan, JR, Chowdhury, S, Islam, H, and Raheem, E. Machine learning algorithms to predict the childhood Anemia in Bangladesh. J Data Sci. (2022) 17:195–218. doi: 10.6339/JDS.201901_17(1).0009
10. Handing, EP, Strobl, C, Jiao, Y, Feliciano, L, and Aichele, S. Predictors of depression among middle-aged and older men and women in Europe: a machine learning approach. Lancet Reg Health Europe. (2022) 18:100391. doi: 10.1016/j.lanepe.2022.100391
11. Bitew, FH, Sparks, CS, and Nyarko, SH. Machine learning algorithms for predicting undernutrition among under-five children in Ethiopia. Public Health Nutr. (2022) 25:269–80. doi: 10.1017/S1368980021004262
12. Islam, MM, Rahman, MJ, Islam, MM, Roy, DC, Ahmed, NAMF, and Hussain, S. Application of machine learning based algorithm for prediction of malnutrition among women in Bangladesh. Int J Cogn Comput Eng. (2022) 3:46–57. doi: 10.1016/j.ijcce.2022.02.002
13. Su, PY, Wei, YC, Luo, H, Liu, CH, and Huang, WY. Machine learning models for predicting influential factors of early outcomes in acute ischemic stroke: registry-based study. JMIR Med Inform. (2022) 10:e32508. doi: 10.2196/32508
14. Fenta, HM, Zewotir, T, and Muluneh, EK. A machine learning classifier approach for identifying the determinants of under-five child undernutrition in Ethiopian administrative zones. BMC Med Inform Decis Mak. (2021) 21:291. doi: 10.1186/s12911-021-01652-1
15. Guyon, I, and Elisseeff, A. An introduction to variable and feature selection. J Mach Learn Res. vol. 3 (2003). 1157 p.
16. Pebesma, EJJRJ. Simple features for R: standardized support for spatial vector data. The R Journal. vol. 10 (2018). doi: 10.32614/RJ-2018-009
17. Kuhn, M, Wing, J, Weston, S, Williams, A, and Keefer, C. Caret: classification and regression training. R package version 6.0-90. Vienna, Austria: R Foundation for Statistical Computing. (2020).
18. Robin, X, Turck, N, Hainard, A, Tiberti, N, and Lisacek, F. pROC: an open-source package for R and S+ to analyze and compare ROC curves. BMC Bioinf. (2011) 12:77. doi: 10.1186/1471-2105-12-77
19. Saroj, RK, Yadav, PK, Singh, R, and Chilyabanyama, ON. Machine learning algorithms for understanding the determinants of under-five mortality. BioData Mining. (2022) 15:20. doi: 10.1186/s13040-022-00308-8
20. Dessie, EY, Gautam, Y, Ding, L, Altaye, M, and Beyene, J. Development and validation of asthma risk prediction models using co-expression gene modules and machine learning methods. Sci Rep. (2023) 13:11279. doi: 10.1038/s41598-023-35866-2
21. Ren, S-S, Zhu, M-W, Zhang, K-W, Chen, B-W, and Yang, C. Machine learning-based prediction of in-hospital complications in elderly patients using GLIM-, SGA-, and ESPEN 2015-diagnosed malnutrition as a factor. Nutrients. (2022) 14:3035. doi: 10.3390/nu14153035
23. Hosmer, DW. Lemeshow S, Sturdivant RX. Applied logistic regression. Hoboken, New Jersey: John Wiley & Sons (2013).
24. Géron, A. Hands-on machine learning with Scikit-learn, Keras, and TensorFlow: Concepts, tools, and techniques to build intelligent systems. Sebastopol, CA: O’Reilly Media, Inc. (2019).
26. Ho, TK. Random decision forests. Proceedings of the third international conference on document analysis and recognition, 1: IEEE Computer Society; (1995). 278
27. JJNN, S. Deep learning in neural networks: an overview. Neural Netw. (2015) 61:85–117. doi: 10.1016/j.neunet.2014.09.003
28. Rish, I, (Ed.) An empirical study of the naive Bayes classifier. IJCAI 2001 workshop on empirical methods in artificial intelligence; (2001)
29. Brownlee, J. Machine learning mastery with R: Get started, build accurate models and work through projects step-by-step. Melbourne, Australia: Machine Learning Mastery (2016).
30. Gareth, J, Daniela, W, Trevor, H, and Robert, T. An introduction to statistical learning with applications in R. New York: Springer (2013).
31. Engidaw, MT, Gebremariam, AD, Tiruneh, SA, Tesfa, D, and Fentaw, Y. Micronutrient intake status and associated factors in children aged 6–23 months in sub-Saharan Africa. Sci Rep. (2023) 13:10179. doi: 10.1038/s41598-023-36497-3
32. Chitekwe, S, Parajuli, KR, Paudyal, N, Haag, KC, and Renzaho, A. Individual, household and national factors associated with iron, vitamin a and zinc deficiencies among children aged 6-59 months in Nepal. Matern Child Nutr. (2022) 18:13305. doi: 10.1111/mcn.13305
33. Gewa, CA, and Leslie, TF. Distribution and determinants of young child feeding practices in the east African region: demographic health survey data analysis from 2008-2011. J Health Popul Nutr. (2015) 34:6. doi: 10.1186/s41043-015-0008-y
34. Stevens, GA, Beal, T, Mbuya, MN, Luo, H, and Neufeld, LM. Micronutrient deficiencies among preschool-aged children and women of reproductive age worldwide: a pooled analysis of individual-level data from population-representative surveys. Lancet Glob Health. (2022) 10:e1590–9. doi: 10.1016/S2214-109X(22)00367-9
35. Khare, S, Kavyashree, S, Gupta, D, and Jyotishi, A. Investigation of nutritional status of children based on machine learning techniques using Indian demographic and health survey data. Proc Comput Sci. (2017) 115:338–49. doi: 10.1016/j.procs.2017.09.087
36. Målqvist, M, Pun, A, and Kc, A. Essential newborn care after home delivery in Nepal. Scand J Public Health. (2017) 45:202–7. doi: 10.1177/1403494816683572
Keywords: machine learning, child micronutrient deficiency, AUROC, spatial variation, Ethiopia
Citation: Gebeye LG, Dessie EY and Yimam JA (2024) Predictors of micronutrient deficiency among children aged 6–23 months in Ethiopia: a machine learning approach. Front. Nutr. 10:1277048. doi: 10.3389/fnut.2023.1277048
Edited by:
Hettie Carina Schönfeldt, University of Pretoria, South AfricaReviewed by:
Azam Doustmohammadian, Iran University of Medical Sciences, IranJunior Muka, University of Arkansas at Little Rock, United States
Kalkidan Hassen Abate, Jimma University, Ethiopia
Kedir Hussein Abegaz, Near East University, Cyprus
Copyright © 2024 Gebeye, Dessie and Yimam. This is an open-access article distributed under the terms of the Creative Commons Attribution License (CC BY). The use, distribution or reproduction in other forums is permitted, provided the original author(s) and the copyright owner(s) are credited and that the original publication in this journal is cited, in accordance with accepted academic practice. No use, distribution or reproduction is permitted which does not comply with these terms.
*Correspondence: Leykun Getaneh Gebeye, leyk.get@gmail.com; Jemal Ayalew Yimam, jemal4446@yahoo.com
 Leykun Getaneh Gebeye
 Eskezeia Yihunie Dessie
 Jemal Ayalew Yimam