The relationship between coffee-related factors and cortical and hippocampal structure: a triangulation of evidence approach and Mendelian randomization research
 Zining Luo1,2
  Lijun Xiong2† Xinyu Xu2† Meng Sun3† Yingfei Mu4† Hongjie Chen2†
  Zhenglong Liu1* Zhiyong Luo5* Jianli Wang6* Ying Liu7*
- 1Department of Preclinical Medicine and Forensic Medicine, North Sichuan Medical College, Nanchong, China
- 2Department of Stomatology, North Sichuan Medical College, Nanchong, China
- 3Department of Anesthesiology, North Sichuan Medical College, Nanchong, China
- 4Department of Clinical Medicine, North Sichuan Medical College, Nanchong, China
- 5College of Earth Sciences, Chengdu University of Technology, Chengdu, China
- 6Department of Encephalopathy, Pidu District Traditional Chinese Medicine Hospital, Chengdu, China
- 7Department of Stomatology, Affiliated Hospital of North Sichuan Medical College, Nanchong, China
Objective: Existing studies have reported sustained changes in the cortical structure of rats due to coffee-related factors, which are speculated to occur in the human body. However, there is a lack of research on this topic. Additionally, previous observational studies have found the impact of diseases on cortical structure and the potential therapeutic effects of coffee on these diseases. Our aim was to study the causal effects of coffee-related factors on the human brain using SNPs (single nucleotide polymorphisms). We will connect these discovered causal effects to the impact of diseases on the brain. Through triangulating evidence, we will reveal the potential active areas of coffee in preventing diseases.
Methods: We utilized GWAS data from multiple cohorts and their databases, selecting instrumental variables for genetic prediction of coffee intake and plasma levels of caffeine and its direct metabolites. We applied these instrumental variables to individual data on cortical thickness and surface area, as well as hippocampal volume, from the ENIGMA and CHARGE consortium for Mendelian randomization analysis (MR). Triangular evidence was obtained by integrating existing evidence through a specified retrieval strategy, calculating the overlap between coffee's effects on brain regions and disease-related brain regions to identify potential regions of action.
Results: The MR analysis yielded 93 positive results for 9 exposures, among which theobromine, a metabolite in the caffeine pathway, was found to be associated with increased hippocampal volume. For cortical structure, theobromine in the caffeine pathway was associated with a decrease in total surface area, while theobromine and caffeine in the pathway were associated with an increase in total thickness. The overlap rate of triangular evidence showed no difference in both overall and subgroup analyses, indicating a high overlap between the effects of coffee on brain regions and disease.
Conclusions: From predicted outcomes from causal effects, coffee intake-related factors may have lasting effects on cortical structure. Additionally, theobromine and theophylline have the greatest impact on certain brain gyri, rather than caffeine. Triangulation evidence indicates that disease and coffee intake-related factors act on the same cortical regions, suggesting the presence of potential shared or antagonistic pathways.
1 Background
Coffee is currently one of the most widely consumed beverages around the world, and the demand is significantly increasing. According to statistics from the United States Department of Agriculture (USDA) (1), from 2013 to 2022, global coffee production increased by approximately 9.31%. Additionally, there was a 15.98% increase in global coffee imports. Therefore, the impact of coffee on the human body has long been a topic of great interest. Research on the effects of coffee, a beverage that provides energy and stimulation (2), on the brain has been conducted (3). In 1975, Aeschbacher et al. conducted a study on rats and proposed that coffee shortens the duration of drug effects by altering brain structure through its interaction with the brain (4). With the advancement of brain structure classification and the development of MRI technology, research on the specific morphology of coffee and the brain's cortical regions, such as thickness (5), has gradually increased. In addition to the brain, the debate about the pros and cons of coffee for human health has been ongoing for a long time (6). In clinical studies with positive outcomes, coffee has been found to have various benefits, such as promoting physical activity (7), lowering the risk of depression (8), reducing the risk of Parkinson's disease (9), and lowering the risk of type 2 diabetes (10). However, Burke et al. also reported that excessive coffee consumption disrupts the body's circadian rhythm (11).
Previous studies have shown that coffee has lasting effects on the brain. In animal experiments, regular intake of caffeine has been shown to improve the signal-to-noise ratio in information encoding processes (12). In clinical studies, changes in the morphological structure of the cerebral cortex have also been observed in relation to coffee intake (13). In Mendelian randomization studies (MR), it has been found that higher coffee consumption is associated with a reduction in brain gray matter volume (14). However, previous studies also have significant limitations. The research design of animal experiments cannot be directly applied to the human body (15). The small sample size in clinical studies leads to insufficient statistical robustness (16). The long-term effects of coffee on the brain, the effects of diseases on the brain, and the potential shared pathways or regions involved have not been elucidated. Current MR studies have not conducted causal analyses on the specific processes of coffee intake and the morphology of various brain regions. At the same time, prospective cohort studies that have shown a certain causal effect have not been conducted, leading to uncertainty regarding the causal relationship between coffee intake and changes in brain morphology.
MR utilizes genetic variants as instrumental variables, aiding in overcoming confounding biases in clinical research (17, 18). This approach establishes causal relationships between risk factor exposures and disease outcomes. Our study employed publicly available large-scale genome-wide association study (GWAS) data to conduct multiple two-sample MR analyses. These analyses aimed to investigate the impact of coffee-related factors on cerebral cortical structures. Additionally, we conducted a triangulation analysis to elucidate potential relationships among coffee-related factors, cerebral cortex structures, and various diseases.
In summary, our study aimed to address the limitations of previous animal experiments and clinical research while uncovering the causal effects of coffee on the morphology of the cerebral cortex and hippocampal regions. By exploring the potential relationships among coffee-related factors, cerebral cortex structures, and various diseases, we offer insights and potential directions for future research into the collective influences of coffee on brain structure and various disease mechanisms.
2 Methods
2.1 Study protocol
The literature review followed the preferred reporting items for systematic reviews and meta-analyses (PRISMA (19)) guidelines. Our protocol was registered on the PROSPERO network platform on October 1, 2023, with the registration number CRD42023468538. Additionally, the description of the MR analysis section responds to the call of the Journal of Clinical Endocrinology & Metabolism (JECM) and was designed and implemented using the STROBE-MR checklist (20).
2.2 Data sources for coffee intake, caffeine, theobromine, theophylline, and paraxanthine
For the exposure-related process of coffee intake, the data on caffeine and the other direct metabolite SNPs on their metabolic pathways were sourced from the UK Biobank database (n = 375,833) (21) and a meta-analysis of GWAS summary statistics from six European ancestry populations (n = 9,876) (22). Additionally, we studied the inherent presence of caffeine, theobromine, theophylline, and xanthine in plasma, with their related SNPs sourced from individuals of European ancestry in the Canadian Longitudinal Study on Ageing (CLSA) cohort (n = 8,299) (23). All the information from these cohorts involved in this study is listed in Supplementary Table S1. Regarding the standard unit of exposure, coffee, the SNP-coffee association was described in detail by Yuan et al. (24), where the effect size was increased by 50% for each standard unit increase in coffee consumption (e.g., from 1 cup to 1.5 cups). In the studies conducted by Cornelis (22) and Chen et al. (23), caffeine and its metabolites under two distinct conditions were thoroughly studied. All the data were standardized to a mean of zero and a standard deviation of one. In terms of the regional distribution of the SNP sources from the various cohorts, the total number of individuals was 394,008, with a predominant representation of European populations (97.9%). The specific distribution is shown in Figure 1.
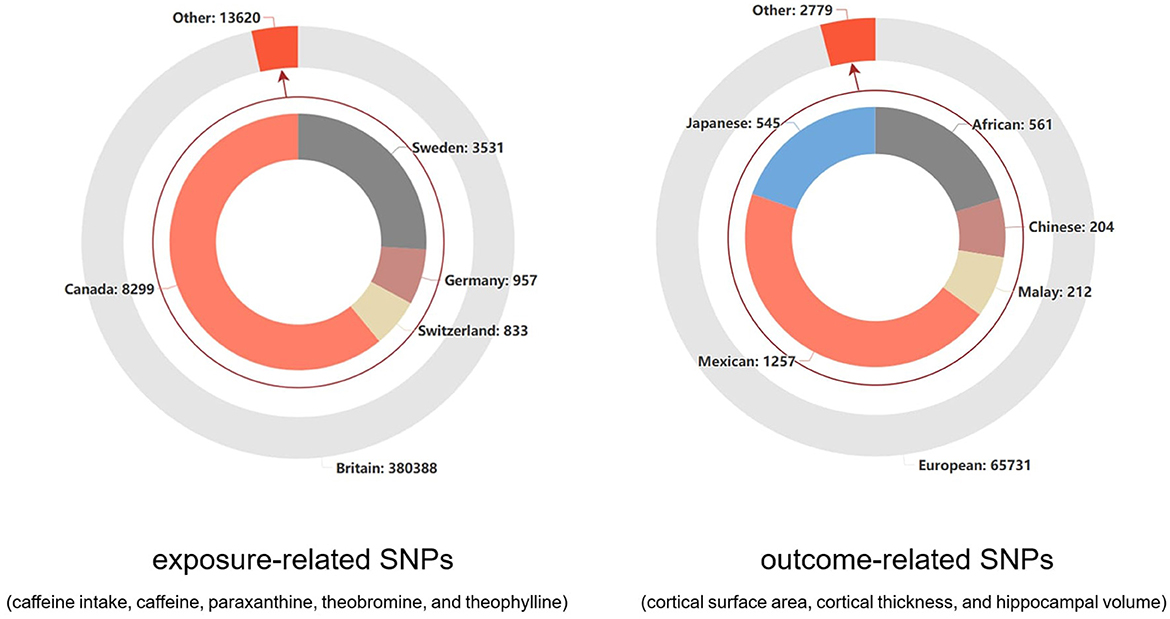
Figure 1. The distribution of study populations corresponding to the SNPs related to outcomes and exposure factors.
2.3 Data sources for the cortical surface area, cortical thickness, and hippocampal volume
For the outcome-related process, the GWAS data related to cortical brain structure were sourced from the ENIGMA consortium (25). They conducted the research using multiple individual brain magnetic resonance imaging data (n = 51,665) and analyzed the surface area and average thickness of the entire cortex, as well as 34 functionally specialized regions. The GWAS data related to hippocampal volume were sourced from another collaboration between the ENIGMA consortium and the CHARGE consortium (26). This GWAS analysis was based on MRI scans and whole-genome genotyping data, with participants from 65 sites (n = 33,536). The cohort information for these two studies is provided in Supplementary Tables S2, S3. The 34 regions of the cerebral cortex were defined based on the Desikan-Killiany atlas, and the regions between the two hemispheres were averaged (27). For the hippocampus, the FSLFIRST algorithm (28) was used to estimate hippocampal volume. In terms of the regional distribution of SNP sources from different cohorts, the European population accounted for an overwhelming majority (95.9%), as shown in Figure 1.
2.4 Selection of genetic instruments
We identified two main exposure groups: (1) those involving coffee intake and (2) those involving caffeine and its direct metabolites. For coffee intake, we used a set of genetic tools, while for caffeine and its direct metabolites, we utilized two sets of genetic tools, encompassing their presence both in the plasma and within metabolic pathways.
To obtain genetic tools with sufficient significance and an adequate number of samples for analysis, we conducted testing and preliminary screening of genetic tools using different P-values (Supplementary Table S10). Additionally, we required a linkage disequilibrium (LD) r2 value of < 0.001 and a distance of < 1 MB from the index variant.
In the initial phase of our analysis, we excluded SNPs that had P-value thresholds corresponding to the brain's cerebral cortex or hippocampus volume. Additionally, we utilized PhenoScanner (http://www.phenoscanner.medschl.cam.ac.uk/) (29, 30) to identify SNPs potentially associated with confounding factors. Following discussions with Jianli Wang and a preliminary analysis, a subset of these SNPs was further excluded.
We considered the independence of the samples using two principles (31): (1) reading the original literature to determine there was no overlap between the exposed and outcome cohorts and (2) calculating the maximum estimated overlap rate. Independence was determined based on compliance with Principle 1, with thresholds for maximum estimated overlap set at 25% and 10%.
Finally, for the potential SNPs that may not exist in the outcome, proxy SNPs were used for substitution analysis (32).
2.5 Mendelian randomization analyses
After the selection of SNPs was completed, MR analysis was conducted based on two different scenarios.
For exposure factors with more than two SNPs, three different MR methods were used under the random effects model: inverse variance weighting (IVW), MR-Egger, and weighted median. IVW was used as the primary result, while MR-Egger and the weighted median were used to estimate the IVW result. MR-Egger was used to assess pleiotropy by considering the presence of an intercept term in the regression (33). The weighted median allows for the inclusion of invalid instrumental variables in the analysis, provided that most instruments are valid. Hence, their results can improve the reference of IVW results. After adjusting the threshold for the agreed-upon p-value, sensitivity analyses were performed on each important analysis result using MR-Egger, IVW, Cochran's Q test, and leave-one-out analysis. MR-Egger and IVW were used for heterogeneity detection, with IVW heterogeneity detection being the primary result, and MR-Egger was used for supplementary interpretation. Although the previous MR-PRESSO studies had already screened and discarded results with high heterogeneity, leave-one-out analysis can further identify specific sources of heterogeneity within an acceptable range. Finally, a funnel plot was used to visualize heterogeneity. The overall workflow of all the analyses is presented in Figure 2.
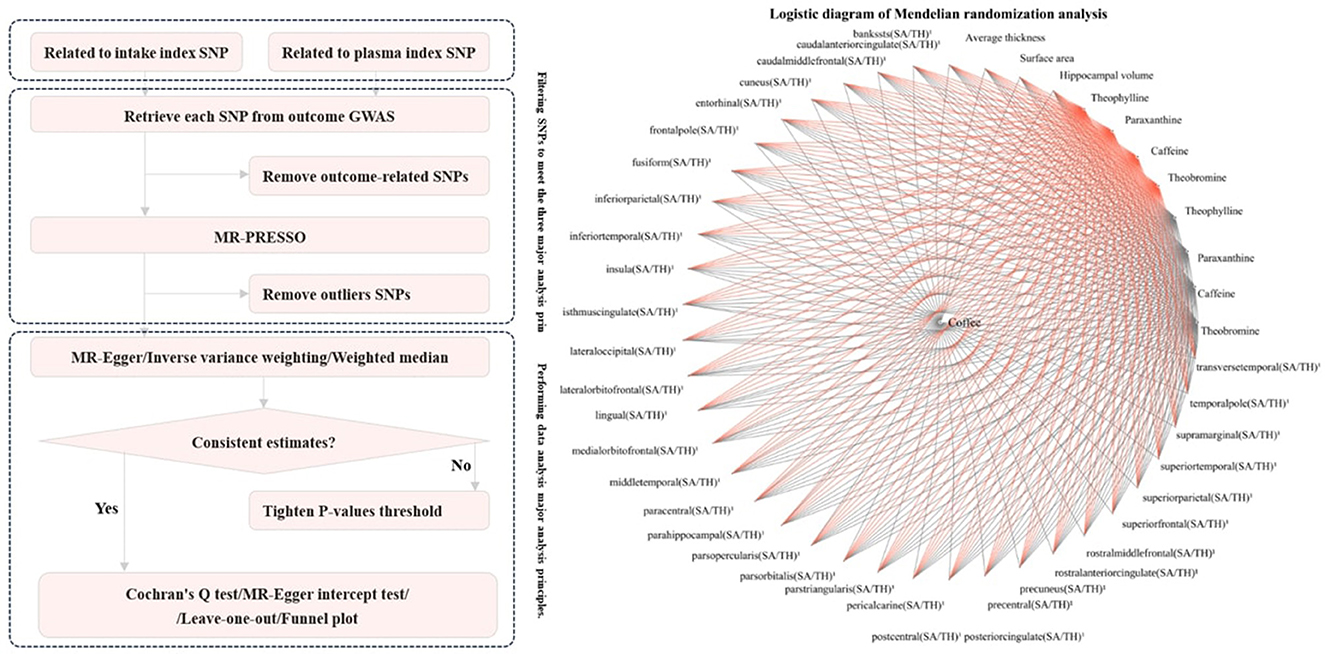
Figure 2. Flowchart of MR analysis for exposure factors with more than 2 SNPs.
For exposure factors with SNP numbers ≤ 2, the IVW method based on weighted least squares provides a more efficient estimate. However, it is not suitable for analyzing outcomes with a single SNP. The Wald ratio, on the other hand, can be used for analyzing outcomes with a single SNP. It is based on comparing ratios and assumes a linear effect of the genetic variant. Although it is more prone to bias, in this case, we chose to analyze the two SNPs using the IVW method based on a random effects model and to analyze the single SNP using the Wald ratio (34).
After determining significant outcomes based on p-values, when the IVW, MR-Egger, and weighted median methods had inconsistent directions, this portion of the results was discarded. When the directions of all three methods were consistent, we consider it to have a significant effect. However, when it was not possible to perform MR-Egger or weighted median analysis due to the number of SNPs or when only Wald ratio analysis could be conducted with potentially larger errors, we considered it a nominally significant effect. In such cases, we used the Wald ratio or IVW estimate as the result.
2.6 Triangular evidence on the impact on the cerebral cortex
Existing research has revealed the impact of diseases on the cerebral cortex. With the help of MR analysis, we can discover the causal effects of coffee, caffeine, and their metabolites on the cerebral cortex. Furthermore, some observational and corresponding MR studies have identified the positive effects of coffee intake on these diseases (this logic is presented in Figure 3). We have collected epidemiological evidence and utilized the Newcastle-Ottawa Scale (NOS) (35) and the Agency for Healthcare Research and Quality (AHRQ) Scale (36) for quality assessment. For the NOS, it employs a star system ranging from 0 to 9 to evaluate participant selection and exposure measurement. A higher score reflects superior study quality, with scores ranging from 7 to 9 indicating high quality. Regarding the AHRQ, it uses a system of 11 inherent questions to evaluate studies. Additionally, we calculated the number of regions in the cerebral cortex affected by diseases and attempted to calculate the overlap rate with the regions affected by coffee, caffeine, and their metabolites. By combining the overlap rate with epidemiological evidence, a higher overlap rate indicates that diseases and coffee act on the same regions of the cerebral cortex through similar mechanisms. The results of this analysis can narrow the selection range for disease pathways or targets. By retrospectively verifying the specific regions of the brain that are positively affected by coffee and other related substances in relation to a particular disease, we can provide further evidence for precise pathway selection. We selected four common diseases (gait disorders, major depressive disorder, Parkinson's disease and type 2 diabetes) and one specific behavior (suicide) as specific outcomes to study the potential similarities and antagonistic effects between the mechanisms of disease on the brain and the effects of coffee or other factors on the brain.
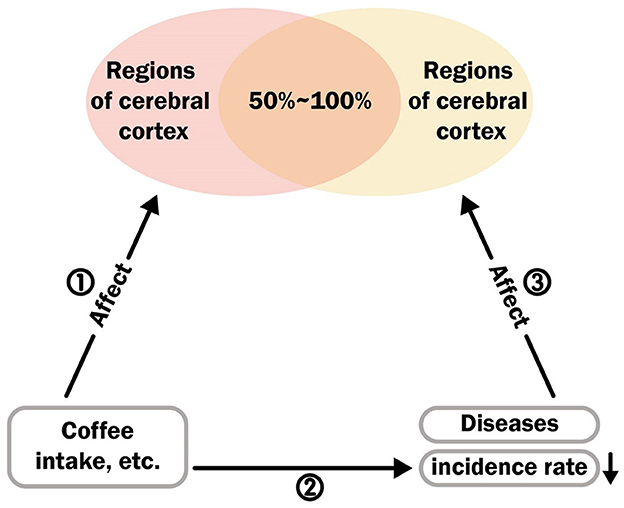
Figure 3. The logical relationship between disease, cerebral cortex, and coffee intake.
2.7 Search approach
To obtain information on the impact of these diseases on cortical morphology and the effects of factors such as coffee intake on these diseases, we searched the PubMed database up to November 1, 2023. We used Medical Subject Headings (MeSH) and relevant keywords. The search terms included “gait disorders,” “cortical morphology,” “type 2 diabetes,” etc. The complete search strategies for each item can be found in Supplementary Table S4.
2.8 Eligibility criteria
The inclusion criteria were divided into two categories. First, for studies on coffee and disease, (1) the exposure factor had to be related to coffee intake, such as the number of cups/day or high coffee intake population. (2) Outcome variables related to the five major diseases or factors were considered. (3) Only observational studies were included. Second, for studies on coffee and cortical brain regions, since the results obtained in MR analysis were averaged across hemispheres, the following criteria were used: (1) The exposure factor had to be related to the five major diseases or factors considered. (2) Clinical contrast studies based on MRI. (3) Outcome variables only considered the average surface area or thickness of the displayed results, or the surface area or thickness of both the left and right hemispheres were included in the displayed results.
2.9 Article confirmation and information collection
The article's confirmation and information collection processes were carried out by the first reviewer (LZN) and the second reviewer (XLJ). After completion, cross-validation and consultation were conducted with a third (CHJ). A predesigned data extraction form was used, and the following data were extracted: outcome factors, first author, publication year, cohort source, outcome definition, corresponding MR studies, and age. Any potential differences were resolved through discussion with the third reviewer (CHJ) to reach a consensus.
2.10 Statistical analysis
The main analyses were conducted using the software packages TwoSampleMR (version 0.5.7) and MRPRESSO (version 1.0) in R (version 4.3.1). Prior to the analysis, the removal of confounding SNPs was performed using PhenoScanner (http://www.phenoscanner.medschl.cam.ac.uk/) (29, 30) and our custom software PhenoScanner-Results-Processor (https://github.com/Ruosining/PhenoScanner-Results-Processor), which was created using vb.net (.NET Framework 4.8). At the global level of testing (including hippocampal volume and cortical regions), a significant two-sided p value was set at 0.05. At the regional level of testing (including 34 cortical regions only), given 1224 MR estimates, the Bonferroni-corrected p value was set at 0.05/1224 (4.08e-5). Additionally, we retained p < 0.05 as nominally significant (37).
3 Results
3.1 Mendelian randomization results
After phenotype screening using the PhenoScanner platform, reading the relevant literature for each phenotype, and triple confirmation by Jianli Wang, we excluded SNPs associated with certain potential confounders, as detailed in Supplementary Table S11.
After screening, a total of 63 SNP indicators were included for genetic prediction of coffee intake and other exposures. These SNPs are presented in Supplementary Table S5. Overall, the F-statistics for these genetic instruments were all >20, indicating that the instruments were strong (38). We conducted a comprehensive MR analysis of 34 brain regions and the hippocampus, focusing on nine different exposures. A total of 1251 analyses were performed. The results, primarily based on the IVW method, yielded 93 positive findings (as shown in Figure 4).
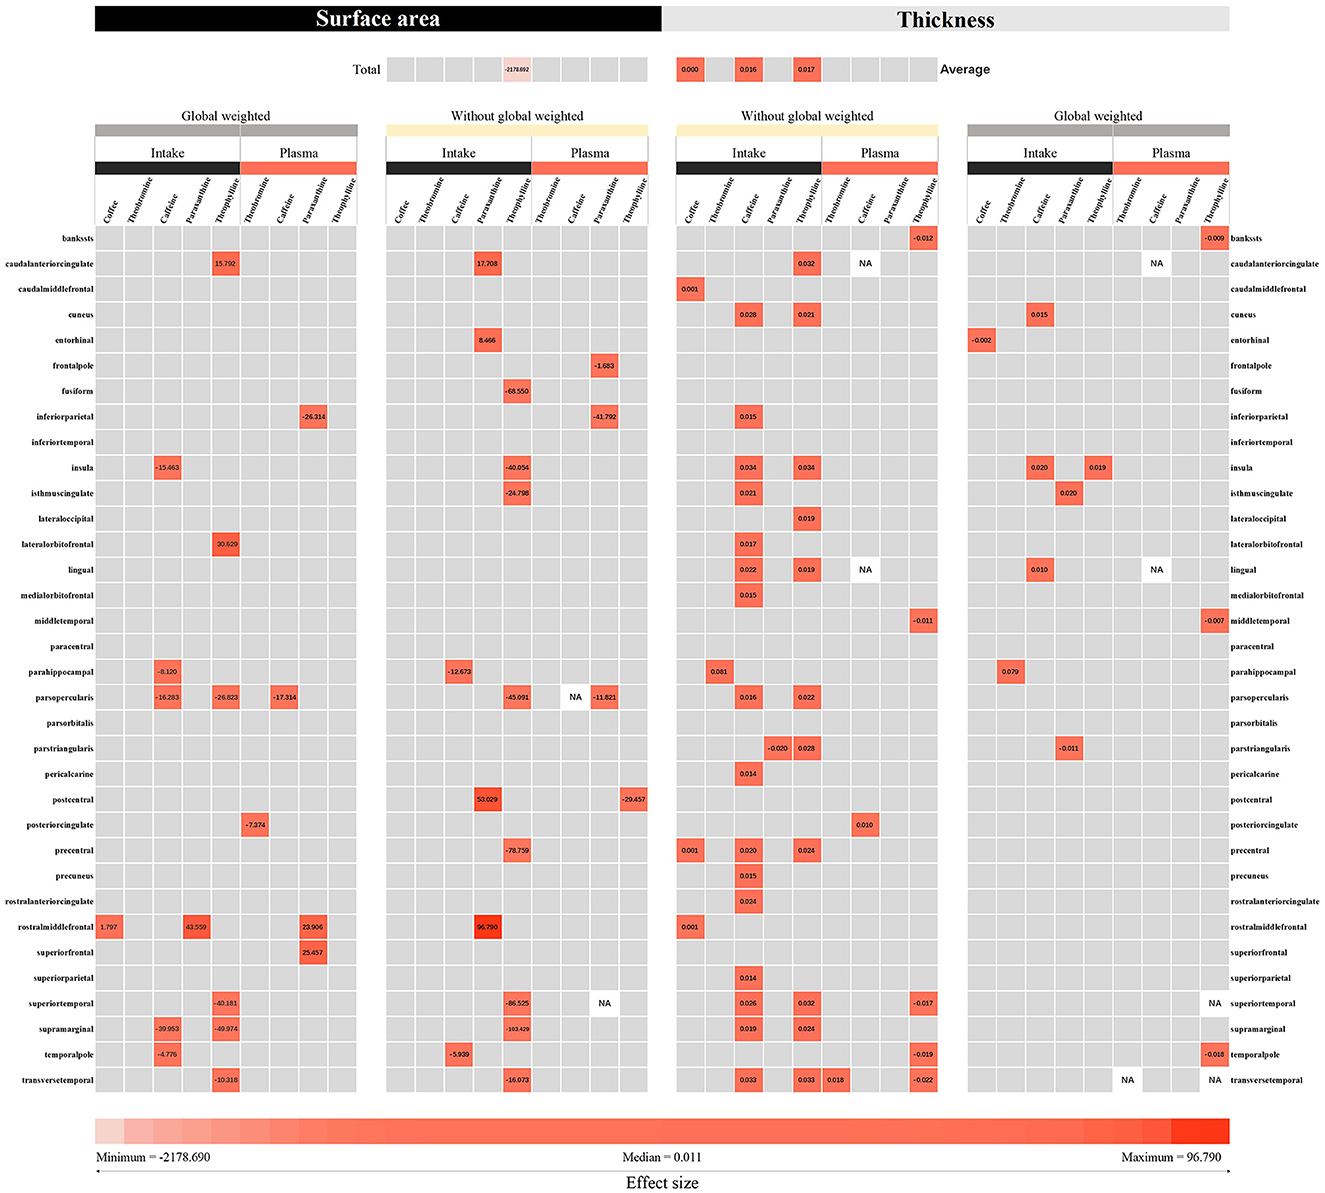
Figure 4. The IVW and Wald ratio methods were used to estimate the intake of coffee and its direct metabolic products, as well as the plasma levels of caffeine, theobromine, theophylline, and paraxanthine in the plasma metabolic pathway. The effects of these compounds on cortical thickness and surface area were measured using MRI. The effect sizes (beta) representing the IVW or Wald ratio method were derived based on the intensity of color blocks. The numerical values displayed in the color blocks represent the corresponding effect sizes. The gray blocks represent results that are not statistically significant. According to our defined criteria, p values below 0.05 were considered nominally significant, while those below the threshold of 4.08e-5 were considered significant.
Among the results with a P-value < 0.05 for the IVW or Wald ratio, 30.1% were found to be significant. In the analysis with hippocampal volume as the outcome variable, theophylline, a pathway metabolite of caffeine in plasma, was found to increase hippocampal volume (β = 0.169 mm3, 95% CI: 0.016 mm3 to 0.323 mm3, P = 0.031). According to our analysis with cortical surface area as the outcome variable, theophylline in plasma, a metabolite in the caffeine metabolic pathway, was found to be associated with a decrease in cortical surface area overall (β = −2,178.690 mm2, 95% CI: −4,265.520 mm2 to −91.867 mm2, P = 0.041). Theophylline (β = 0.017 mm, 95% CI: 0.003 mm to 0.031 mm, P = 0.018) and caffeine (β = 0.016 mm, 95% CI: 0.007 mm to 0.025 mm, P = 0.000) in plasma, both of which are metabolites in the caffeine pathway, were found to be associated with an increase in cortical thickness. An increase in cortical thickness was also associated with the consumption of 50% more coffee (β = 0.0004 mm, 95% CI: 0.000 mm to 0.001 mm, P = 0.005). No causal relationships were found between other exposures and the cortical surface area, total hippocampal volume, or hippocampal volume. Since the IVW method was pre-specified as the primary approach with a random-effects linear IVW model, the observed heterogeneity with a Cochran Q p-value < 0.05 was accepted. Sensitivity analyses for the results with enough SNPs did not reveal any multiplicative effects, and no outliers were found in the MR-PRESSO analysis, leave-one-out analysis, or funnel plots (Supplementary Figure S1).
According to the analysis of 34 functional regions, without global weighting, theophylline in the caffeine pathway, had the greatest impact on the surface area of the supramarginal gyrus (β = −103.429 mm2, 95% CI: −173.819 mm2 to −33.039 mm2, P = 0.004). With global weighting, theophylline in the caffeine pathway had the greatest impact on the surface area of the supramarginal gyrus (β = −49.974 mm2, 95% CI: −97.443 mm2 to −2.504 mm2, P = 0.039). The caffeine metabolite theobromine had the greatest impact on the thickness of the parahippocampal gyrus without global weighting (β = 0.081 mm, 95% CI: 0.011 mm to 0.150 mm, P = 0.023). With respect to global weight, theobromine in the caffeine pathway had the greatest impact on the thickness of the parahippocampal gyrus (β = 0.079 mm, 95% CI: 0.012 mm to 0.146 mm, P = 0.020). Other brain regions with significant or nominally significant findings are displayed in Supplementary Figure S2.
The results of other brain regions with significant or nominally significant findings are displayed in Supplementary Figure S2. Sensitivity analyses, including the Cochran's Q test, MR-Egger test, leave-one-out analysis, and funnel plots, were conducted for a sufficiently large number of SNP exposures, and no evidence of pleiotropy or significant bias was found. The observed heterogeneity was accepted, and no significant bias was detected in the leave-one-out analysis for the individual SNPs (Supplementary Figure S3).
3.2 Triangular evidence
To reflect the potential shared or antagonistic mechanisms between coffee intake and disease factors, which are ultimately manifested in the concentration of brain regions through the cerebral cortex, we summarized the evidence from three aspects in Figure 3 and illustrated this through the overlapping rates of brain regions influenced by the pathways ① and ③. First, for pathway ①, in the MR analysis results, we collected and counted the effects of coffee intake, caffeine and its direct metabolites on the brain regions influenced by theobromine, theophylline, and xanthine. The final results are shown in Supplementary Table S9.
For pathway ②, the retrieval process and selection diagram are listed in Supplementary Figure S4. Five types of observational studies were included to examine the impact of coffee intake on disease incidence. Most of these articles confirm that coffee reduces the risk of potential diseases. Detailed information on these studies is presented in Supplementary Table S6. Excluding some cross-sectional studies that did not show a significant causal relationship, the other studies provided direct evidence for the existence of pathway ②.
For pathway ③, a total of 7 clinical comparative studies involving 14,985 individuals were included (39–45). The age range of the participants was from 9 to 80 years, and their detailed characteristics are presented in Supplementary Table S7. Since MRI-based clinical comparative studies cannot reflect the causal relationship between brain regions and diseases, they provide evidence for the potential existence of pathway ③.
The final quality assessment for pathway ② and ③ revealed that the average score on the NOS was 7 (ranging from 6 to 8), indicating good research quality. For additional detailed results, please refer to Supplementary Table S12.
3.3 Overlap rate of brain regions
In each study included in pathway ③, shown in Figure 3, the impact of disease on the brain regions of the left and right hemispheres was collected (Supplementary Table S8). Finally, the brain regions included in this case, which had an impact on disease in both the left and right hemispheres, were combined with the overall brain regions affected by coffee, caffeine metabolites, theobromine, theophylline, and xanthine (without subgroup adjustment) and the brain regions that underwent subgroup adjustment (including global weighted and non-global weighted) was used to calculate the intersection. The number of common brain regions was divided by the total number of the overall brain regions (without subgroup adjustment) and the number of brain regions that underwent subgroup adjustment (including global weighted and non-global weighted) were used to calculate the overlapping rate of brain regions. The final results are presented in Supplementary Table S9.
Due to the limitations of the current research, clinical control studies have only investigated the correlation between diseases such as gait disorders and the thickness of a few brain regions. The study on suicidal ideation only examined the correlation with brain region surface area. Regardless of whether subgroup analysis was conducted or not and whether global weighting was performed or not, these diseases all demonstrated a relatively high brain region overlap rate (40%−100%).
4 Discussion
As of November 1, 2023, this is the first comprehensive large-scale MR analysis in which we investigated the causal effects of coffee intake, caffeine, and their direct metabolites on brain cortical structure and hippocampal volume. At the same time, this is also the first attempt in neuroscience to use evidence of overlap rates with triangular logic relationships to speculate on common or antagonistic pathways of coffee intake and related factors that may affect certain diseases. Our research findings indicate that coffee, caffeine, and their direct metabolites or their inherent presence in plasma can have an impact on the brain cortex and may have direct or indirect causal relationships. This finding supports the theory proposed by previous scholars that coffee intake may directly affect the brain (46). Furthermore, interpreting the overlap and rate of overlap between various diseases and cortical coffee intake reveals indicate potential targets or pathways for treating or delaying diseases. This significantly narrows the scope of the recently proposed brain-gut axis in the specific application of disease-coffee interactions. Contrary to popular belief (47), we observed that caffeine is not the major factor influencing the size of the brain cortex on the predicted metabolic pathways. In fact, at least at the level of genetic prediction, theobromine and theophylline, which are metabolites of caffeine in the plasma, have the greatest direct or indirect impact on the overall thickness, surface area, and certain brain gyri of the cortex. This provides a clear direction for narrowing the scope of basic research and provides theoretical evidence for future MRI-based cohort studies on coffee intake, which are currently lacking. More importantly, this study provides a greater level of evidence for the current hotly debated claim that coffee intake may have long-lasting effects on brain cortex structure (46).
In recent years, epidemiological observations have consistently shown a time-dependent and dose-dependent impact of coffee consumption on changes in memory and reasoning abilities (48, 49). These effects were statistically significant even after adjusting for factors such as age, sex, education level, social behavior, diabetes status, hypertension, and coronary artery disease. The findings on hippocampal volume provide valuable insights, although proving the direct or indirect nature of these effects is challenging due to confounding factors in observational studies and potential biases in validity (such as residual confounding). At the level of coffee consumption and disease, a clear dose-dependent effect has been observed on certain diseases, particularly vascular dementia (50), type 2 diabetes (51), and Parkinson's disease (52), even after adjusting for BMI, lifestyle behaviors, and ethnicity. By combining the observed improvements with the impact of coffee on the brain cortex, our synthesized evidence provides a reference for potential new therapeutic pathways or targets for these diseases. Establishing causal relationships for these observational studies through long-term randomized controlled trials (the gold standard for causal hypotheses) based on MRI after prolonged coffee intake may be challenging due to ethical limitations and resistance to regular MRI reporting in the general population. Conducting such trials with sufficient sample sizes is also difficult and may not provide adequate evidence. In these circumstances, MR methods provide crucial information about causal relationships, which is of great value in guiding clinical research or basic research. These findings also indirectly support the findings of these observational studies, suggesting that coffee intake-related exposure factors have an impact on the brain cortex, and further speculation can be made that these effects, such as the observed improvement in memory in some RCTs with increased hippocampal volume, but the negative correlation between hippocampal volume changes and memory in the elderly population (53), can be partially explained by the dose-dependent effects of coffee intake on memory. The brain-gut axis is a bidirectional communication system between the brain and the digestive system (54) that interacts through neural, immune, and endocrine pathways. The role of this axis has been confirmed in various neurological and gastrointestinal diseases, such as depression and irritable bowel syndrome. In this study, evidence of overlapping high brain region responses confirmed the high overlap between the effects of coffee on the human cerebral cortex and the areas affected by diseases on the cerebral cortex. Coupled with existing evidence of the potential preventive effects of coffee on diseases, this discovery not only reveals a new perspective on the pathophysiology of diseases but also indicates the potential impact of coffee, a quantifiable impact of coffee on cerebral gyri and its interaction with diseases.
Our study has several notable strengths as well as several limitations. In terms of strengths, first, we introduced the MR design for the first time in this field, which reflects the causal association between coffee intake-related exposure and cortical and hippocampal structures. Additionally, as shown in Figure 1, our study population is predominantly from Europe, which greatly reduces population heterogeneity. Furthermore, careful inclusion of each cohort ensures a good overlap rate between the exposed and outcome populations, controlling for potential low-value causal estimates due to model overfitting. Second, the application of triangulation evidence is noteworthy. Both disease and coffee have been reported to potentially impact the human brain, and the overlapping effects may be related to the alleviation of diseases by coffee. We attempted to summarize the evidence in this area for the first time, providing precise evidence for subsequent basic experiments or clinical trials, including the overlap rate of affected brain regions with disease impact and the various affected brain regions in the Supplementary Table. In addition, we made careful selections within the triangulation evidence, such as the impact of coffee on diseases. Considering the possible reverse causal effects, we chose prospective cohort studies as much as possible to ensure logical sequencing. In terms of limitations, first, in the MR analysis, the choice of genetic instruments was limited in terms of the generalizability and applicability of causal effects worldwide, as our study population consisted mainly of Europeans. Second, although the analysis of the results demonstrated the impact of coffee-related exposure on cortical brain regions, the lack of GWAS data restricted comprehensive subgroup analyses, such as separate subgroup analyses based on sex, region, and age. Additionally, due to the scarcity of research, the impact of coffee on diseases as indicated by the triangulation of evidence has not been fully investigated in higher-tier studies such as randomized controlled trials. Finally, the limited number of SNPs involved in some analyses prevented us from conducting or fully conducting the three main MR methods, primarily IVW and sensitivity analyses. This may have led to potential biases that we were not aware of. In addition, statistical power values were not calculated in the supplementary analyses. Although power values have been used in other MR analyses in different fields and have demonstrated their usefulness, there are no available reference coefficients for the true correlation between the exposure and outcome variables. Thus, genetic predictions based on MR analysis can either amplify or attenuate effects. In the examination of the triangulation evidence, Pathway ① in Figure 3 was based on the assumption of possible true effects in the MR analysis. However, as mentioned earlier regarding the limitations of MR, this does not necessarily indicate the presence of true effects. In Pathway ②, we attempted to select prospective cohorts that reflected certain causal effects as evidence for this pathway. However, it is undeniable that some diseases, such as gait disorders, lack effective prospective cohorts, and the directionality may not be fully established. Therefore, Pathway ② for some of these diseases can only be considered a hypothesis based on existing cross-sectional analyses. For Pathway ③, clinical comparative studies effectively reflect the changes in cortical brain structures caused by diseases, and these regions had a high overlap with the regions affected by coffee. However, this does not completely indicate that the substances related to coffee intake and diseases act on the same pathway, although their effects on the outcome regions are consistent. Therefore, the conclusion that the pathways leading to changes in these overlapping regions are overlapping or concentrated in these regions needs to be interpreted cautiously, considering the observed improvement in diseases due to substances related to coffee intake in observational studies.
In conclusion, our study provides a platform for researchers to explore the factors related to coffee intake and their impact on brain structure. It has yielded some remarkable findings in terms of causal logic, such as the effects of theobromine and theophylline on the cortical level. This study also offers valuable directions for future clinical and basic research based on triangulation evidence. Future studies can utilize the identified regions to infer pathways or mechanisms. Additionally, more clinical studies with strong causal effects and triangulation evidence should be conducted to further explore the potential preventive applications for these diseases by investigating the effects of coffee on the brain.
5 Conclusions
This is the first comprehensive application of MR analysis and triangulation evidence revealing causal effects between coffee intake-related exposures and the cerebral cortex and hippocampus. Genetic prediction suggests that the increase in hippocampal volume and decrease in total cortical surface area from coffee intake are mainly driven by theobromine, a pathway involved in caffeine metabolism. This provides evidence for interpreting the effects of coffee intake and supports the presence of persistent changes in the brain due to coffee intake from a causal perspective. The overlap in the triangulation evidence revealed a significant correlation between the effects of gait disorders, major depression, Parkinson's disease, type 2 diabetes, suicide and the cerebral cortex, and the effects of coffee on the cerebral cortex. Further research is needed to investigate the specific mechanisms corresponding to these brain regions.
Data availability statement
The original contributions presented in the study are included in the article/Supplementary material, further inquiries can be directed to the corresponding authors.
Ethics statement
Ethical review and approval was not required for the study on human participants in accordance with the local legislation and institutional requirements. Written informed consent from the participants was not required to participate in this study in accordance with the national legislation and the institutional requirements.
Author contributions
ZiL: Conceptualization, Data curation, Formal analysis, Investigation, Methodology, Resources, Software, Supervision, Validation, Visualization, Writing – original draft, Writing – review & editing. LX: Investigation, Validation, Writing – review & editing. XX: Investigation, Validation, Writing – review & editing. MS: Investigation, Validation, Writing – review & editing. YM: Investigation, Validation, Visualization, Writing – review & editing. HC: Investigation, Validation, Writing – review & editing. ZheL: Investigation, Resources, Software, Supervision, Validation, Writing – review & editing. ZhiL: Validation, Writing – review & editing, Software. JW: Validation, Writing – review & editing, Conceptualization, Formal analysis, Methodology, Supervision. YL: Conceptualization, Data curation, Formal analysis, Funding acquisition, Methodology, Project administration, Resources, Supervision, Writing – review & editing.
Funding
This research was supported by the Bureau of Science and Technology Nanchong city (22SXQT0356 to YL), the Affiliated Hospital of North Sichuan Medical College (2021LC010 to YL), the Bureau of Science and Technology Nanchong city (19SXHZ0482 to ZheL), Construction of First-class Courses in Sichuan Province (202212694 to ZheL), Higher Education Talent Training Quality and Teaching Reform Project of North Sichuan Medical College (JG202408 to ZheL), and the Student College Computer Design Competition of Sichuan (JN24-11 to ZheL).
Acknowledgments
We would like to thank Zhong et al., Cornelis et al., and Chen et al. for their research contributions and the ENIGMA consortium for providing the GWAS data. Finally, we extend our gratitude to Yanzhang Feng (Department of Oral Medicine, North Sichuan Medical College) and Lijuan Zhou (Department of Anesthesiology, North Sichuan Medical College) for their consultation and assistance in some data analysis.
Conflict of interest
The authors declare that the research was conducted in the absence of any commercial or financial relationships that could be construed as a potential conflict of interest.
Publisher's note
All claims expressed in this article are solely those of the authors and do not necessarily represent those of their affiliated organizations, or those of the publisher, the editors and the reviewers. Any product that may be evaluated in this article, or claim that may be made by its manufacturer, is not guaranteed or endorsed by the publisher.
Supplementary material
The Supplementary Material for this article can be found online at: https://www.frontiersin.org/articles/10.3389/fnut.2024.1351067/full#supplementary-material
References
1. The United States Department of Agriculture (USDA). Available online at: https://www.usda.gov/ (accessed December 20, 2023).
2. George SE, Ramalakshmi K, Mohan Rao LJ. A perception on health benefits of coffee. Crit Rev Food Sci. (2008) 48:464–86. doi: 10.1080/10408390701522445
3. Scarselli E, Legnaioli M, Becattini U, Cangi G. The action of coffee and of caffeine by intravenous and intracarotid route on cerebral circulation of man. G Gerontol. (1960) 8:776–88.
4. Aeschbacher HU, Atkinson J, Domahidy B. The effect of caffeine on barbiturate sleeping time and brain level. J Pharmacol Exp Ther. (1975) 192:635–41.
5. Mayer C, Nägele FL, Petersen M, Schell M, Aarabi G, Beikler T, et al. Association between coffee consumption and brain MRI parameters in the Hamburg City health study. Nutrients. (2023) 15:674. doi: 10.3390/nu15030674
6. Cornelis M. The impact of caffeine and coffee on human health. Nutrients. (2019) 11:416. doi: 10.3390/nu11020416
7. Verlinden VJ, Maksimovic A, Mirza SS, Ikram MA, Kiefte-de Jong JC, Hofman A, et al. The associations of alcohol, coffee and tobacco consumption with gait in a community-dwelling population. Eur J Clin Nutr. (2015) 70:116–122. doi: 10.1038/ejcn.2015.120
8. Ruusunen A, Lehto SM, Tolmunen T, Mursu J, Kaplan GA, Voutilainen S. Coffee, tea and caffeine intake and the risk of severe depression in middle-aged Finnish men: the Kuopio Ischaemic heart disease risk factor study. Public Health Nutr. (2010) 13:1215–20. doi: 10.1017/S1368980010000509
9. Hu G, Bidel S, Jousilahti P, Antikainen R, Tuomilehto J. Coffee and tea consumption and the risk of Parkinson's disease. Movement Disord. (2007) 22:2242–8. doi: 10.1002/mds.21706
10. Kolb H, Martin S, Kempf K. Coffee and lower risk of type 2 diabetes: arguments for a causal relationship. Nutrients. (2021) 13:1144. doi: 10.3390/nu13041144
11. Burke TM, Markwald RR, McHill AW, Chinoy ED, Snider JA, Bessman SC, et al. Effects of caffeine on the human circadian clock in vivo and in vitro. Sci Transl Med. (2015) 7:5125. doi: 10.1126/scitranslmed.aac5125
12. Paiva I, Cellai L, Meriaux C, Poncelet L, Nebie O, Saliou JM, et al. Caffeine intake exerts dual genome-wide effects on hippocampal metabolism and learning-dependent transcription. J Clin Invest. (2022) 132:e149371. doi: 10.1172/JCI149371
13. Pham K, Mulugeta A, Zhou A, O'Brien JT, Llewellyn DJ, Hyppönen E. High coffee consumption, brain volume and risk of dementia and stroke. Nutr Neurosci. (2021) 25:2111–22. doi: 10.1080/1028415X.2021.1945858
14. Zheng B, Niu P. Higher coffee consumption is associated with reduced cerebral gray matter volume: a mendelian randomization study. Front Nutr. (2022) 9:850004. doi: 10.3389/fnut.2022.850004
15. Combrisson H. Expérimentation animale, peut-on s'en passer? Transfus Clin Biol. (2017) 24:93–5. doi: 10.1016/j.tracli.2017.06.005
16. Button KS, Ioannidis JPA, Mokrysz C, Nosek BA, Flint J, Robinson ESJ, et al. Power failure: why small sample size undermines the reliability of neuroscience. Nat Rev Neurosci. (2013) 14:365–76. doi: 10.1038/nrn3475
17. Chen X, Kong J, Diao X, Cai J, Zheng J, Xie W, et al. Depression and prostate cancer risk: a Mendelian randomization study. Cancer Med-Us. (2020) 9:9160–7. doi: 10.1002/cam4.3493
18. Davey Smith G, Hemani G. Mendelian randomization: genetic anchors for causal inference in epidemiological studies. Hum Mol Genet. (2014) 23:R89–98. doi: 10.1093/hmg/ddu328
19. Page MJ, McKenzie JE, Bossuyt PM, Boutron I, Hoffmann TC, Mulrow CD, et al. The PRISMA 2020 statement: an updated guideline for reporting systematic reviews. PLoS Med. (2021) 18:e1003583. doi: 10.1371/journal.pmed.1003583
20. Skrivankova VW, Richmond RC, Woolf BAR, Yarmolinsky J, Davies NM, Swanson SA, et al. Strengthening the reporting of observational studies in epidemiology using Mendelian randomization. Jama-J Am Med Assoc. (2021) 326:1614. doi: 10.1001/jama.2021.18236
21. Zhong VW, Kuang A, Danning RD, Kraft P, van Dam RM, Chasman DI, et al. A genome-wide association study of bitter and sweet beverage consumption. Hum Mol Genet. (2019) 28:2449–57. doi: 10.1093/hmg/ddz061
22. Cornelis MC, Kacprowski T, Menni C, Gustafsson S, Pivin E, Adamski J, et al. Genome-wide association study of caffeine metabolites provides new insights to caffeine metabolism and dietary caffeine-consumption behavior. Hum Mol Genet. (2016) 25:ddw334. doi: 10.1093/hmg/ddw334
23. Chen Y, Lu T, Pettersson-Kymmer U, Stewart ID, Butler-Laporte G, Nakanishi T, et al. Genomic atlas of the plasma metabolome prioritizes metabolites implicated in human diseases. Nat Genet. (2023) 55:44–53. doi: 10.1038/s41588-022-01270-1
24. Yuan S, Larsson SC. Coffee and caffeine consumption and risk of kidney stones: a Mendelian randomization study. Am J Kidney Dis. (2022) 79:9–14. doi: 10.1053/j.ajkd.2021.04.018
25. Grasby KL, Jahanshad N, Painter JN, Colodro-Conde L, Bralten J, Hibar DP, et al. The genetic architecture of the human cerebral cortex. Science. (2020) 367:eaay6690.
26. Hibar DP, Adams HH, Jahanshad N, Chauhan G, Stein JL, Hofer E, et al. Novel genetic loci associated with hippocampal volume. Nat Commun. (2017) 8:13624. doi: 10.1038/ncomms13624
27. Desikan RS, Ségonne F, Fischl B, Quinn BT, Dickerson BC, Blacker D, et al. An automated labeling system for subdividing the human cerebral cortex on MRI scans into gyral based regions of interest. Neuroimage. (2006) 31:968–80. doi: 10.1016/j.neuroimage.2006.01.021
28. Patenaude B, Smith SM, Kennedy DN, Jenkinson M. A Bayesian model of shape and appearance for subcortical brain segmentation. Neuroimage. (2011) 56:907–22. doi: 10.1016/j.neuroimage.2011.02.046
29. Kamat MA, Blackshaw JA, Young R, Surendran P, Burgess S, Danesh J, et al. PhenoScanner V2: an expanded tool for searching human genotype–phenotype associations. Bioinformatics. (2019) 35:4851–3. doi: 10.1093/bioinformatics/btz469
30. Staley JR, Blackshaw J, Kamat MA, Ellis S, Surendran P, Sun BB, et al. PhenoScanner: a database of human genotype–phenotype associations. Bioinformatics. (2016) 32:3207–9. doi: 10.1093/bioinformatics/btw373
31. Burgess S, Davies NM, Thompson SG. Bias due to participant overlap in two-sample Mendelian randomization. Genet Epidemiol. (2016) 40:597–608. doi: 10.1002/gepi.21998
32. Meesters C, Leber M, Herold C, Angisch M, Mattheisen M, Drichel D, et al. Quick, “imputation-free” meta-analysis with proxy-SNPs. BMC Bioinf. (2012) 13:1. doi: 10.1186/1471-2105-13-231
33. Burgess S, Thompson SG. Interpreting findings from Mendelian randomization using the MR-Egger method. Eur J Epidemiol. (2017) 32:377–89. doi: 10.1007/s10654-017-0255-x
34. Gudicha DW, Schmittmann VD, Vermunt JK. Statistical power of likelihood ratio and Wald tests in latent class models with covariates. Behav Res Methods. (2016) 49:1824–37. doi: 10.3758/s13428-016-0825-y
35. Wells G. The Newcastle-Ottawa Scale (NOS) for assessing the quality of nonrandomised studies. Available online at: https://www.ohri.ca/programs/clinical_epidemiology/oxford.asp (accessed December 20, 2023).
37. Haynes W. Bonferroni Correction. New York: Springer (2013). p. 154. doi: 10.1007/978-1-4419-9863-7_1213
38. Pierce BL, Ahsan H, VanderWeele TJ. Power and instrument strength requirements for Mendelian randomization studies using multiple genetic variants. Int J Epidemiol. (2010) 40:740–52. doi: 10.1093/ije/dyq151
39. Gifuni AJ, Chakravarty MM, Lepage M, Ho TC, Geoffroy M, Lacourse E, et al. Brain cortical and subcortical morphology in adolescents with depression and a history of suicide attempt. J Psychiat Neurosci. (2021) 46:E347–57. doi: 10.1503/jpn.200198
40. Ronan L, Alexander-Bloch A, Fletcher PC. Childhood obesity, cortical structure, and executive function in healthy children. Cereb Cortex. (2019) 30:2519–28. doi: 10.1093/cercor/bhz257
41. Schmaal L, Group FTED, Hibar DP, Sämann PG, Hall GB, Baune BT, et al. Cortical abnormalities in adults and adolescents with major depression based on brain scans from 20 cohorts worldwide in the ENIGMA Major Depressive Disorder Working Group. Mol Psychiatr. (2016) 22:900–9. doi: 10.1038/mp.2016.60
42. Chen Z, Sun J, Yang Y, Lou X, Wang Y, Wang Y, et al. Cortical thinning in type 2 diabetes mellitus and recovering effects of insulin therapy. J Clin Neurosci. (2015) 22:275–9. doi: 10.1016/j.jocn.2014.07.014
43. Seo SW, Ahn J, Yoon U, Im K, Lee JM, Tae Kim S, et al. Cortical thinning in vascular mild cognitive impairment and vascular dementia of subcortical type. J Neuroimaging. (2009) 20:37–45. doi: 10.1111/j.1552-6569.2008.00293.x
44. Wang Y, Jiang Y, Lu H, Tian W, Li P, Xu K, et al. Cross-sectional associations between cortical thickness and independent gait domains in older adults. J Am Geriatr Soc. (2022) 70:2610–20. doi: 10.1111/jgs.17840
45. Lyoo CH, Ryu YH, Lee MS. Topographical distribution of cerebral cortical thinning in patients with mild Parkinson's disease without dementia. Movement Disord. (2010) 25:496–9. doi: 10.1002/mds.22975
46. That quick morning coffee might lead to enduring brain changes. Nature. (2022) 606:230. doi: 10.1038/d41586-022-01487-4
47. Nieber, K. The impact of coffee on health. Planta Med. (2017) 83:1256–63. doi: 10.1055/s-0043-115007
48. Araújo L, Giatti L, Reis R, Goulart A, Schmidt M, Duncan B, et al. Inconsistency of association between coffee consumption and cognitive function in adults and elderly in a cross-sectional study (ELSA-Brasil). Nutrients. (2015) 7:9590–601. doi: 10.3390/nu7115487
49. Cornelis MC, Weintraub S, Morris MC. Recent caffeine drinking associates with cognitive function in the UK Biobank. Nutrients. (2020) 12:1969. doi: 10.3390/nu12071969
50. Zhang Y, Yang H, Li S, Li W, Wang Y. Consumption of coffee and tea and risk of developing stroke, dementia, and poststroke dementia: a cohort study in the UK Biobank. PLoS Med. (2021) 18:e1003830. doi: 10.1371/journal.pmed.1003830
51. Ding M, Bhupathiraju SN, Chen M, van Dam RM, Hu FB. Caffeinated and decaffeinated coffee consumption and risk of type 2 diabetes: a systematic review and a dose-response meta-analysis. Diab Care. (2014) 37:569–86. doi: 10.2337/dc13-1203
52. Kandinov B, Giladi N, Korczyn AD. Smoking and tea consumption delay onset of Parkinson's disease. Parkinsonism Relat D. (2009) 15:41–6. doi: 10.1016/j.parkreldis.2008.02.011
53. Van Petten C. Relationship between hippocampal volume and memory ability in healthy individuals across the lifespan: review and meta-analysis. Neuropsychologia. (2004) 42:1394–413. doi: 10.1016/j.neuropsychologia.2004.04.006
Keywords: coffee, caffeine, metabolites, cerebral cortex, hippocampal, Mendelian randomization
Citation: Luo Z, Xiong L, Xu X, Sun M, Mu Y, Chen H, Liu Z, Luo Z, Wang J and Liu Y (2024) The relationship between coffee-related factors and cortical and hippocampal structure: a triangulation of evidence approach and Mendelian randomization research. Front. Nutr. 11:1351067. doi: 10.3389/fnut.2024.1351067
Received: 12 December 2023; Accepted: 30 April 2024;
Published: 21 May 2024.
Edited by:
Lauren O'Connor, National Cancer Institute (NIH), United StatesReviewed by:
Chenghan Xiao, Sichuan University, ChinaShilong Su, Peking University Third Hospital, China
Copyright © 2024 Luo, Xiong, Xu, Sun, Mu, Chen, Liu, Luo, Wang and Liu. This is an open-access article distributed under the terms of the Creative Commons Attribution License (CC BY). The use, distribution or reproduction in other forums is permitted, provided the original author(s) and the copyright owner(s) are credited and that the original publication in this journal is cited, in accordance with accepted academic practice. No use, distribution or reproduction is permitted which does not comply with these terms.
*Correspondence: Zhenglong Liu, 1526583@qq.com; Zhiyong Luo, luozhiyong08@cdut.edu.cn; Jianli Wang, 21640785@qq.com; Ying Liu, yingliu000666@nsmc.edu.cn
†These authors have contributed equally to this work