A Mendelian randomization study to examine the causal associations of circulating micronutrient levels with frailty risk
 Kaidiriyan Kuribanjiang1
  Yiping Min2
  Shikang Yan1
  Simin Chen1
  Nuerbiyamu Aiheti1 Abudunaibi Wupuer1 Jie Wang2 Xing Peng1 Yihan Li2 Huilong Li2
  Yiran Dong2 Yuanlin Fan2
  Lei Yang1,3*†
  Jianping Zhao2*†
- 1Department of Epidemiology and Health Statistics, School of Public Health, Xinjiang Medical University, Ürümqi, Xinjiang, China
- 2College of Mathematics and System Science, Xinjiang University, Ürümqi, Xinjiang, China
- 3State Key Laboratory of Causes and Prevention of High Morbidity in Central Asia Jointly Established by the Ministry and the Province Urumqi, Ürümqi, Xinjiang, China
Background: Observational studies have shown that micronutrients can affect the occurrence of frailty. However, it is not clear whether there is a causal relationship between the two. This study aimed to explore the causal relationship between circulating micronutrient levels and frailty risk using a two-sample Mendelian randomization (TSMR) approach.
Methods: We gathered and screened instrumental variables (IVs) for six circulating micronutrients, including vitamin B12, vitamin B6, folate, vitamin C, vitamin D, and vitamin E, from published genome-wide association studies (GWAS) and the IEU OpenGWAS open database. Summary statistics for frailty were obtained from a GWAS meta-analysis, including the UK Biobank and TwinGene (N = 175,226). We performed two independent TSMR analyses and a meta-analysis based on the two independent MR estimates to assess the causal relationship between circulating micronutrientn and frailty.
Results: Our study found, no causal relationship between genetically predicted vitamin D (β = −0.059, p = 0.35), vitamin B6 (β = 0.006, p = 0.80), vitamin E (β = −0.011, p = 0.79), vitamin C (β = −0.044, p = 0.06), vitamin B12 (β = −0.027, p = 0.37), and folate (β = 0.029, p = 0.17), with frailty.
Conclusion: This study showed that these six micronutrients did not reduce the risk of developing frailty. However, we think it is necessary further to investigate the relationship and mechanisms between micronutrients and frailty using methods such as randomized controlled trials.
1 Introduction
Frailty has become a serious health concern as the world’s population ages (1, 2). Frailty is essentially described as an age-related reduction in physiologic reserve and function across multiple organ systems that diminishes the body’s capacity to deal with daily or acute stresses (3–5). Frailty has been connected to poor health outcomes that involve an increased chance of falling, disability, hospitalization, and death, and it puts a more significant strain on society’s health care resources (6–8). Based on how it is measured, frailty prevalence varies. Recent studies indicated that using the phenotypic frailty evaluation, the prevalence of frailty in the population was 12%, but the predicted prevalence of frailty based on the Frailty Index (FI) was roughly 24% (9–12). Frailty is reversible and may be prevented by altering its risk factors.
With age, gastric motility, and gastrointestinal hormones change (13), which can alter dietary preferences and intake as well as affect macro- and micronutrient absorption. As a result, older persons are more susceptible to protein-energy and micronutrient malnutrition. Of these, the consequences of micronutrient deficiencies are sometimes permanent (14). Epidemiological studies have shown a correlation between micronutrients and frailty. Xiong et al. found, a negative association between vitamin D and risk of frailty (15). In addition, a study by Das et al. showed that low vitamin E intake was significantly associated with a high prevalence of frailty (16). A cross-sectional survey from Japan identified that folate and vitamin C were significantly associated with frailty status in men (17). Cheng et al. conducted a study on vitamin B intake and risk of frailty in chronic obstructive pulmonary disease (COPD) patients and found (18) that COPD patients with lower vitamin B6 intake have a higher risk of frailty. The a cross-sectional study of Soh et al. have shown, low vitamin B12 in the blood increased the incidence of frailty (19). However, observational studies are susceptible to confounding factors, which may lead to misestimation of the actual association between exposure and outcome. Thus, the existence of a causal relationship between circulating micronutrients and frailty is unclear, and a methodology that can account for causality is needed to explore the relationship between them.
Mendelian randomization (MR) is an approach for determining the causal relationship between risk variables and disease (20). MR effectively mitigates the influence of confounding factors via the use of genetic differences as IVs (20). The random assignment of alleles influencing genetic variants during conception, unaffected by environmental factors or unknown confounding variables, allows for MR analysis that resembles naturally occurring randomized controlled trials. Thus, this approach enables the assessment of connections between exposure and outcome at the genetic level while eliminating the potential for reverse causality (20, 21). Nevertheless, there has been a shortage of research that uses MR analysis to investigate the connection between micronutrients and frailty.
This study used the two-sample Mendelian randomization (TSMR) method to investigate, the causal relationship between micronutrients of vitamin B12, vitamin B6, folate, vitamin C, vitamin D, and vitamin E with frailty, designed to provide new insights into the prevention of frailty.
2 Methods
2.1 Study design
In this study, we used circulating micronutrients as an exposure variable and frailty as an outcome variable, conducted a TSMR Investigating the probable causative association between the six micronutrients (vitamins B12, B6, C, D, E, and folate) with frailty (Figure 1A). We performed MR analysis using published genome-wide association studies (GWAS). After that, we performed a secondary analysis using the OpenGWAS database. Finally, a meta-analysis was performed on the two MR results. The flowchart of the design of this study is shown in Figure 1B. This MR investigation met the three basic assumptions described in Supplementary Figure S1. Based on the first assumption (Relevance), IVs were strongly linked with exposure. According to assumption 2 (Independence), IVs must be free of any confounders related to exposure and outcome. Based on Assumption 3 (Exclusivity), IVs can only affect outcomes via exposure. This research used publicly accessible data, thereby obviating the need for ethical clearance and informed consent.
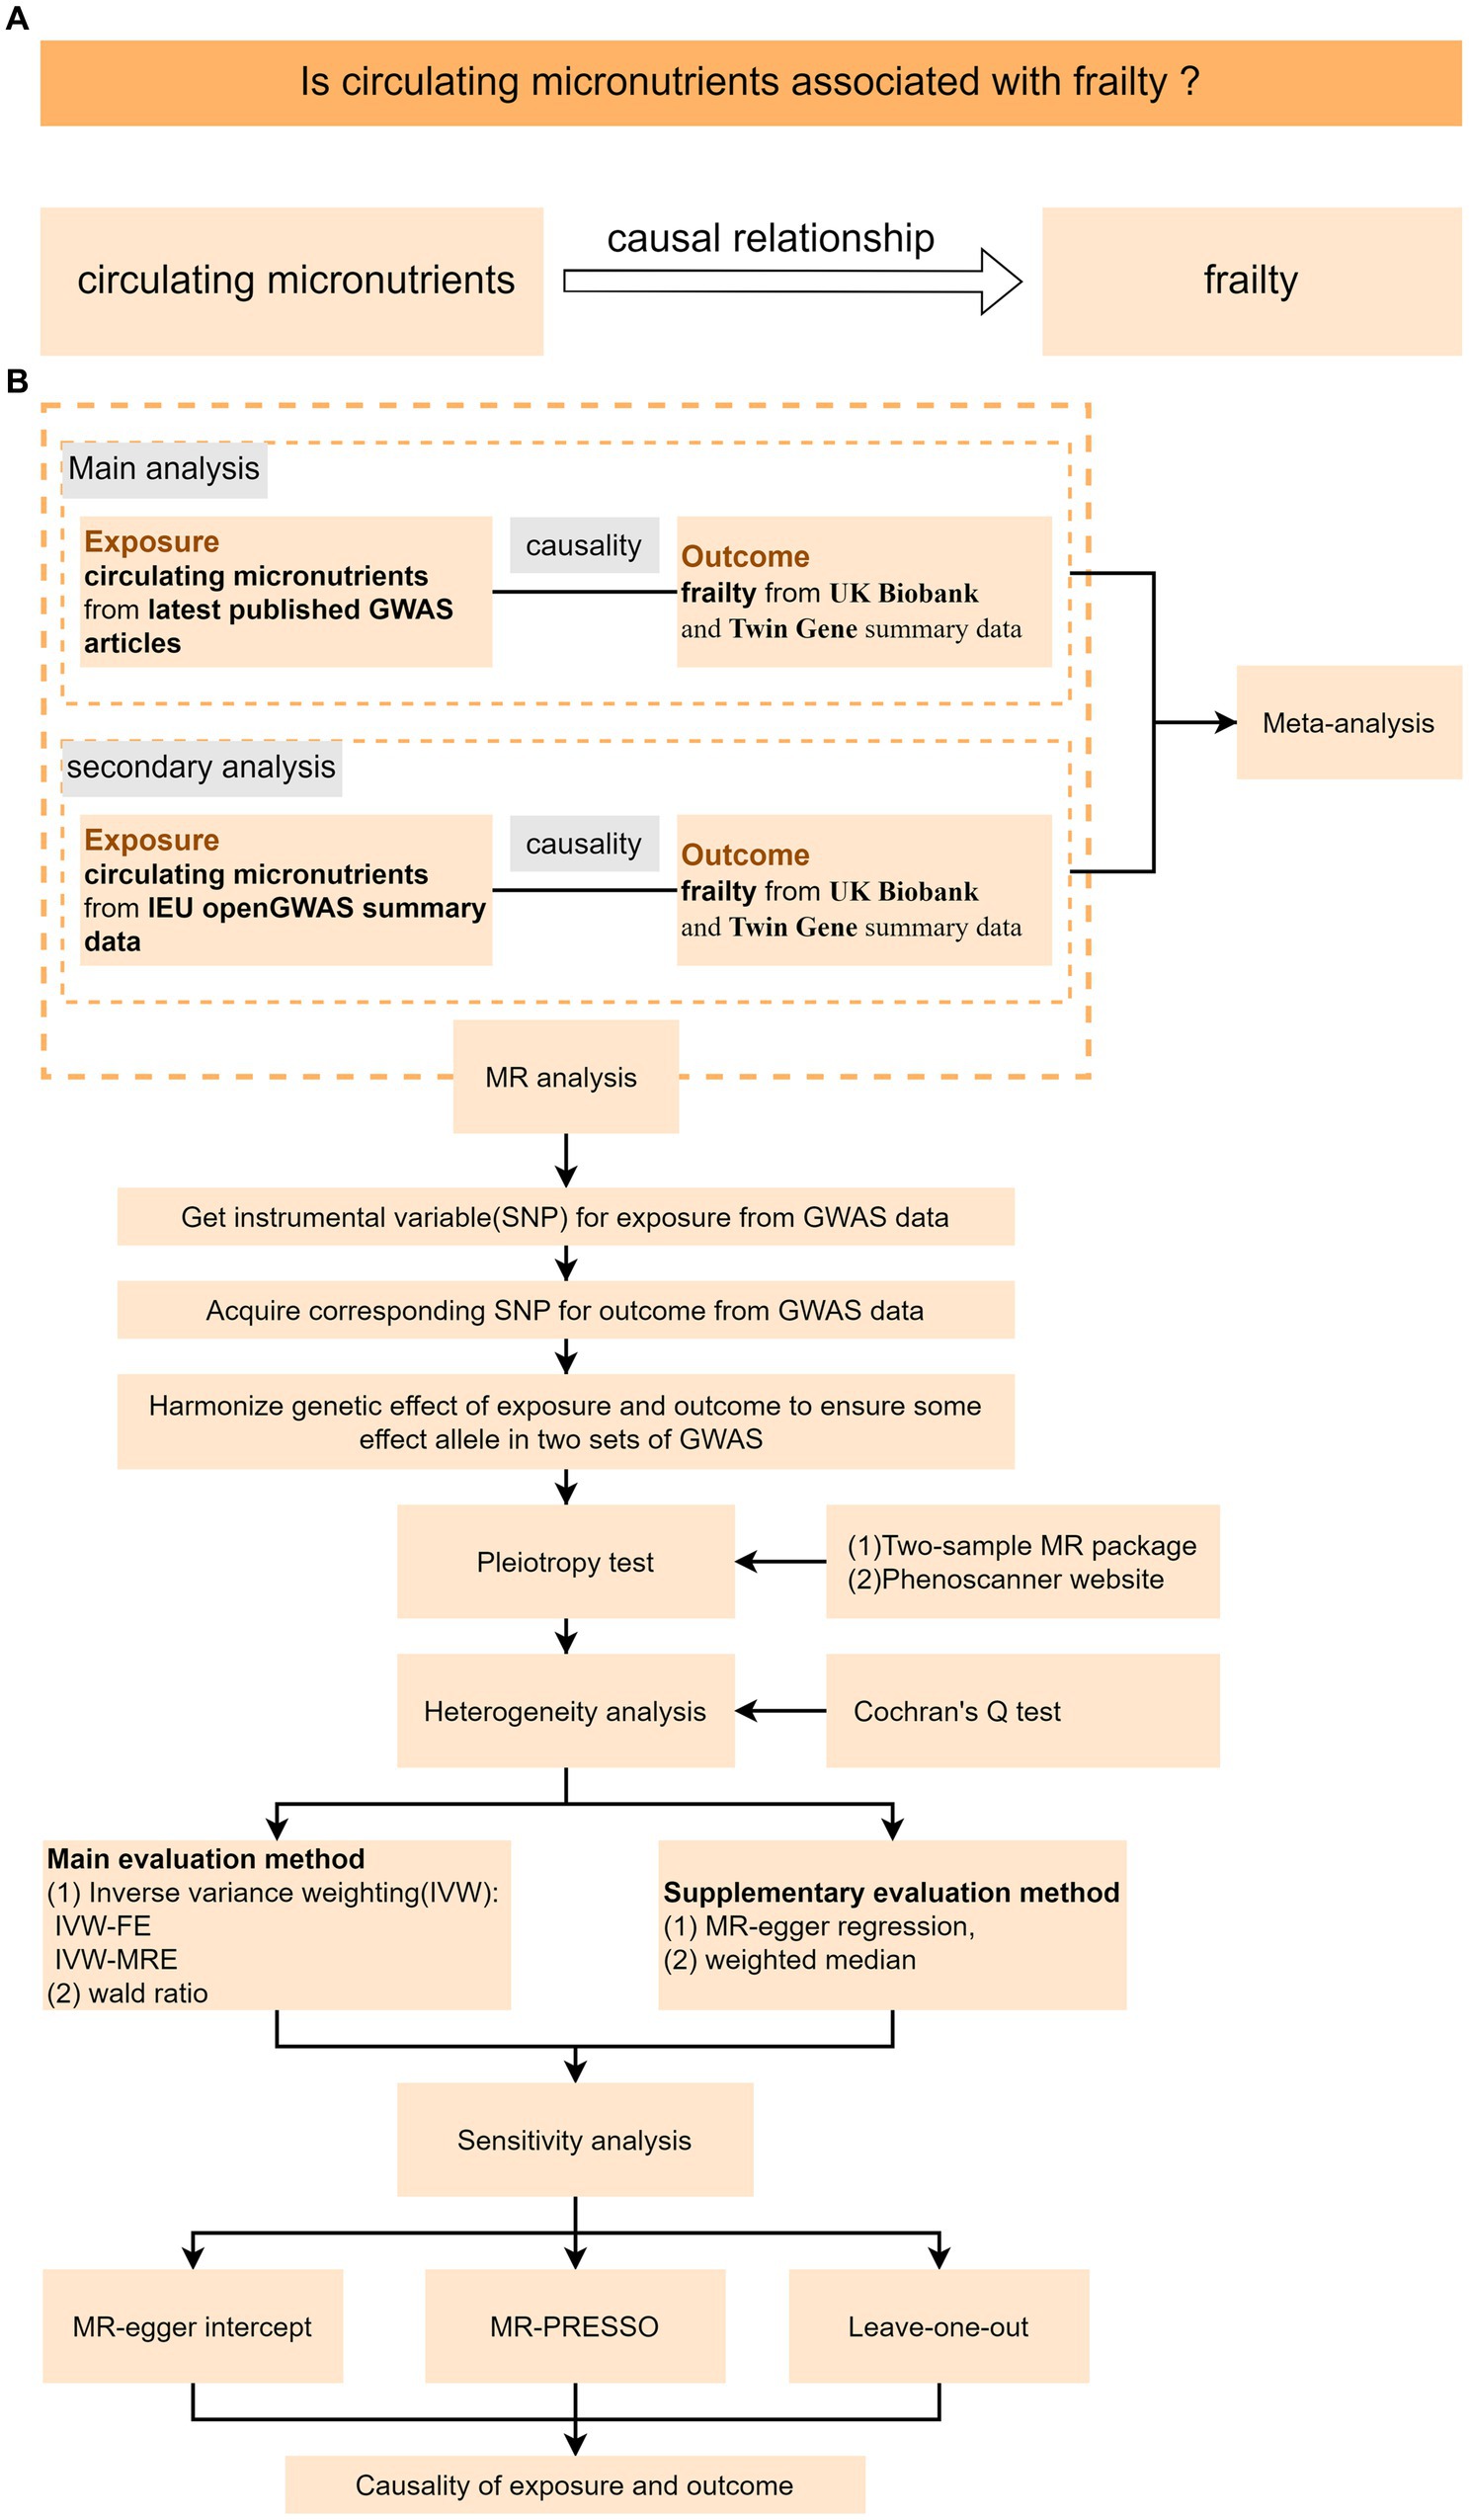
Figure 1. Schematic diagram of the TSMR study. (A) MR analysis’s research design. (B) MR analysis’s flow chart; IVW-FW stands for fixed for fixed effect inverse variance weighted model, while IVW-MRE stands for multiple inactive random-effect inverse variance weighted model.
2.2 Exposure data sources
The IEU OpenGWAS database1 and PubMed2 were searched for published GWAS examining people with European ancestry (the most recent search was done in May 2023). Vitamins B12, B6, C, and folate were obtained from published GWASs, while vitamin D data were obtained from the SUNLIGHT Consortium and vitamin E data from IEU OpenGWAS. Detailed information on exposure data is provided in Table 1.
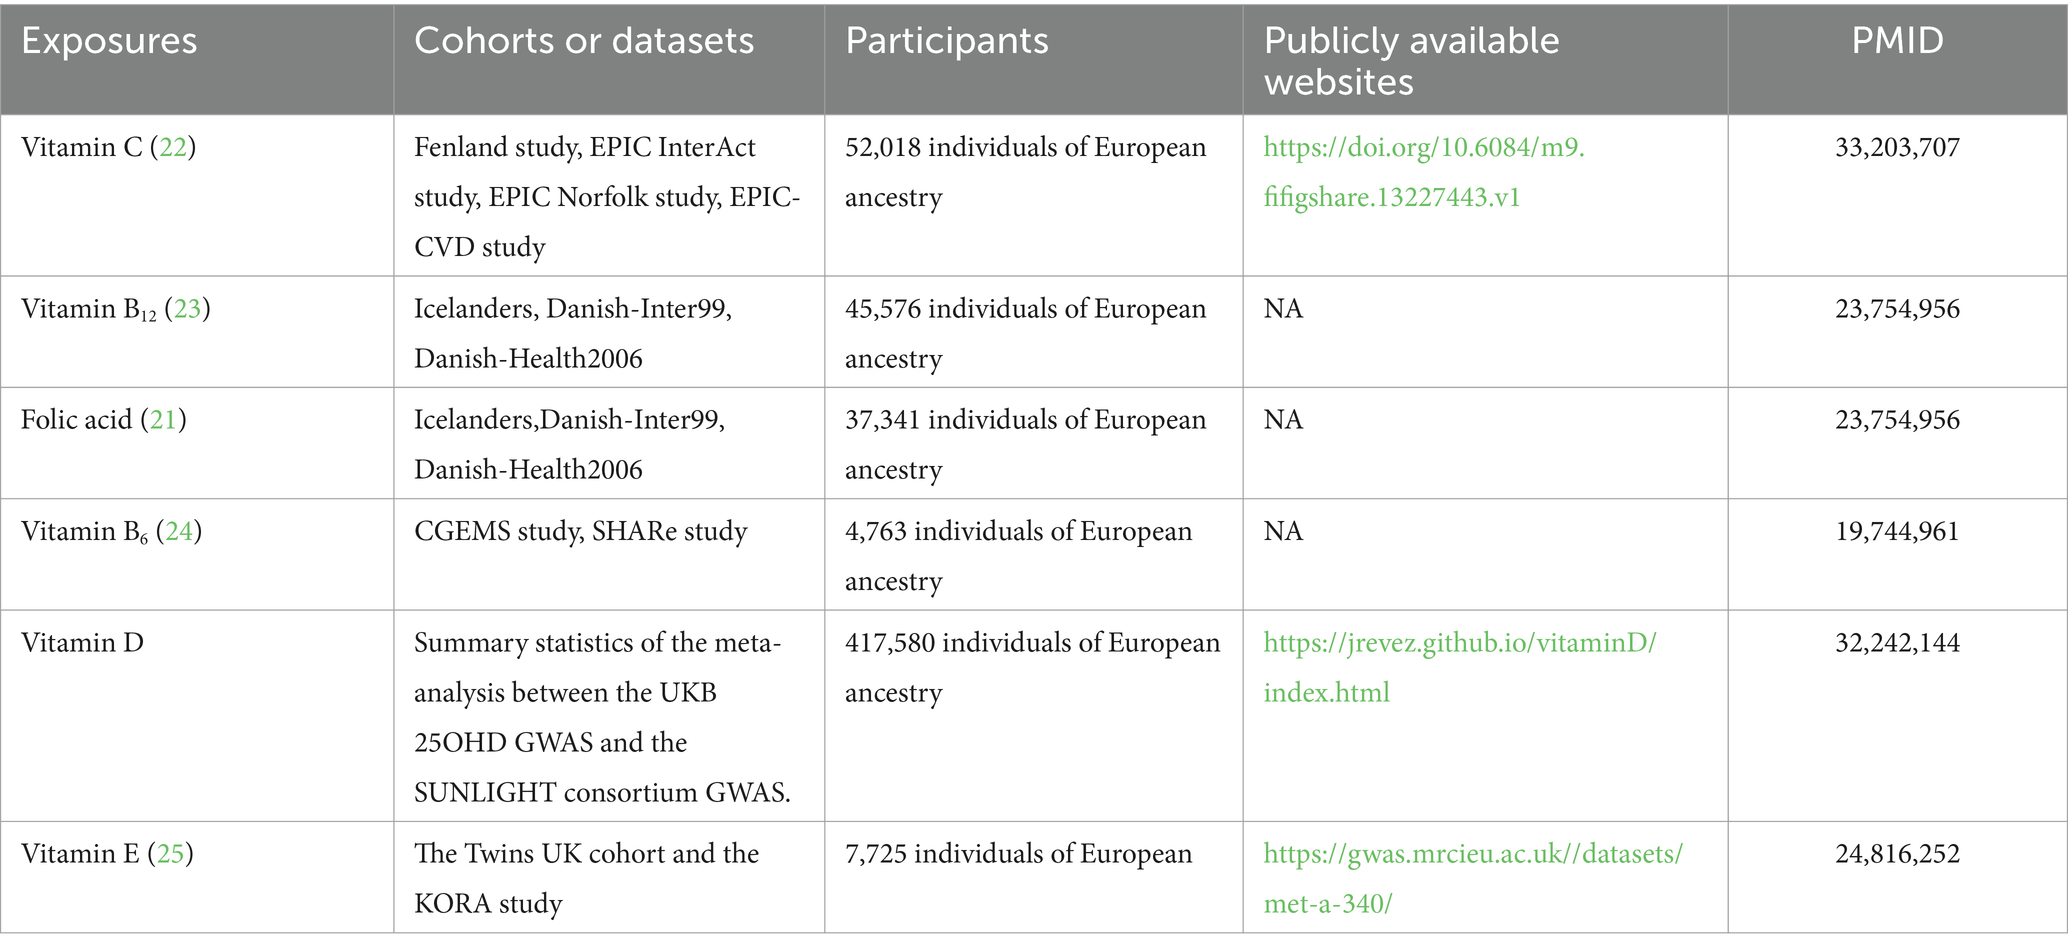
Table 1. Main analysis exposure source – summary data from GWAS study.
2.3 Outcome data sources
For this study, frailty data were obtained from the IEU openGWAS database. This study used data from two different cohorts: European-descent UK Biobank participants (n = 164,610, ages 60 to 70 years) and Swedish Twin Gene participants (n = 10,616, ages 41 to 87 years), and used the frailty index (FI) to measure frailty (26). Of these, the Frailty Index combines dozens of parameters, including symptoms, signs, disabilities, and diagnosed disease items, and reflects the accumulation of potential health deficits throughout, for life.
2.4 Instruments selection
A meta-analysis using four independent investigations with more than 50,000 individuals discovered 11 genetic variants related to circulating vitamin C (p < 5.0 × 10⁻⁸). A GWAS encompassing 82,917 participants discovered five genetic variants for circulating vitamin B12 levels and two genetic variants for circulating folate levels (linkage disequilibrium parameter (r2) < 0.001; p < 5 × 10⁻⁸). Two genetic variables related to vitamin B6 were found in a meta-analysis of two separate investigations with 4,763 individuals (p < 5 × 10⁻⁸; r2 < 0.001). For 25-hydroxyvitamin D and vitamin E, we set the p-value, r2, and genetic distance. The p-value for 25-hydroxyvitamin D was less than or equal to 5 × 10⁻⁸, and the p-value for vitamin E was less than or equal to 5 × 10⁻⁶, r2 = 0. 001, and the genetic distance was 10,000 kb. To exclude weak instrumental variables, we calculated the F-statistics of the IVs, which are generally required to be F > 10 (27). Finally, 120 SNPs related to six micronutrients were selected. Detailed information on these SNPs can be found in Supplementary Table S1.
2.5 Analysis of horizontal pleiotropy and heterogeneity
Initially, we achieved harmonization of the exposure data and outcome data through the process of matching the SNPs. Furthermore, it is essential to consider that the pleiotropy of SNPs in the IVW research, which may introduce bias and distort causal estimates and conclusions (28). Therefore, to check if the SNPs were acceptable IVs, we utilized the pleiotropy test function with the two-sample MR package (29). The IVs could be used if the pleiotropy was insignificant (p > 0.05). If the pleiotropy test’s p-value was less than 0.05, we manually chose each SNP on the Phenoscanner website (30). After that, we used Cochran’s Q to assess the heterogeneity. In situations where the degree of heterogeneity was assessed to be negligible, the fixed effects model was used. In contrast, a random effects model was considered required if heterogeneity was present.
2.6 Analysis of Mendelian randomization
For each SNP, we determined the Wald ratio, the ratio of the connection between the SNP’s exposure and outcome. The Wald ratio estimate approach was used for MR analysis when a micronutrient had only one SNP. We explored the causal relationship between micronutrients and frailty for micronutrients containing multiple SNPs using the inverse-variance weighted (IVW) method, which was also the primary method used in this study, by combining the Wald ratios of the causal effects of each SNP to estimate the causal effect. We also conducted additional analyses using the weighted median and MR-Egger methods to help further confirm the findings.
2.7 Sensitivity analysis
We used the MR-Egger intercept, the MR-Pleiotropy RESidual Sum and Outlier (MR-PRESSO), and the leave-one-out approach as sensitivity tests to evaluate the findings, further to ensure the accuracy of the MR causal effect estimation. To assess if SNPs showed horizontal pleiotropy, the MR-Egger method was used (31). The IVs could possess pleiotropic effects if the p-value for the intercept term were less than 0.05. However, if the p-value of the intercept term was more extensive than 0.05, there was no proof of horizontal pleiotropy across the selected IVs. The MR-PRESSO test, which provided a reliable estimate after outlier correction, was used to identify the typical MR testing outliers (32). Finally, we using the leave-one-out method to determined whether outliers could be skewing the overall MR estimate.
2.8 Secondary analyses
Exposure data for secondary analyses were derived from the IEU OpenGWAS database (see Table 2 for details). In the secondary analysis, the criterion for selecting IV was relaxed, i.e., the p-values of all six micronutrients were less than 5 × 10⁻⁶, and the linkage disequilibrium (LD) was consistent with the primary analysis criterion. While doing so could boost statistical power, there is also a chance that the MR assumptions were broken and weak instrument bias introduced. Therefore, the F statistic was calculated, and SNPs with F < 10 were excluded. Finally, 257 SNPs related to six micronutrients were selected, and the specific information on SNPs is shown in Supplementary Table S2.
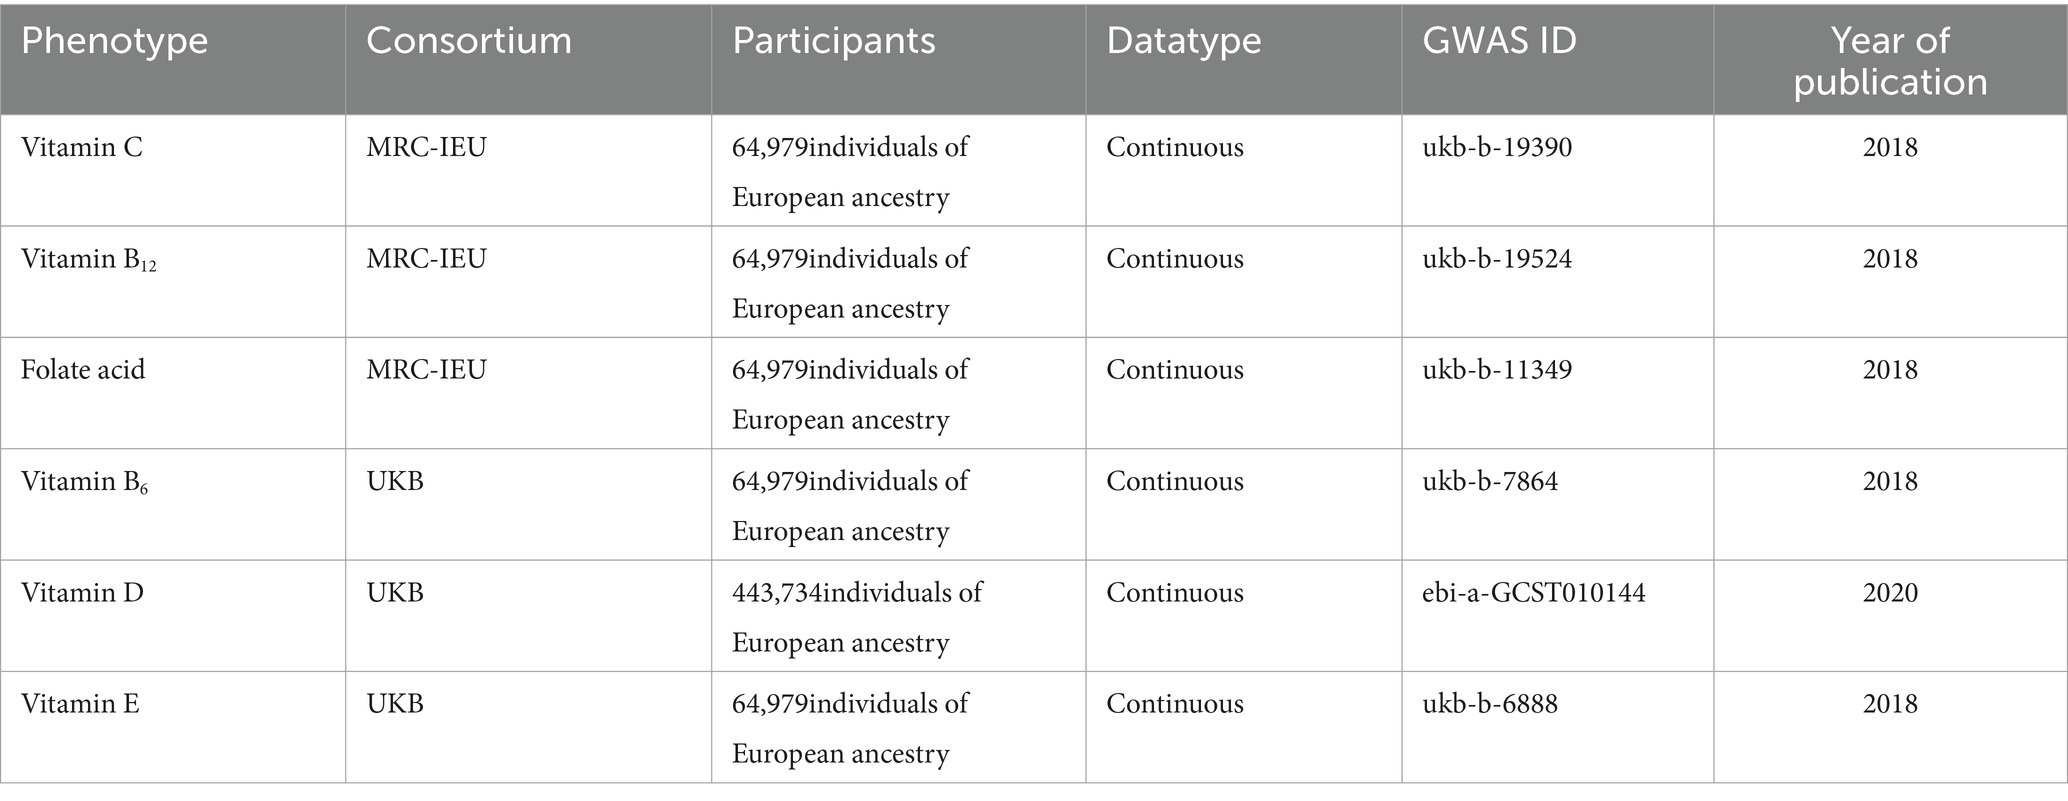
Table 2. Source of secondary analysis exposure – genome-wide association study summary data.
2.9 Meta-analysis
We conducted a meta-analysis of the findings of the main and secondary investigations to investigate further the causative influence of genetically circulating micronutrients on the risk of frailty. To assess heterogeneity, we employed the Q test and the inconsistency (I2) test. If I2 was more than 50% and p < 0.05, heterogeneity was considered (33). We utilized a fixed-effects model for the meta-analysis if there was no heterogeneity; otherwise, we used a random-effects model.
2.10 Reported results and software
For dichotomous variables, the MR findings were shown as odds ratios (ORs) and 95% confidence intervals (CIs) per standard deviation. The results were reported for continuous variables as beta values (β) and 95% CIs per standard deviation. Considering that the MR analysis in this study involved sex exposures, the p-value was corrected for Bonferroni, and the corrected p-value was calculated to be 0.00833 (0.05/6, 6 being the number of tests). That is, p < 0.00833 is evidence of causation, while 0.00833 < p < 0.05 is suggestive evidence of causation. The meta-analyses and MR analyses were conducted using the “meta” package, the “TwoSampleMR” package, and the “MRPRESSO” package, all of which are based on the R programming language.
3 Results
3.1 Main analysis
Pleiotropy and heterogeneity tests on the selected IVs revealed no pleiotropic SNPs. In addition, we observed significant heterogeneity for vitamin D and C (Q = 214.306, p-value = 1.726 × 10⁻¹⁰; Q = 28.792, p-value =0.001) but no heterogeneity for the remaining four micronutrients. Therefore, we used IVW in randomized mode to obtain the effect value of vitamin D and C. Supplementary Table S3 provides further details regarding this finding.
As shown in Figure 2, the MR estimates obtained by the IVW method suggested that the predicted circulating levels of six micronutrients, including vitamin C (β = −0.02; 95% CI: −0.076, 0.036; p = 0.481), vitamin B12 (β = −0.009; 95% CI: −0.039, 0.020; p = 0.535), folate (β = 0.007; 95% CI: −0.047, 0.063; p = 0.781), vitamin D (β = 0.002; 95% CI: −0.043, 0.047; p = 0.926), and vitamin E (β = 0.041; 95% CI: −0.125, 0.209; p = 0.623), were causally unrelated to frailty. The weighted median method showed a suggestive causal association between vitamin D and frailty (β = 0.050; 95% CI: 0.002, 0.103; p = 0.042), while the remaining four vitamins yielded similar results to IVW. Additionally, neither the MR-Egger intercept nor the MR-PRESSO method revealed any apparent horizontal pleiotropic effects associated with these SNPs (see Supplementary Table S4). The leave-one-out analysis conducted in this study did not identify any SNP that had a significant influence on the results of any MR studies. Supplementary Figures S2–S5 provide further details. For vitamin B6, which had only one SNP as an instrumental variable, we analyzed its association with frailty using the Wald ratio method, and the results did not provide any evidence of a causal relationship between vitamin B6 and frailty (β = −0.017; 95% CI: −0.073, 0.038; p = 0.531).
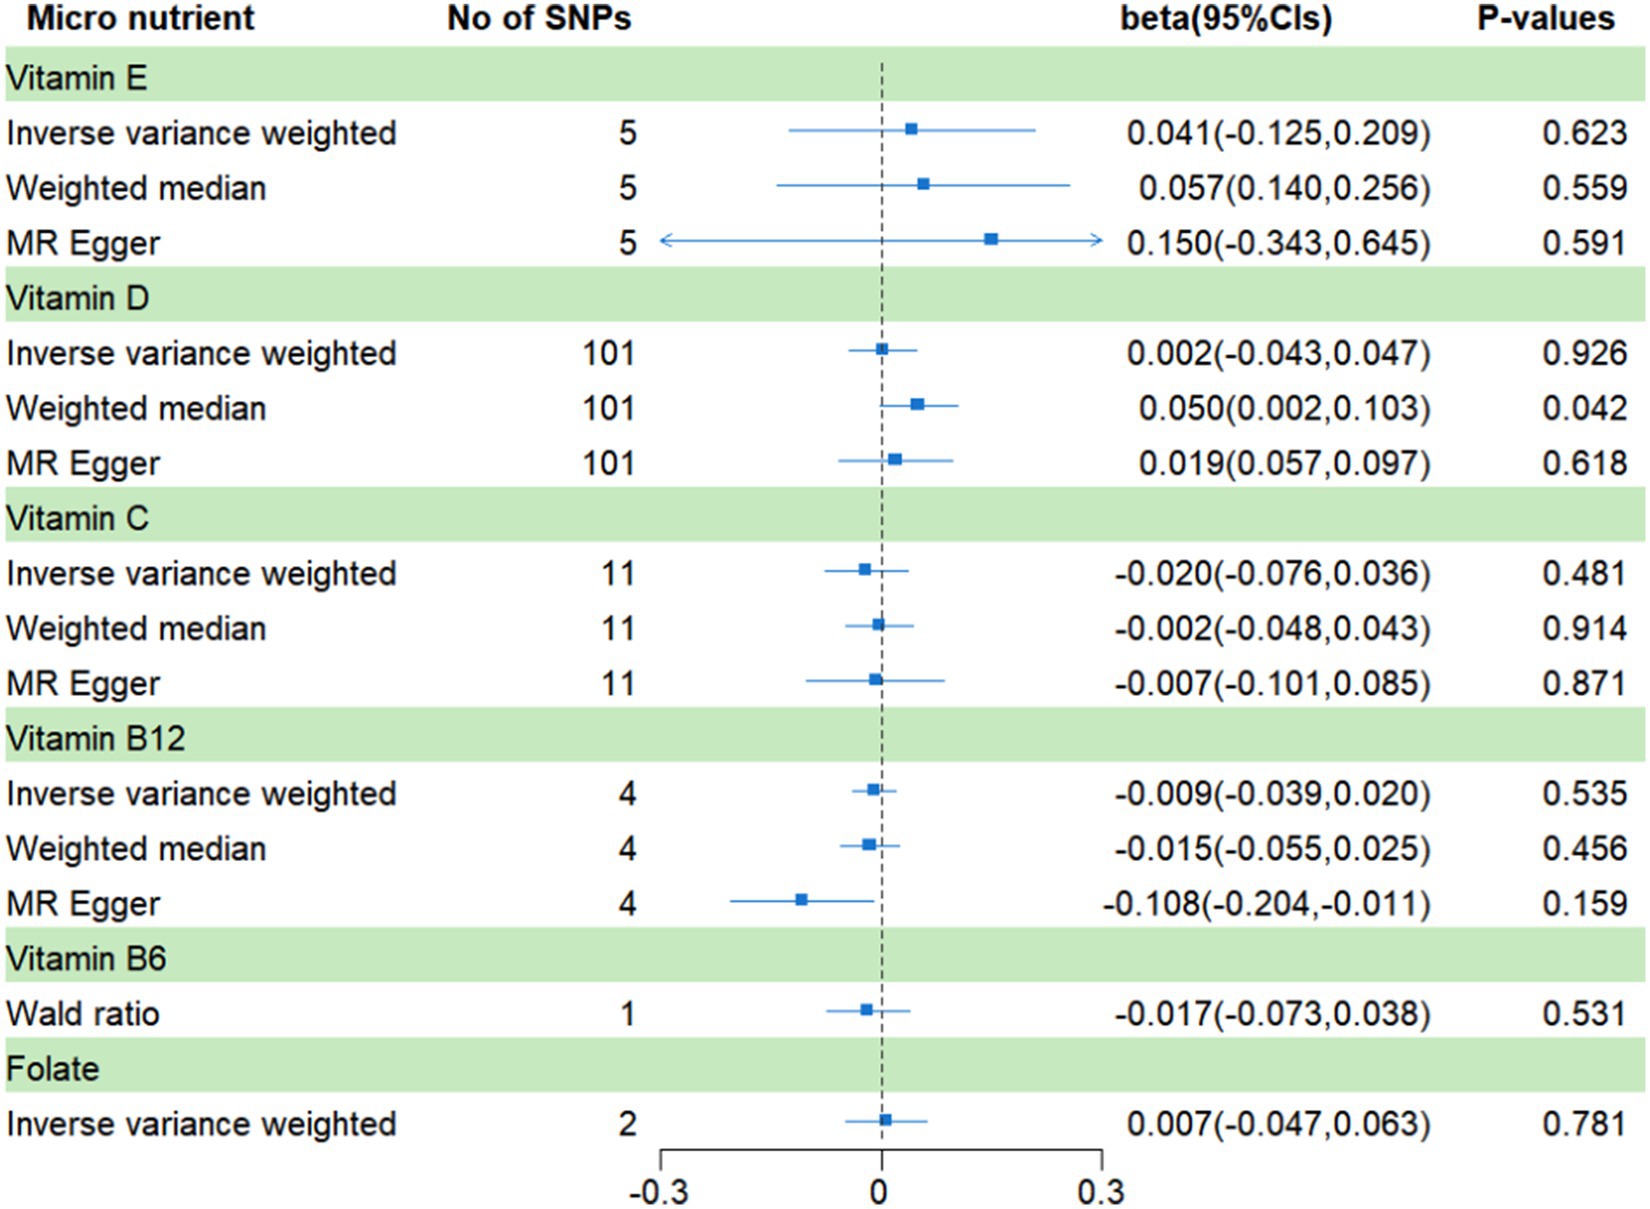
Figure 2. MR analysis of genetically predicted levels of circulating micronutrients and frailty risk in main analysis.
3.2 Secondary analysis
Pleiotropy and heterogeneity tests on the selected IVs revealed no pleiotropic SNPs. Further, we observed significant heterogeneity for vitamin E and D (Q = 23.015, p-value =0.017; Q = 363.67, p-value = 4.990 × 10⁻¹²) but no heterogeneity for the remaining four micronutrients. Therefore, we used IVW in randomized mode to obtain the effect value of vitamin E and D. Supplementary Table S5 provides further details regarding this finding.
In the secondary analysis (Figure 3), a significant causal relationship was found between vitamin D and frailty, vitamin C has a suggestive causal association with frailty. The β values for vitamin D and vitamin C were − 0.12 (95% CI: −0.187, −0.054; p = 0.00021) and − 0.089 (95% CI, −0.166, 0.011; p = 0.024), respectively. The results regarding the remaining four micronutrients were found to be consistent with the results of the main analysis, showing no significant causal relationships with frailty. Furthermore, there were no noticeable horizontal pleiotropic effects associated with these SNPs according to the MR-Egger intercept and MR-PRESSO approaches. Supplementary Table S6 provides further details. The leave-one-out analysis conducted for all MR studies did not identify any SNP that had a significant influence on the results (see Supplementary Figures S6–S11).
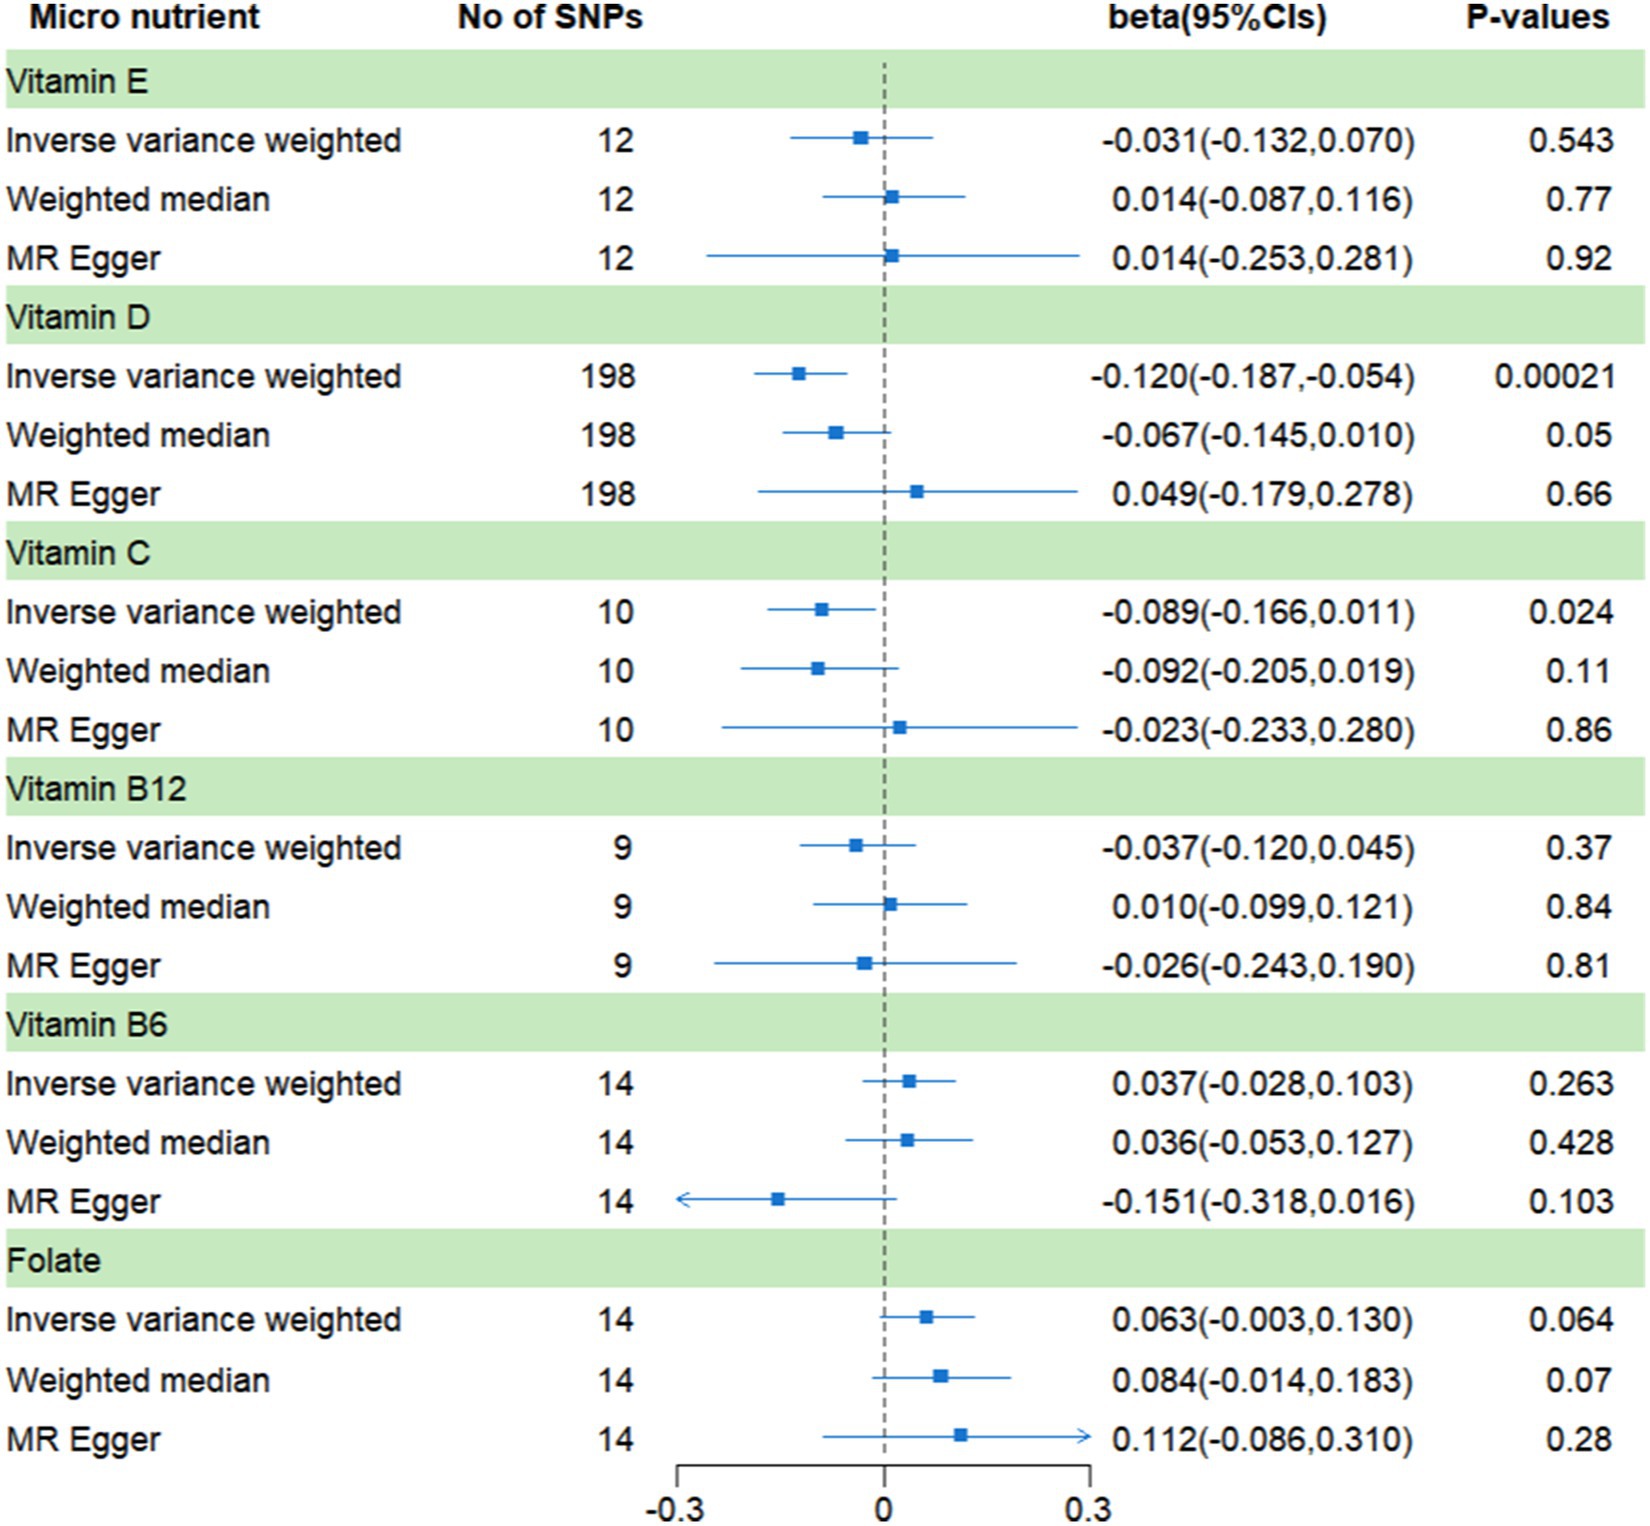
Figure 3. MR analysis of genetically predicted levels of circulating micronutrients and frailty risk in secondary analysis.
3.3 Meta-analysis
In this part, vitamin D had significant heterogeneity so it was analyzed with a random-effects model; the rest used a fixed-effects model. And, the results show, that there was no conclusive evidence of a causal connection between the circulating levels of the six micronutrients and frailty. For the circulating levels of the six micronutrients, the pooled βs are −0.044 (vitamin C, 95% CI: −0.090, 0.001; I2 = 48%, p = 0.06), −0.027 (vitamin B12, 95% CI: −0.041, 0.015; I2 = 0%, p = 0.37), 0.029 (folate, 95% CI: −0.013, 0.072; I2 = 38%, p = 0.17), −0.059 (vitamin D, 95% CI: −0.183, −0.065; I2 = 90%, p = 0.35), −0.011 (vitamin E, 95% CI: −0.099, 0.075; I2 = 0%, p = 0.79), and 0.006 (vitamin B6, 95% CI: −0.047, 0.061; I2 = 37%, p = 0.80) (Figure 4).
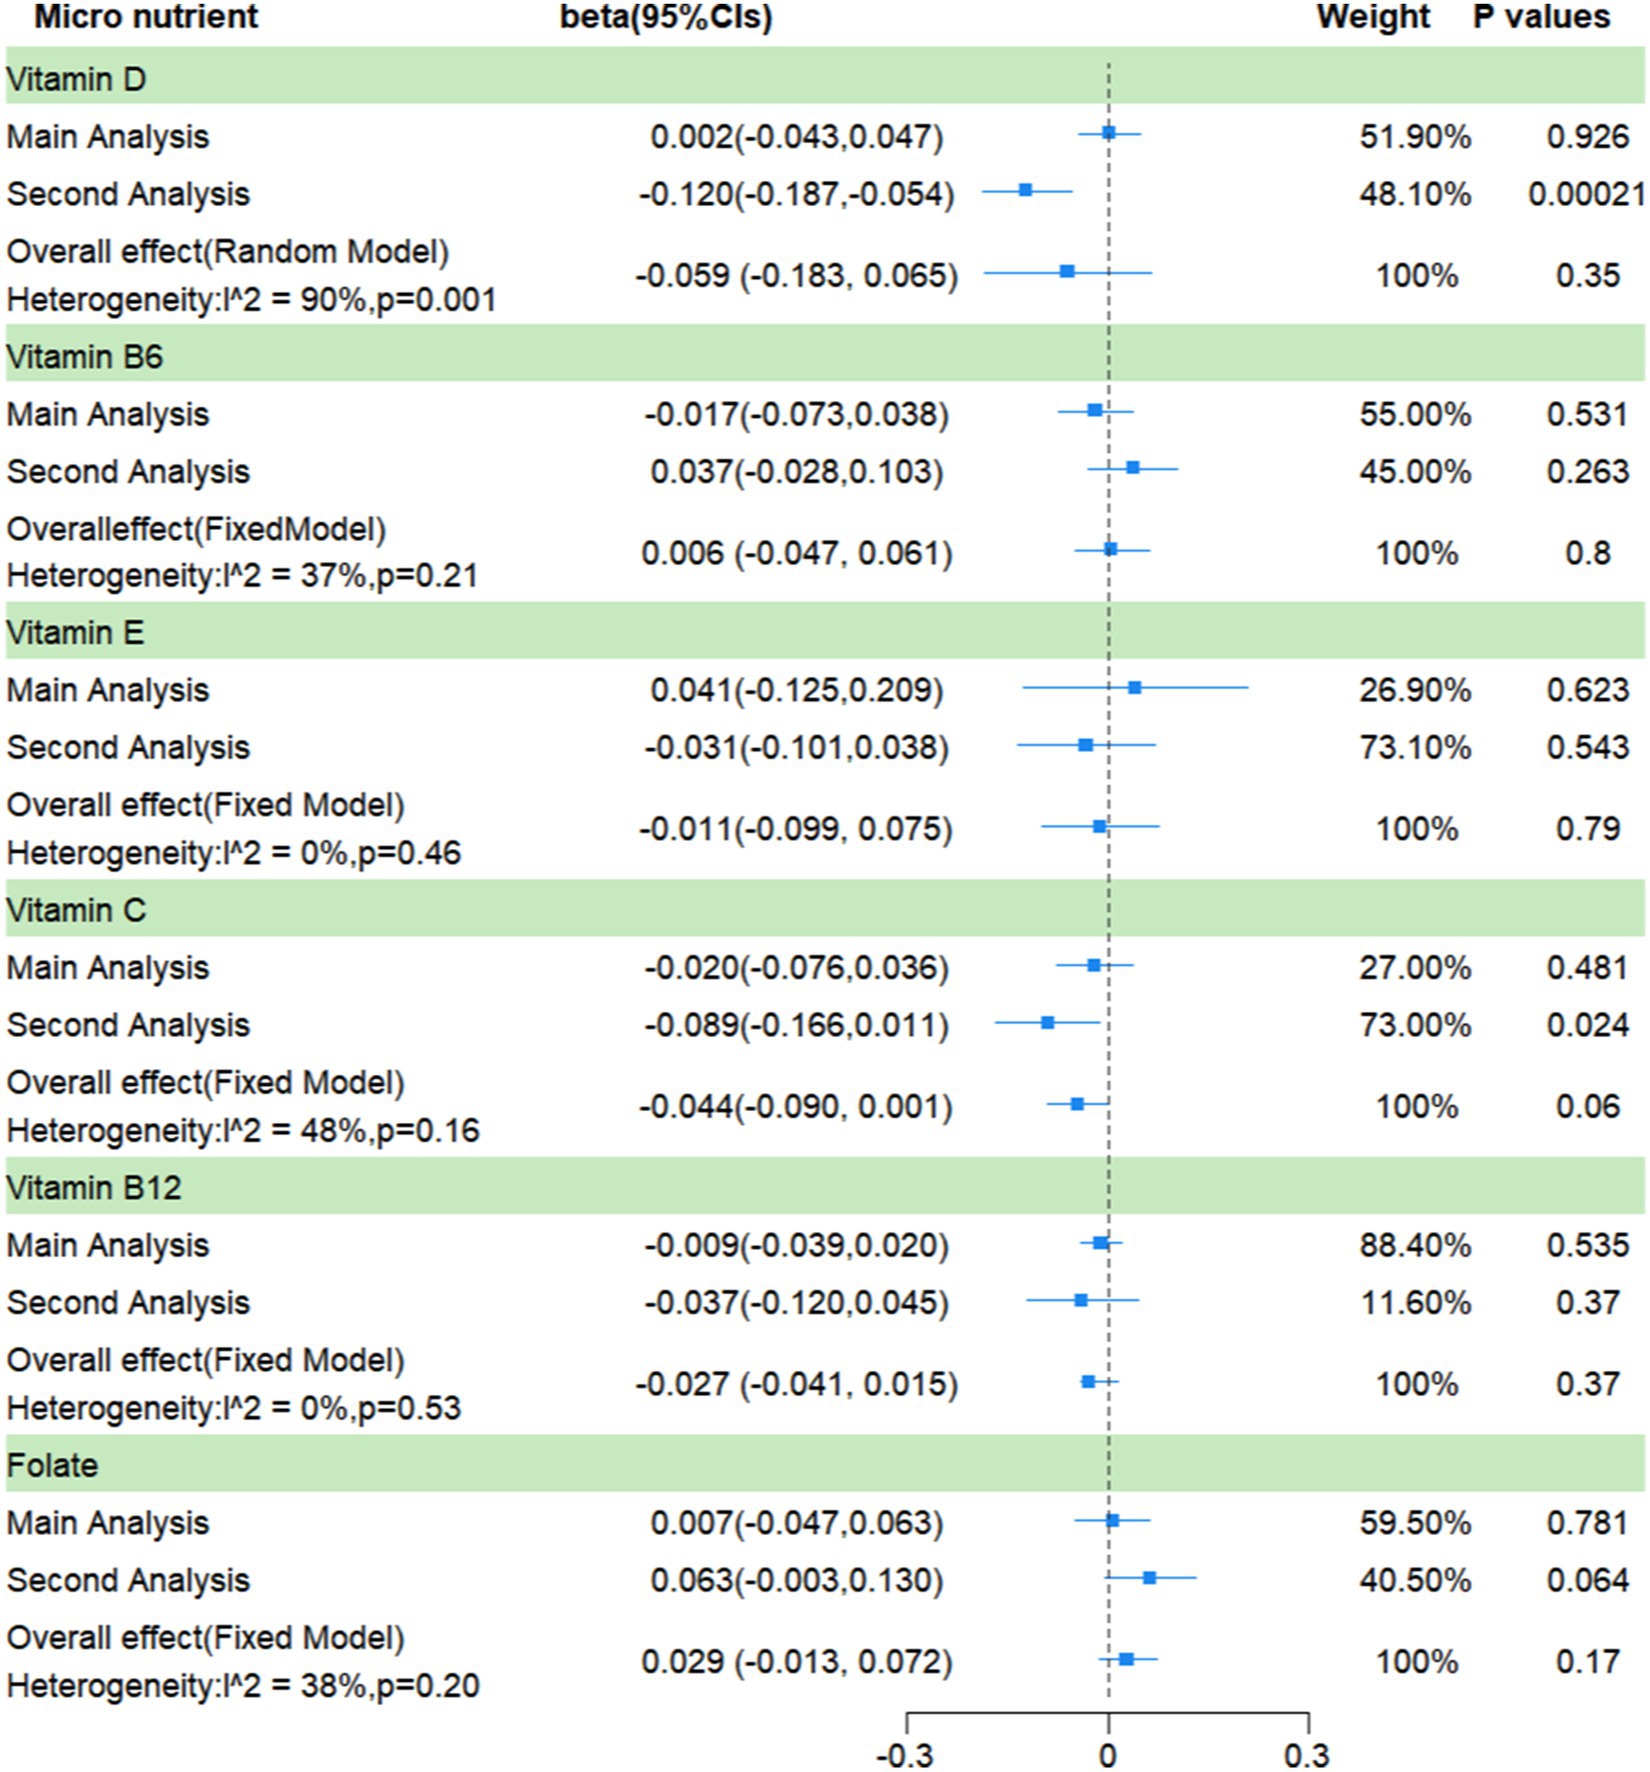
Figure 4. A meta-analysis based on the results of two Mendelian randomization analyses.
4 Discussion
The current research demonstrated no evidence of a significant causal connection between the genetically predicted circulating levels of vitamins B6, B12, E, D, and C, and folate with the risk of frailty.
Recent research has revealed a strong correlation between elevated homocysteine levels with inflammation, mitochondrial dysfunction, and oxidative stress, which can result in muscle loss, diminished physical performance, and, ultimately, frailty (34). And studies have found, that vitamins B6, B12 and folate may alter homocysteine status through regulation of single-carbon metabolism (35). Thus, several studies have analyzed the possibility that these three B vitamins contribute to the frailty. For instance, a Spanish study found an association between a greater risk of frailty and a lower consumption of vitamin B6 and folate (13). According to Matteini et al. vitamin B12 deficiency in older women who live in the community may exacerbate the frailty syndrome (36). The prospective findings of Semba et al. have shown, however, that folate and vitamin B6 were not substantially related to the incidence of frailty (37). Furthermore, a cross-sectional study conducted in Korea showed that the risk of frailty and circulating vitamin B12 levels were not correlated (19). All in all, discrepancies in the outcomes of the three micronutrient studies discussed above might be attributed to variances in research sample sizes, vulnerability assessment approaches, and laboratory testing operations. Thus, we used the more trustworthy MR analysis and ultimately concluded that there was no causal connection between the risk of frailty and the genetically predicted circulating levels of vitamins B12, B6, and folate.
Vitamins E and C, the most prevalent antioxidants (16), may have the ability to prevent the onset and development of frailty by lowering oxidative stress. The observational studies, suggesting that vitamins C and E may be related to a lower incidence of frailty (16, 38). Besides that, a part of the study has investigated their relationship with frailty phenotypes such as skeletal muscle mass and grip strength. Lewis et al. examined the relationship between dietary and circulating vitamin C with skeletal muscle mass, and found a positive correlation between vitamin C with skeletal muscle mass (39). In addition, from a study analyzing the association between the NHANES cohort’s dietary antioxidant and grip strength, vitamin E intake was found to be positively associated with grip strength in men (40). In contrast, a study conducted in Switzerland demonstrated that the supplementation of vitamins C and E neither improved nor prevented low grip strength over a five years (41). Our MR analyses showed no causal association between circulating vitamin E and C levels and risk of frailty.
As the study of vitamin D has intensified, researchers have found a correlation between it and autism (42), depression (43), and cognitive impairment (44). Numerous observational studies have also analyzed the association between vitamin D and the risk of frailty. However, to date, the results of these studies have been inconsistent. Some of the researchers think that vitamin D deficiency may contribute to frailty by decreasing muscle function (45). In addition, since both immune activation and chronic inflammation have been implicated in the etiology of frailty (46), it is hypothesized that the anti-inflammatory effects of vitamin D may be another mechanism. An observational study from South Korea showed that in older persons who live in the community, low levels of vitamin D have been associated with an increased risk of frailty (47). However, the prospective findings of Buta et al. showed that, after adjusting for the cardiometabolic disease, low circulating vitamin D levels were not considerably correlated with the risk of frailty (48). There was also no statistically significant relationship between circulating 25-hydroxyvitamin D levels and frailty, according to Krams T. et al.’s investigation of 321 individuals (49). Therefore, we introduced MR analysis in the hope of obtaining more reliable results. Our findings do not support a causal connection between genetically predicted circulating levels of vitamin D and the occurrence of frailty.
This study has the following advantages. First, our research is the first known MR study to evaluate different micronutrients and the risk of becoming frail. Second, the instrumental variables employed in our study were sourced from recently published articles. Additionally, we received summary information on frailty from the IEU OpenGWAS database, which has a large sample size of over 270,000 people and is, therefore, better able to establish a causal connection between the exposure and the outcome. Finally, utilizing information from separate GWAS studies and public databases, respectively, we examined the causal connection between micronutrients and frailty. We then meta-analyzed the findings of the two MRs, and the concordance of these results supported our findings.
We must admit that our research had significant limitations. First, because the GWAS pooled data on frailty originated from a European population, it is necessary to conduct further research to determine whether the findings of this study can be generalized. Second, our capacity to conduct subgroup analyses was constrained since the frailty data we utilized could not be classified according to variables (age, sex, smoking, alcohol use, underlying disorders, or deficits of certain micronutrients in the population). Third, it should be noted that residual bias remains an inherent limitation of the MR approach, even when using pleiotropy tests and MR-PRESSO methods to mitigate the potential confounding effects caused by pleiotropy.
5 Conclusion
In conclusion, there was no indication of a causal connection between genetically predicted circulation levels of six micronutrients and frailty risk in this MR research. The TSMR study could not to detect nonlinear causation; nonetheless, nonlinear causality between circulating micronutrient levels and frailty risk might exist. As a result, more sophisticated methodologies, such as nonlinear Mendelian randomization research, are required to identify possible causal correlations between micronutrients and frailty risk. In addition, we hope that future researchers will be able to use methods, such as randomized controlled trials and animal experiments to analyze the relationship and possible mechanisms between each micronutrient and frailty, thus providing a more reliable basis for future research.
Data availability statement
The original contributions presented in the study are included in the article/Supplementary material, further inquiries can be directed to the corresponding authors.
Author contributions
KK: Writing – original draft, Writing – review & editing. YM: Data curation, Methodology, Writing – original draft. SY: Methodology, Writing – review & editing. SC: Data curation, Writing – review & editing. NA: Conceptualization, Writing – review & editing. AW: Data curation, Writing – review & editing. JW: Software, Writing – review & editing. XP: Conceptualization, Writing – review & editing. YL: Investigation, Writing – review & editing. HL: Visualization, Writing – review & editing. YD: Software, Writing – review & editing. YF: Validation, Writing – review & editing. LY: Supervision, Writing – review & editing, Funding acquisition. JZ: Supervision, Writing – review & editing.
Funding
The author(s) declare that financial support was received for the research, authorship, and/or publication of this article. This work was supported by the 14th Five-Year Plan Key Discipline of Public Health and Preventive Medicine in Xiniiang Uvgur Autonomous Region, the 2022 Doctoral Research Initiation Fund of Xinjiang Medical University, and the State Key Laboratory Project of Xinjiang Medical University (SKL-HIDCA-2020-ER4).
Acknowledgments
Thanks to everyone who assisted with this project and we would like to express our gratitude to all the GWAS consortia and the UKB for supplying us with the frailty related traits and circulating micronutrient traits GWAS summary data.
Conflict of interest
The authors declare that the research was conducted in the absence of any commercial or financial relationships that could be construed as a potential conflict of interest.
Publisher’s note
All claims expressed in this article are solely those of the authors and do not necessarily represent those of their affiliated organizations, or those of the publisher, the editors and the reviewers. Any product that may be evaluated in this article, or claim that may be made by its manufacturer, is not guaranteed or endorsed by the publisher.
Supplementary material
The Supplementary material for this article can be found online at: https://www.frontiersin.org/articles/10.3389/fnut.2024.1386646/full#supplementary-material
Footnotes
References
1. Travers, J, Romero-Ortuno, R, Bailey, J, and Cooney, MT. Delaying and reversing frailty: a systematic review of primary care interventions. Br J Gen Pract. (2019) 69:E61–e69. doi: 10.3399/bjgp18X700241
2. Thillainadesan, J, Scott, IA, and Le Couteur, DG. Frailty, a multisystem ageing syndrome. Age Ageing. (2020) 49:758–63. doi: 10.1093/ageing/afaa112
3. Leng, S, Chen, X, and Mao, G. Frailty syndrome: an overview. Clin Interv Aging. (2014) 9:433–41. doi: 10.2147/cia.s45300
4. Wang, Z, Ruan, H, Li, L, Song, N, and He, S. Association of changes in frailty status with the risk of all-cause mortality and cardiovascular death in older people: results from the Chinese longitudinal healthy longevity survey (CLHLS). BMC Geriatr. (2024) 24:96. doi: 10.1186/s12877-024-04682-2
5. Dent, E, Hanlon, P, Sim, M, Jylhävä, J, Liu, Z, Vetrano, DL, et al. Recent developments in frailty identification, management, risk factors and prevention: a narrative review of leading journals in geriatrics and gerontology. Ageing Res Rev. (2023) 91:102082. doi: 10.1016/j.arr.2023.102082
6. Hoogendijk, EO, Afilalo, J, Ensrud, KE, Kowal, P, Onder, G, and Fried, LP. Frailty: implications for clinical practice and public health. Lancet. (2019) 394:1365–75. doi: 10.1016/s0140-6736(19)31786-6
7. Jin, H-Y, Liu, X, Xue, Q-L, Chen, S, and Wu, C. The association between frailty and healthcare expenditure among Chinese older adults. J Am Med Dir Assoc. (2020) 21:780–5. doi: 10.1016/j.jamda.2020.03.008
8. Han, L, Clegg, A, Doran, T, and Fraser, L. The impact of frailty on healthcare resource use: a longitudinal analysis using the clinical practice research datalink in England. Age Ageing. (2019) 48:665–71. doi: 10.1093/ageing/afz088
9. O’Caoimh, R, Sezgin, D, O’Donovan, MR, Molloy, DW, Clegg, A, Rockwood, K, et al. Prevalence of frailty in 62 countries across the world: a systematic review and meta-analysis of population-level studies. Age Ageing. (2020) 50:96–104. doi: 10.1093/ageing/afaa219
10. Duan, Y, Qi, Q, Cui, Y, Yang, L, Zhang, M, and Liu, H. Effects of dietary diversity on frailty in Chinese older adults: a 3-year cohort study. BMC Geriatr. (2023) 23:141. doi: 10.1186/s12877-023-03875-5
11. Marconcin, P, Barak, S, Ferrari, G, Gouveia, ÉR, de Maio Nascimento, M, Willig, R, et al. Prevalence of frailty and its association with depressive symptoms among European older adults from 17 countries: a 5-year longitudinal study. Int J Environ Res Public Health. (2022) 19:14055. doi: 10.3390/ijerph192114055
12. Wu, Y, Jia, M, Xiang, C, and Fang, Y. Latent trajectories of frailty and risk prediction models among geriatric community dwellers: an interpretable machine learning perspective. BMC Geriatr. (2022) 22:900. doi: 10.1186/s12877-022-03576-5
13. Balboa-Castillo, T, Struijk, EA, Lopez-Garcia, E, Banegas, JR, Rodriguez-Artalejo, F, and Guallar-Castillon, P. Low vitamin intake is associated with risk of frailty in older adults. Age Ageing. (2018) 47:872–9. doi: 10.1093/ageing/afy105
14. Welch, A. Micronutrient malnutrition across the life course, sarcopenia and frailty. Proc Nutr Soc. (2021) 80:279–82. doi: 10.1017/s0029665121001968
15. Xiong, J, and Xue, W-X. The role of vitamin D in the link between physical frailty and cognitive function: a mediation analysis in community-dwelling Chinese older adults. Front Nutr. (2022) 9:9. doi: 10.3389/fnut.2022.922673
16. Das, A, Cumming, RG, Naganathan, V, Blyth, F, Ribeiro, RV, Le Couteur, DG, et al. Prospective associations between dietary antioxidant intake and frailty in older Australian men: the Concord health and ageing in men project. J Gerontol. (2019) 75:348–56. doi: 10.1093/gerona/glz054
17. Tamaki, K, Kusunoki, H, Tsuji, S, Wada, Y, Nagai, K, Itoh, M, et al. The relationship between dietary habits and frailty in rural Japanese community-dwelling older adults: cross-sectional observation study using a brief self-administered dietary history questionnaire. Nutrients. (2018) 10:1982. doi: 10.3390/nu10121982
18. Cheng, X, Hu, Y, Ruan, Z, Zang, G, Chen, X, and Qiu, Z. Association between B-vitamins intake and frailty among patients with chronic obstructive pulmonary disease. Aging Clin Exp Res. (2023) 35:793–801. doi: 10.1007/s40520-023-02353-7
19. Soh, Y, and Won, CW. Association between frailty and vitamin B12 in the older Korean population. Medicine. (2020) 99:e22327. doi: 10.1097/MD.0000000000022327
20. Davies, NM, Holmes, MV, and Smith, GD. Reading Mendelian randomisation studies: a guide, glossary, and checklist for clinicians. BMJ Br Med J. (2018) 362:k601. doi: 10.1136/bmj.k601
21. Sekula, P, Del Greco, MF, Pattaro, C, and Kottgen, A. Mendelian randomization as an approach to assess causality using observational data. J Am Soc Nephrol. (2016) 27:3253–65. doi: 10.1681/asn.2016010098
22. Zheng, JS, Luan, J, Sofianopoulou, E, Imamura, F, Stewart, ID, Day, FR, et al. Plasma vitamin C and type 2 diabetes: genome-wide association study and Mendelian randomization analysis in European populations. Diabetes Care. (2021) 44:98–106. doi: 10.2337/dc20-1328
23. Grarup, N, Sulem, P, Sandholt, CH, Thorleifsson, G, Ahluwalia, TS, Steinthorsdottir, V, et al. Genetic architecture of vitamin B12 and folate levels uncovered applying deeply sequenced large datasets. PLoS Genet. (2013) 9:e1003530. doi: 10.1371/journal.pgen.1003530
24. Hazra, A, Kraft, P, Lazarus, R, Chen, C, Chanock, SJ, Jacques, P, et al. Genome-wide significant predictors of metabolites in the one-carbon metabolism pathway. Hum Mol Genet. (2009) 18:4677–87. doi: 10.1093/hmg/ddp428
25. Shin, SY, Fauman, EB, Petersen, AK, Krumsiek, J, Santos, R, Huang, J, et al. An atlas of genetic influences on human blood metabolites. Nat Genet. (2014) 46:543–50. doi: 10.1038/ng.2982
26. Atkins, JL, Jylhävä, J, Pedersen, NL, Magnusson, PK, Lu, Y, Wang, Y, et al. A genome-wide association study of the frailty index highlights brain pathways in ageing. Aging Cell. (2021) 20:e13459. doi: 10.1111/acel.13459
27. Sanderson, E, Spiller, W, and Bowden, J. Testing and correcting for weak and pleiotropic instruments in two-sample multivariable Mendelian randomization. Stat Med. (2021) 40:5434–52. doi: 10.1002/sim.9133
28. Hemani, G, Bowden, J, and Smith, GD. Evaluating the potential role of pleiotropy in Mendelian randomization studies. Hum Mol Genet. (2018) 27:R195–208. doi: 10.1093/hmg/ddy163
29. Broadbent, JR, Foley, CN, Grant, AJ, Mason, AM, Staley, JR, and Burgess, S. MendelianRandomization v0.5.0: updates to an R package for performing Mendelian randomization analyses using summarized data. Wellcome Open Res. (2020) 5:252. doi: 10.12688/wellcomeopenres.16374.1
30. Kamat, MA, Blackshaw, JA, Young, R, Surendran, P, Burgess, S, Danesh, J, et al. PhenoScanner V2: an expanded tool for searching human genotype-phenotype associations. Bioinformatics. (2019) 35:4851–3. doi: 10.1093/bioinformatics/btz469
31. Burgess, S, and Thompson, SG. Interpreting findings from Mendelian randomization using the MR-egger method. Eur J Epidemiol. (2017) 32:377–89. doi: 10.1007/s10654-017-0255-x
32. Verbanck, M, Chen, C-Y, Neale, B, and Do, R. Detection of widespread horizontal pleiotropy in causal relationships inferred from Mendelian randomization between complex traits and diseases. Nat Genet. (2018) 50:693–8. doi: 10.1038/s41588-018-0099-7
33. Jackson, D, White, IR, and Riley, RD. Quantifying the impact of between-study heterogeneity in multivariate meta-analyses. Stat Med. (2012) 31:3805–20. doi: 10.1002/sim.5453
34. Álvarez-Sánchez, N, Álvarez-Ríos, AI, Guerrero, JM, García-García, FJ, Rodríguez-Mañas, L, Cruz-Chamorro, I, et al. Homocysteine and C-reactive protein levels are associated with frailty in older Spaniards: the Toledo study for healthy aging. J Gerontol A Biol Sci Med Sci. (2020) 75:1488–94. doi: 10.1093/gerona/glz168
35. Clare, CE, Brassington, AH, Kwong, WY, and Sinclair, KD. One-carbon metabolism: linking nutritional biochemistry to epigenetic programming of long-term development In: HA Lewin and RM Roberts, editors. Annual review of animal biosciences, vol. 7 (2019). 263–87. doi: 10.1146/annurevanimal-020518-115206
36. Matteini, AM, Walston, JD, Fallin, MD, Bandeen-Roche, K, Kao, WHL, Semba, RD, et al. Markers of B-vitamin deficiency and frailty in older women. J Nutr Health Aging. (2008) 12:303–8. doi: 10.1007/bf02982659
37. Semba, RD, Bartali, B, Zhou, J, Blaum, C, Ko, C-W, and Fried, LP. Low serum micronutrient concentrations predict frailty among older women living in the community. J Gerontol. (2006) 61:594–9. doi: 10.1093/gerona/61.6.594
38. Sharma, Y, Popescu, A, Horwood, C, Hakendorf, P, and Thompson, C. Prevalence of Hypovitaminosis C and its relationship with frailty in older hospitalised patients: a cross-sectional study. Nutrients. (2021) 13:2117. doi: 10.3390/nu13062117
39. Lewis, LN, Hayhoe, RPG, Mulligan, AA, Luben, RN, Khaw, K-T, and Welch, AA. Lower dietary and circulating vitamin C in middle- and older-aged men and women are associated with lower estimated skeletal muscle mass. J Nutr. (2020) 150:2789–98. doi: 10.1093/jn/nxaa221
40. Wu, D, Wang, H, Wang, W, Qing, C, Zhang, W, Gao, X, et al. Association between composite dietary antioxidant index and handgrip strength in American adults: Data from National Health and nutrition examination survey (NHANES, 2011-2014). Front Nutr. (2023) 10:10. doi: 10.3389/fnut.2023.1147869
41. Fingeret, M, Vollenweider, P, and Marques-Vidal, P. No association between vitamin C and E supplementation and grip strength over 5 years: the Colaus study. Eur J Nutr. (2019) 58:609–17. doi: 10.1007/s00394-018-1646-9
42. Petruzzelli, MG, Marzulli, L, Margari, F, de Giacomo, A, Gabellone, A, Giannico, OV, et al. Vitamin D deficiency in autism Spectrum disorder: a cross-sectional study. Dis Markers. (2020) 2020:9292560–5. doi: 10.1155/2020/9292560
43. Khan, B, Shafiq, H, Abbas, S, Jabeen, S, Khan, SA, Afsar, T, et al. Vitamin D status and its correlation to depression. Ann General Psychiatry. (2022) 21:406. doi: 10.1186/s12991-022-00406-1
44. Matsuo, LH, Confortin, SC, Ceolin, G, Soar, C, Xavier, AJ, D’Orsi, E, et al. Association between lower serum vitamin D (25-hydroxy-cholecalciferol) concentrations and cognitive impairment in older adults: data from a populational-based cohort study in a middle-income country. Public Health Nutr. (2022) 25:2507–16. doi: 10.1017/s1368980021004407
45. Halfon, M, Phan, O, and Teta, D. Vitamin D: a review on its effects on muscle strength, the risk of fall, and frailty. Biomed Res Int. (2015) 2015:241. doi: 10.1155/2015/953241
46. Bruyere, O, Cavalier, E, Buckinx, F, and Reginster, J-Y. Relevance of vitamin D in the pathogenesis and therapy of frailty. Curr Opin Clin Nutr Metab Care. (2017) 20:26–9. doi: 10.1097/mco.0000000000000334
47. Kim, J, Lee, Y, Won, CW, Kye, S, and Shim, JS. Association of serum vitamin D with frailty in older Korean adults. Maturitas. (2020) 134:15–20. doi: 10.1016/j.maturitas.2020.01.008
48. Buta, B, Choudhury, PP, Xue, QL, Chaves, P, Bandeen-Roche, K, Shardell, M, et al. The Association of Vitamin D Deficiency and Incident Frailty in older women: the role of Cardiometabolic diseases. J Am Geriatr Soc. (2017) 65:619–24. doi: 10.1111/jgs.14677
Keywords: circulating micronutrients, frailty, genome-wide association studies, Mendelian randomization, meta-analyses
Citation: Kuribanjiang K, Min Y, Yan S, Chen S, Aiheti N, Wupuer A, Wang J, Peng X, Li Y, Li H, Dong Y, Fan Y, Yang L and Zhao J (2024) A Mendelian randomization study to examine the causal associations of circulating micronutrient levels with frailty risk. Front. Nutr. 11:1386646. doi: 10.3389/fnut.2024.1386646
Edited by:
Roberta Zupo, University of Bari Aldo Moro, ItalyReviewed by:
Alexander Johannes Michels, Oregon State University, United StatesEknath D. Ahire, MET Bhujbal Knowledge City, India
Orazio Valerio Giannico, Local Health Authority of Taranto, Italy
Copyright © 2024 Kuribanjiang, Min, Yan, Chen, Aiheti, Wupuer, Wang, Peng, Li, Li, Dong, Fan, Yang and Zhao. This is an open-access article distributed under the terms of the Creative Commons Attribution License (CC BY). The use, distribution or reproduction in other forums is permitted, provided the original author(s) and the copyright owner(s) are credited and that the original publication in this journal is cited, in accordance with accepted academic practice. No use, distribution or reproduction is permitted which does not comply with these terms.
*Correspondence: Lei Yang, xjyanglei_616@sina.com; Jianping Zhao, zhaojianping@126.com
†These authors have contributed equally to this work