Changes in biochemical composition of Ethiopian Coffee arabica with growing region and traditional roasting
 Dhaba Mengesha
 Negussie Retta1
  Henock Woldemichael Woldemariam
 Paulos Getachew
- 1Center for Food Science and Nutrition, College of Natural and Computational Sciences, Addis Ababa University, Addis Ababa, Ethiopia
- 2Ethiopian Institute of Agricultural Research (EIAR), Addis Ababa, Ethiopia
- 3Department of Food Engineering, College of Biological and Chemical Engineering, Addis Ababa Science and Technology University, Addis Ababa, Ethiopia
Updating the biochemical composition of coffee beans across the years is necessary. This is important to understand the vulnerability of coffee toward climate adaptation longitudinally. Accordingly, in this study the influence of growing area and traditional roasting on the biochemical composition of five common Ethiopian Arabica coffee beans collected in the harvest year of 2021/22 were investigated. With an average of 11.34 g/100 g, the Hararge and Jimma coffee beans had the highest crude fat content (p < 0.05). The crude protein content of the five varieties was in the range of 13–15 g/100 g, with respective highest and lowest contents in the (Hararge and Nekemte) and (Sidama and Yirgachefe) coffee beans (p < 0.05). The total phenolic content (TPC) of the coffee beans was in the order of Jimma (46.52) > Nekemte (44.55) > Sidama (44.31) > Hararge (39.02) > Yirgachefe (34.25) mg GAE/100 g. The 50% inhibitory concentration (IC50) of ascorbic acid, coffee bean extract from Jimma and Hararge against 2,2-diphenyl-1-picrylhydrazyl (DPPH) free radical was 19.86, 20.22 and 20.02 μg/mL, respectively. The respective highest and lowest caffeine concentration was obtained in the Yirgachefe (10.38) and Hararge (7.55 g/100 g) coffee beans (p < 0.05). The Jimma, Sidama, and Nekemte coffee varieties had the highest chlorogenic acid content of 45 g/100 g (p > 0.05); whereas the lowest content was in Hararge coffee (36.78 g/100 g). While the caffeine concentration did not show significant (p > 0.05) difference, with all the coffee beans the roasting has reduced significantly the TPC, trigonelline and mainly the chlorogenic acid (p < 0.05). These data can update the existing facts on biochemical diversity of coffee beans in the country which can be used for evidence based innovations of climate adaptation in predicting the quality of coffee. Further recommendation of optimizing the traditional coffee processing method is supported from this study.
Introduction
Coffee is one of the most widely sold and consumed drinks worldwide (1, 2). It is valued for its flavor, pleasant aroma, invigorating impact, and several health benefits (3, 4). The world’s coffee production amounted to 70% is derived from Coffea arabica. The remaining 30% is produced by Coffea canephora and Coffea liberica (5, 6). Coffea arabica originated in Ethiopia and there is significant genetic diversity in the country. Ethiopia is the highest producer of coffee in Africa and the fifth major exporter in the world next to Brazil, Vietnam, Colombia, and Indonesia, contributing to 4.2% of the total world coffee production (7). According to Tefera et al. (8) and Worku (9), the coffee industry in Ethiopia leads the agriculture sector in terms of its contribution to the national economy overall and to exports in particular. Coffee’s quality, which is determined by its biochemical makeup, is one of the key factors that affect its market price and customer preference. For example, there is a considerable correlation between high amounts of caffeine and trigonelline coffee beans and high-quality cups (10).
Because Ethiopia has diverse agro-ecologies, its farmers are able to produce high-quality coffee with a range of biochemical compositions (11, 12). Thus, in each coffee region, different coffee varieties that are thought to have distinct quality attributes are recognized in the local and/or international markets; these include the coffees of Harar in the east, Sidamo, Yirgacheffe, Guji, and Kochere in the south, Jimma, Limmu, Kaffa, Bebeka, and Tepi in the southwest, Lekemt (Wellega) coffee in the west, and Wenbera and Zegie coffees in the northwest (13). Geography is one of the environmental factors affecting coffee quality as areas suitable for agriculture are shifting with climate change. Hence, cultivating coffee in different geographic areas is associated with variation of key secondary metabolites driving its quality. However, research gaps were found regarding the effects of climate change on the directionality of coffee quality and how this varies with location, elevation, and management conditions (14). For this purpose, updating the existing biochemical composition and quality attributes of coffee beans across the years is necessary. Besides, despite several studies reported on the coffee quality performance in different regions of Ethiopia (12, 15, 16), there is no comprehensive research on the biochemical composition (macronutrients, bioactive compounds) and antioxidant activity of Ethiopian coffee across coffee-growing regions as to our knowledge.
The majority of chemicals associated with coffee’s aroma are formed when the green bean is partially destroyed during roasting via Maillard reaction. Hence, the roasting of coffee alters the biochemical composition, such as free amino acids, sugar, chlorogenic acids and trigonelline content (17–19) as well as sensory quality (20–22). High levels of caffeoylquinic acids, feruloylquinic acids and their oxidation products are, however, associated with poor cup quality and off-flavor (13). Therefore, the study on the influence of coffee roasting on the biochemical composition is necessary. However, there are limited reports on the influence of Ethiopian traditional roasting on the biochemical compositions of the mentioned coffee varieties.
Therefore, this study assessed the effect of coffee origins from the top five major coffee producing areas of Ethiopia (Jimma/Limu, Sidama, Hararge, Nekemte, and Yirgacheffe) and traditional roasting on the its biochemical composition and quality attributes.
Materials and methods
Climate characteristic of the study areas (2021/22)
Hararge zone: Hararge is in the eastern highlands of Ethiopia with an elevation ranging between 974 and 3,264 m mean above sea level (m.a.s.l) (average 2047 m). The mean annual rainfall of the area is 820.01 mm. The mean annual temperature is around 15–20°C. The soil type in this study area is sandy, clay loam with the sand dominating the proportion (23).
Sidama zone: this study area is located in the Sidama regional state which is located in the southern part of the country. Altitude ranges from 560 to 2,300 m m.a.s.l (average 1,694 m) with the average annual temperature of 27.2°C. The average annual rainfall ranges between 700 and 1,200 mm. The dominant soil types in this study area are clay, silt and sand, respectively. The rainfall pattern in the area is bimodal, which occurs in the summer and spring seasons (24).
Yirgachefe zone: located in the Gedeo Zone of the Southern Nations, Nationalities and Peoples’ Region (SNNPR) of Ethiopia. This town has an elevation between 200 to 1,919 m m.a.s.l (average 1,570 m). The mean annual temperature of the zone range from 18 to 25°C with annual rainfall varying from 150 to 1,000 mm per year. Nitisols are the dominant soil type in this area (25).
Jimma zone: Jimma is located in the Western part of the country with altitude range between 1,200 to 3,020 m m.a.s.l (average 1,657 m), where the rainfall amounts to 1,500 mm per year. Jimma is very warm year-round, with the daily maximum temperature between 24 and 27°C. Nitisols are the dominant soil types in the zone (26, 27).
East Wollega zone: the altitude of the study area ranges from 1,300–3,140 m m.a.s.l (average 2,123 m), and the district has various topographic features. The area has average annual temperature of 21.5°C with annual rainfall between 291.8 to 1325.6 mm. The dominant soil type in the area is nitisol (28, 29).
Sample collection
In this study, five Coffee arabica varieties (Jimma/Limu, Sidama, Hararge, Nekemte, and Yirgacheffe) were selected because they are top highly produced and consumed varieties in Ethiopia. Furthermore, these varieties grow in different agro-ecological areas, which is the core to address the objective of the study to evaluate its influence on the biochemical composition of the beans. From each variety a composite sample was collected from the major producing sites of the agro-ecological regions. The sampling was replicated in time and space three times in the harvest year of 2021/22. The samples were collected unwashed or dry-processed for wholesome coffee quality. The raw coffee bean varieties were physically examined for defects, odor quality, size, and shape, then packed and stored in polyethylene bag.
Sample preparation
The coffee samples were subdivided into two for green and roasted bean analysis. About 100 g coffee beans were ground to a fine particle size (<0.5 mm) using a coffee grinder (Probat BRZ6, Germany) for biochemical composition analysis. The other half, 100 g of green coffee beans were roasted at 190°C on Ethiopian traditional coffee roaster (earthenware) to a medium level for 16 min. Then, the roasted coffee was grounded (~0.75 mm) using an electrical coffee grinder (Mahlkoing, Germany) after air-cooling.
Proximate analysis
The moisture, crude protein, crude fat, and total ash contents of the coffee samples were analyzed according to the methods of the Association of Official Analytical Chemists (30). Moisture content was determined by oven drying at 105°C to constant weight (protocol no: AOAC. 925.10). The crude protein content (N × 6.25) was determined by the Kjeldahl method based on determination of nitrogen content (AOAC. 981:10) (INOK1160 Automatic Kjeldahl Protein/Nitrogen Analyzer). The crude fat content was determined using the semi-automatic Soxtec system (AOAC 991:36; Barnstead Electro-thermal, Staffordshire, United Kingdom). Total ash was determined gravimetrically in a heated muffle furnace (Muffle furnace size 2, England) at 550°C. Total carbohydrate content was calculated by difference as follows:
The gross energy was calculated from protein, fat, and carbohydrate values, as follows:
Sample extraction for bioactive compounds
Total phenolic, flavonoid content, antioxidant activity and bioactive compounds in the green and roasted coffee were extracted using the methodology by Amigo-Benavent et al. (31) with some modifications. Briefly, 3 g of each powder sample was mixed with 20 mL of 80% methanol and placed in a shaking incubator (Lucadema, Brazil) at 40°C and 120 rpm for 30 min. Then, the content was centrifuged for 15 min at 114 g in an Excelsa Baby II centrifuge (Fanem, model 206-R). The supernatant was used to determine the phenolic compounds. Each extraction was carried out in triplicate.
Determination of total polyphenol content
The TPC was estimated by the Folin–Ciocalteu method (32). Gallic acid was used to make the standard curve for quantification of TPC. Gallic acid standard solutions: 2, 4, 6, 8, 10, and 12 mg of gallic acid were weighed and one milliliter of ethanol was added. This was followed by adding 3 mL of distilled water. Then, 0.1 mL of Folin–Ciocalteu reagent was mixed. After 3 min, 0.3 mL of 2% sodium carbonate solution was followed and the volumetric flasks were adjusted to the mark with ethanol. The whole content was kept at 25°C for 2 h. Then, the wavelength of the spectrophotometer was adjusted to 765 nm. At first, the device was zeroed with ethanol, and then the absorbance of each of the solutions was read three times and the average was recorded. Then, standard curve was developed and the line equation was used for the quantification.
For the coffee samples, 10 mg of the green bean extract was weighed, placed in a test tube, and 2 mL of dimethyl sulfoxide (DMSO) solution was added to completely dissolve the extract. For each extract, three 5 mL volumetric flasks were used for triplicate measurements. Each of the volumetric flasks contained 3 mL of distilled water and 0.20 mL of each extract. Then, 100 μL of Folin–Ciocalteu reagent was added and after 3 min, 0.3 mL sodium carbonate (2%) followed. Then, the volumetric flasks were adjusted to the mark with distilled water. A 5 mL control volumetric flask containing 0.20 mL of DMSO instead of the extract was used as control. The whole content was homogenized and placed at 25°C for 2 h. Then, the absorbance of each solution was read three times using a UV–Vis spectrophotometer (Model UV-2100, United States) at 765 nm. The TPC was expressed as mg of GAE/100 g of extract (Eq. 3).
where;
C = gallic acid equivalent concentration obtained from the calibration curve (g/mL).
V = volume of the extract’s stock solution (mL).
M = dry weight of the extract in the stock solution (g).
D = dilution factor.
Total flavonoids content
The TFC was determined by applying the aluminum chloride colorimetric method according to Magalhães et al. (33). Flavonoid concentration was deduced from the range of the calibration curve established using quercetin. The total flavonoid contents of the green coffee beans were determined using a UV–Vis spectrometer (Model UV-2100, Made in the United States) (34). Briefly, a 20 μL aliquot of the coffee extract (prepared as mentioned above) was mixed with 20 μL of 5% NaNO2 solution and incubated for 5 min. Subsequently, a 40 μL aliquot of 10% aqueous solution of AlCl3, 75 μL of 1 M aqueous solution of NaOH, and 100 μL of distilled water were added, and the absorbance of the resulting mixture was recorded at 415 nm. Distilled water (20 μL) treated similarly as the samples was used as a blank. Quercetin was used as the reference standard to express the total flavonoid content of the coffee samples. A stock solution of quercetin (500 mg/L) was prepared by dissolving 50 mg in 100 mL of 5% aqueous methanol. The calibration standards (25–250 mg/L) were treated with the same reagents and incubated under identical conditions as the samples to develop the calibration curve. The total flavonoid contents of the coffee samples were expressed as mg quercetin equivalents (QE) per 100 g of dry mass. The analysis was done in triplicate.
Anti-oxidant assay using DPPH scavenging capacity
The ability of the coffee extracts to scavenge the free radical 2,2-diphenyl-1-picrylhydrazyl (DPPH) was measured according to the method by Fukumoto and Mazza (35). One mL of DPPH solution and 1 mL of methanol were mixed and stored at 25°C for 30 min. Then, using a UV–Vis spectrophotometer (Model UV-2100, United States), the absorption of the solution was measured at 517 nm. Ascorbic acid (standard), 25 mg was weighed and completely dissolved in 25 mL of methanol in a 25 mL volumetric flask (1 mg/mL). Then, concentrations of 0.02, 0.04, 0.08, 0.12, 0.16, and 0.20 mg/mL of the solution from the stock solution were prepared. To prepare the sample solution, 25 mg of each of the methanol extracts from the coffee samples was weighed, poured into a 25 mL volumetric flask, and mixed with methanol. Then, the whole content was well homogenized. The stock solution was prepared at a concentration of 1 mg/mL. Six solutions with concentrations of 0.02, 0.04, 0.08, 0.12, 0.16, and 0.20 mg/mL were prepared. One milliliter of each of the above solutions was mixed with 1 mL of the DPPH solution and kept at 25°C for 30 min. Then, the absorption of the solution at 517 nm wavelength was read using UV/Vis spectrophotometer, starting with the control solution and then reading the samples in order of increasing concentration. The analysis was replicated three times, and after averaging the data, the 50% inhibitory concentration of the extracts to scavenge the radical (IC50) was determined. The percentage of inhibition was calculated using the following equation:
where:
Abs = absorbance.
Bioactive compounds analysis
Extraction of caffeine, trigonelline, and chlorogenic acids
Caffeine (CAF), chlorogenic acid (CGA), and trigonelline (TRG) extractions were done following the method by Heo et al. (36) with some modifications. About 0.5 g finely ground coffee powder was accurately weighed into a 50 mL Erlenmeyer flask. Heated (95°C) distilled water (50 mL) was added and stirred for 20 min. Then, the extract was filtered using Whatman No. 4 filter paper and subsequently through a 0.22 μm pore size and a 10 μL specimen was injected into the high performance liquid chromatography (HPLC) (Agilent 1,260 Infinity, Germany).
Determination of trigonelline, caffeine, and chlorogenic acid
Simultaneous determination of TRG, CGA, and CAF was done using the HPLC system consisting of a Discovery C18 column with an gradient flow rate of 0.7 mL/min and a methodology adapted from Heo et al. (36) with some modifications. The column used was a 4.6 × 250 mm with 5 μm particle size (Waters, Taunton, United States). Elute solvents containing 5% acetic acid (A) and acetonitrile (B) were as follows: 0–4 min: 4% B; 4–8 min: 10% B; 8–12 min: 90% B; 12–15 min: 0% B; and 15–17 min: 4% B, at a flow rate of 0.7 mL/min. A 3 min post-run was used. TRG and CAF were detected at 272 nm, while CGA was detected at 320 nm. Triplicate measurements were used for quantification of these compounds. TRG and CAF were evaluated at 5, 10, 20, 40, 50, 100, and 150 μg/mL. Whereas, CGA was evaluated over the range of 5, 10, 20, 100, 150, and 200 μg/mL. CAF, TRG, and CGA were identified by comparing the retention times of the CAF standard (99%) (Fischer Scientific), TRG standard (Sigma Aldrich), and CGA standard (Acros organics) and their concentrations calculated from peak areas using calibration equations. The limits of detection (LOD) and quantification (LOQ) for caffeine, trigonelline and chlorogenic acid were (0.90, 1.70), (1.02, 2.30), and (1.50, 3.00) μg/g, respectively.
Statistical data analysis
The results were expressed as the mean and standard deviation of three different determinations. Data analysis was performed by using the statistical software package SPSS 23 (IBM Corp, United States). Analysis of variance (ANOVA) was used to test significant differences at p < 0.05 between mean values of biochemical composition of green beans among the growing regions and upon traditional roasting.
Results and discussion
Macronutrient composition
One of the most important factors supporting producers like Ethiopia succeed in the global coffee market is coffee quality. More crucially, as is commonly seen in the present global market, coffee quality dictates its relative price. However, climate-driven changes are impacting crops in multiple ways including changes in the geographic ranges suitable for cultivation and crop quality (14). Therefore, continuous evaluation of the biochemical makeup of coffee varieties in different geographical locations is important to model the longitudinal impact of climate change on coffee quality compositions. These quality parameters include physical, organoleptic, and biochemical components (i.e., macro- and micronutrients, and secondary metabolites) (15).
In this study, the macronutrient composition of the different agro-ecological origin Ethiopian C. arabica varieties is presented in Table 1. The green C. arabica from the Hararge and Jimma origins had the highest crude fat content (p < 0.05), averaging 11.34 g/100 g. Likewise, Ahmed et al. (14) reported higher lipid content in coffee beans with higher altitude areas like Hararge. The average lipid content of green coffee beans was reported by Risticevic et al. (37) to be between 13 and 17 g/100 g, which are higher than the values found in the current study. Coffee from the Sidama origin had the highest crude fiber content (30 g/100 g; p < 0.05), whereas coffee from the Hararge origin had the lowest value (25 g/100 g). At 4 g/100 g (p < 0.05), the Nekemte coffee beans had the highest total ash level (Table 1). Numerous studies showed that growing coffee in various regions led to variations in a number of primary metabolites, such as lipids, sugars, amino acids, and minerals. For example, when Coffea Arabica is transplanted outside of its place of origin, Ethiopia, lipid content decreased (14). Thus, geographical origin, fertilizer usage, and genetics are thought to affect coffee quality and biochemical composition (13, 38, 39).
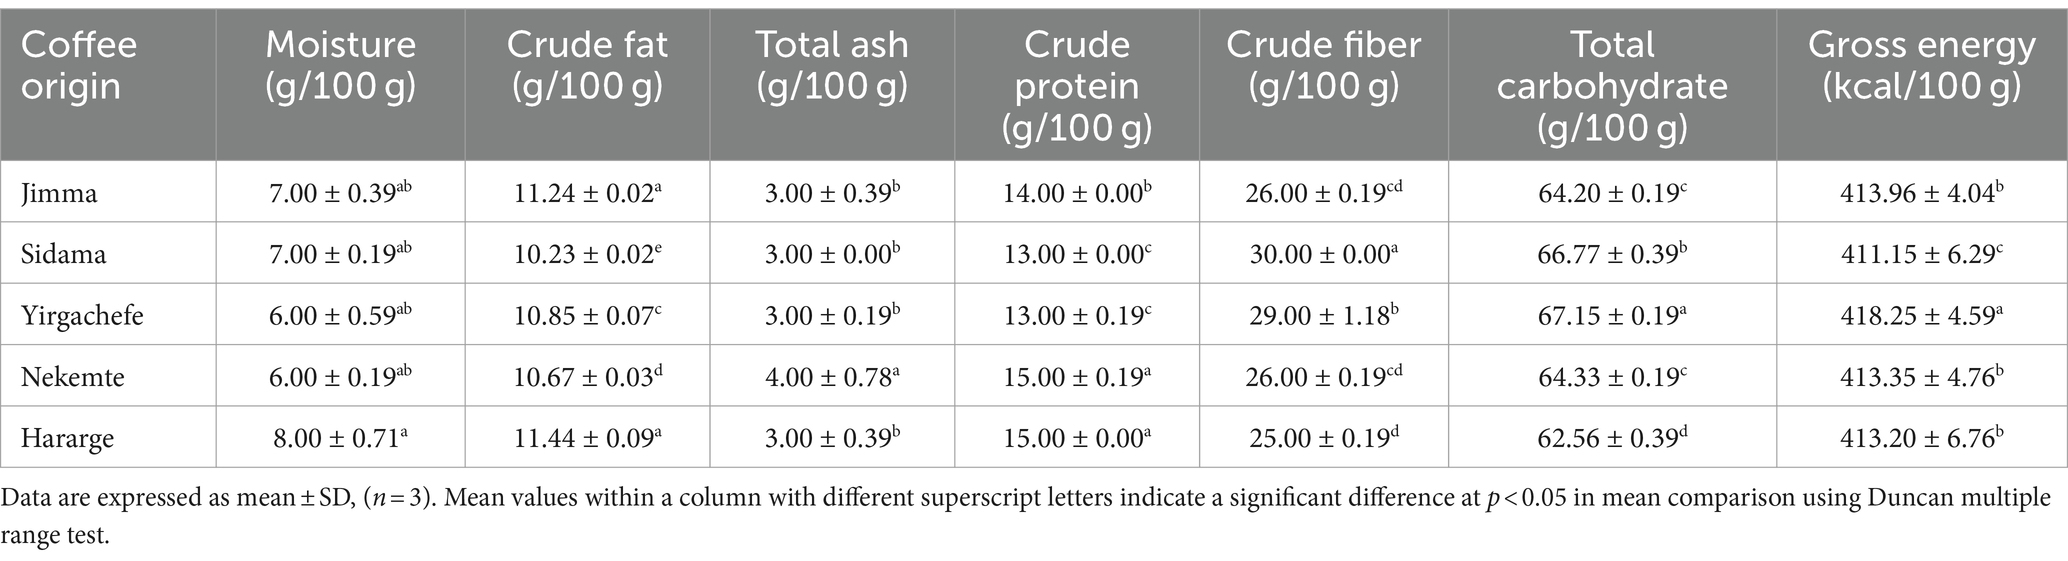
Table 1. Macronutrient composition of Ethiopian green Coffee arabica varieties grown in different agro-ecological areas.
Proteins are known flavor precursors in coffee being denatured and fragmented during roasting (40). Hence, evaluating the protein content of coffee beans is important across different agro-ecological origins. Accordingly, the crude protein content of the five Ethiopian C. arabica varieties was in the range of 13–15 g/100 g (Table 1). These values are within the range reported by Oliveira et al. (41), 11.0–16.5 g/100 g. Comparably, the crude protein level (14.9–17.0 g/100 g) matched the values reported in commercial coffee beans grown across Brazil (42). In this study, the highest and lowest crude protein content was obtained in the Hararge and Nekemte (15 g/100 g) and Sidama and Yirgachefe (13 g/100 g) coffee beans (p < 0.05). Degefa et al. (7) reported the protein content of 104 coffee bean samples from Ethiopia for different coffee genotypes ranged from 6.93–10.14 g/100 g. The highest carbohydrate content (67.15 g/100 g) was obtained in the Yirgachefe coffee. The altitude at which coffee is cultivated is the most significant environmental component that is frequently associated with coffee quality. The lowest daily temperatures at higher altitudes produce Arabica coffee of the highest quality because they cause the beans to ripen more slowly and provide bean filling more time. Thus, a longer maturation period increases the plant’s likelihood of obtaining enough minerals and nutrients from the soil. More buildup of biochemical compositions will result from this (43). This might be the case of the Hararge coffee’s better composition of the majority of macronutrients (Table 1).
Total phenolic, flavonoid, chlorogenic acid, trigonelline, and caffeine content
Coffee is a rich source of bioactive compounds especially polyphenols. These compounds contribute to the total polyphenol intake in diet and are beneficial to consumer health (44). The total phenolic content (TPC) of the coffee beans was in the order of Jimma (46.52) > Nekemte (44.55) > Sidama (44.31) > Hararge (39.02) > Yirgacheffe (34.25) mg GAE/100 g (Table 2). Likewise, there was a variation in the total flavonoid content (TFC) in order of Nekemte (50.10) > Jimma (45.10) > Yirgacheffe (37.80) > Sidama (37.30) > Hararge (31.50) mg QE/100 g. The Jimma and Nekemte coffee varieties had the highest TPC and TFC, respectively, (p < 0.05) (Table 2). Likewise, Masek’s et al. (45) investigation on five distinct Ethiopian coffee brands revealed a noteworthy total phenolic content and antioxidant activities, suggesting potential applications for Ethiopian coffee in the prevention and treatment of a number of degenerative disorders.
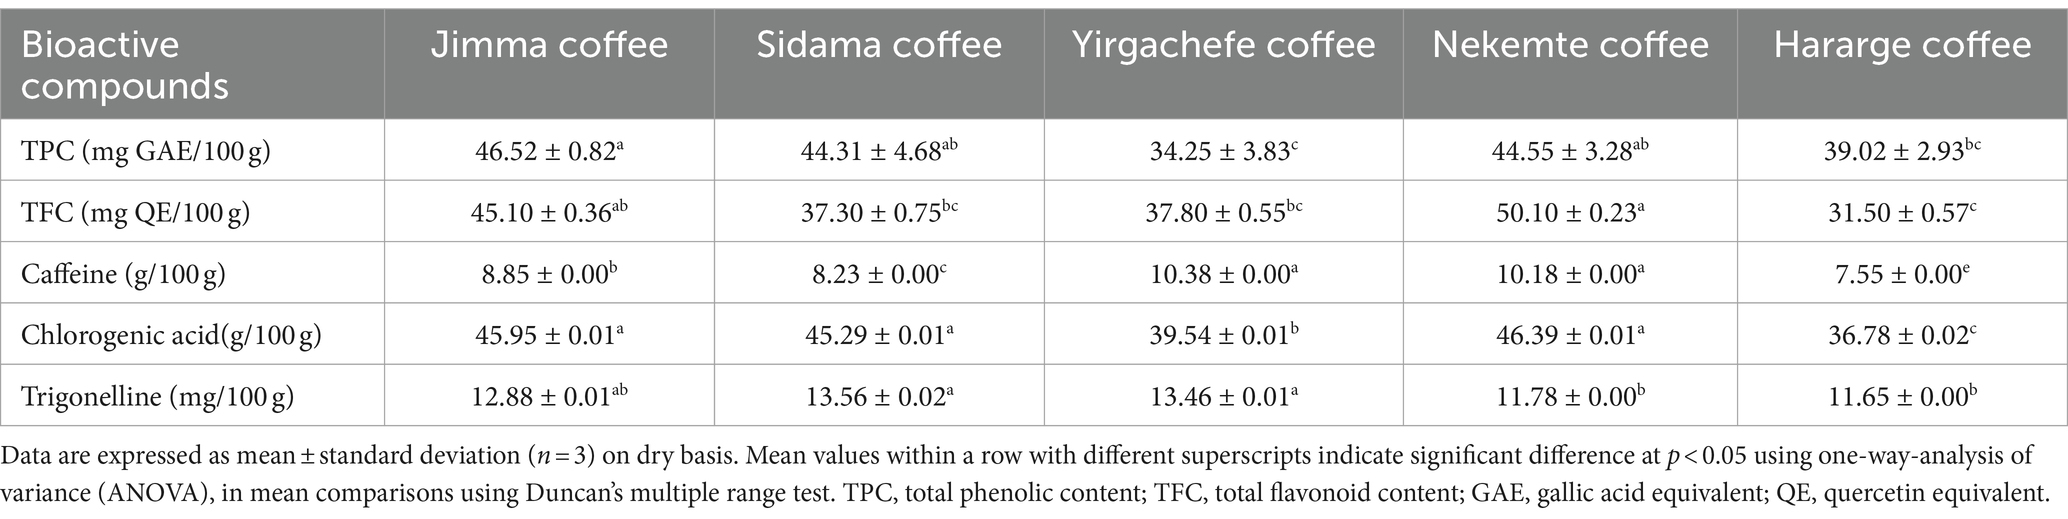
Table 2. Total phenolic, flavonoid, chlorogenic acid, trigonelline, and caffeine content of Ethiopian green Coffee arabica varieties grown in different agro-ecological areas.
The cup quality of coffee is influenced by a number of phytochemicals, including sugar levels, oil, methylxanthines, and chlorogenic acid (46). However, according to Sualeh et al. (15), the most often used standards for assessing the quality of coffee are caffeine, trigonelline, and chlorogenic acids. Therefore, in this study, the influence of agro-ecology on these biochemical makeups of coffee was evaluated. The caffeine content of the five Ethiopian C. arabica varieties was in the range of 7.55–10.38 g/100 g. The respective highest and lowest caffeine concentration was obtained in the Yirgachefe and Hararge coffee beans (p < 0.05). Except between Nekemte and Yirgachefe varieties, between all there was a significant difference in caffeine content (p < 0.05). Coffee’s distinctive bitterness is attributed to caffeine, an alkaloid and nitrogenous secondary metabolite (47). Generally, the higher the caffeine content the bitter is its taste and thus the lower is its cup quality (48). Similarly, Sualeh et al. (15) reported a significant variation in caffeine content of coffee beans collected from nine districts of Southwest Ethiopia (i.e.0.85–1.73 g/100 g). This value is lower than in the present study. Also the caffeine content in this study is higher than the report by Farah (49) (i.e., 0.9–2.5 g/100 g) in different coffee varieties. Likewise, Worku et al. (13) reported that caffeine content was the most varied variable among the localities across the five coffee regions in Ethiopia. In less popular coffee growing region of Ethiopia, Amhara region (northern Ethiopia), Wale et al. (50) reported the caffeine content ranged from 0.78 to 1.55 g/100 g in green coffee beans grown in different zones of the region. These values are lower than in the present study.
The main phenolic components of green coffee are chlorogenic acids. These are quinic acid and trans-hydroxycinnamic acid esters (46). These chemical groups are recognized to be in charge of giving coffee beverages their color, flavor, bitterness, and astringency (51). Chlorogenic acids make up about 6–12% of the dry weight of green coffee beans (52). In this study, the Jimma, Sidama, and Nekemte coffee varieties had the highest chlorogenic acid (p > 0.05) 45 g/100 g compared with the other two (p > 0.05). The Hararge variety had the lowest chlorogenic acid, 36.78 g/100 g (Table 2). The chlorogenic acid concentration of a given coffee variety has inversely correlated with its beverage quality where higher content was observed in coffee varieties that had lower beverage quality (48). The chlorogenic acid content ranged between (2.80–5.42 g/100 g) in the green coffee beans collected from Southwest Ethiopia nine districts (15). In the green coffee beans collected from the northern part of Ethiopia, Wale et al. (50) reported chlorogenic acids content ranged from 3.29–7.73 g/100 g. Farah (49) reported chlorogenic acid contents of different coffee varieties within the range of (4.1–11.3 g/100 g). All these prior studies reported a lower content of chlorogenic acid than the present study. Chlorogenic acids have strong antiviral, antidiabetic, antioxidant, and neuroprotective activity (53).
Similarly, the Jimma, Sidama, and Yirgachefe coffee varieties had the highest trigonelline contents of 12.88, 13.56, and 13.46 mg/100 g, respectively (p > 0.05). The lowest concentration was reported in the Nekemte and Hararge varieties (11.78 and 11.65 mg/100 g respectively, p > 0.05) (Table 2). Sualeh et al. (15) reported a significant variation in trigonelline content of coffee beans collected from nine districts of Southwest Ethiopia (i.e., 0.80 to 1.08 g/100 g). Wale et al. (50) reported trigonelline content of 0.53–1.27 g/100 g in green coffee beans collected from the northern part of the country. These prior studies reported lower values of trigonelline than the present study indicating its dependence on agro-ecological variation. According to Mehari et al. (46), trigonelline, also known as N-methylpyridinium-3-carboxylate, is the second most common alkaloid in coffee, behind caffeine. Although trigonelline can also be found in barley, corn, onions, peas, soybeans, and tomatoes, coffee is the main source of this compound (54).
Overall, the variations observed among the coffee regions in their TPC, TFC, caffeine, chlorogenic acid, and trigonelline content can be linked to the variation in growing environment conditions (i.e., altitude, soil type, rainfall and other agricultural practices) (15). For example, the southwestern, western and northwestern regions have a higher total rainfall and a longer rainy period than Hararge and southern regions (13). This highly influences the TPC (55). These environmental-driven changes in crop quality may be offset by climate adaptation strategies and other management conditions. However, fewer studies have focused on effects on crop quality (14). For instance, as such geographic variations resulted in shifts in important odor-active markers of coffee including the volatiles 2,3-butanedione, 2,3-pentanedione, 2-methylbutanal, and 2,3-dimethylpyrazine (14). Therefore, across the years evaluation of the biochemical composition of coffee beans is necessary for evidence based innovations of climate adaptation in predicting the quality of coffee. This study is approached in such a way to contribute to the database, besides evaluating the influence of geographical origins on biochemical composition.
DPPH radical scavenging activity
With concentration the DPPH scavenging of all the coffee varieties increased (p < 0.05). With 200 μg/mL ascorbic acid, coffee bean extract from Jimma, Sidama, Yirgachefe, Nekemte, and Hararge scavenged the DPPH free radical by 98.76, 95.92, 99.92, 95.25, 96.94, 98.54%, respectively. For these extracts the respective IC50 values were 19.86, 20.22, 85.66, 55.43, 47.96, and 20.02 μg/mL. Overall, with all concentrations the Hararge coffee had comparable percentage inhibition of the DPPH free radical with ascorbic acid (p > 0.05). Additionally, the IC50 values of the Jimma and Hararge coffee varieties was comparable with ascorbic acid (p > 0.05). The DPPH scavenging capacity (73.33–84.16%) of Ethiopian coffee varieties was reported by (56) at 0.2 mg/mL extract concentration. Likewise, the antioxidant capacity of green coffee beans showed highly significant differences across districts of Southwest Ethiopia with percentage inhibition of DPPH between (67–73%) (15). Coffee has been noted as an effective in vitro and ex vivo antioxidant source and is the primary source of chlorogenic acid in the human diet (44). The entire antioxidant activity of coffee bean is influenced by its origin, harvesting, processing, and preparation (57). Growing origin significantly affected the coffee beans’ antioxidant activity, as shown in Table 3, which is in line with research by Khattak (58), Mishra et al. (59), and Dangles (60).
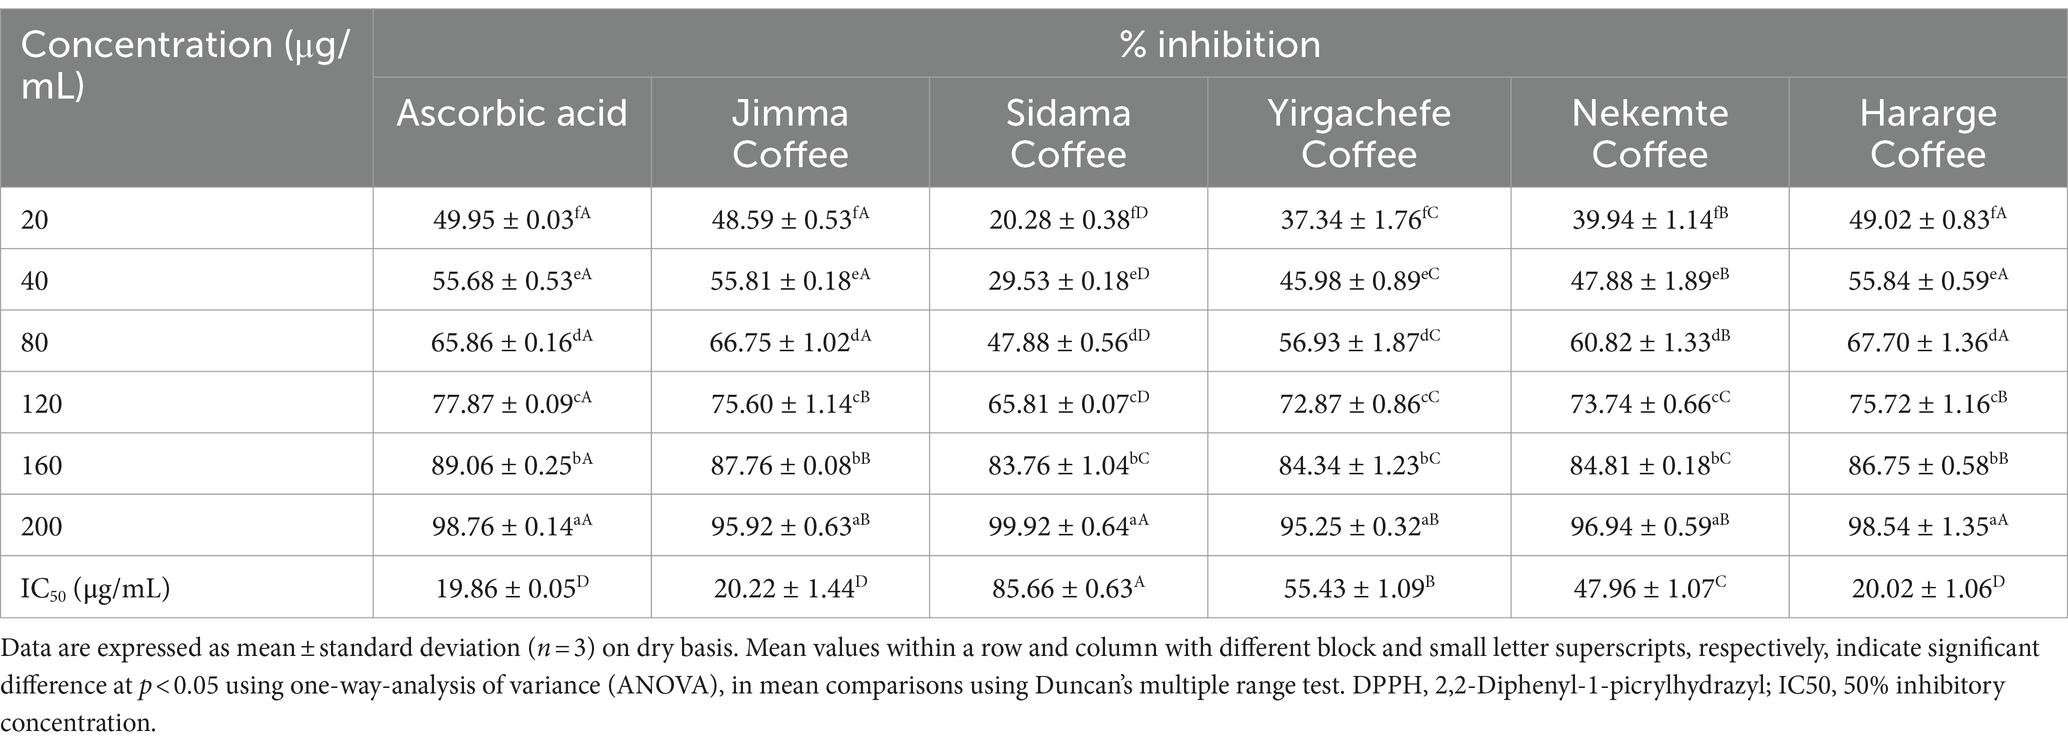
Table 3. DPPH free radical scavenging of Ethiopian green Coffee arabica varieties grown in different agro-ecological areas.
Influence of Ethiopian traditional coffee roasting on biochemical composition
Due to its bioactive compound composition, the consumption of coffee can reduce colon and oral cancer, diabetes, liver disease, inhibits the oxidation of low density lipoprotein (LDL), cholesterol, protects against Parkinson’s disease and even reduces mortality risk (44). However, the profile and content of bioactive compounds depend mainly on roasting parameters, which range from 160 to 240°C and from 8 to 24 min. Ethiopian coffee roasting and brewing is unique and widely used in every household. However, there is dearth of reports on its influence on the biochemical composition of the local coffee varieties. As reported in Table 4, with all the coffee beans the roasting has reduced significantly the TPC (p < 0.05). The percentage reduction was; Jimma (24%), Sidama (26%), Nekemte (30%), Yirgacheffe (23%), and Hararge (29%). Similarly, Krol et al. (44) reported that the content of polyphenols was significantly affected by the intensity of the roasting process and the highest content was observed for fresh light-roasted beans, while the lowest for medium roasted. Sualeh et al. (15) reported a 15.33% significant reduction in overall antioxidant activity of green coffee bean by roasting at 200°C for 8 min. On the other hand, Mayer et al. (61) found that Colombian and Kenyan coffees with higher roasting degrees had higher concentrations of phenolic compounds, such as guaiacol.
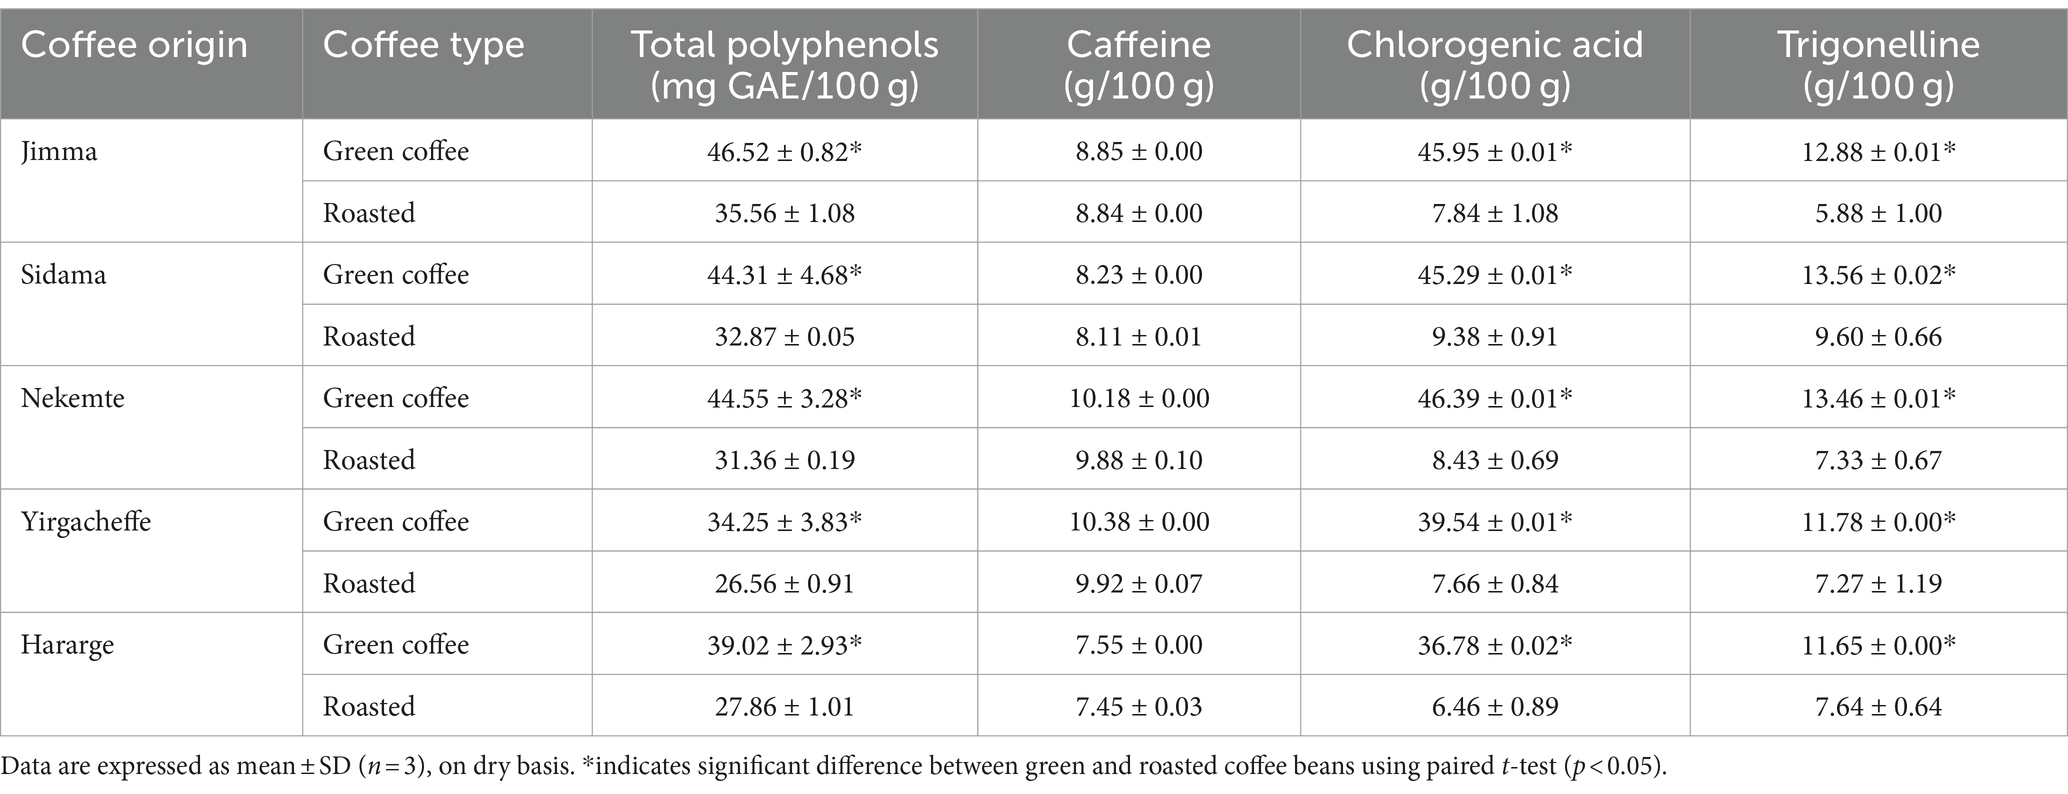
Table 4. Influence of Ethiopian traditional coffee roasting on total phenols, chlorogenic acid, trigonelline, and caffeine content of Ethiopian Coffee arabica varieties grown in different agro-ecological areas.
The highest significant percentage reduction upon roasting was in the chlorogenic acid content with all the coffee varieties (p < 0.05). The percentage reduction was: Jimma (83%), Sidama (79%), Nekemte (82%), Yirgacheffe (81%), and Hararge (82%). The average reduction was by 81% (Table 4). Likewise, Sualeh et al. (15) reported the maximum loss in biochemical content of coffee manifested in terms of percentage of chlorogenic acid by 54% due to roasting. Additionally, the trigonelline concentration varied significantly with all the coffee varieties during roasting (p < 0.05). The average reduction was 40%, with respective reductions of Jimma (54%), Sidama (29%), Nekemte (45%), Yirgacheffe (38%), and Hararge (34%) (Table 4). Sualeh et al. (15) reported a 7.69% reduction of trigonelline content in green coffee due to roasting. These reductions are due to the Maillard reaction some amount of chlorogenic acid and trigonelline changed to other form (62). However, the change in the caffeine content of coffee varieties after roasting was not statistically significant (Table 4). This is because the roasting did not change caffeine into volatile or to another chemical form. Similar observation confirmed that caffeine remained unchanged during roasting (63).
Conclusion
Coffee quality and biochemical composition are believed to vary with geographical origin and method of processing. The results of the present study showed that coffee from five major producing areas of Ethiopia including Jimma/Limu, Sidama, Hararge, Nekemte, and Yirgacheffe possess considerable biochemical differences and antioxidant potential. The second hypothesis was as well confirmed, in which the roasting reduced the bioactive compounds in the coffee beans. Hararge coffee had the highest significant content of crude fat and crude protein. The total phenolic and flavonoid contents of the five coffee bean varieties differ significantly, with the highest contents in the Jimma and Nekemte beans. With all the tested concentrations, the Hararge coffee had comparable percentage inhibition of the DPPH free radical with ascorbic acid. The respective highest and lowest caffeine concentration was obtained in the Yirgachefe and Hararge coffee beans. The Jimma, Sidama, and Nekemte coffee varieties had the highest chlorogenic acid, while the Hararge variety had the lowest content. Likewise, the Jimma, Sidama, and Yirgachefe coffee varieties had the highest trigonelline contents. With all the coffee beans the roasting has reduced significantly the total TPC and other bioactive compounds. The highest significant percentage reduction upon roasting was in the chlorogenic acid content. However, the change in the caffeine content of coffee varieties after roasting was not statistically significant. Updated data across the years on the biochemical composition of coffee varieties can be used for evidence based climate change adaptation towards the production of quality coffee.
Data availability statement
The original contributions presented in the study are included in the article/supplementary material, further inquiries can be directed to the corresponding author.
Author contributions
DM: Conceptualization, Data curation, Formal analysis, Investigation, Methodology, Software, Validation, Visualization, Writing – original draft, Writing – review & editing. NR: Conceptualization, Project administration, Supervision, Visualization, Writing – review & editing. HW: Methodology, Software, Validation, Visualization, Writing – review & editing. PG: Conceptualization, Investigation, Methodology, Supervision, Validation, Writing – original draft, Writing – review & editing.
Funding
The author(s) declare financial support was received for the research, authorship, and/or publication of this article. The study was conducted as part of Dhaba Mengesha’s Ph.D. research that was funded by Ethiopian Institute of Agricultural Research and Addis Ababa University, Center for Food Science and Nutrition.
Acknowledgments
Authors are grateful to Dr. Kassaye Tolessa and Dr. Diriba Geleti from the Food Science and Nutrition Research Program of the Ethiopian Institute of Agricultural Research for their kind support to use the facilities at their premises for biochemicalanalysis.
Conflict of interest
The authors declare that the research was conducted in the absence of any commercial or financial relationships that could be construed as a potential conflict of interest.
Publisher’s note
All claims expressed in this article are solely those of the authors and do not necessarily represent those of their affiliated organizations, or those of the publisher, the editors and the reviewers. Any product that may be evaluated in this article, or claim that may be made by its manufacturer, is not guaranteed or endorsed by the publisher.
References
1. Esteban, A, Sánchez, S, Recio, A, Pérez, S, and Olalla, M. Evaluation of differences in the antioxidant capacity and phenolic compounds of green and roasted coffee and their relationship with sensory properties. LWT Food Sci Technol. (2020) 128:1–9. doi: 10.1016/j.lwt.2020.109457
2. Haile, M, Bae, HM, and Kang, WH. Comparison of the antioxidant activities and volatile compounds of coffee beans obtained using digestive bio-processing (elephant dung coffee) and commonly known processing methods. Antioxidants. (2020) 9:1–21. doi: 10.3390/antiox9050408
3. Farag, MA, Zayed, A, Sallam, IE, and Wessjohann, LA. Metabolomics-based approach for coffee beverage improvement in the context of processing, brewing methods, and quality attributes. Food Secur. (2022) 11:1–18. doi: 10.3390/foods11060864
4. Pohl, P, Stelmach, E, Welna, M, and Szymczycha-madeja, A. Determination of the elemental composition of coffee using instrumental methods. Food Anal Methods. (2013) 6:598–613. doi: 10.1007/s12161-012-9467-6
5. Angeloni, S, Mustafa, AM, Abouelenein, D, Alessandroni, L, Acquaticci, L, Nzekoue, FK, et al. Characterization of the aroma profile and main key odorants of espresso coffee. Molecules. (2021) 26:1–29. doi: 10.3390/molecules26133856
6. Núñez, N, Saurina, J, and Núñez, O. Authenticity assessment and fraud quantitation of coffee adulterated with chicory, barley, and flours by untargeted HPLC-UV-FLD fingerprinting and chemometrics. Food Secur. (2021) 10:840. doi: 10.3390/foods10040840
7. Degefa, M, Alamerew, S, Mohammed, A, and Gemechu, A. Biochemical composition variation among southern Ethiopian Arabica coffee (Coffea Arabica L.) genotypes. Int. J. Agr. (2022) 2022:1–10. doi: 10.1155/2022/1317341
8. Tefera, A., Tefera, T., and Gray, Q. (2014). Coffee annual report. Global Agricultural Information Network (GAIN), report number: ET1402, 13 May, 2014
9. Worku, M. Quality control, quality determinants and indication of geographic origin of Ethiopian coffee. PhD Thesis. Belgium: Ghent University (2019).
10. Farah, A, Monteiro, MC, Calado, V, Franca, AS, and Trugo, LC. Correlation between cup quality and chemical attributes of Brazilian coffee. Food Chem. (2006) 98:373–80. doi: 10.1016/j.foodchem.2005.07.032
11. Girmay, T, Mesfin, R, Chandravanshi, B, Estifanos, E, Ahmed, M, and Hassen, M. Volatile profile of green coffee beans from Coffea Arabica L. plants growth at different altitudes in Ethiopia. Bull Chem Soc Ethiop. (2019) 33:401–13. doi: 10.4314/bcse.v33i3.2
12. Tolessa, K, Alemayehu, D, Belew, D, and Boeck, P. Biochemical composition of Ethiopian coffees (Coffea Arabica L.) as influenced by variety and postharvest processing methods. Afr J Food Sci. (2019) 13:48–56. doi: 10.5897/AJFS2018.1770
13. Worku, M, Astatkie, T, and Boeckx, P. Quality and biochemical composition of Ethiopian coffee varied with growing region and locality. J Food Compos Anal. (2023) 115:105015. doi: 10.1016/j.jfca.2022.105015
14. Ahmed, S, Brinkley, S, Smith, E, Sela, A, Theisen, M, Thibodeau, C, et al. Climate change and coffee quality: systematic review on the effects of environmental and management variation on secondary metabolites and sensory attributes of Coffea Arabica and Coffea canephora. Front Plant Sci. (2021) 12:708013. doi: 10.3389/fpls.2021.708013
15. Sualeh, A, Tolessa, K, and Mohammed, A. Biochemical composition of green and roasted coffee beans and their association with coffee quality from different districts of Southwest Ethiopia. Heliyon. (2020) 6:e05812. doi: 10.1016/j.heliyon.2020.e05812
16. Worku, M, Meulenaer, B, and Duchateau, L. Effect of altitude on biochemical composition and quality of green Arabica beans can be affected by shade and postharvest processing method. Food Res Int. (2017) 105:278–85. doi: 10.1016/j.foodres.2017.11.016
17. Bastian, F, Hutabarat, OS, Dirpan, A, Nainu, F, Harapan, H, Emran, TB, et al. From plantation to cup: changes in bioactive compounds during coffee processing. Food Secur. (2021) 10:1–27. doi: 10.3390/foods10112827
18. Munyendo, LM, Njoroge, DM, Owaga, EE, and Mugendi, B. Coffee phytochemicals and post-harvest handling-a complex and delicate balance. J Food Compos Anal. (2021) 102:103995. doi: 10.1016/j.jfca.2021.103995
19. Zayed, A, Abdelwareth, A, Mohamed, TA, Fahmy, HA, Porzel, A, Ludger, AW, et al. Dissecting coffee seeds metabolome in context of genotype, roasting degree, and blending in the Middle East using NMR and GC/MS techniques. Food Chem. (2022) 373:131452. doi: 10.1016/j.foodchem.2021.131452
20. Kipkorir, RK, Muhoho, SM, Muliro, PS, Mugendi, BJ, Frohme, M, and Broedel, O. Effects of coffee processing technologies on aroma profiles and sensory quality of Ruiru 11 and SL 28 Kenyan coffee varieties. Asian J. Agric. Food Sci. (2015) 3:178–88.
21. Pazmiño-Arteaga, J, Gallardo, C, González-Rodríguez, T, and Winkler, R. Loss of sensory cup quality: physiological and chemical changes during green coffee storage. Qualitas Plant. (2022) 77:1–11. doi: 10.1007/s11130-022-00953-8
22. Taveira, DJH, Borém, FM, Figueiredo, LP, Reis, N, Franca, AS, Harding, SA, et al. Potential markers of coffee genotypes grown in different Brazilian regions: a metabolomics approach. Food Res Int. (2014) 61:75–82. doi: 10.1016/j.foodres.2014.02.048
23. Hirko, A, Mergia, G, Nigussie, A, and Dandesa, T. Seasonal and annual meteorological drought frequency: case study east Hararge province (zone). Int. J. Res. Environ. Sci. (2021) 7:11–9.
24. Mathewos, M, Lencha, SM, and Tsegaye, M. Land use and land cover change assessment and future predictions in the Matenchose watershed, Rift Valley basin, using CA-Markov simulation. Land. (2022) 11:1632. doi: 10.3390/land11101632
25. Matewos, T. Characterizing Local Level Climate Change Adaptive Responses in Drought-Prone Lowlands of Rural Sidama, Southern Ethiopia. In Handbook of Climate Change Mitigation and Adaptation. Cham: Springer International Publishing. (2022) 2831–2865.
26. Dalle, D, Gecho, Y, and Bedeke, SB. Spatiotemporal variability and trends in rainfall and temperature in South Ethiopia: implications for climate change adaptations in rural communities. Adv Meteorol. (2023) 2023:1–21. doi: 10.1155/2023/1939528
27. Sime, CH, and Demissie, TA. Assessment and prediction of the climate change impact on crop yield, in Jimma zone upper Gilgel gibe districts, Ethiopia. Arab J Geosci. (2022) 15:313. doi: 10.1007/s12517-022-09605-2
28. Adula, DM, Tefera, MM, and Ayana, B. Role of underutilized crops in improving food security and livelihoods of the households: a case study in GutoGida district, Ethiopia. World J. Agric. Sci. Technol. (2023) 1:83–97. doi: 10.11648/j.wjast.20230104.12
29. Bekuma, T., Mamo, G., and Regassa, A. (2022). Variability and trends of climate in east Wollega zone, Western Ethiopia. IOP conference series: Earth and environmental science, 1016, 12032 IOP Publishing
30. AOAC. American official methods of analysis. 16th ed. Association of Official Analytical Chemists, Washington, DC, USA: AOAC. International (2016).
31. Amigo-Benavent, M, Wang, S, Mateos, R, Sarriá, B, and Bravo, L. Antiproliferative and cytotoxic effects of green coffee and yerba mate extracts, their main hydroxycinnamic acids, methylxanthine and metabolites in different human cell lines. Food Chem Toxicol. (2017) 106:125–38. doi: 10.1016/j.fct.2017.05.019
32. Roura, E, Andrés-Lacueva, C, Estruch, R, and Lamuela-Raventós, RM. Total polyphenol intake estimated by a modified Folin–Ciocalteu assay of urine. Clin Chem. (2006) 52:749–52. doi: 10.1373/clinchem.2005.063628
33. Magalhães, LM, Almeida, MIG, Barreiros, L, Reis, S, and Segundo, MA. Automatic aluminum chloride method for routine estimation of total flavonoids in red wines and teas. Food Anal Methods. (2012) 5:530–9. doi: 10.1007/s12161-011-9278-1
34. Dong, JZ, Lu, DY, and Wang, Y. Analysis of flavonoids from leaves of cultivated Lycium barbarum L. Plant Foods Hum Nutr. (2009) 64:199–204. doi: 10.1007/s11130-009-0128-x
35. Fukumoto, LR, and Mazza, G. Assessing antioxidant and prooxidant activities of phenolic compounds. J Agric Food Chem. (2000) 48:3597–604. doi: 10.1021/jf000220w
36. Heo, J, Adhikari, K, Choi, KS, and Lee, J. Analysis of caffeine, chlorogenic acid, trigonelline, and volatile compounds in cold brew coffee using high-performance liquid chromatography and solid-phase microextraction-gas chromatography-mass spectrometry. Food Secur. (2020) 9:1–20. doi: 10.3390/foods9121746
37. Risticevic, S, Carasek, E, and Pawliszyn, J. Headspace solid-phase microextraction-gas chromatographic–time-of-flight mass spectrometric methodology for geographical origin verification of coffee. Anal Chim Acta. (2008) 617:72–84. doi: 10.1016/j.aca.2008.04.009
38. Gure, A, Singh, B, and Wondimu, T. Metals in green coffee beans from major coffee-growing regions of Ethiopia. Chem Int. (2017) 4:458–68.
39. Vafadar-Yengeje, L, Amini, R, and Nasab, ADM. Chemical compositions and yield of essential oil of Moldavian balm (Dracocephalum moldavica L.) in intercropping with faba bean (Vicia faba L.) under different fertilizers application. J Clean Prod. (2019) 239:118033. doi: 10.1016/j.jclepro.2019.118033
40. Montavon, P, Mauron, AF, and Duruz, E. Changes in green coffee protein profiles during roasting. J Agric Food Chem. (2003) 51:2335–43. doi: 10.1021/jf020832b
41. Oliveira, LS, Franca, AS, Mendonça, JCF, and Barros-Júnior, MC. Proximate composition and fatty acids profile of green and roasted defective coffee beans. LWT Food Sci Technol. (2006) 39:235–9. doi: 10.1016/j.lwt.2005.01.011
42. de Carvalho, AM, de Rezende, JC, Rezende, TT, Ferreira, AD, Rezende, RM, Mendes, ANG, et al. Relationship between the sensory attributes and the quality of coffee in different environments. Afr J Agric Res. (2016) 11:3607–14. doi: 10.5897/AJAR2016.11545
43. Tolessa, K, D'heer, J, Duchateau, L, and Boeckx, P. Influence of growing altitude, shade and harvest period on quality and biochemical composition of Ethiopian specialty coffee. J Sci Food Agric. (2017) 97:2849–57. doi: 10.1002/jsfa.8114
44. Król, K, Gantner, M, Tatarak, A, and Hallmann, E. The content of polyphenols in coffee beans as roasting, origin and storage effect. Eur Food Res Technol. (2020) 246:33–9. doi: 10.1007/s00217-019-03388-9
45. Masek, A, Latos-Brozio, M, Kałużna-Czaplińska, J, Rosiak, A, and Chrzescijanska, E. Antioxidant properties of green coffee extract. Forests. (2020) 11:557. doi: 10.3390/f11050557
46. Mehari, B, Abshiro, MR, Chandravanshi, BS, Atlabachew, M, Combrinck, S, and McCrindle, R. Simultaneous determination of alkaloids in green coffee beans from Ethiopia: chemometric evaluation of geographical origin. Food Anal Methods. (2016) 9:1627–37. doi: 10.1007/s12161-015-0340-2
47. Alonso-Salces, RM, Serra, F, Reniero, F, and Heberger, K. Botanical and geographical characterization of green coffee (Coffea arabica and Coffea canephora): chemometric evaluation of phenolic and methylxanthine contents. J. Agric. Food Chem. (2009) 57:4224–4235. doi: 10.1021/jf8037117
48. Mengistu, MW, Workie, MA, and Mohammed, AS. Biochemical compounds of Arabica coffee (Coffea Arabica L.) varieties grown in northwestern highlands of Ethiopia. Cogent Food Agric. (2020) 6:1741319. doi: 10.1080/23311932.2020.1741319
49. Farah, A In: Y-F Chu, editor. Coffee: Emerging health effects and disease prevention. First ed. Blackwell Publishing Ltd.: John Wiley and Sons (2012)
50. Wale, K, Tolessa, K, Atlabachew, M, Mehari, B, Alemayehu, M, Mengistu, DA, et al. Level of caffeine, trigonelline and chlorogenic acids in green coffee (Coffea Arabica L.) beans from Amhara region, Ethiopia. J Agric Food Res. (2024) 16:101082. doi: 10.1016/j.jafr.2024.101082
51. Kreuml, MTL, Majchrzak, D, Ploederl, B, and Koenig, J. Changes in sensory quality characteristics of coffee during storage. Food Sci. Nutr. (2013) 1:267–72. doi: 10.1002/fsn3.35
52. Kulapichitr, F, Borompichaichartkul, C, Fang, M, Suppavorasatit, I, and Cadwallader, KR. Effect of post-harvest drying process on chlorogenic acids, antioxidant activities and CIE-lab color of Thai Arabica green coffee beans. Food Chem. (2022) 366:130504. doi: 10.1016/j.foodchem.2021.130504
53. Awwad, S, Issa, R, Alnsour, L, Albals, D, and al-Momani, I. Quantification of caffeine and chlorogenic acid in green and roasted coffee samples using HPLC-DAD and evaluation of the effect of degree of roasting on their levels. Molecules. (2021) 26:7502. doi: 10.3390/molecules26247502
54. Gichimu, BM, Gichuru, EK, Mamati, GE, and Nyende, AB. Biochemical composition within coffea Arabica cv. Ruiru 11 and its relationship with cup quality. J Food Res. (2014) 3:31. doi: 10.5539/jfr.v3n3p31
55. Haile, M, and Kang, WH. Antioxidant activity, total polyphenol, flavonoid and tannin contents of fermented green coffee beans with selected yeasts. Fermentation. (2019) 5:29. doi: 10.3390/fermentation5010029
56. Daniel, A, and Workneh, M. Determination of total phenolic content and antioxidant activities of five different brands of Ethiopian coffee. Nut Res. (2017) 1:2. Available at: http://escipub.com/international-journal-of-food-nutrition-research/
57. Nunes, FM, and Coimbra, MA. Melanoidins from coffee infusions. Fractionation, chemical characterization, and effect of the degree of roast. J Agric Food Chem. (2007) 55:3967–77. doi: 10.1021/jf063735h
58. Khattak, KF, and Rahman, TR. Effect of geographical distributions on the nutrient composition, phytochemical profile and antioxidant activity of Morus nigra. Pak J Pharm Sci. (2015) 28:1671–8.
59. Mishra, B, Priyadarsini, KI, Kumar, MS, Unnikrishnan, MK, and Mohan, H. Effect of O-glycosilation on the antioxidant activity and free radical reactions of a plant flavonoid, chrysoeriol. Bioorg Med Chem. (2003) 11:2677–85. doi: 10.1016/S0968-0896(03)00232-3
60. Dangles, O. Antioxidant activity of plant phenols: chemical mechanisms and biological significance. Curr Org Chem. (2012) 16:692–714. doi: 10.2174/138527212799957995
61. Mayer, F, Czerny, M, and Grosch, W. Influence of provenance and roast degree on the composition of potent odorants in Arabica coffees. Eur Food Res Technol. (1999) 209:242–50. doi: 10.1007/s002170050487
62. Ky, CL, Louarn, J, Dussert, S, Guyot, B, Hamon, S, and Noirot, M. Caffeine, trigonelline, chlorogenicacids and sucrose diversity in wild Coffea Arabica L. and C. canephora P. Accessions. Food Chem. (2001) 75:223–30. doi: 10.1016/S0308-8146(01)00204-7
Keywords: Ethiopian coffee varieties, roasting, biochemical composition, antioxidant capacity, Coffee arabica
Citation: Mengesha D, Retta N, Woldemariam HW and Getachew P (2024) Changes in biochemical composition of Ethiopian Coffee arabica with growing region and traditional roasting. Front. Nutr. 11:1390515. doi: 10.3389/fnut.2024.1390515
Edited by:
Nurhan Uslu, Selçuk University, TürkiyeReviewed by:
Cheng-Ting Zi, Yunnan Agricultural University, ChinaTiziana Nardin, Fondazione Edmund Mach, Italy
Copyright © 2024 Mengesha, Retta, Woldemariam and Getachew. This is an open-access article distributed under the terms of the Creative Commons Attribution License (CC BY). The use, distribution or reproduction in other forums is permitted, provided the original author(s) and the copyright owner(s) are credited and that the original publication in this journal is cited, in accordance with accepted academic practice. No use, distribution or reproduction is permitted which does not comply with these terms.
*Correspondence: Paulos Getachew, p_getachew@yahoo.com