 Radhakrishnan Vishnubalaji
 Varun Sasidharan Nair†
 Eyad Elkord
 Nehad M. Alajez
- Cancer Research Center, Qatar Biomedical Research Institute, Hamad Bin Khalifa University, Qatar Foundation, Doha, Qatar
Breast cancer (BC) is the leading cause of cancer-related death in women. Therefore, a better understanding of BC biology and signaling pathways might lead to the development of novel biomarkers and targeted therapies. Although a number of transcriptomic studies have been performed on breast cancer patients from various geographic regions, there are almost no such comprehensive studies performed on breast cancer from patients in the gulf region. This study aimed to provide a better understanding of the altered molecular networks in BC from the gulf region. Herein, we compared the transcriptome of BC to adjacent normal tissue from six BC patients and identified 1,108 upregulated and 518 downregulated transcripts. A selected number of genes from the RNA-Seq analysis were subsequently validated using qRT-PCR. Differentially expressed (2.0-fold change, adj. p < 0.05) transcripts were subjected to ingenuity pathway analysis, which revealed a myriad of affected signaling pathways and functional categories. Activation of ERBB2, FOXM1, ESR1, and IGFBP2 mechanistic networks was most prominent in BC tissue. Additionally, BC tissue exhibited marked enrichment in genes promoting cellular proliferation, migration, survival, and DNA replication and repair. The presence of genes indicative of immune cell infiltration and activation was also observed in BC tissue. We observed high concordance [43.5% (upregulated) and 62.1% (downregulated)] between differentially expressed genes in our study group and those reported for the TCGA BC cohort. Our data provide novel insight on BC biology and suggest common altered molecular networks in BC in this geographic region. Our data suggest future development of therapeutic interventions targeting those common signaling pathways.
Introduction
Breast cancer (BC) is the second most common type of cancer around the world comprising approximately 11.6% of new cancer cases and 6.6% of all cancer-related deaths up to 2018 (1). Among females, BC is the most frequently diagnosed and the leading cause of cancer mortality. GLOBOCAN 2018 reported region-specific incidence and age-standardized mortality rate for BC in Western Asia (incidence: 45.3/100,000, mortality: 13.6/100,000) and Eastern Asia (incidence: 39.2/100,000, mortality: 8.6/100,000) (1).
Gene expression profiling by DNA microarray have identified the inherent classification of BC into five main molecular subtypes: Luminal A (estrogen receptor (ER) +/progesterone receptors (PR) +/epidermal growth factor receptor 2 (HER2; ERBB2) –) are commonly of low score; luminal B (ER+/PR–/+/HER2+/–) are normally of higher score with more proliferation rate; HER2-enriched subtype (ER–/PR–/HER2+); triple-negative breast cancer (TNBC; ER–/PR–/HER2–); and carcinomas that are analogous to normal breast tissue and is associated with good prognosis (2–4). In addition, claudin-low cancers, metaplastic, molecular apocrine, and invasive lobular carcinomas were identified as molecularly different BCs (5). Furthermore, genome-wide association studies have identified many novel breast cancer vulnerability variants such as hereditary risk factors, encompassing four sporadic high-penetrance transcriptomes (BRCA1, BRCA2, TP53, and PTEN), four sporadic moderate: penetrance transcriptomes (CHEK2, ATM, BRIP1, and PALB2), and around twenty common low-penetrance variants in 19 genes or loci (6, 7).
The age-standardized incidence rate is growing in many countries, particularly in the Arab countries where the reported BC incidence ranges from 9.5 to 50 cases per 100,000 women per year. In the gulf region, the incidence of BC in Bahrain, United Arab Emirates, Saudi Arabia, Qatar, and Kuwait were 53.4, 22.8, 17.5, 48.2, and 46.6 cases per 100,000 women, respectively (8). Although the incidence of BC in this geographic region is lower than those reported in Europe and USA, the incidence of BC in Arab countries are on the rise (1, 9). Interestingly, patients diagnosed with BC in the Arab world are approximately a decade younger and they are oftentimes presented with larger and more advanced stage tumors (8). A previous microarray-based study comparing the clinical and gene expression profile of breast cancer from the north (France) and south (Lebanon, Tunisia, and Morocco) Mediterranean patients revealed more aggressive tumor in the south Mediterranean patient group. Tumors from the south group were predominantly luminal B, while tumors from the north were mostly luminal A subtype (10).
Recent advances in transcriptome analysis have revolutionized our understanding of human disease (11). In the current study, we utilized next generation sequencing (NGS) and bioinformatics and characterized the transcriptional landscape of BC compared to adjacent normal tissue from the gulf region and identified multiple activated networks. Our data provides the first transcriptome and network analyses of BC in this geographic region setting the foundation for future development of novel BC biomarkers and therapeutic interventions.
Materials and Methods
Ethics Statement and Sample Collection
Tumor tissues (TT) and adjacent non-cancerous normal tissues (NT) were obtained from six breast cancer patients. All patients included in the study were treatment-naive prior to surgery and were provided with a written informed consent prior to sample collection. The study was performed under ethical approval from Qatar Biomedical Research Institute, Doha, Qatar (Protocol no. 2017-006). The characteristics of patients included in current study are provided in Table 1.
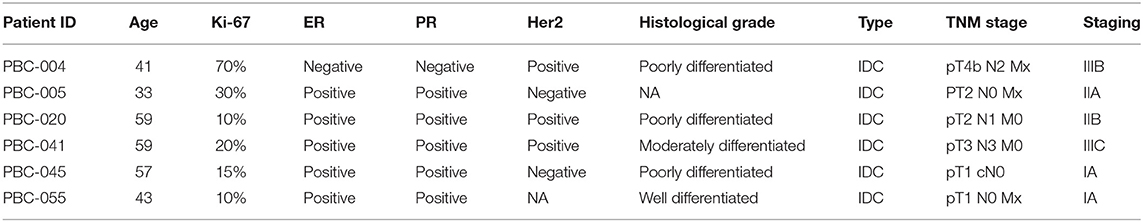
Table 1. Clinical information of patients included in current study and their tumor characteristics.
Tissue Preparation and RNA Isolation
RNA was isolated using the RNA/DNA/Protein Purification Plus Kit (Norgen Biotek Corp, Ontario, Canada) as per the manufacturer's instructions from TT and adjacent NT. Briefly, frozen tissues were transferred into a mortar containing adequate amount of liquid nitrogen and were grinded thoroughly using a pestle followed by resuspending the tissue in lysis buffer followed by RNA extraction. The concentration and purity of extracted RNA were measured using NanoDrop 2000c (Thermo scientific, MA, USA) and RNA were stored at −80°C.
RNA Concentration and Quality Assessment
The quality and quantity of extracted RNA was measured using on-chip electrophoresis utilizing the Agilent RNA 6000 Nano Kit (Agilent Technologies, CA, USA) and Agilent 2100 Bioanalyzer (Agilent Technologies) as per the manufacturer's instructions. Samples exhibited an RNA Integrity Number (RIN) > 7 were used for library preparation.
Library Preparation
The RNA was quantified using Qubit instrument (Invitrogen, USA) and RNA BR assay kit (Invitrogen). Hundred nanogram of RNA was used as an input for library preparation using TruSeq RNA Access Library preparation kit (Illumina, CA, USA) as per the manufacturer's instructions. Briefly, the RNA was fragmented into small pieces under high temperature using divalent cations. The RNA fragments were immediately reverse transcribed to first strand cDNA using random hexamers. Following the first strand, second strand was synthesized by incorporating dUTP instead of dTTP. The sequencing adaptors were ligated to the double-stranded cDNA followed by a single “A” nucleotide adenylation at 3′ end of blunt fragments. The final library was created by capturing the coding regions of the transcriptome using sequence-specific probes. The yield of cDNA libraries was quantified using Qubit dsDNA HS assay kit (Invitrogen) and size distribution of the cDNA libraries were determined using the Agilent 2100 Bioanalyzer DNA1000 chip (Agilent Technologies). The clusters were generated on a cBot cluster generation system (Illumina) and sequencing was done on Hiseq 4000 with 300 bp paired-ends.
Quantitative Reverse Transcription PCR (RT-qPCR)
One microgram of RNA from each sample was reverse transcribed into cDNA using QuantiTect Reverse Transcription Kit (Qiagen, Hilden, Germany). PCR reactions were performed on QuantStudio 7/6 Flex qPCR (Applied Biosystems, California, USA) using PowerUP SYBR Green Master Mix (Applied Biosystems). All data were normalized to β-actin. Non-specific amplifications were checked by the use of melting curve. The relative changes in target gene expression were analyzed using 2-ΔΔCT method. Sequences of primers used in current study are listed in Table 2. The primers were designed using Primer3 (http://www.ncbi.nlm.nih.gov/tools/primer-blast/).
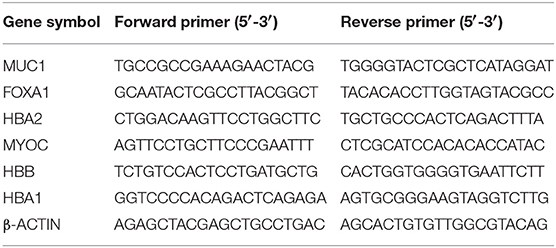
Table 2. qRT-PCR SYBR Green primer sequences used in this study.
RNA-Seq Data Analysis
Pair end reads were aligned to the hg19 human reference genome in CLC Genomics Workbench-12 (QIAGEN, Germany). The abundance of the expression of transcripts was measured as the score of TPM (Transcripts Per Million) mapped reads in CLC Genomics Workbench 12. Abundance data were subsequently subjected to differential gene expression using 2.0-fold change and < 0.05 p-value cut-off in CLC Genomics Workbench 12.
Gene Set Enrichment and Modeling of Gene Interactions Networks
Upregulated genes were imported into the Ingenuity Pathways Analysis (IPA) software (Ingenuity Systems; www.ingenuity.com/) and were subjected to functional annotations and regulatory network analysis using upstream regulator analysis (URA), downstream effects analysis (DEA), mechanistic networks (MN) and causal network analysis (CNA) prediction algorithms. IPA uses precise to predict functional regulatory networks from gene expression data and provides a significance score for each network according to the fit of the network to the set of focus genes in the database. The p-value is the negative log of P and represents the possibility that focus genes in the network being found together by chance (12, 13).
Retrieval of the Cancer Genome Atlas (TCGA) Breast Cancer Expression Data
Differentially expressed genes from the TCGA breast cancer data set were retrieved from (http://gepia.cancer-pku.cn/detail.php?gene=&clicktag=expdiy) (14). The expression profile of selected genes from the TCGA breast cancer data set was retrieved from the StarBase V3.0 database (http://starbase.sysu.edu.cn/panGeneDiffExp.php) (15).
Statistical Analysis
Statistical analyses and graphing were performed using Microsoft excel 2016 and GraphPad Prism 8.0 software (GraphPad, San Diego, CA, USA). The Benjamini–Hochberg False Discovery Rate (FDR) method was used for multiple testing corrections. For comparative qRT-PCR analysis, p-values ≤ 0.05 (two-tailed t-test) were considered significant. For IPA analyses, a Z score (2.0 ≤ Z ≥ 2.0) was considered significant.
Results
RNA-Seq Gene Expression Profiling in BC
The clinical information of the six patients included in the current study and their tumor characteristics are provided in Table 1. To characterize the transcriptional landscape alterations during malignant transformation, tumor, and adjacent normal breast tissues from six BC patients were subjected to whole transcriptome RNA-Seq analysis. As shown in Figure 1A, hierarchical clustering based on differentially expressed RNA transcripts revealed clear clustering of breast cancer from adjacent normal tissues. Using 2.0 FC and ≤ 0.05 FDR p-value cut off, 1108 upregulated and 518-downregulated transcripts were identified (Supplementary File 1). Selected number of upregulated (forkhead box A1 (FOXA1), mucin 1 (MUC1), and downregulated [hemoglobin alpha 2 (HBA2), myocilin (MYOC), hemoglobin subunit beta (HBB), and hemoglobin subunit alpha 1 (HBA1)] genes from the RNA-Seq data were subsequently validated using quantitative reverse transcriptase-PCR (qRT-PCR) (Figure 1B) and demonstrated concordant expression to those observed in the RNA-Seq data (Supplementary File 2). Canonical pathway analysis on the upregulated gene transcripts using ingenuity pathway analysis (IPA) revealed most significant enrichment in pathways related to pyrimidine ribonucleotides biosynthesis, and estrogen-mediated S phase entry, while G-Protein inhibitory (Gai) and IL8 signaling were among the most under-presented canonical pathways (Figure 1C).
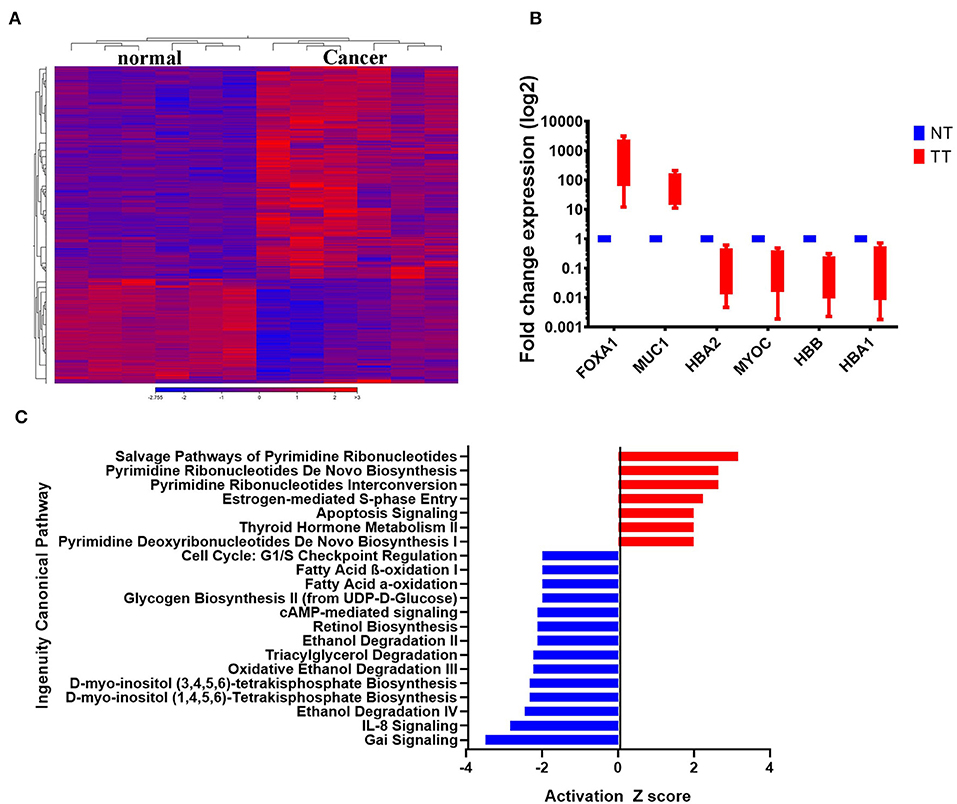
Figure 1. Differentially expressed genes in BCs. (A) Hierarchical clustering of six breast cancer and the corresponding adjacent normal tissue based on differentially expressed RNA transcripts (2.0 FC, FDR p < 0.05) from the RNA-Seq data. Each column represents a sample and each row represents a transcript. Expression level of each gene in a single sample is depicted according to the color scale. (B) The expression levels of selected genes from the RNA-Seq data were validated using qRT-PCR in four breast cancer and adjacent normal tissue. Data are presented as the mean ± S.E., n = 2. (C) Top significantly affected (2.0 <Z score< −2.0) canonical pathways based on IPA. The horizontal bars denote the different pathways based on the Z-scores. Red color indicate activation, while blue color indicate suppression.
Activation of Cancer Cell Proliferation, Invasion, and Metabolism of DNA Functional Categories in Breast Cancer Tissue
IPA downstream effector analysis provides a powerful tool to predict the increase or decrease in downstream biological activities and functions that are likely to be casually affected by the transcriptome data. Figure 2A presents a high-level tree map of affected downstream functional categories based on differentially expressed genes in breast cancer tissue. The major colored rectangles indicates a family of associated biological functions or diseases, blue (decreasing) and orange (increasing), and dimension (using FET P-value) of rectangles indicates where associated functions are predicted to up or down most significantly as a group, the color intensity specify higher absolute Z-scores. This analysis revealed remarkable enrichment in several functional categories, mainly those involved in cancer cell growth, and proliferation (Figure 2B). Furthermore, functional categories associated with tumor cell movement and invasion were enriched, while those associated with myeloid and phagocyte cell chemotaxis were diminished (Figure 2C). Notably, functional categories associated with DNA replication, recombination and repair were also upregulated in BC tissues, especially those involved in chromosome alignment and metabolism of DNA (Figure 2D), while those involved in cell death were under presented (Figure 2E). Taken together, our data revealed a significant increase in cell proliferation, migration, DNA replication, while chemotaxis, and cell death-associated functional categories were suppressed.
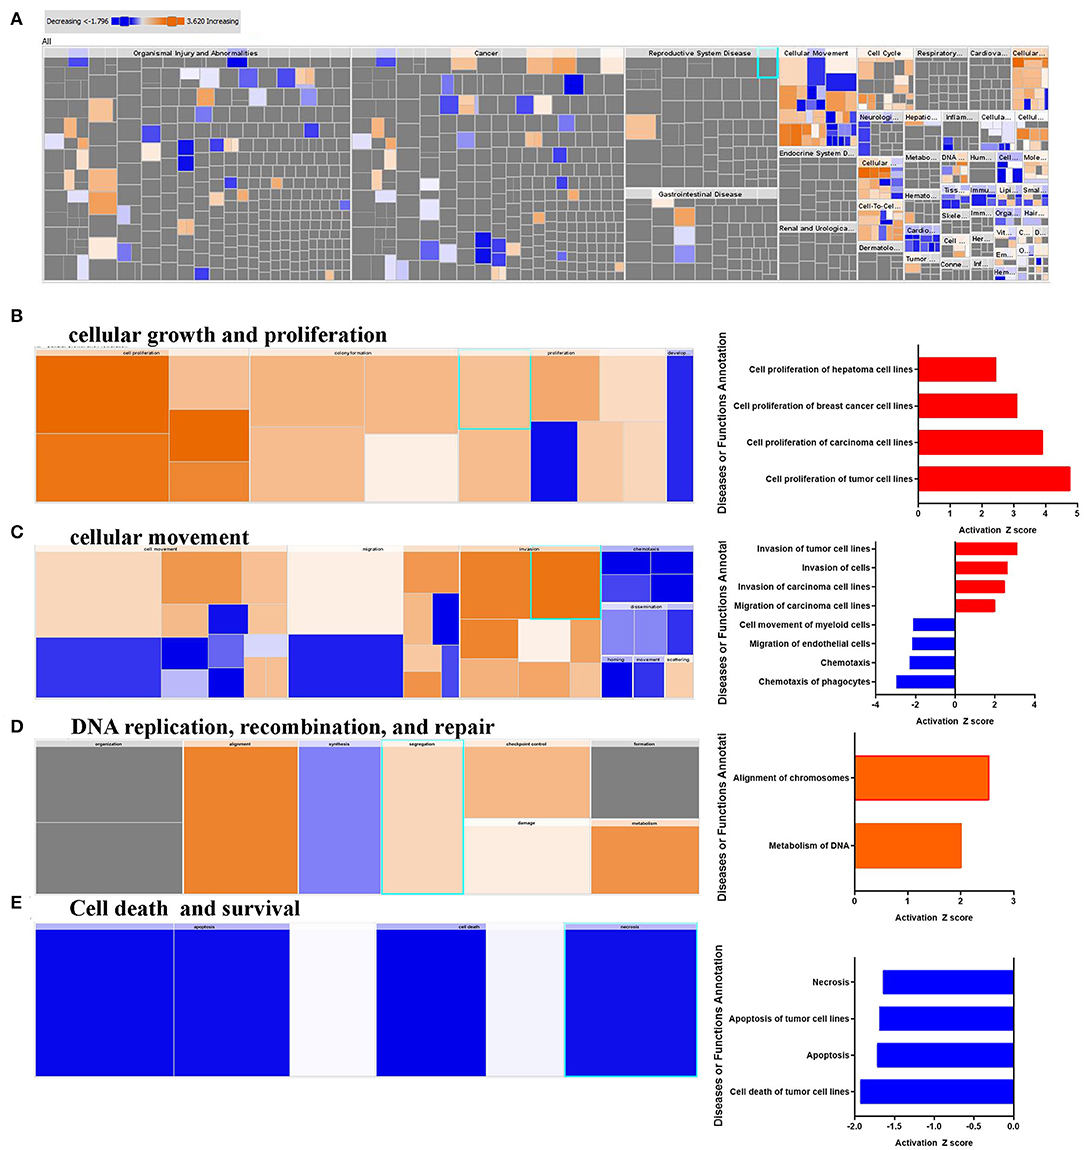
Figure 2. Downstream effector analysis of upregulated gene transcripts in breast cancer. (A) Tree map (hierarchical heat map) depicting affected functional categories based on differentially expressed genes where the major boxes represent a category of diseases and functions, (B) cellular growth, and proliferation, (C) cellular movements, DNA replication, recombination, and (D) repair, and (E) cell death and survival. Each individual colored rectangle is a particular biological function or disease and the color range indicates its predicted activation state: increasing (orange), or decreasing (blue). Darker colors indicate higher absolute Z-scores. In this default view, the size of the rectangles is correlated with increasing overlap significance.
A Chemokine-Network Indicative of Enhanced Tumorigenesis in BC
IPA revealed a number of immune-related functional categories to be differentially expressed in BC compared to normal tissue. Among those, binding and movement of myeloid cells, and chemotaxis were most prominent (Figure 2C). Figure 3A, provides heat map log2 expression value for the upregulated immune-related genes (S100A14, CHGA, CCL11, S100A7, GRP, TFF3, CXCL17, SERPINA1, RLN2, SERPINA3, CXADR, GDF15, C4A, PRKCZ, RAP1GAP, CXCL9, LEF1, SRCIN1, ITGA2, EGF, CXCL10, DDR1, MIF, FCGR1A, and PLAU) in BC tissue. Interestingly, CXCL9, and CXL10 were shown before to enhance the mobilization of cytotoxic T cells form regional lymph nodes to tumor tissues and to promote CTL-mediated tumor immunity (16). In contrary, expression of CXCL17 by tumor cells was shown to recruit CD11b+Gr1highF4/80− immune cells and to promote tumor progression in mice (17). On the other hand, several genes involved in chemotaxis were downregulated in breast compared to normal tissue (ANXA1, DPP4, CCL3, PPARG, CAV1, CCL8, SOCS3, FGF2, FIGF, S100A9, DDR2, CXCL2, F10, PTGS2, S100A8, LEP, MARCO, FPR2, SAA1, IL8, CXCR1, CXCR2, FCAR, S100A12, FCGR3B, PPBP, and PF4, Figure 3B). Previous studies had shown strong correlation between CCL2 expression and TAM infiltration and tumor progression (18). Interestingly, both CCL3 and CCL8 binds to CCR5, which was shown to regulate breast cancer cell proliferation, through P53 activation (19). Our data implies loss of CCL3 and CCL8 in breast cancer could lead to enhanced cell proliferation and tumor progression.
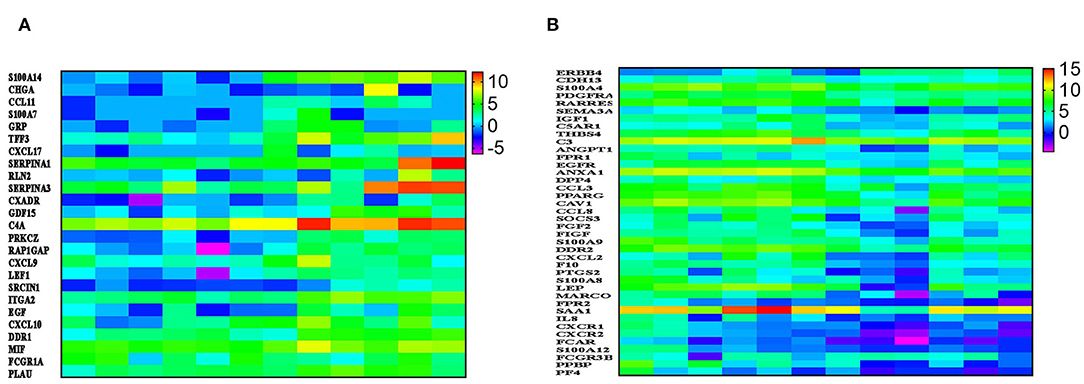
Figure 3. A chemokine-network indicative of enhanced tumorigenesis in BC. (A) Heatmap depicting the expression of several upregulated and (B) downregulated immune regulators in six breast cancer compared to adjacent normal tissue. Data are presented as log2 TPM expression value. Expression values are depicted according to the color scale.
Mechanistic Network Analysis Predicts Activation of ERBB2, FOXM1, ESR1, and IGFBP2 Networks in Breast Cancer
Upstream regulator analysis predicts upstream molecules and provides mechanistic networks that could explain the observed changes in gene expression. Upstream regulator analysis on the differentially expressed genes revealed several activated mechanistic networks in breast cancer, including ERBB2 (Z score = 4.5), FOXM1 (Z score = 3.9), FOXA1 (Z score = 2.5), ESR1 (Z score = 2.4), and IGFBP2 (Z score = 2.2), while suppression of NURP1 (Z score = −6.1), TP53 (Z score = −3.4) was prominent (Supplementary File 3).
ERBB2 (HER2), which was upregulated in BC tissues, is predicted to be directly activating NCOA3 and inhibiting CDKN1A and AR (inconsistent relationship) with more confidence. Similarly, activated ERBB2 is directly inhibiting EGFR (inconsistent relationship) and ERK with less confidence, and in a high confidence state PPARG (inconsistent relationship) has been found to be inactivated through the down regulation of ERK and activation of NCOA3. Furthermore, upregulation of ERBB2 was predicted to activate the NFkB complex and impeding the RELA and STAT3 through the downregulation of ERK. However, its inconsistent relationship, in a high confidence mode tumor suppressor TP53 function, was disabled through direct inhibition of CDKN1A and AR. Moreover, HIF1A, CTNNB1, and ESR1 are predicted to be activated by the upregulated ERBB2 through the intermediated EGFR and AR downregulations (Figure 4A). Analogous to the ERBB2, FOXM1 also exert its inhibitory effect on TP53 via downregulation of CDKN1A (Figure 4B). While excavating further on the ESR1 function from the Figure 4A, though the effect of relationship was not predicted, RARA, NCOA2, NCOA3, HIF1A, JUN, and CTNNB1 are predicted in an active state whereas EGFR, SP3, and STAT3 are inactivated (Figure 4C). Similar occurrence has also been observed with IGFBP2 activation in BC tissues (Figure 4D).
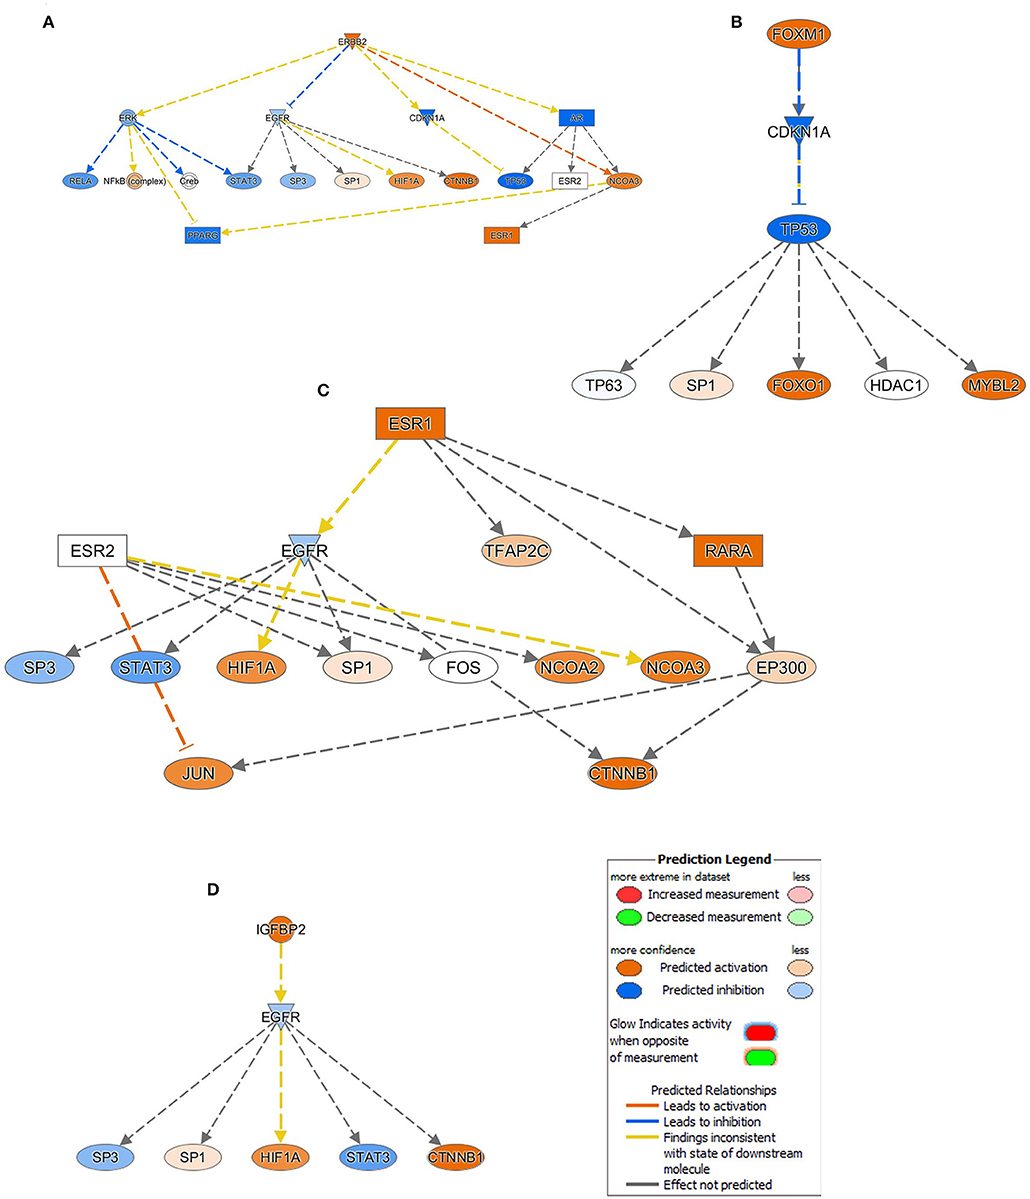
Figure 4. Mechanistic network analysis predicts multiple affected signaling networks. (A) Illustration of the ERBB2, (B) FOXM1, (C) ESR1, and (D) IGFBP2 mechanistic networks with predicted activated state of the network based on transcriptome data with subsequent predicted effects on downstream effector molecules. Figure legend illustrate the relationship between molecules within the network.
Breast Cancer Gene Signature Is Highly Enriched in Genes Indicative of Breast Cancer-Related Functional Categories With More Confidence and High Level of Predicted Relationship
Interestingly, we also observed ESR1 as a key hub gene in the cancer network. This interaction network is illustrated as genes (presented as nodes) and biological relationships between nodes (presented as edges) as mapped by IPA. The intensity of the node color correlates with the degree of gene upregulation. Nodes are displayed using different shapes representing the functional class of the gene (e.g., Enzyme, growth factors, transporters, etc.) that is illustrated in the corresponding legend (Figure 5A).
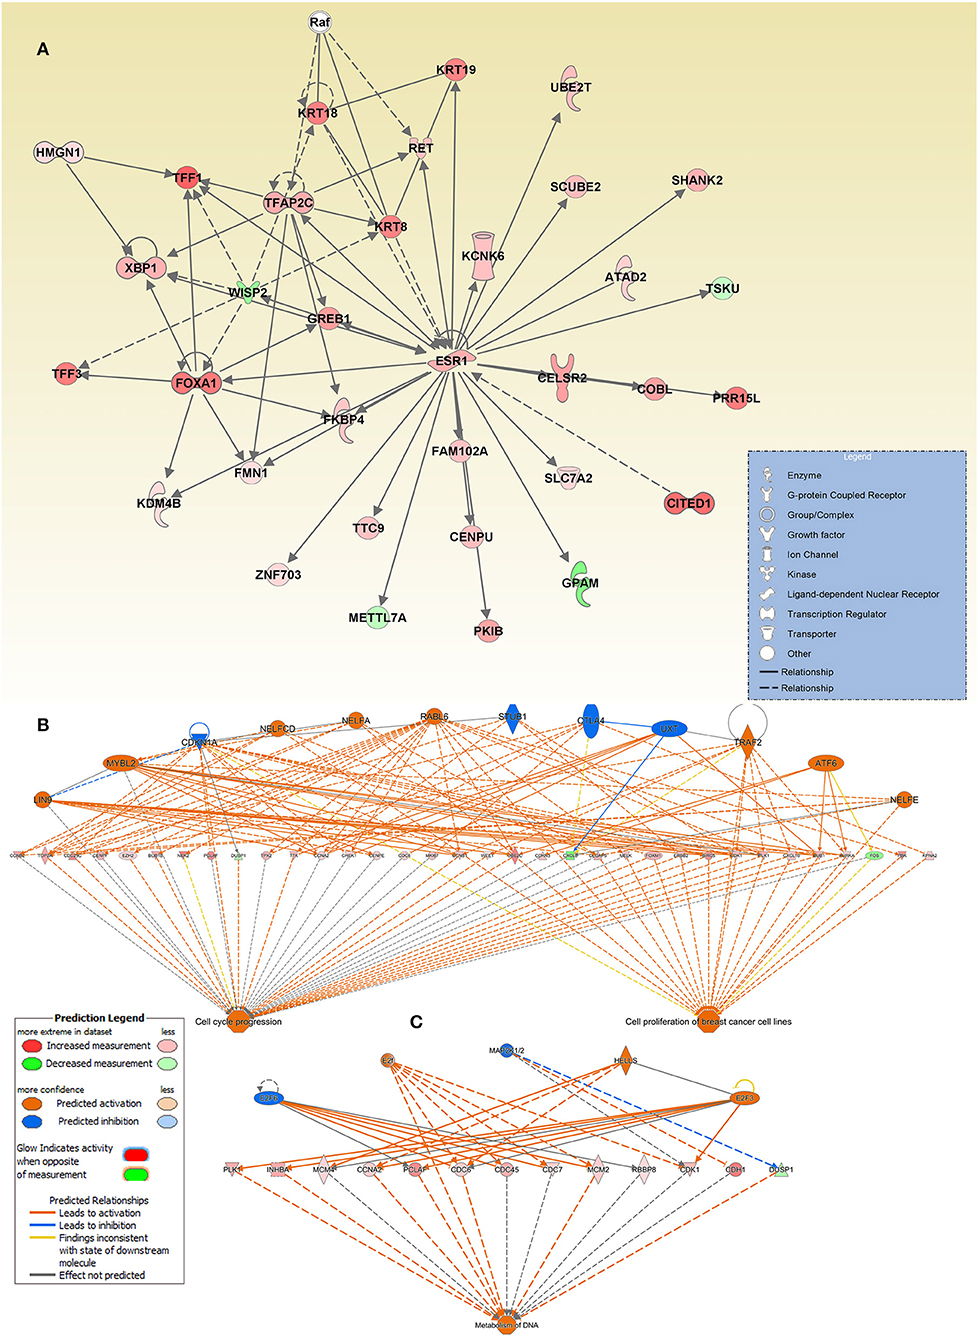
Figure 5. Enrichment in multiple cancer-associated networks in breast cancer. (A) Illustration of the “Cellular Development, Cellular Growth, and Proliferation, Digestive System Development and Function” network, “Cell cycle progression, (B) Cell proliferation of breast cancer cell lines”, and (C) “metabolism of DNA” functional networks based on IPA predicted activation state and subsequent effect on cellular functionality. Figure legend illustrate the relationship between molecules within the network and their activation state. Red color indicates activation while blue color indicate suppression.
The top enriched functional network generated by the regulator effect network analysis in IPA is the cell cycle progression, and cell proliferation of breast cancer cell lines network. The network combined differentially expressed potential regulators (12) and genes (34, including 31 increased and 3 decreased legends) in the middle of the hierarchy which are involved in the two major downstream effector function such as cell cycle progression and cell proliferation of breast cancer cell lines (Figure 5B).
The other intriguing enriched network was that involved in the metabolism of DNA. This functional network consists of 3 activated (E2F, E2F3, and HELLS) and two inhibited (E2F6 and MAP2) upstream regulators, and 12 upregulated and one downregulated gene, in the middle hierarchy which are involved in metabolism of DNA (Figure 5C). Orange symbols at the top are the predicted upstream regulators. Colored symbols represent upregulated genes, with color intensity corresponding to the change in gene expression (Figure 5C).
We subsequently compared the list of differentially expressed genes from the current study to those reported in the TCGA invasive breast cancer dataset. Overall, we observed a large similarity between the upregulated (43.5%) and downregulated (62.1%) genes in the current study and those reported in the TCGA invasive breast cancer dataset (Figures 6A,B). The expression profile of select cancer-related genes, which were upregulated in current study, in the TCGA dataset is presented in Figure 6C, which was concordant with our data.
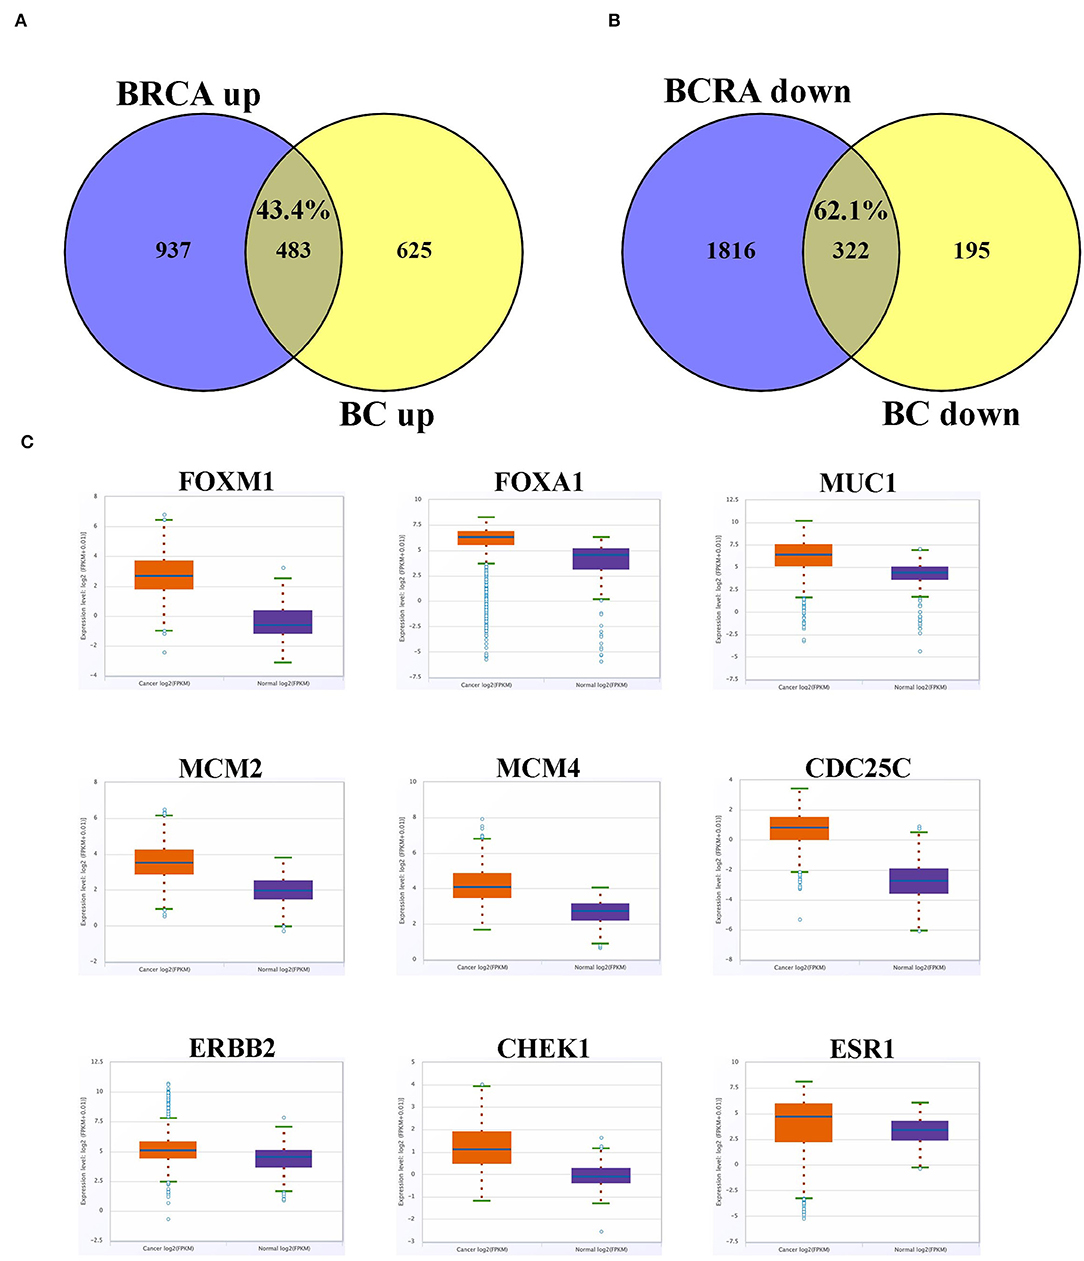
Figure 6. Overlap between differentially expressed gene in current study and the TCGA BC dataset. (A) Venn diagram depicting percentage overall in upregulated and (B) downregulated genes from current study compared to the TCGA BC dataset. (C) Expression of selected upregulated cancer-related genes based on current study in the TCGA BC dataset comparing BC and adjacent normal tissue. Red color indicate expression in breast cancer, while blue color indicate expression in adjacent normal tissue. Y-axis indicate expression intensity (log 2).
Discussion
The pathobiology of breast cancer is orchestrated by complex regulatory networks involving many gene hubs and regulatory molecules (20–22). Deciphering such complex signaling and functional networks provides a foundation for future development of targeted therapeutic interventions and disease biomarker discovery. While a multitude of transcriptomic data are currently available for breast cancer from several parts of the world, there are almost no such studies performed on breast cancer from the gulf region (23–25). Our previous data have highlighted a number of common and novel transcriptome networks in colorectal cancer from patients in the gulf region, suggesting a possible role for environmental and genetic factors in shaping the transcriptome of colorectal cancer (26, 27). Therefore, our current study provides the first RNA-Seq transcriptome analysis of breast cancer from the gulf region. Herein, we integrated the power of next generation sequencing with the ingenuity pathway analysis platform to understand the biology of breast cancer and to highlight various signaling and functional perturbations during breast cancer development in this geographic region, highlighting a number of key signaling networks in breast cancer.
Our global analyses revealed the enrichment of gene signatures indicative of cell proliferation and movement (migration and invasion), DNA replication and recombination, and immune cell trafficking, while genes associated with cell death were underrepresented. Mechanistic network analyses revealed activation of several signaling cascades with ERBB2, FOXM1, and ESR1 on top of the hierarchy. Our data are concordant with other studies highlighting an important role for ERBB (HER2), FOXM1, and ESR1 in breast cancer from other geographic regions (28–30).
In agreement with our expression data, functional studies revealed exogenous expression of ERBB2 in ERBB2-negative breast cancer cells (MCF7 and T47D) to enhance the expression of FOXM1 and MMP2. Inhibition of FOXM1 by RNA interference prevented induction of invasion by ionizing radiation (IR), while overexpression of FOXM1 in MCF10A cells was sufficient to promote IR-induced invasion (31). On the other hand, silencing of IGFBP-2 suppressed MCF7 breast cancer cell proliferation and increased cell death, suggesting IGFBP-2 as promoter of breast cancer survival (32). Interestingly, silencing of ER-α/ESR1 reversed the ability of IGFBP-2 to confer cell survival, suggesting IGFBP-2 to modulate IGFs, to directly regulate PTEN, and to play a role in maintaining ER-α expression (33). Those data corroborate a functional role for the identified molecular networks in BC biology.
Interestingly, one of the patients used in the RNA-Seq experiments was classified as HER2− based on the pathological report; however, the expression of HER2 mRNA transcript was elevated based on the RNA-Seq data, suggesting possible differences in the pathological and molecular assessment of HER2 expression in breast cancer. Our data also revealed upregulation of not only ERBB2, but also ERBB3 and ERBB4 in breast cancer.
Tumor-infiltrating immune cells play critical roles in breast cancer pathogenesis (34). Our data highlighted the presence of a gene signature indicative of altered immune infiltration. Interestingly, CXCL9 and CXL10 were upregulated in BC tissue and were shown before to enhance the mobilization of cytotoxic T cells form regional lymph nodes to tumor tissues and to promote CTL-mediated tumor immunity (16). In contrary, expression of CXCL17 by tumor cells was shown to recruit CD11b+Gr1highF4/80− immune cells and to promote tumor progression in mice (17). On the other hand, several other chemokines were downregulated in breast compared to normal tissue. For instance, previous studies had shown strong correlation between CCL2, which is downregulated in BC tissue, expression and TAM infiltration and tumor progression (18). Interestingly, both CCL3 and CCL8 binds to CCR5, which was shown to regulate breast cancer cell proliferation, through P53 activation (19). Our data implies loss of CCL3 and CCL8 in breast cancer could lead to enhanced cell proliferation and progression. Altered chemokine expression in the tumor microenvironment (TME) results into several consequences including leukocyte activation and trafficking, angiogenesis, metastasis, and proliferation of cancer cells (35, 36). In ovarian cancer, it has been reported that monoclonal antibodies or pharmacological inhibitors targeting CCL11 may be beneficial for the treatment of the disease (37). Additionally, both in vivo and in vitro studies in breast cancer patients elucidated the importance of CXCL17-CXCR8 axis in promoting the proliferation and migration of cancer cells (38). Additional studies on primary colorectal tumor showed that the expression of CXCL17 on tumor cells promotes angiogenesis and tumor infiltration of immune cells (39). These data show that CXCL17 could be a promising target for cancer immunotherapy. On the other hand, other reports showed that chemokine ligands including CXCL9 and CXCL10 have potential angiostatic and anti-tumor activities (40, 41). The interaction between CXCL9/CXCL10 with CXCR3 can recruit anti-tumoral dendritic cells, T lymphocytes and natural killer cells to the TME, which could be beneficial for tumor suppression (41). Our data suggest that in the breast TME, chemokines/receptors including CCL11, CXCL17, CXCL9, and CXCL10 were significantly upregulated, compared with normal tissues. Apart from chemokines, ITGA2 and EGF were also found to be upregulated (Figure 3A). It has been reported that ITGA2 is expressed more significantly in glioblastoma compared with normal glial cells, and targeting ITGA2 through monoclonal antibody could impede the migration of glioblastoma cells, but not their proliferation (42). Moreover, some reports showed that EGF promotes epithelial-mesenchymal transition (EMT), which could contribute to the migration/metastasis of tumor cells, and resistance to chemotherapy or hormonal therapy (43, 44). We also found that SERPINA1 and SERPINA3 to be upregulated in breast TME (Figure 3A). Previous reports showed that SERPINA1 and SERPINA3 are potential prognostic markers and therapeutic targets for colorectal cancer and melanoma, respectively (45, 46). Furthermore, another chemokine, CXCL17, which was found to be upregulated in breast tissue (Figure 3A), has been reported to be involved in angiogenesis, recruitment of immune suppressor cells and tumor metastasis (17, 47). CXCL17 was preferentially expressed in the aggressive types of breast, lung and gastrointestinal cancer cells, resulted in the accumulation of immature CD11b+Gr1+ myeloid-derived suppressor cells at tumor sites (17, 47). These data revealed that targeting migration-related genes including chemokines and their receptors in breast TME might be beneficial for tumor immunotherapy.
Current data revealed large similarity in the transcriptome of breast cancer from our study (43.5% upregulated), and (62.1% downregulated) when compared to differentially expressed genes from the TCGA BC dataset. In particular, we observed common altered breast cancer-driver genes in both datasets, suggesting common altered mechanism in breast cancer, regardless of the geographic region. Therefore, our data highlight a common molecular signature associated with key signaling networks in breast cancer, regardless of the ethnic background and geographical relation, which warrants further investigations using larger sample size and multicenter involvement.
Data Availability
This manuscript contains previously unpublished data. The name of the repository and accession number(s) are not available.
Ethics Statement
The study was performed under ethical approval from Qatar Biomedical Research Institute, Doha, Qatar (Protocol no. 2017-006). The patients/participants provided their written informed consent to participate in this study.
Author Contributions
RV and VS wrote the manuscript. RV, VS, and KO performed the experiments. EE conceived study, obtained funds, revised and finalized the manuscript. NA analyzed data, revised and finalized the manuscript.
Funding
This work was supported by a start-up grant [VR04] for EE from Qatar Biomedical Research Institute, Qatar Foundation.
Conflict of Interest Statement
The authors declare that the research was conducted in the absence of any commercial or financial relationships that could be construed as a potential conflict of interest.
Acknowledgments
We thank the genomic core facility at Qatar Biomedical Research Institute for their help with RNA sequencing.
Supplementary Material
The Supplementary Material for this article can be found online at: https://www.frontiersin.org/articles/10.3389/fonc.2019.00910/full#supplementary-material
Abbreviations
BC, breast cancer; NGS, next generation sequencing; TT, tumor tissues; NT, normal tissues; IPA, ingenuity pathways analysis; URA, upstream regulator analysis; DEA, downstream effects analysis; MN, mechanistic networks; CAN, causal network analysis; TCGA, the cancer genome atlas; FOXA1, forkhead box A1; MUC1, mucin 1; HBA2, hemoglobin alpha 2; MYOC, myocilin; HBB, hemoglobin subunit beta; HBA1, hemoglobin subunit alpha 1; qRT-PCR, quantitative reverse transcriptase-Polymerase chain reaction.
References
1. Bray F, Ferlay J, Soerjomataram I, Siegel RL, Torre LA, Jemal A. Global cancer statistics 2018: GLOBOCAN estimates of incidence and mortality worldwide for 36 cancers in 185 countries. CA Cancer J Clin. (2018) 68:394–424. doi: 10.3322/caac.21492
2. Perou CM, Sorlie T, Eisen MB, van de Rijn M, Jeffrey SS, Rees CA, et al. Molecular portraits of human breast tumours. Nature. (2000) 406:747–52. doi: 10.1038/35021093
3. Sorlie T, Perou CM, Tibshirani R, Aas T, Geisler S, Johnsen H, et al. Gene expression patterns of breast carcinomas distinguish tumor subclasses with clinical implications. Proc Natl Acad Sci USA. (2001) 98:10869–74. doi: 10.1073/pnas.191367098
4. Prat A, Parker JS, Karginova O, Fan C, Livasy C, Herschkowitz JI, et al. Phenotypic and molecular characterization of the claudin-low intrinsic subtype of breast cancer. Breast Cancer Res. (2010) 12:R68. doi: 10.1186/bcr2635
5. Vieira AF, Schmitt F. An update on breast cancer multigene prognostic tests-emergent clinical biomarkers. Front Med. (2018) 5:248. doi: 10.3389/fmed.2018.00248
6. Easton DF, Pooley KA, Dunning AM, Pharoah PD, Thompson D, Ballinger DG, et al. Genome-wide association study identifies novel breast cancer susceptibility loci. Nature. (2007) 447:1087–93. doi: 10.1038/nature05887
7. Hunter DJ, Kraft P, Jacobs KB, Cox DG, Yeager M, Hankinson SE, et al. A genome-wide association study identifies alleles in FGFR2 associated with risk of sporadic postmenopausal breast cancer. Nature Genet. (2007) 39:870–4. doi: 10.1038/ng2075
8. Chouchane L, Boussen H, Sastry KS. Breast cancer in Arab populations: molecular characteristics and disease management implications. Lancet Oncol. (2013) 14:e417–24. doi: 10.1016/S1470-2045(13)70165-7
9. El Saghir NS, Khalil MK, Eid T, El Kinge AR, Charafeddine M, Geara F, et al. Trends in epidemiology and management of breast cancer in developing Arab countries: a literature and registry analysis. Int J Surg. (2007) 5:225–33. doi: 10.1016/j.ijsu.2006.06.015
10. Chalabi N, Bernard-Gallon DJ, Bignon YJ, Breast Med C, Kwiatkowski F, Agier M, et al. Comparative clinical and transcriptomal profiles of breast cancer between French and South Mediterranean patients show minor but significative biological differences. Cancer Genomics Proteomics. (2008) 5:253–61.
11. Casamassimi A, Federico A, Rienzo M, Esposito S, Ciccodicola A. Transcriptome profiling in human diseases: new advances and perspectives. Int J Mol Sci. (2017) 18:E1652. doi: 10.3390/ijms18081652
12. Bredel M, Scholtens DM, Harsh GR, Bredel C, Chandler JP, Renfrow JJ, et al. A network model of a cooperative genetic landscape in brain tumors. JAMA. (2009) 302:261–75. doi: 10.1001/jama.2009.997
13. Kramer A, Green J, Pollard J Jr, Tugendreich S. Causal analysis approaches in Ingenuity Pathway Analysis. Bioinformatics. (2014) 30:523–30. doi: 10.1093/bioinformatics/btt703
14. Tang Z, Li C, Kang B, Gao G, Li C, Zhang Z. GEPIA: a web server for cancer and normal gene expression profiling and interactive analyses. Nucleic Acids Res. (2017) 45:W98–102. doi: 10.1093/nar/gkx247
15. Li JH, Liu S, Zhou H, Qu LH, Yang JH. starBase v2.0: decoding miRNA-ceRNA, miRNA-ncRNA and protein-RNA interaction networks from large-scale CLIP-Seq data. Nucleic Acids Res. (2014) 42:D92–7. doi: 10.1093/nar/gkt1248
16. Mukaida N, Sasaki S, Baba T. Chemokines in cancer development and progression and their potential as targeting molecules for cancer treatment. Mediators Inflamm. (2014) 2014:170381. doi: 10.1155/2014/170381
17. Matsui A, Yokoo H, Negishi Y, Endo-Takahashi Y, Chun NA, Kadouchi I, et al. CXCL17 expression by tumor cells recruits CD11b+Gr1 high F4/80- cells and promotes tumor progression. PLoS ONE. (2012) 7:e44080. doi: 10.1371/journal.pone.0044080
18. Saji H, Koike M, Yamori T, Saji S, Seiki M, Matsushima K, et al. Significant correlation of monocyte chemoattractant protein-1 expression with neovascularization and progression of breast carcinoma. Cancer. (2001) 92:1085–91. doi: 10.1002/1097-0142(20010901)92:5<1085::AID-CNCR1424>3.0.CO;2-K
19. Manes S, Mira E, Colomer R, Montero S, Real LM, Gomez-Mouton C, et al. CCR5 expression influences the progression of human breast cancer in a p53-dependent manner. J Exp Med. (2003) 198:1381–9. doi: 10.1084/jem.20030580
20. Cancer Genome Atlas Network. Comprehensive molecular portraits of human breast tumours. Nature. (2012) 490:61–70. doi: 10.1038/nature11412
21. Ciriello G, Gatza ML, Beck AH, Wilkerson MD, Rhie SK, Pastore A, et al. Comprehensive molecular portraits of invasive lobular breast cancer. Cell. (2015) 163:506–19. doi: 10.1016/j.cell.2015.09.033
22. Hamam R, Hamam D, Alsaleh KA, Kassem M, Zaher W, Alfayez M, et al. Circulating microRNAs in breast cancer: novel diagnostic and prognostic biomarkers. Cell Death Dis. (2017) 8:e3045. doi: 10.1038/cddis.2017.440
23. Paik S, Shak S, Tang G, Kim C, Baker J, Cronin M, et al. multigene assay to predict recurrence of tamoxifen-treated, node-negative breast cancer. N Engl J Med. (2004) 351:2817–26. doi: 10.1056/NEJMoa041588
24. Okuma HS, Koizumi F, Hirakawa A, Nakatochi M, Komori O, Hashimoto J, et al. Clinical and microarray analysis of breast cancers of all subtypes from two prospective preoperative chemotherapy studies. Br J Cancer. (2016) 115:411–9. doi: 10.1038/bjc.2016.184
25. Hamam R, Ali AM, Alsaleh KA, Kassem M, Alfayez M, Aldahmash A, et al. microRNA expression profiling on individual breast cancer patients identifies novel panel of circulating microRNA for early detection. Sci Rep. (2016) 6:25997. doi: 10.1038/srep25997
26. Vishnubalaji R, Hamam R, Abdulla MH, Mohammed MA, Kassem M, Al-Obeed O, et al. Genome-wide mRNA and miRNA expression profiling reveal multiple regulatory networks in colorectal cancer. Cell Death Dis. (2015) 6:e1614. doi: 10.1038/cddis.2014.556
27. Vishnubalaji R, Hamam R, Yue S, Al-Obeed O, Kassem M, Liu FF, et al. MicroRNA-320 suppresses colorectal cancer by targeting SOX4, FOXM1, and FOXQ1. Oncotarget. (2016) 7:35789–802. doi: 10.18632/oncotarget.8937
28. Harari D, Yarden Y. Molecular mechanisms underlying ErbB2/HER2 action in breast cancer. Oncogene. (2000) 19:6102–14. doi: 10.1038/sj.onc.1203973
29. Bektas N, Haaf A, Veeck J, Wild PJ, Luscher-Firzlaff J, Hartmann A, et al. Tight correlation between expression of the Forkhead transcription factor FOXM1 and HER2 in human breast cancer. BMC Cancer. (2008) 8:42. doi: 10.1186/1471-2407-8-42
30. Holst F, Stahl PR, Ruiz C, Hellwinkel O, Jehan Z, Wendland M, et al. Estrogen receptor alpha (ESR1) gene amplification is frequent in breast cancer. Nature Genet. (2007) 39:655–60. doi: 10.1038/ng2006
31. Kambach DM, Sodi VL, Lelkes PI, Azizkhan-Clifford J, Reginato MJ. ErbB2, FoxM1 and 14-3-3zeta prime breast cancer cells for invasion in response to ionizing radiation. Oncogene. (2014) 33:589–98. doi: 10.1038/onc.2012.629
32. Foulstone EJ, Zeng L, Perks CM, Holly JM. Insulin-like growth factor binding protein 2 (IGFBP-2) promotes growth and survival of breast epithelial cells: novel regulation of the estrogen receptor. Endocrinology. (2013) 154:1780–93. doi: 10.1210/en.2012-1970
33. Probst-Hensch NM, Steiner JH, Schraml P, Varga Z, Zurrer-Hardi U, Storz M, et al. IGFBP2 and IGFBP3 protein expressions in human breast cancer: association with hormonal factors and obesity. Clin Cancer Res. (2010) 16:1025–32. doi: 10.1158/1078-0432.CCR-09-0957
34. Syed Khaja AS, Toor SM, El Salhat H, Faour I, Ul Haq N, Ali BR, et al. Preferential accumulation of regulatory T cells with highly immunosuppressive characteristics in breast tumor microenvironment. Oncotarget. (2017) 8:33159–71. doi: 10.18632/oncotarget.16565
35. Mollica Poeta V, Massara M, Capucetti A, Bonecchi R. Chemokines and chemokine receptors: new targets for cancer immunotherapy. Front Immunol. (2019) 10:379. doi: 10.3389/fimmu.2019.00379
36. Vilgelm AE, Richmond A. Chemokines modulate immune surveillance in tumorigenesis, metastasis, and response to immunotherapy. Front Immunol. (2019) 10:333. doi: 10.3389/fimmu.2019.00333
37. Nolen BM, Lokshin AE. Targeting CCL11 in the treatment of ovarian cancer. Expert Opin Ther Targets. (2010) 14:157–67. doi: 10.1517/14728220903512983
38. Guo YJ, Zhou YJ, Yang XL, Shao ZM, Ou ZL. The role and clinical significance of the CXCL17-CXCR8 (GPR35) axis in breast cancer. Biochem Biophys Res Commun. (2017) 493:1159–67. doi: 10.1016/j.bbrc.2017.09.113
39. Ohlsson L, Hammarstrom ML, Lindmark G, Hammarstrom S, Sitohy B. Ectopic expression of the chemokine CXCL17 in colon cancer cells. Br J Cancer. (2016) 114:697–703. doi: 10.1038/bjc.2016.4
40. Dwinell MB, Lugering N, Eckmann L, Kagnoff MF. Regulated production of interferon-inducible T-cell chemoattractants by human intestinal epithelial cells. Gastroenterology. (2001) 120:49–59. doi: 10.1053/gast.2001.20914
41. Tokunaga R, Zhang W, Naseem M, Puccini A, Berger MD, Soni S, et al. CXCL9, CXCL10, CXCL11/CXCR3 axis for immune activation - A target for novel cancer therapy. Cancer Treat Rev. (2018) 63:40–7. doi: 10.1016/j.ctrv.2017.11.007
42. Guo P, Moses-Gardner A, Huang J, Smith ER, Moses MA. ITGA2 as a potential nanotherapeutic target for glioblastoma. Sci Rep. (2019) 9:6195. doi: 10.1038/s41598-019-42643-7
43. Buonato JM, Lan IS, Lazzara MJ. EGF augments TGFβ-induced epithelial-mesenchymal transition by promoting SHP2 binding to GAB1. J Cell Sci. (2015) 128:3898–909. doi: 10.1242/jcs.169599
44. Kim J, Kong J, Chang H, Kim H, Kim A. EGF induces epithelial-mesenchymal transition through phospho-Smad2/3-Snail signaling pathway in breast cancer cells. Oncotarget. (2016) 7:85021–32. doi: 10.18632/oncotarget.13116
45. Kwon CH, Park HJ, Choi JH, Lee JR, Kim HK, Jo HJ, et al. Snail and serpinA1 promote tumor progression and predict prognosis in colorectal cancer. Oncotarget. (2015) 6:20312–26. doi: 10.18632/oncotarget.3964
46. Zhou J, Cheng Y, Tang L, Martinka M, Kalia S. Up-regulation of SERPINA3 correlates with high mortality of melanoma patients and increased migration and invasion of cancer cells. Oncotarget. (2017) 8:18712–25. doi: 10.18632/oncotarget.9409
Keywords: breast cancer, RNA-Seq, pathway analysis, transcriptome, IPA
Citation: Vishnubalaji R, Sasidharan Nair V, Ouararhni K, Elkord E and Alajez NM (2019) Integrated Transcriptome and Pathway Analyses Revealed Multiple Activated Pathways in Breast Cancer. Front. Oncol. 9:910. doi: 10.3389/fonc.2019.00910
Received: 03 June 2019; Accepted: 02 September 2019;
Published: 18 September 2019.
Edited by:
Ala-Eddin Al Moustafa, Qatar University, QatarReviewed by:
Hamid Morjani, Université de Reims Champagne-Ardenne, FranceLuigi Fattore, Sapienza University of Rome, Italy
Copyright © 2019 Vishnubalaji, Sasidharan Nair, Ouararhni, Elkord and Alajez. This is an open-access article distributed under the terms of the Creative Commons Attribution License (CC BY). The use, distribution or reproduction in other forums is permitted, provided the original author(s) and the copyright owner(s) are credited and that the original publication in this journal is cited, in accordance with accepted academic practice. No use, distribution or reproduction is permitted which does not comply with these terms.
*Correspondence: Eyad Elkord, eelkord@hbku.edu.qa; Nehad M. Alajez, nalajez@hbku.edu.qa
†These authors have contributed equally to this work