 Byung min Lee1
 Jun Won Kim
 Ik Jae Lee
- 1Department of Radiation Oncology, Yonsei Cancer Center, Yonsei University College of Medicine, Seoul, South Korea
- 2Department of Radiation Oncology, Gangnam Severance Hospital, Yonsei University College of Medicine, Seoul, South Korea
- 3Division of Medical Oncology, Gangnam Severance Hospital, Yonsei University College of Medicine, Seoul, South Korea
Background: Sarcopenia, systemic inflammation, and low muscularity significantly impact the survival of cancer patients. However, few studies have investigated how sarcopenia and systemic inflammation affect the prognosis of biliary tract cancer with distant metastasis. In this study, we investigated the association between sarcopenia with systemic inflammation and prognosis of metastatic biliary tract cancer.
Materials and Methods: Data collected from 353 metastatic biliary tract cancer patients from 2007 to 2016 were analyzed. To evaluate the skeletal muscle mass, computed tomography images at the upper level of the third lumbar vertebra (L3) were used. Sarcopenia was defined using the Japan Society of Hepatology guideline; L3 muscle index <42 cm2/m2 for male and <38 cm2/m2 for female patients. Systemic inflammation was evaluated using the neutrophil lymphocyte ratio (NLR). Patients with NLR > 3 were categorized into the inflammatory category. The overall survival (OS) and progression free survival (PFS) were analyzed. Subgroup analysis was performed on those who received gemcitabine/cisplatin (GP) chemotherapy and depending on the presence of sarcopenia and inflammation.
Results: Patients with sarcopenia showed lesser 1-year OS than those without (25.5 vs. 38.2%, p = 0.019). The patients with high NLR (NLR > 3) were associated with a shorter OS than were those with a low NLR (NLR ≤ 3) (21.0 vs. 52.8%, p < 0.001). Based on these results, we categorized the patients into three groups; sarcopenia accompanied by high NLR, no sarcopenia and low NLR, and either sarcopenia or high NLR. The OS of patients was well-stratified according to this grouping (1-year OS; 18.3 vs. 30.3 vs. 55.8%, p < 0.001). Concordant with OS results, the PFS was well-stratified based on the presence of either sarcopenia or high NLR (Sarcopenia; 9.5 vs. 19.4%, p < 0.001, NLR; 10.0 vs. 23.4%, p < 0.001). The PFS was significantly associated with high NLR and sarcopenia (1-year PFS; 7.8 vs. 13.0 vs. 27.9%, p < 0.001).
Conclusion: Sarcopenia with inflammation was associated with inferior OS and PFS. In addition, sarcopenia accompanied by inflammation was associated with poor prognosis. Conservative treatments such as nutritional support, exercise, and pharmacologic intervention could help metastatic biliary tract cancer patients to overcome sarcopenia and the inflammatory status.
Introduction
Sarcopenia, the loss of skeletal mass and strength, is part of the normal aging process as well as other health problems such as liver cirrhosis, renal failure, cognitive problems, and cancer (1, 2). The importance of sarcopenia in cancer has been increasingly recognized, as low muscularity is a significant predictor of poor prognosis in various cancers (3–5).
Studies have shown that low skeletal muscle mass before surgery was significantly associated with overall survival (OS) in biliary tract cancer (BTC) patients (6, 7). Only few reports have reported sarcopenia as a prognostic factor for advanced BTC. If loss of skeletal muscle mass occurs, the tolerance to anticancer treatment is reduced, which is associated with reduced survival (8, 9). However, the mechanism of sarcopenia in malignancy is not fully defined (10). Available literature suggests that sarcopenia in patients with malignancy is related to inflammation as well as older age and poor performance (9, 11). Low muscularity of patients could lead to inflammation around the muscle and can contribute to systemic inflammation (12).
Due to limited knowledge on the mechanism of sarcopenia, the clinical management of sarcopenia is limited and complex (10, 13, 14). Over the past few decades, our understanding of sarcopenia has improved, but there is still a lack of a definition and diagnostic criteria for sarcopenia.
Several studies have demonstrated that systemic inflammation is related to poor prognosis (15, 16). To evaluate the systemic inflammatory status, common inflammatory markers such as neutrophil/lymphocyte ratio (NLR), platelet/lymphocyte ratio (PLR), and C-reactive protein (CRP) were used. Previous studies showed that colorectal, small cell lung, and head and neck cancer patients with high NLR and low skeletal muscle mass have an inferior OS (17–19). In this study, we investigated whether sarcopenia accompanied by systemic inflammation affected the overall survival in advanced BTC patients.
Patients and Methods
Patient Population
We retrospectively reviewed the data of advanced BTC patients from a single institution. Patients with gallbladder cancer, intrahepatic, perihilar, extrahepatic bile duct cancer, and ampulla of Vater cancer were included in this study, and those with distant metastasis at initial diagnosis were analyzed.
Totally 353 patients diagnosed metastatic BTC in Gangnam Severance Hospital from January 2007 to November 2016 met the inclusion criteria. The diagnosis was made through tissue biopsy or cytology. The inclusion criteria for this study were as follows: (1) age over 18 years; (2) diagnosis of BTC via histologic confirmation; (3) metastatic BTC at diagnosis; and (4) patients with available medical records.
The exclusion criteria were as follows: (1) patients with widespread brain or leptomeningeal metastasis; (2) uncontrolled infections or poor medical conditions; (3) synchronous malignancies; (4) patients lost at follow-up; and (5) patients where the tissue area at the third lumbar level could not be measured or patients without height data. This study was approved by the institutional review board of the Gangnam Severance Hospital (3-2019-0257). Informed consent was not required owing to the retrospective nature of the study.
Measurement of Body Composition and Definition of Sarcopenia
The previously validated computed tomography (CT)-based body composition measurement method was used to identify if a patient had sarcopenia. We selected a single axial slice at the upper border of third lumbar spine vertebra (L3) level for measurement. The delineation of skeletal muscle, visceral fat, and subcutaneous fat tissue was performed using the MIM Vista software (MIM corp., Version 6.6.14, OH, USA) based on Hounsfield units (HUs). The threshold of HUs was applied as follows: Skeletal muscle (−29 to +150 HU); visceral fat tissue (−150 to −50 HU); and subcutaneous fat tissue (−190 to −30 HU). The measurements for sarcopenia were performed by a single radiation oncologist (B. M. Lee). All other researchers involved in this study were blinded to the outcome of measurements.
To determine the amount of skeletal muscle, the L3 skeletal muscle index was used. First, the cross-sectional volume at the L3 level was divided by the thickness of the axial slice to get the cross-sectional area. The cross-sectional areas were divided by the height of the patients to obtain the L3 skeletal muscle index. According to international consensus, sarcopenia is defined as an L3 muscle index of <55 and 39 cm2/m2 for male and female patients, respectively (20). However, the studies contributing to this consensus were mostly based on the European and American guidelines (21, 22). As the patients included in this study were of Asian descent, the Japan Society of Hepatology (JSH) guideline was used and sarcopenia was defined as L3 muscle index <42 cm2/m2 for male and 38 cm2/m2 for female patients (23). Figure 1 demonstrates the CT images of patients with sarcopenia and without sarcopenia.
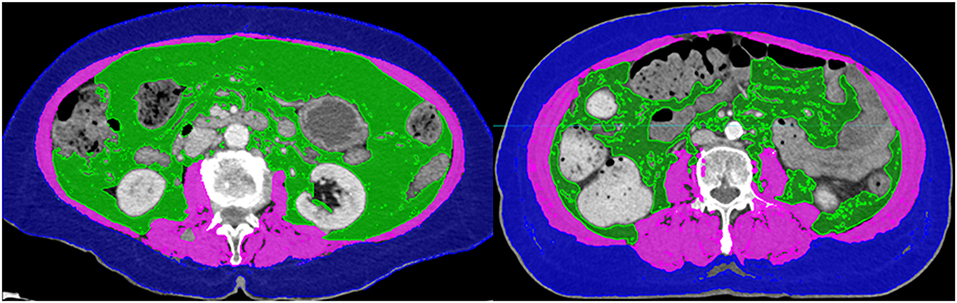
Figure 1. Computed tomography images of patients with (Left) and without sarcopenia (Right). The two patients had similar body mass indices.
Indicator of Inflammatory Status
The NLR was used to evaluate the inflammatory status of patients, and calculated by dividing the neutrophil count by the lymphocyte count. Every patients underwent the complete blood count before the administering the chemotherapy and based on this examination results, we calculated the NLR value. The optimal cut off values for NLR were different in each study (24, 25). We adopted the cut off value of NLR that was previously used for metastatic BTC (25).
Statistical Analysis
The Fisher's exact test or χ2-test was used to analyze categorical data. For continuous data, the Mann–Whitney U-test was used for comparison. OS was defined as the time from the date of diagnosis to either death due to any cause or to last follow-up. The progression free survival (PFS) was defined as the time from the date of diagnosis to date of either disease progression or death. The survival curves were evaluated using the Kaplan–Meier method. The univariate and multivariate analyses were performed using the Cox proportional hazards model to determine the association between OS, PFS, and the factors we suggested. The multivariate analysis was conducted using the variables that were significant predictors of OS and PFS in the univariate analysis with backward stepwise. The hazard ratios (HRs) and 95% confidence intervals (CIs) were calculated. A p < 0.05 was considered statistically significant. The analyses were conducted using IBM SPSS version 25.0 (SPSS, Chicago, IL, USA).
Results
Patient Characteristics
A total of 353 patients were included with a median follow-up of 7.77 months [interquartile range (IQR): 3.27–14.70]. Table 1 shows the overall patients' characteristics. The median age was 67 years (IQR: 58–75), and there were 203 male patients (57.5%). Of the 353 patients, 158 (44.9%) showed good performance status with ECOG (Eastern Cooperative Oncology Group) 0 or 1, while 194 (55.1%) had poor performance status (ECOG ≥2). Histologically, 202 tumors (74.8%) were either well-differentiated or moderately differentiated.
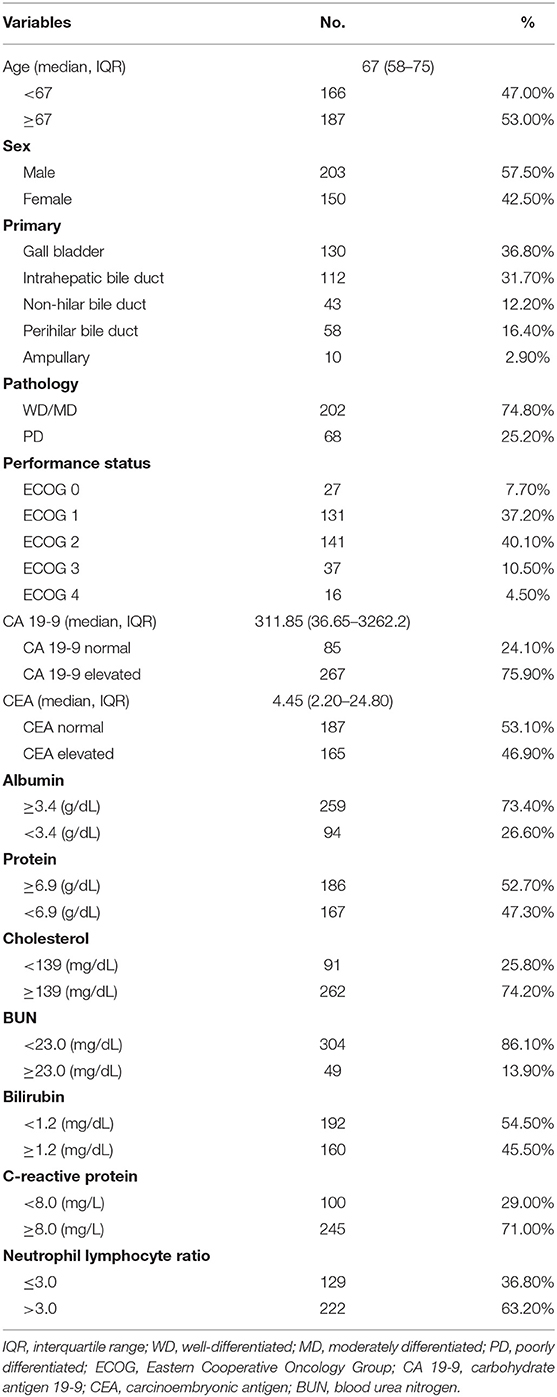
Table 1. Patient characteristics.
We divided the patients into two groups according to the presence of sarcopenia. Table 2 compares the characteristics between the patients with and without sarcopenia. Sarcopenia was associated with older age (71 vs. 65-years, p < 0.001) and female sex (51.6 vs. 35.1%, p = 0.002). The sarcopenia group had more patients with poor performance status (ECOG ≥2) than the non-sarcopenia group (68.4 vs. 44.3%, p < 0.001). There were significant differences in the blood chemistry profile between the two groups. There were more patients with hypoalbuminemia and hypoproteinemia in the sarcopenia group (hypoalbuminemia: 34.6 vs. 20.1%, p = 0.002; hypoproteinemia: 53.5 vs. 42.3%, p = 0.036). There were more patients with NLR > 3 in the sarcopenia group (72.8 vs. 55.4%, p < 0.001).
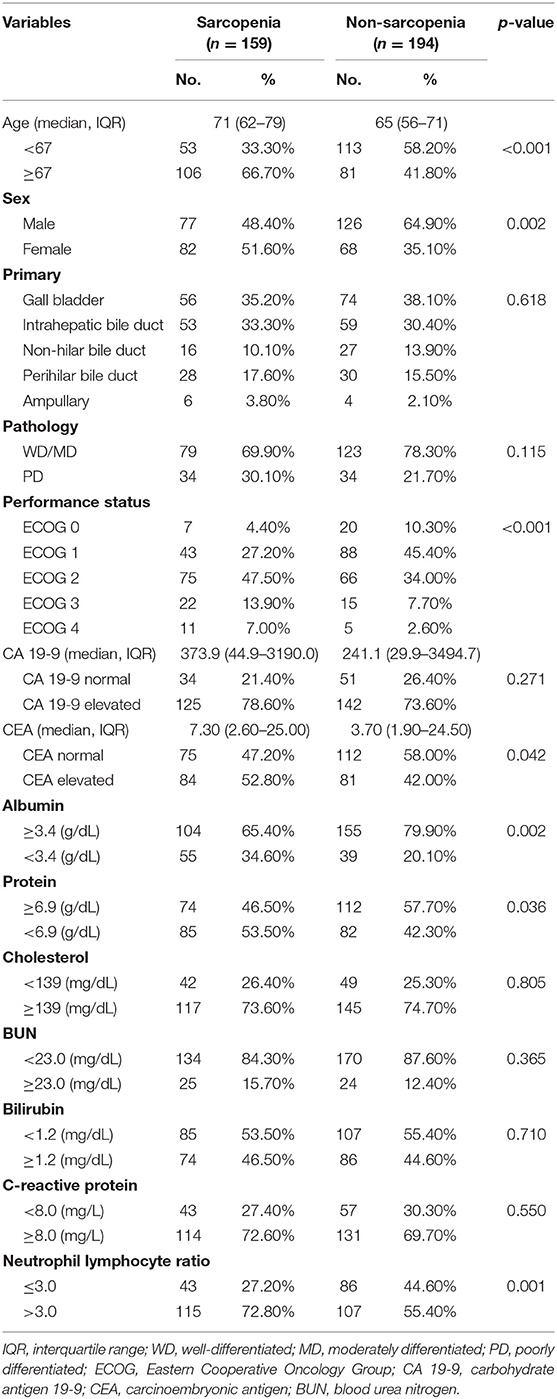
Table 2. Comparison of patient characteristics.
Analysis of Overall Survival and Prognostic Factors
The median OS of all patients in this study was 7.77 months (IQR; 3.27–14.70). The median OS was 5.23 and 8.90 months in the sarcopenia and non-sarcopenia groups, respectively (p = 0.057). The 1-year OS was significantly different between those with and without sarcopenia (25.5 vs. 38.2%, p = 0.020; Figure 2). As the mechanism of sarcopenia in cancer patients was known to be associated to cancer-related inflammation, we assessed the effect of systemic inflammation on survival using NLR. The 1-year OS for patients with NLR > 3 was 21.0% whereas for those with NLR ≤ 3 was 52.8% (p < 0.001; Figure 3).
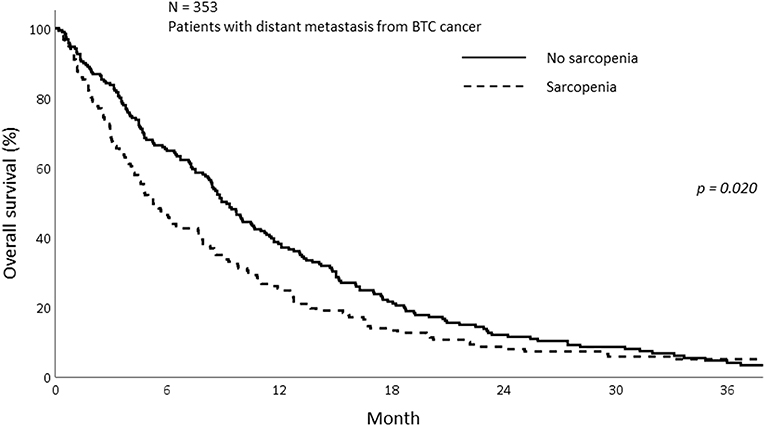
Figure 2. Overall survival of patients with and without sarcopenia.
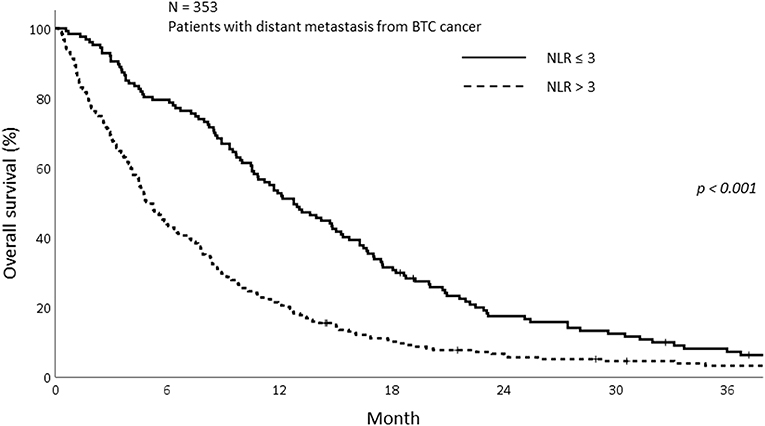
Figure 3. Overall survival of patients with high and low NLR.
Based on this result, we analyzed survival depending on sarcopenia and inflammatory status. The patients were stratified into three groups according to sarcopenia and NLR as follows: patients with no sarcopenia and NLR ≤ 3, patients with sarcopenia and NLR > 3, and patients with either sarcopenia or NLR > 3. The survival of patients with sarcopenia and NLR > 3 was significantly poorer than those without sarcopenia and NLR ≤ 3. The 1-year OS for patients showing NLR ≤ 3 and without sarcopenia was 55.8%, while the 1-year OS for the group with NLR > 3 and sarcopenia and either sarcopenia or NLR > 3 was 18.3 and 30.3%, respectively (p < 0.001; Figure 4).
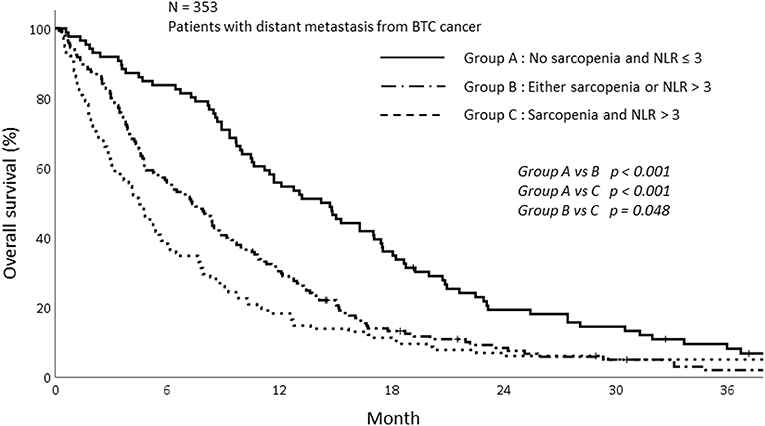
Figure 4. Overall survival of patients depending on sarcopenia and NLR status.
The results of univariate and multivariate analysis are summarized in Table 3. In univariate analysis, 12 variables were factors associated with survival. The 12 variables were as follows; sex, pathology, ECOG, carbohydrate antigen 19-9 (CA 19-9), CRP, albumin, protein, cholesterol, BUN, NLR, Sarcopenia, group stratification based on sarcopenia and NLR. Among these 12 variables, we excluded the NLR and sarcopenia since there were significant correlation between group stratification and both sarcopenia status and NLR. Totally, 10 independent variables were included in the multivariate logistic regression analysis using backward stepwise (17). In the multivariate analysis, group with sarcopenia and high NLR (p = 0.004) were significantly associated with poor OS along with male patients (p = 0.010), patients with higher CA 19-9 (p = 0.032), and those with poor ECOG status (p < 0.001).
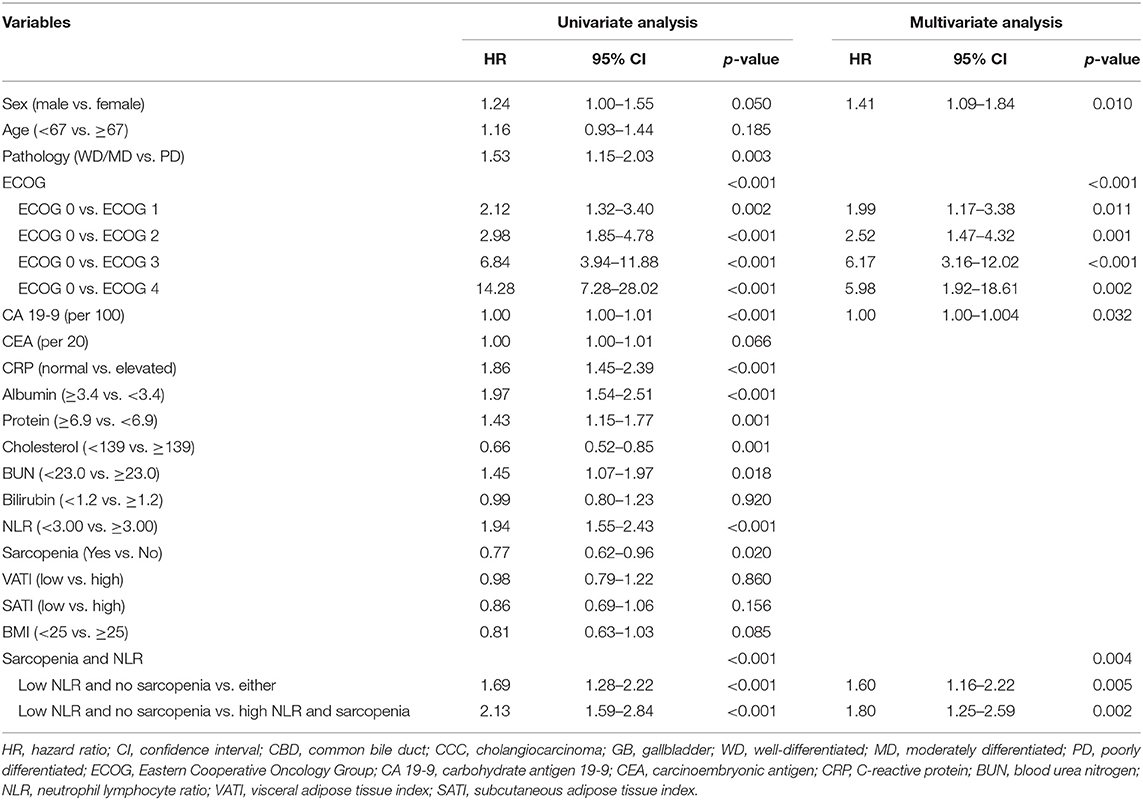
Table 3. Univariate and multivariate analysis of overall survival.
Progression Free Survival and Prognostic Factors
The PFS was analyzed according to sarcopenia and inflammatory status. As shown in Figure 5, sarcopenia was associated with inferior PFS (1-year PFS; 9.5 vs. 19.4%, p < 0.009). In addition, patients with NLR > 3 showed inferior PFS compared to those with NLR ≤ 3 (1-year PFS; 10.0 vs. 23.4%, p < 0.001; Figure 6). Patients with sarcopenia and high NLR demonstrated lesser PFS than the other two groups (1-year PFS; 7.8 vs. 13.0 vs. 27.9%, p < 0.001; Figure 7).

Figure 5. Progression free survival of patients with and without sarcopenia.
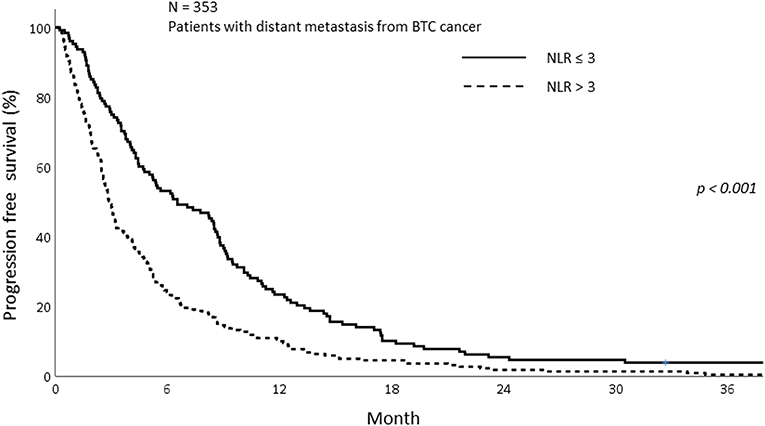
Figure 6. Progression free survival of patients with high and low NLR.
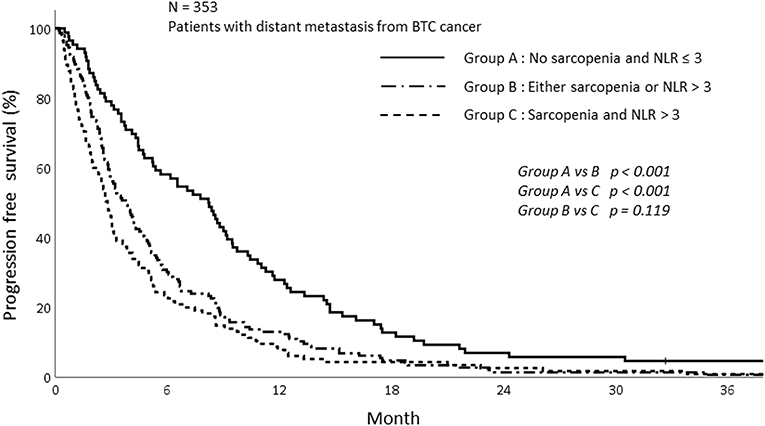
Figure 7. Progression free survival of patients depending on sarcopenia and NLR status.
In the univariate analysis, NLR, sarcopenia, and group depending on NLR status and sarcopenia were significantly associated with PFS. Sarcopenia with NLR > 3 was a significant predictor of poor PFS. Along with high NLR and sarcopenia, poorly differentiated carcinoma (p = 0.017), poor performance (p < 0.001), and high CA 19-9 (p = 0.011) were significant predictors of poor PFS (Table 4).
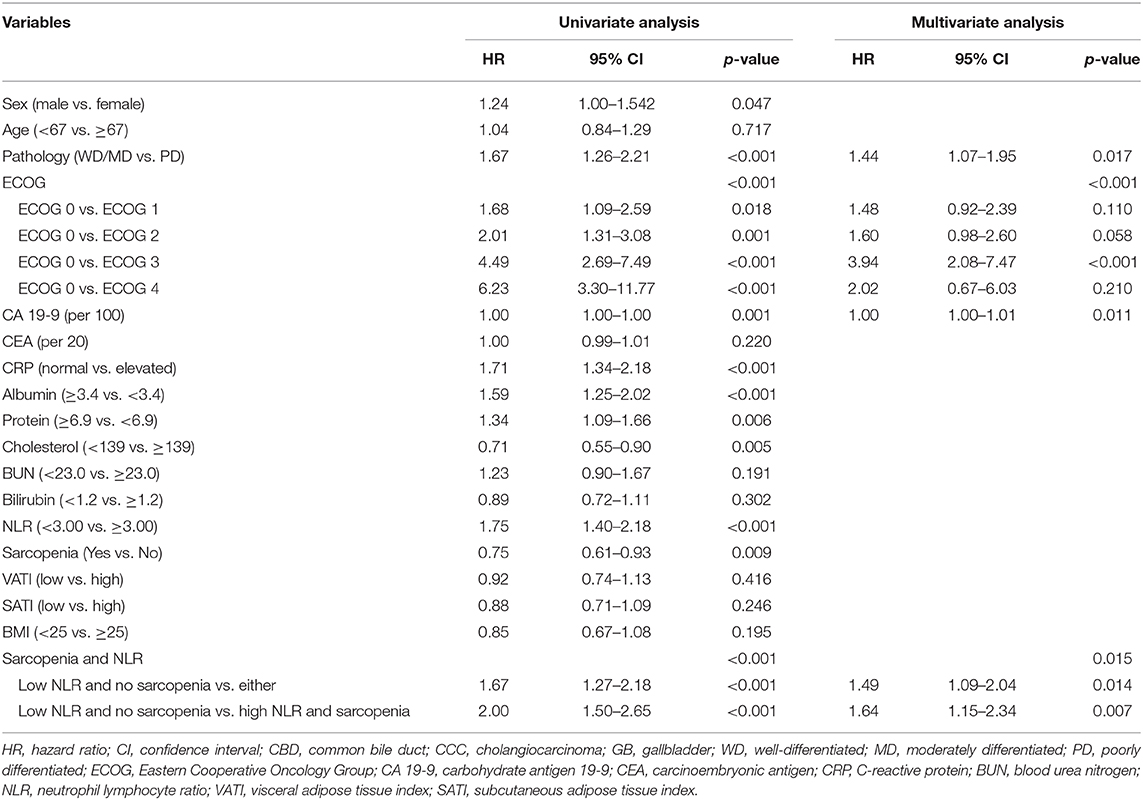
Table 4. Univariate and multivariate analysis of progression free survival.
The Subgroup Analysis of OS and PFS for Patients Who Received GP Chemotherapy
A subgroup analysis was performed for patients who had received gemcitabine/cisplatin (GP) based chemotherapy. Of the 353 patients, 132 received GP chemotherapy. The median follow-up period was 10.67 months (IQR; 5.97–18.48). The OS and PFS rates for patients who received GP chemotherapy were evaluated depending on sarcopenia and inflammatory status.
The OS and PFS were not significantly different between the sarcopenia and non-sarcopenia groups among patients who received GP chemotherapy. The 1-year OS for sarcopenia and non-sarcopenia patients were 42.6 and 50.7%, respectively (p = 0.844; Supplementary Figure 1). The 1-year PFS was 12.7 and 28.0% for sarcopenia and non-sarcopenia patients, respectively (p = 0.123; Supplementary Figure 2). The patients with NLR > 3 had significantly poorer OS and PFS than patients with NLR ≤ 3 (1-year OS; 63.0 vs. 36.5%, p = 0.003, 1-year PFS; 27.3 vs. 17.6%, p = 0.008; Supplementary Figures 3, 4).
The results of univariate and multivariate analysis in OS among patients who received GP chemotherapy are shown in Supplementary Table 1. The OS was not affected by the sarcopenia (p = 0.844) but was affected by the high NLR (p = 0.003) in the univariate analysis. The multivariate analysis also showed the relevance of OS and high NLR (p = 0.019). The results of univariate and multivariate analysis of PFS are shown in Supplementary Table 2. Sarcopenia was not associated with PFS but the inflammation status was significantly associated with PFS (p = 0.003). The NLR status remained significant for predicting PFS in multivariate analysis (p = 0.019).
Analysis of Subcutaneous Adipose Tissue Index and Visceral Adipose Tissue Index
To evaluate the prognostic significance depending on subcutaneous adipose tissue index (SATI) and visceral adipose tissue index (VATI), we compared the OS according to high and low SATI and VATI. The cut off value for VATI and SATI were determined using median values. The VATI cut off values were 29.5 and 28.5 cm2/m2 for female and male patients, respectively. The cut off values of SATI were 56.5 and 26.5 cm2/m2 for female and male patients, respectively. More sarcopenia than non-sarcopenia patients had either low VATI or low SATI (VATI; 57.2 vs. 41.8%, p = 0.004, SATI; 61.0 vs. 36.6%, p < 0.001).
We compared the OS of patients depending on VATI and SATI. There was no difference in OS between patients with high VATI and low VATI (1-year OS: 34.6 vs. 30.2%, p = 0.860). In addition, concordant with VATI results, SATI was not a significant factor for OS. The 1-year OS for high and low SATI was 35.0 and 29.7% (p = 0.155), respectively. Altogether, the adipose index was not associated with OS in metastatic BTC.
Discussion
In this study, we demonstrated that sarcopenia was associated with poor OS and PFS in BTC patients with distant metastasis at diagnosis. Furthermore, high NLR, which indicates inflammatory status, was also associated with reduced OS and PFS. Based on these two results, we stratified the patients into three groups. The patients with both sarcopenia and high NLR showed the poorest OS and PFS compared to those without sarcopenia and low NLR (NLR ≤ 3), and those with either sarcopenia or high NLR.
There is increasing evidence that the loss of muscle may affect the prognosis of cancer (4, 5). As patients with malignancy are generally more vulnerable to degenerative conditions, the decrease in muscle mass, and dysfunction could be easily identified. In particular, patients with malignancy that have progressed to the unresectable or metastatic stage are more likely to be affected by sarcopenia (26). The relevance between sarcopenia and poor prognosis had been shown in breast (5), lung (3), esophageal (27), hepatocellular (28), and colon cancers (29).
Yoon et al. used two ways to evaluate the sarcopenia status of BTC patients; skeletal muscle attenuation; and index. They also suggested that those with low skeletal muscle attenuation had negative influence on survival when compared to those that underwent resection for BTC (30).
In our study, sarcopenia alone did not worsen the PFS and OS in multivariate analysis. However, sarcopenia was significantly associated with poor prognosis in the univariate analysis. Concordant with our data, Yoon et al., who analyzed the significance of sarcopenia on BTC, showed that a low skeletal muscle index was not associated with improved survival in a multivariate analysis (30). It is possible that BTC is more affected by tumor specific factors rather than patient related factors such as sarcopenia.
It remains controversial as to what the cut off values of sarcopenia should be. Sarcopenia is related to several factors such as age, sex, ethnicity, and the region of the body used for measurements. We adopted the cut off value from the JSH guidelines which is based on Asian patients with liver disease (23). As the amount of muscle wasting is different depending on disease and ethnicity, further study would be helpful to clarify the cut off value of sarcopenia in metastatic BTC.
Systemic inflammation is one of the crucial parameters that can predict the cancer outcome in multiple cancers. Many inflammatory markers, such as CRP, NLR, and PLR have been associated with poor prognosis for various cancers (31–33).
Inflammation facilitates cancer progression through the activation of phosphatidylinositol 3-kinase and the recruitment of metalloproteinase-9, which promote cancer cell proliferation, inhibit cell apoptosis (34), and promote angiogenesis and tumor migration (35). Evidently, high NLR, which is associated with inflammation, is linked to poor prognosis and poor response to treatment, and has been demonstrated in various cancers including melanoma (36), colorectal cancer (37, 38), intrahepatic cholangiocarcinoma (39), prostate cancer (40), and pancreatic cancer (41).
In BTC, the NLR cut off value of 3 is frequently used to evaluate the inflammatory status. Several studies have compared NLR values with OS in BTC. In these studies, the patients with NLR > 3 had shorter OS than patients with NLR ≤ 3 (Median OS; 21.6 vs. 12.0 months, p = 0.01). Patients with advanced stage had more predictive NLR status than the surgical group (24, 25). In our study, the OS was significantly different depending on NLR status.
Notably, patients with inflammation accompanied by sarcopenia were associated with poor prognosis. These patients showed poor OS rates and more disease progression than those without inflammation and sarcopenia. The relationship between systemic inflammation and waste of muscle mass is gathering increased attention over the recent years (19). There is a close connection between inflammatory markers and the activation of catabolic pathway (42). For instance, the tumor necrosis factor (TNF) and interleukin 6 (IL-6), which are generated from the tumors and the surrounding cells, can hasten both protein degradation and also inhibit protein synthesis (43). Furthermore, the tumor itself promotes inflammation, which tends to facilitate tumor progression. The secretion of proinflammatory myokines induces muscle degradation and exacerbates systemic inflammation (12). Nevertheless, further studies are needed to elucidate the mechanism between inflammation and sarcopenia.
The patients with sarcopenia in this study showed a high level of inflammation related markers such as CRP and NLR, suggesting that sarcopenia and inflammation are markers of aggressive tumors (44). Similar results have been reported in head and neck cancers. Cho et al. showed that sarcopenia accompanied by systemic inflammation was significantly associated with poor OS and PFS. In addition, the patients with sarcopenia showed more frequent treatment interruptions due to muscle wasting and their inability to endure the treatment adverse effects (17).
In our study, sarcopenia accompanied by systemic inflammation showed inferior OS and PFS. The poor treatment outcome could be explained by the inability of these patients to tolerate the treatment. Consistent with this notion, sarcopenia did not lower the OS and PFS among the patients who received GP chemotherapy which is the first line chemotherapy.
The adipose tissue composition of patients, VATI and SATI, was not associated with long-term survival in our study. However, there are reports that have demonstrated that high visceral fat is associated with poor survival in cancer patients (45). This discrepancy could be explained by the fact that there are significantly less obese patients in Asia than in western countries. In the other studies, overweight, or obese patients accounted for over half of the total patient population (46, 47). In contrast, only 26.1% of our patients were overweight. Therefore, VATI could affect the prognosis of Asian cancer patients; however, this study does not have the power to determine whether or not it does as the number of patients with high VATI included in this study was insufficient.
There are some limitations in this study. First, the result should be interpreted with caution due to its retrospective nature. For example, though there was an association between sarcopenia, systemic inflammation, and survival, we were unable to define a causal relationship. Second, only Korean patients were included in this study. The skeletal muscle mass varies depending on the disease status and ethnicity of patients. For this reason, diverse cut off values for sarcopenia were used. In this study, we adopted the sarcopenia definition created by the Japan JSH. Yet, the optimal cut off value of sarcopenia for Korean cancer patients is yet to be established. To define the criteria for sarcopenia for the Korean population, especially those with malignancy, further studies are necessary. Also, for subgroup analysis, the number of patients received first line GP chemotherapy were too small to show the statistical power. To complement this limitation, study with larger number of patients is needed. Despite these limitations, this is the first study to demonstrate that sarcopenia accompanied by systemic inflammation is associated with poor prognosis for metastatic BTC.
In conclusion, BTC patients with distant metastasis that had sarcopenia and systemic inflammation at diagnosis were associated with poor OS. Exercise, nutritional support, and pharmacological interventions that block muscle atrophy signals or induce muscle hypertrophy could enhance the survival of cancer patients with sarcopenia and inflammation.
Data Availability Statement
All datasets generated for this study are included in the article/Supplementary Material.
Ethics Statement
The studies involving human participants were reviewed and approved by Institutional review board of the Gangnam Severance Hospital. Written informed consent for participation was not required for this study in accordance with the national legislation and the institutional requirements. Written informed consent was not obtained from the individual(s) for the publication of any potentially identifiable images or data included in this article.
Author Contributions
BL, HJ, and IL: study concept and design, manuscript preparation, data acquisition, and data quality control. BL, YC, HJ, and IL: data analysis and interpretation. YC and JK: manuscript review. All authors: contributed to the article and approved the submitted version.
Funding
This research was supported by a grant of the Korea Health Technology R&D Project through the Korea Health Industry Development Institute (KHIDI), funded by the Ministry of Health & Welfare, Republic of Korea (grant number: HI19C1330) and a National Research Foundation of Korea Grant funded by the Korean Government (No. NRF-2019R1A2C1085958).
Conflict of Interest
The authors declare that the research was conducted in the absence of any commercial or financial relationships that could be construed as a potential conflict of interest.
Supplementary Material
The Supplementary Material for this article can be found online at: https://www.frontiersin.org/articles/10.3389/fonc.2020.01581/full#supplementary-material
Supplementary Figure 1. Overall survival among patients who received GP chemotherapy depending on sarcopenia.
Supplementary Figure 2. Progression free survival among patients who received GP chemotherapy depending on sarcopenia.
Supplementary Figure 3. Overall survival among patients who received GP chemotherapy depending on NLR.
Supplementary Figure 4. Progression free survival among patients who received GP chemotherapy depending on NLR.
Supplementary Table 1. Univariate and multivariate analysis of OS using GP chemotherapy.
Supplementary Table 2. Univariate and multivariate analysis of PFS using GP chemotherapy.
References
1. Hanai T, Shiraki M, Nishimura K, Ohnishi S, Imai K, Suetsugu A, et al. Sarcopenia impairs prognosis of patients with liver cirrhosis. Nutrition. (2015) 31:193–9. doi: 10.1016/j.nut.2014.07.005
2. Pereira RA, Cordeiro AC, Avesani CM, Carrero JJ, Lindholm B, Amparo FC, et al. Sarcopenia in chronic kidney disease on conservative therapy: prevalence and association with mortality. Nephrol Dial Transplant. (2015) 30:1718–25. doi: 10.1093/ndt/gfv133
3. Prado CM, Lieffers JR, McCargar LJ, Reiman T, Sawyer MB, Martin L, et al. Prevalence and clinical implications of sarcopenic obesity in patients with solid tumours of the respiratory and gastrointestinal tracts: a population-based study. Lancet Oncol. (2008) 9:629–35. doi: 10.1016/S1470-2045(08)70153-0
4. van Vledder MG, Levolger S, Ayez N, Verhoef C, Tran TC, Ijzermans JN. Body composition and outcome in patients undergoing resection of colorectal liver metastases. Br J Surg. (2012) 99:550–7. doi: 10.1002/bjs.7823
5. Villasenor A, Ballard-Barbash R, Baumgartner K, Baumgartner R, Bernstein L, McTiernan A, et al. Prevalence and prognostic effect of sarcopenia in breast cancer survivors: the HEAL study. J Cancer Surviv. (2012) 6:398–406. doi: 10.1007/s11764-012-0234-x
6. Okumura S, Kaido T, Hamaguchi Y, Fujimoto Y, Kobayashi A, Iida T, et al. Impact of the preoperative quantity and quality of skeletal muscle on outcomes after resection of extrahepatic biliary malignancies. Surgery. (2016) 159:821–33. doi: 10.1016/j.surg.2015.08.047
7. Otsuji H, Yokoyama Y, Ebata T, Igami T, Sugawara G, Mizuno T, et al. Preoperative sarcopenia negatively impacts postoperative outcomes following major hepatectomy with extrahepatic bile duct resection. World J Surg. (2015) 39:1494–500. doi: 10.1007/s00268-015-2988-6
8. Dewys WD, Begg C, Lavin PT, Band PR, Bennett JM, Bertino JR, et al. Prognostic effect of weight loss prior to chemotherapy in cancer patients. Eastern Cooperative Oncology Group. Am J Med. (1980) 69:491–7. doi: 10.1016/s0149-2918(05)80001-3
9. Fearon KC, Voss AC, Hustead DS, Cancer Cachexia Study G. Definition of cancer cachexia: effect of weight loss, reduced food intake, and systemic inflammation on functional status and prognosis. Am J Clin Nutr. (2006) 83:1345–50. doi: 10.1093/ajcn/83.6.1345
10. Yavuzsen T, Davis MP, Walsh D, LeGrand S, Lagman R. Systematic review of the treatment of cancer-associated anorexia and weight loss. J Clin Oncol. (2005) 23:8500–11. doi: 10.1200/JCO.2005.01.8010
11. Argiles JM, Busquets S, Stemmler B, Lopez-Soriano FJ. Cancer cachexia: understanding the molecular basis. Nat Rev Cancer. (2014) 14:754–62. doi: 10.1038/nrc3829
12. Kalinkovich A, Livshits G. Sarcopenic obesity or obese sarcopenia: a cross talk between age-associated adipose tissue and skeletal muscle inflammation as a main mechanism of the pathogenesis. Ageing Res Rev. (2017) 35:200–21. doi: 10.1016/j.arr.2016.09.008
13. Fearon KC. Cancer cachexia: developing multimodal therapy for a multidimensional problem. Eur J Cancer. (2008) 44:1124–32. doi: 10.1016/j.ejca.2008.02.033
14. Bosaeus I. Nutritional support in multimodal therapy for cancer cachexia. Support Care Cancer. (2008) 16:447–51. doi: 10.1007/s00520-007-0388-7
15. Davis JL, Langan RC, Panageas KS, Zheng J, Postow MA, Brady MS, et al. Elevated blood neutrophil-to-lymphocyte ratio: a readily available biomarker associated with death due to disease in high risk nonmetastatic melanoma. Ann Surg Oncol. (2017) 24:1989–96. doi: 10.1245/s10434-017-5836-0
16. Kao SC, Pavlakis N, Harvie R, Vardy JL, Boyer MJ, van Zandwijk N, et al. High blood neutrophil-to-lymphocyte ratio is an indicator of poor prognosis in malignant mesothelioma patients undergoing systemic therapy. Clin Cancer Res. (2010) 16:5805–13. doi: 10.1158/1078-0432.CCR-10-2245
17. Cho Y, Kim JW, Keum KC, Lee CG, Jeung HC, Lee IJ. Prognostic significance of sarcopenia with inflammation in patients with head and neck cancer who underwent definitive chemoradiotherapy. Front Oncol. (2018) 8:457. doi: 10.3389/fonc.2018.00457
18. Go SI, Park MJ, Song HN, Kang MH, Park HJ, Jeon KN, et al. Sarcopenia and inflammation are independent predictors of survival in male patients newly diagnosed with small cell lung cancer. Support Care Cancer. (2016) 24:2075–84. doi: 10.1007/s00520-015-2997-x
19. Feliciano EMC, Kroenke CH, Meyerhardt JA, Prado CM, Bradshaw PT, Kwan ML, et al. Association of systemic inflammation and sarcopenia with survival in nonmetastatic colorectal cancer: results from the C SCANS study. JAMA Oncol. (2017) 3:e172319. doi: 10.1001/jamaoncol.2017.2319
20. Fearon K, Strasser F, Anker SD, Bosaeus I, Bruera E, Fainsinger RL, et al. Definition and classification of cancer cachexia: an international consensus. Lancet Oncol. (2011) 12:489–95. doi: 10.1016/S1470-2045(10)70218-7
21. Evans WJ, Morley JE, Argiles J, Bales C, Baracos V, Guttridge D, et al. Cachexia: a new definition. Clin Nutr. (2008) 27:793–9. doi: 10.1016/j.clnu.2008.06.013
22. Kaasa S, Loge JH, Fayers P, Caraceni A, Strasser F, Hjermstad MJ, et al. Symptom assessment in palliative care: a need for international collaboration. J Clin Oncol. (2008) 26:3867–73. doi: 10.1200/JCO.2007.15.8881
23. Nishikawa H, Shiraki M, Hiramatsu A, Moriya K, Hino K, Nishiguchi S. Japan Society of Hepatology guidelines for sarcopenia in liver disease (1st edition): recommendation from the working group for creation of sarcopenia assessment criteria. Hepatol Res. (2016) 46:951–63. doi: 10.1111/hepr.12774
24. McNamara MG, Templeton AJ, Maganti M, Walter T, Horgan AM, McKeever L, et al. Neutrophil/lymphocyte ratio as a prognostic factor in biliary tract cancer. Eur J Cancer. (2014) 50:1581–9. doi: 10.1016/j.ejca.2014.02.015
25. Park HS, Park JS, Chun YJ, Roh YH, Moon J, Chon HJ, et al. Prognostic factors and scoring model for survival in metastatic biliary tract cancer. Cancer Res Treat. (2017) 49:1127–39. doi: 10.4143/crt.2016.538
26. Stene GB, Helbostad JL, Amundsen T, Sorhaug S, Hjelde H, Kaasa S, et al. Changes in skeletal muscle mass during palliative chemotherapy in patients with advanced lung cancer. Acta Oncol. (2015) 54:340–8. doi: 10.3109/0284186X.2014.953259
27. Hayashi Y, Correa AM, Hofstetter WL, Vaporciyan AA, Rice DC, Walsh GL, et al. The influence of high body mass index on the prognosis of patients with esophageal cancer after surgery as primary therapy. Cancer. (2010) 116:5619–27. doi: 10.1002/cncr.25745
28. Harimoto N, Shirabe K, Yamashita YI, Ikegami T, Yoshizumi T, Soejima Y, et al. Sarcopenia as a predictor of prognosis in patients following hepatectomy for hepatocellular carcinoma. Br J Surg. (2013) 100:1523–30. doi: 10.1002/bjs.9258
29. Jung HW, Kim JW, Kim JY, Kim SW, Yang HK, Lee JW, et al. Effect of muscle mass on toxicity and survival in patients with colon cancer undergoing adjuvant chemotherapy. Support Care Cancer. (2015) 23:687–94. doi: 10.1007/s00520-014-2418-6
30. Yoon SB, Choi MH, Song M, Lee JH, Lee IS, Lee MA, et al. Impact of preoperative body compositions on survival following resection of biliary tract cancer. J Cachexia Sarcopenia Muscle. (2019) 10:794–802. doi: 10.1002/jcsm.12431
31. Huang QT, Zhou L, Zeng WJ, Ma QQ, Wang W, Zhong M, et al. Prognostic significance of neutrophil-to-lymphocyte ratio in ovarian cancer: a systematic review and meta-analysis of observational studies. Cell Physiol Biochem. (2017) 41:2411–8. doi: 10.1159/000475911
32. Zhou WJ, Wu J, Li XD, Wang Q, Ni XF, Jiang JT, et al. [Effect of preoperative monocyte-lymphocyte ratio on prognosis of patients with resectable esophagogastric junction cancer]. Zhonghua Zhong Liu Za Zhi. (2017) 39:178–83. doi: 10.3760/cma.j.issn.0253-3766.2017.03.004
33. Cummings M, Merone L, Keeble C, Burland L, Grzelinski M, Sutton K, et al. Preoperative neutrophil:lymphocyte and platelet:lymphocyte ratios predict endometrial cancer survival. Br J Cancer. (2015) 113:311–20. doi: 10.1038/bjc.2015.200
34. Houghton AM, Rzymkiewicz DM, Ji H, Gregory AD, Egea EE, Metz HE, et al. Neutrophil elastase-mediated degradation of IRS-1 accelerates lung tumor growth. Nat Med. (2010) 16:219–23. doi: 10.1038/nm.2084
35. Wilson TJ, Nannuru KC, Futakuchi M, Singh RK. Cathepsin G-mediated enhanced TGF-beta signaling promotes angiogenesis via upregulation of VEGF and MCP-1. Cancer Lett. (2010) 288:162–9. doi: 10.1016/j.canlet.2009.06.035
36. Schmidt H, Bastholt L, Geertsen P, Christensen IJ, Larsen S, Gehl J, et al. Elevated neutrophil and monocyte counts in peripheral blood are associated with poor survival in patients with metastatic melanoma: a prognostic model. Br J Cancer. (2005) 93:273–8. doi: 10.1038/sj.bjc.6602702
37. Grenader T, Nash S, Adams R, Kaplan R, Fisher D, Maughan T, et al. Derived neutrophil lymphocyte ratio is predictive of survival from intermittent therapy in advanced colorectal cancer: a post hoc analysis of the MRC COIN study. Br J Cancer. (2016) 114:612–5. doi: 10.1038/bjc.2016.23
38. Sr W, Cook EJ, Goulder F, Justin TA, Keeling NJ. Neutrophil-lymphocyte ratio as a prognostic factor in colorectal cancer. J Surg Oncol. (2005) 91:181–4. doi: 10.1002/jso.20329
39. Lin GH, Liu YC, Li SH, Mao YZ, Wang J, Shuang ZY, et al. Elevated neutrophil-to-lymphocyte ratio is an independent poor prognostic factor in patients with intrahepatic cholangiocarcinoma. Oncotarget. (2016) 7:50963–71. doi: 10.18632/oncotarget.7680
40. Kawahara T, Yokomizo Y, Ito Y, Ito H, Ishiguro H, Teranishi J, et al. Pretreatment neutrophil-to-lymphocyte ratio predicts the prognosis in patients with metastatic prostate cancer. Bmc Cancer. (2016) 16:111. doi: 10.1186/s12885-016-2134-3
41. Hasegawa S, Eguchi H, Tomokuni A, Tomimaru Y, Asaoka T, Wada H, et al. Pre-treatment neutrophil to lymphocyte ratio as a predictive marker for pathological response to preoperative chemoradiotherapy in pancreatic cancer. Oncol Lett. (2016) 11:1560–6. doi: 10.3892/ol.2015.4057
42. Kantola T, Klintrup K, Vayrynen JP, Vornanen J, Bloigu R, Karhu T, et al. Stage-dependent alterations of the serum cytokine pattern in colorectal carcinoma. Br J Cancer. (2012) 107:1729–36. doi: 10.1038/bjc.2012.456
43. Baracos VE. Regulation of skeletal-muscle-protein turnover in cancer-associated cachexia. Nutrition. (2000) 16:1015–8. doi: 10.1016/s0899-9007(00)00407-x
44. Dodson S, Baracos VE, Jatoi A, Evans WJ, Cella D, Dalton JT, et al. Muscle wasting in cancer cachexia: clinical implications, diagnosis, and emerging treatment strategies. Annu Rev Med. (2011) 62:265–79. doi: 10.1146/annurev-med-061509-131248
45. van Kruijsdijk RC, van der Wall E, Visseren FL. Obesity and cancer: the role of dysfunctional adipose tissue. Cancer Epidemiol Biomarkers Prev. (2009) 18:2569–78. doi: 10.1158/1055-9965.EPI-09-0372
46. Huillard O, Mir O, Peyromaure M, Tlemsani C, Giroux J, Boudou-Rouquette P, et al. Sarcopenia and body mass index predict sunitinib-induced early dose-limiting toxicities in renal cancer patients. Br J Cancer. (2013) 108:1034–41. doi: 10.1038/bjc.2013.58
Keywords: biliary tract cancer, sarcopenia, inflammation, survival, prognosis
Citation: Lee Bm, Cho Y, Kim JW, Jeung HC and Lee IJ (2020) Prognostic Significance of Sarcopenia in Advanced Biliary Tract Cancer Patients. Front. Oncol. 10:1581. doi: 10.3389/fonc.2020.01581
Received: 06 March 2020; Accepted: 22 July 2020;
Published: 02 September 2020.
Edited by:
Xiaojie Tan, Second Military Medical University, ChinaReviewed by:
Hamidullah Khan, University of Wisconsin-Madison, United StatesAbdelbaset Mohamed Elasbali, Al Jouf University, Saudi Arabia
Copyright © 2020 Lee, Cho, Kim, Jeung and Lee. This is an open-access article distributed under the terms of the Creative Commons Attribution License (CC BY). The use, distribution or reproduction in other forums is permitted, provided the original author(s) and the copyright owner(s) are credited and that the original publication in this journal is cited, in accordance with accepted academic practice. No use, distribution or reproduction is permitted which does not comply with these terms.
*Correspondence: Hei Cheul Jeung, jeunghc1123@yuhs.ac; Ik Jae Lee, ikjae412@yuhs.ac
†These authors have contributed equally to this work