 Pingping Wang
 Hai Li2
 Di Xu
Di Xu- 1Department of Ultrasound, The First Affiliated Hospital of Nanjing Medical University, Nanjing, China
- 2Department of Pathology, The First Affiliated Hospital of Nanjing Medical University, Nanjing, China
Objectives: To explore the relationship between ultrasound (US) features and Ki-67 labeling index (LI) of soft tissue sarcoma (STS).
Methods: Forty-six patients with 47 STS lesions, between September 2014 and April 2020, were enrolled in the study. Point-biserial correlation analysis and Spearman’s correlation analysis were utilized to examining the relationship between the US features and the Ki-67 LI of STS. The differences of US features between high and low Ki-67 proliferation groups were statistically analyzed by independent t test, Wilcoxon rank-sum test, and Fisher’s exact test. The optimal cut-off points of US features revealing significant differences were estimated by the maximum Youden index.
Results: A moderate correlation between the vascular density grade and the Ki-67 LI (ρ = 0.409, P = 0.004) was found in this study. In addition, other ultrasound features were irrelevant to the Ki-67 LI. The cut-off for differentiating low- and high-proliferation groups was grade II according to the best Youden index. The area under receiver operating characteristic (ROC) curve was 0.74 (p = 0.011) with a sensitivity of 60.6% and specificity of 78.6%.
Conclusions: Only the vascular density grade of STS had a weak positive correlation with Ki-67 LI, and might be capable of predicting the proliferation of STS. Other ultrasonographic features of STS such as shape and tumor margin have no correlation with Ki-67 LI.
Introduction
Soft tissue sarcomas (STS) account for 1% of all malignant tumors, which exhibit all malignant tumor behaviors and have complex histological subtypes (>50 types) (1). Appropriate individualized treatment can prolong the survival rate of STS patients and improve their life quality. Early comprehensive evaluation of the biological behavior of STS is crucial for clinical treatment selection and thus become a clinically challenge (2).
Ki-67, a nuclear protein related to cell proliferation ability, was firstly described in 1983 (3). In a variety of tumors (such as breast cancer, colorectal cancer, lung cancer), the effectivity of Ki-67 as a prognostic marker has been proven (4–7). Hoos et al. (8) carried out a retrospective study on 47 patients with STS, which demonstrated that high Ki-67 proliferation index could be an important factor in the prognosis of high-risk STS patients. In a prospective study, Tanaka et al. (2) proved that Ki-67 classification system was more effective and repeatable than the traditional French Federation of Cancer Centers Sarcoma Group (FNCLCC) system.
Pathological immunohistochemistry (IHC) is often used to detect Ki-67 labeling index (LI), which is an invasive method with time delay. Therefore, researchers began to explore a simple and non-invasive method to evaluate Ki-67 LI and made some preliminary breakthroughs. For instance, the preoperative magnetic resonance imaging (MRI) parameters of small invasive hepatocellular carcinoma have been proved to be related to Ki-67 LI (9). In the study of Chen et al. (10), the spectral computed tomography (CT) imaging parameters in lung adenocarcinoma were moderately positively correlated with Ki-67 LI. In addition, Liu et al. (11) developed a multi-parameter MRI radiology model based on deep learning to improve the ability to predict the Ki-67 status of preoperative breast cancer.
Ultrasound (US) examination has the advantages of convenience, cheapness, real-time, and few contraindications (12). It can not only provide tumor size, shape, edge, internal structure, and other information, but also detect tumor blood flow with color Doppler US (12, 13). To our knowledge, no studies have researched the correlation between Ki-67 expression and the US characteristics of STS. In this study we investigated their relationship and whether US could be used as a non-invasive tool to evaluate the cell proliferation of STS.
Materials and Methods
Patients
Between September 2014 and April 2020, 6,696 patients had US scan for suspected soft tissue tumor and 100 patients were diagnosed as STS by pathology. Thenceforth, 54 cases were further excluded based on the following exclusion criteria: History of previous treatment (n = 22); No quantitative Ki-67 LI (n = 31); Unavailable US images (n = 1); Interval between specimen obtainment and US examination exceeding 60 days (n = 0). In the present study, we focused on soft tissue sarcoma of the musculoskeletal system. Gynecological or retroperitoneal tumors was not included. Ultimately, 46 patients comprising 47 lesions were enrolled in the study (Figure 1). This retrospective study was approval by the ethics committee of our hospital, and the requirement for informed consent was waived for all participants.
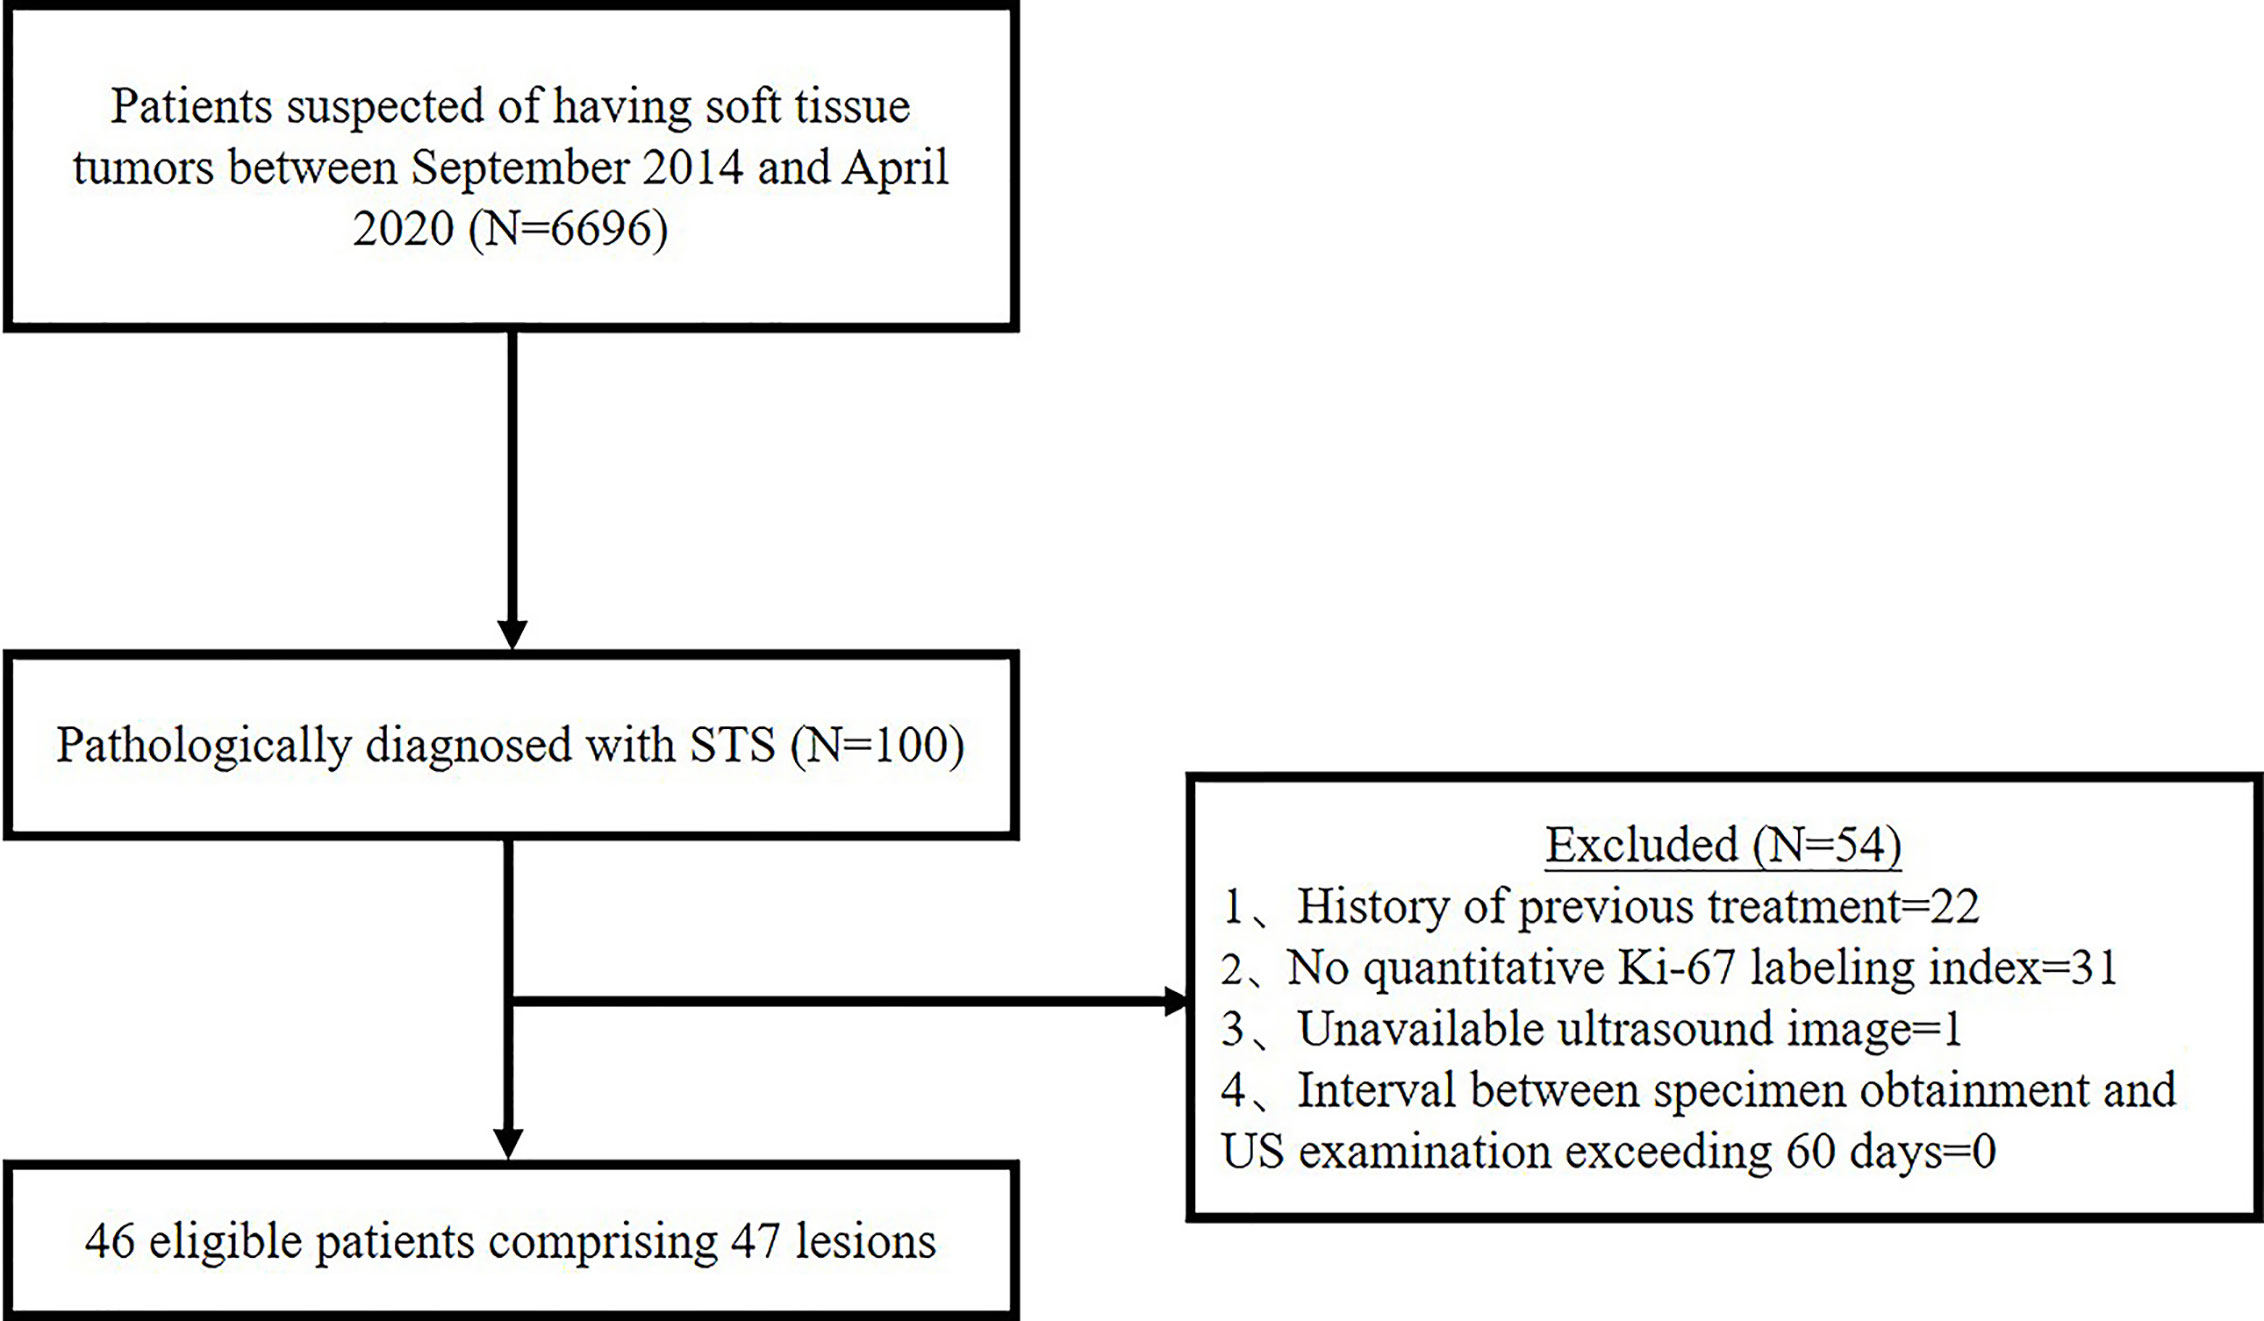
Figure 1 Flowchart of study population selection. (STS, soft tissue sarcoma; N, number).
Ultrasound Examination
US images were acquired using Logiq E9 (GE Healthcare, Milwaukee, WI, USA) US 54 machine with a 6–15 MHz liner probe and a 1–6 MHz convex probe, and an ACUSON S3000 Ultrasound System with a 9L4 probe (4–9 MHz) (Siemens Medical Solution, Mountain View, CA, USA). Patients were in a position where the lesions could be completely exposed. In order to optimize the color blood flow display, ultrasound gel and light pressure need to be applied in the lesion area. The gray-scale US was performed to observe and record the shape, size, location, boundary, internal echo, surrounding tissue relationship and capsule of the mass in detail. Subsequently, color doppler flow imaging (CDFI) was used to detect the vascular density and distribution of the mass. Spectral analysis and elastography were not routinely performed.
Ultrasound Features Extraction
Two radiologists who had 5 and 10 years of experience in musculoskeletal US independently reviewed the images from the Picture Archiving and Communication System (PACS) of our hospital and recorded all the US features of the STS blinded to patient information and histological diagnosis. Over five static US images including at least two CDFI images were assessed for each lesion. The following US features were evaluated and recorded: (1) The maximum diameter of the mass was the average value after multiple measurements. (2) The shape consisted of regular (round, oval) and irregular. (3) The tumor margin was assessed as clear (well-defined: capsule like; clear-cut and thin) or unclear (ill-defined: uncertain boundary with adjacent normal tissue, or certain boundary with irregular margin and wider transitional zone); (4) The internal echo included three types in contrast to adjacent normal tissue: hypoechoic, hyperechoic, and isoechoic. (5) Internal texture was classified as homogeneous and inhomogeneous. (6) If the internal component was more than 50% cystic, it was mainly cystic, otherwise it was mainly solid. Internal calcifications were assessed as positive or negative. (7) The vascular density was assessed as four grades by the criteria of Adler et al. (14) (Figure 2): Grade 0 showed no blood flow signal in the mass; Grade I showed a small amount of blood flow: one to two punctate or rod like vessels could be seen in the mass; Grade II showed moderate blood flow: three to four punctate vessels or a long strip shape blood vessel penetrated into the lesion with a length close to or beyond the radius of the mass; Grade III showed multiple blood flow: more than five punctate vessels or two long strip shape vessels in the mass (8). The vascular distribution was identified as none, peripheral, internal, and mixed.
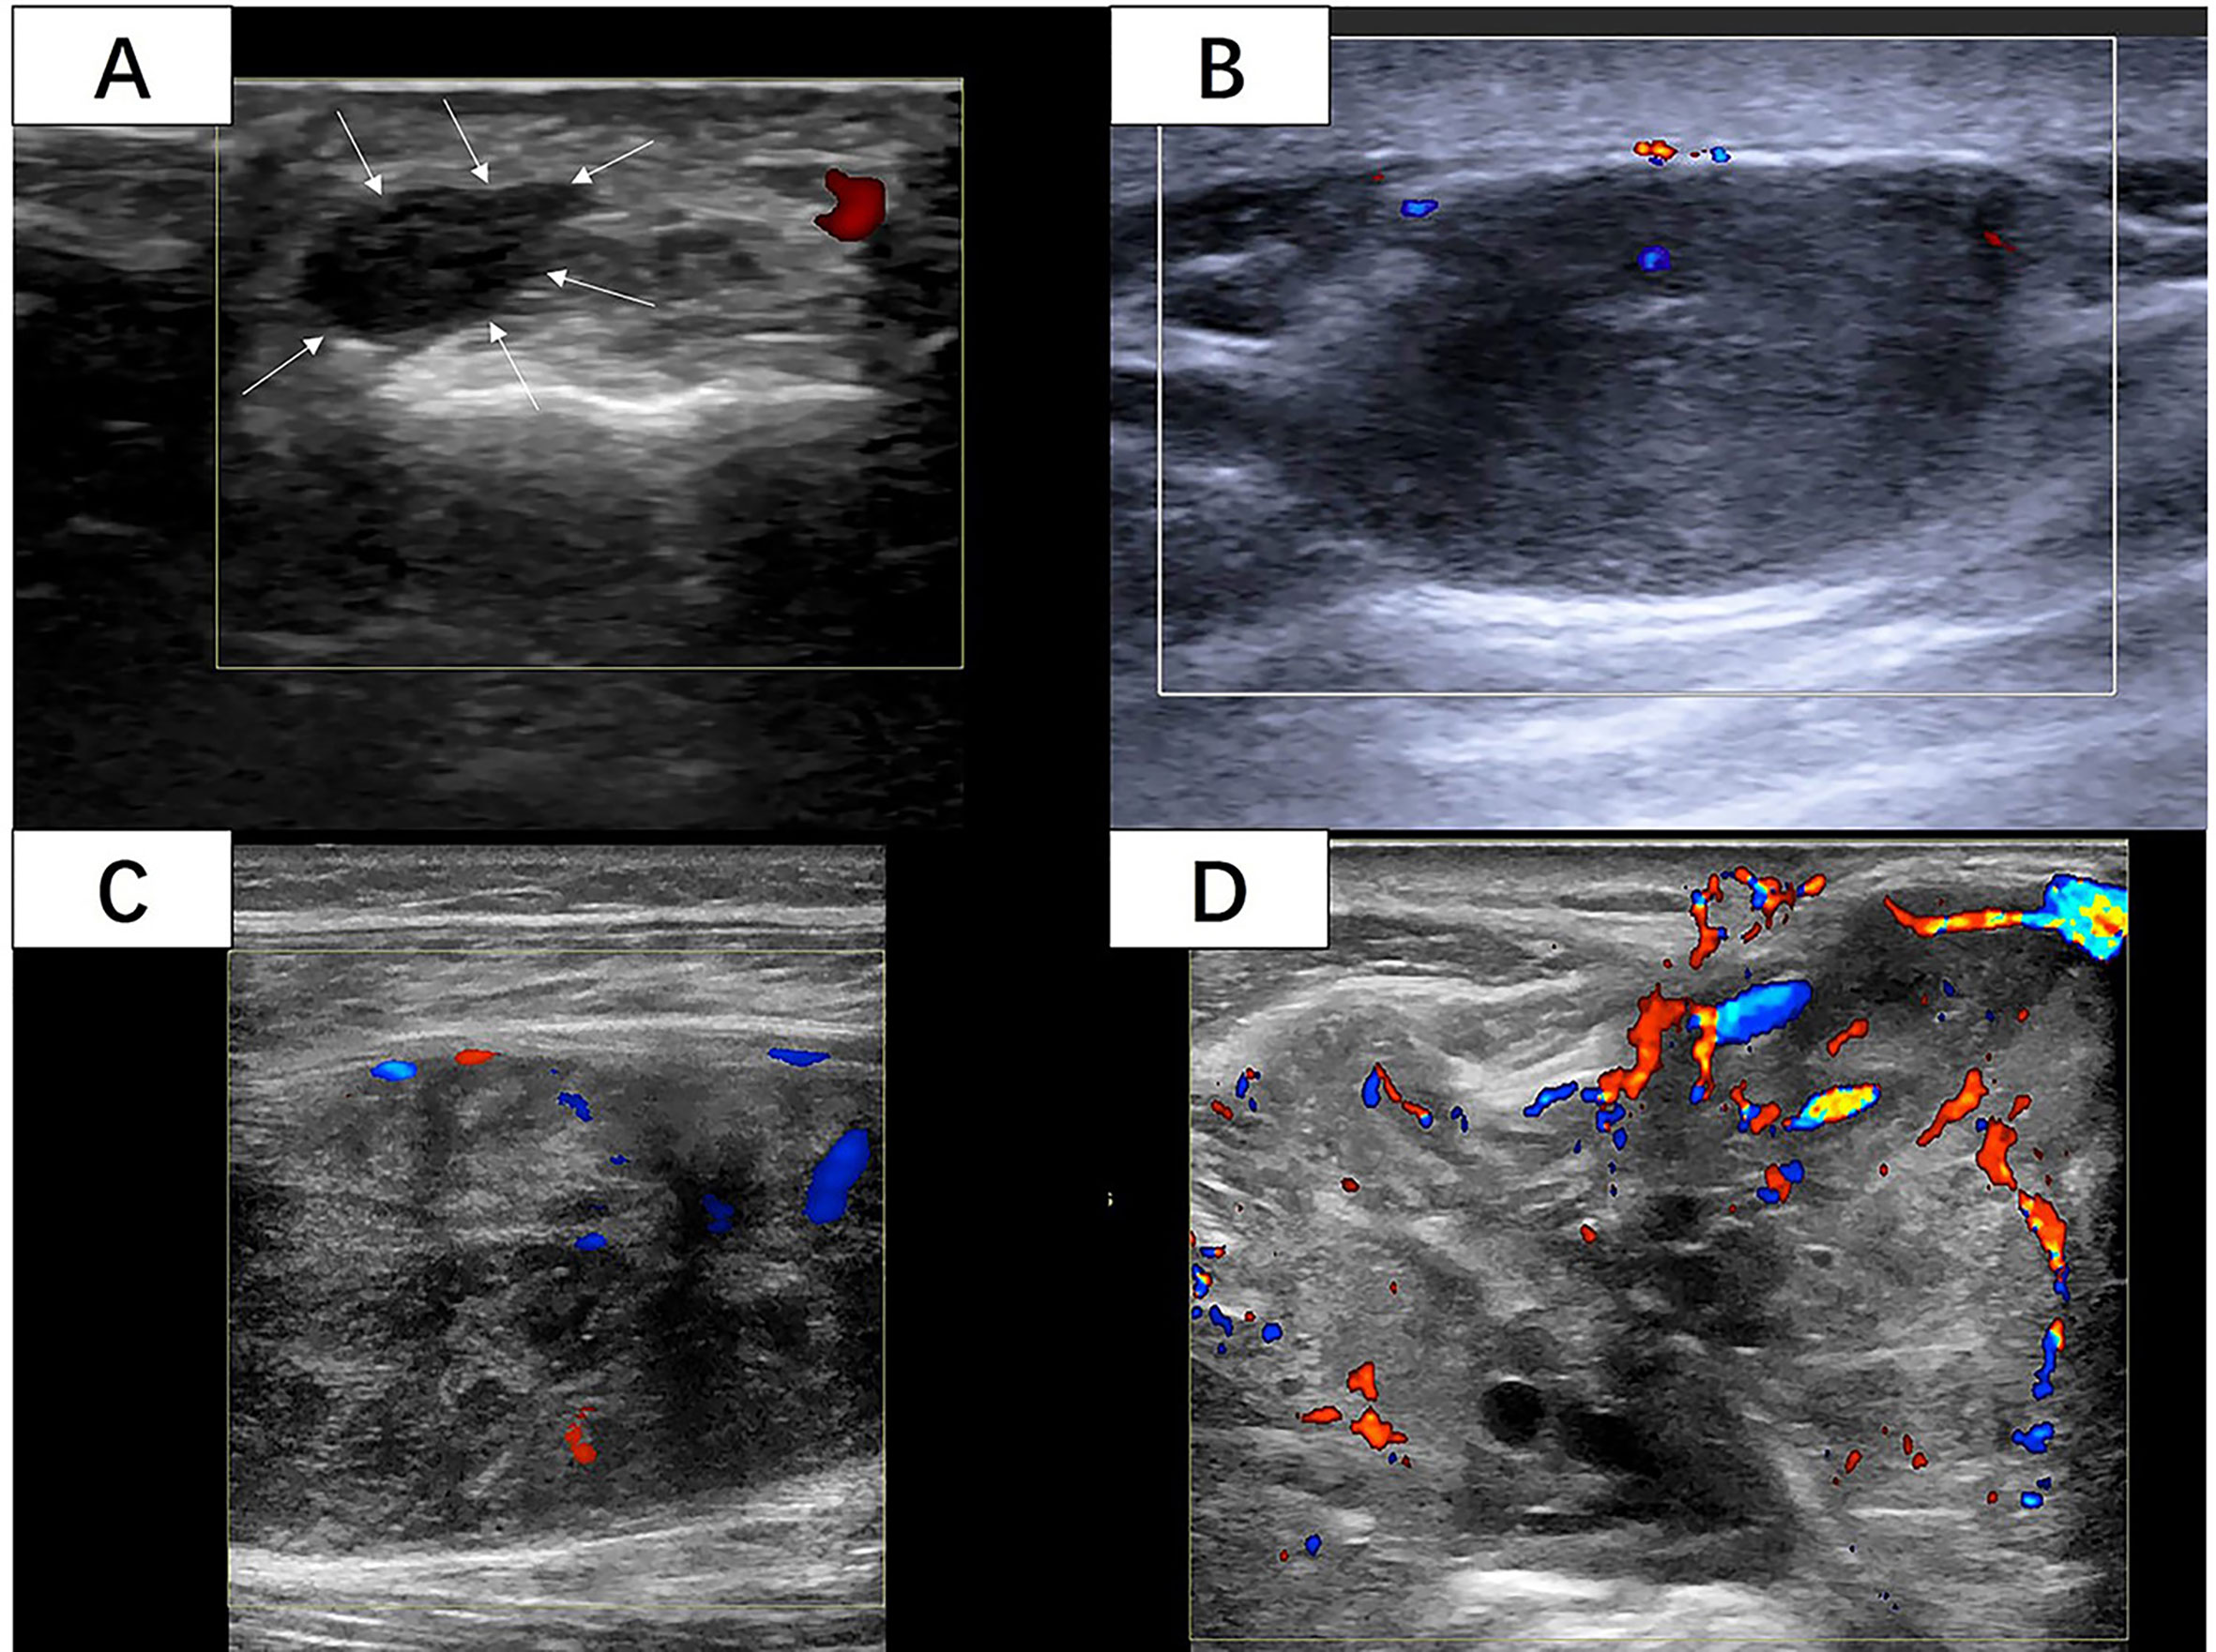
Figure 2 (A) A 42-year-old woman with 6cm lesion with vascular density grade 0 with histological diagnosis of synovial sarcoma with Ki-67 LI of 5%. (White arrow: The margin of the lesion) (B) A 50-year-old woman with 27cm lesion with vascular density grade I with histological diagnosis of leiomyosarcoma with Ki-67 LI of 10%. (C) A 33-year-old woman with 73cm lesion with vascular density grade II with histological diagnosis of fibrosarcoma with Ki-67 LI of 10%. (D) A 70-year-old man with 86cm lesion with vascular density grade III with histological diagnosis of synovial sarcoma with Ki-67 LI of 60%. (Images were obtained from four different lesions included in our study.
Histopathology and Immunohistochemistry
The immunohistochemistry (IHC) specimens of the included lesions, 40 cases were from surgery and 7 from biopsy. Formalin-fixed and paraffin-embedded samples were stained with hematoxylin and eosin and analyzed by IHC using Ki-67 antibodies (1:200, Dako). An experienced sarcoma pathologist reviewed the IHC slides. The Ki-67 LI was recorded as a percentage of Ki-67 positive tumor cells. According to the IHC staining, the included lesions was divided into two groups (8): The Ki-67 index is considered to be high if >=30% tumor cells showed stained nuclei and low if <30%.
Statistical Analysis
We assessed the correlation between US features and Ki-67 LI (high/low): point-biserial correlation analysis for continuous variables; Spearman correlation analysis for categorical variables. When the absolute value of correlation coefficient was 0–0.2, no or very weak correlation was indicated; 0.2–0.4, low; 0.4–0.6, moderate; 0.6–0.8, high; 0.8–1, very strong. The differences in US features were analyzed between high and low Ki-67 proliferation groups. The independent t test or Wilcoxon rank-sum test was used for continuous and ordinal categorical variables. The chi-squared test or Fisher’s exact test was utilized for categorical variables. According to features revealing significant differences, we computed receiver operation characteristic (ROC) curves and calculated the area under the curve, respectively. The optimal cut-off points were estimated by the maximum Youden index (sensitivity+specificity-1). Consistency of the observers was evaluated using intraclass correlation (ICC) and kappa for continuous and categorical variables, respectively. When ICC/kappa was 0–0.4, consistency was considered poor; 0.4–0.59, general; 0.6–0.74, good; 0.75–1, excellent (15). All statistical analyses were performed in the IBM SPSS Statistics 25 (IBM SPSS, Turkey) program. If P < 0.05, it was considered statistically significant.
Result
The average age of 46 patients was 58.2 (range 12–92) years old. There were 47 lesions, 1 in the head and neck, 30 in the extremities, and 16 in the trunk. The distribution range of Ki-67 LI was 2–90% (Figure 3). Time interval between ultrasound examination and pathological diagnosis was 2–51 days. Of the 47 lesions, 33 were in the high proliferation group and 14 were in the low group (Table 1).
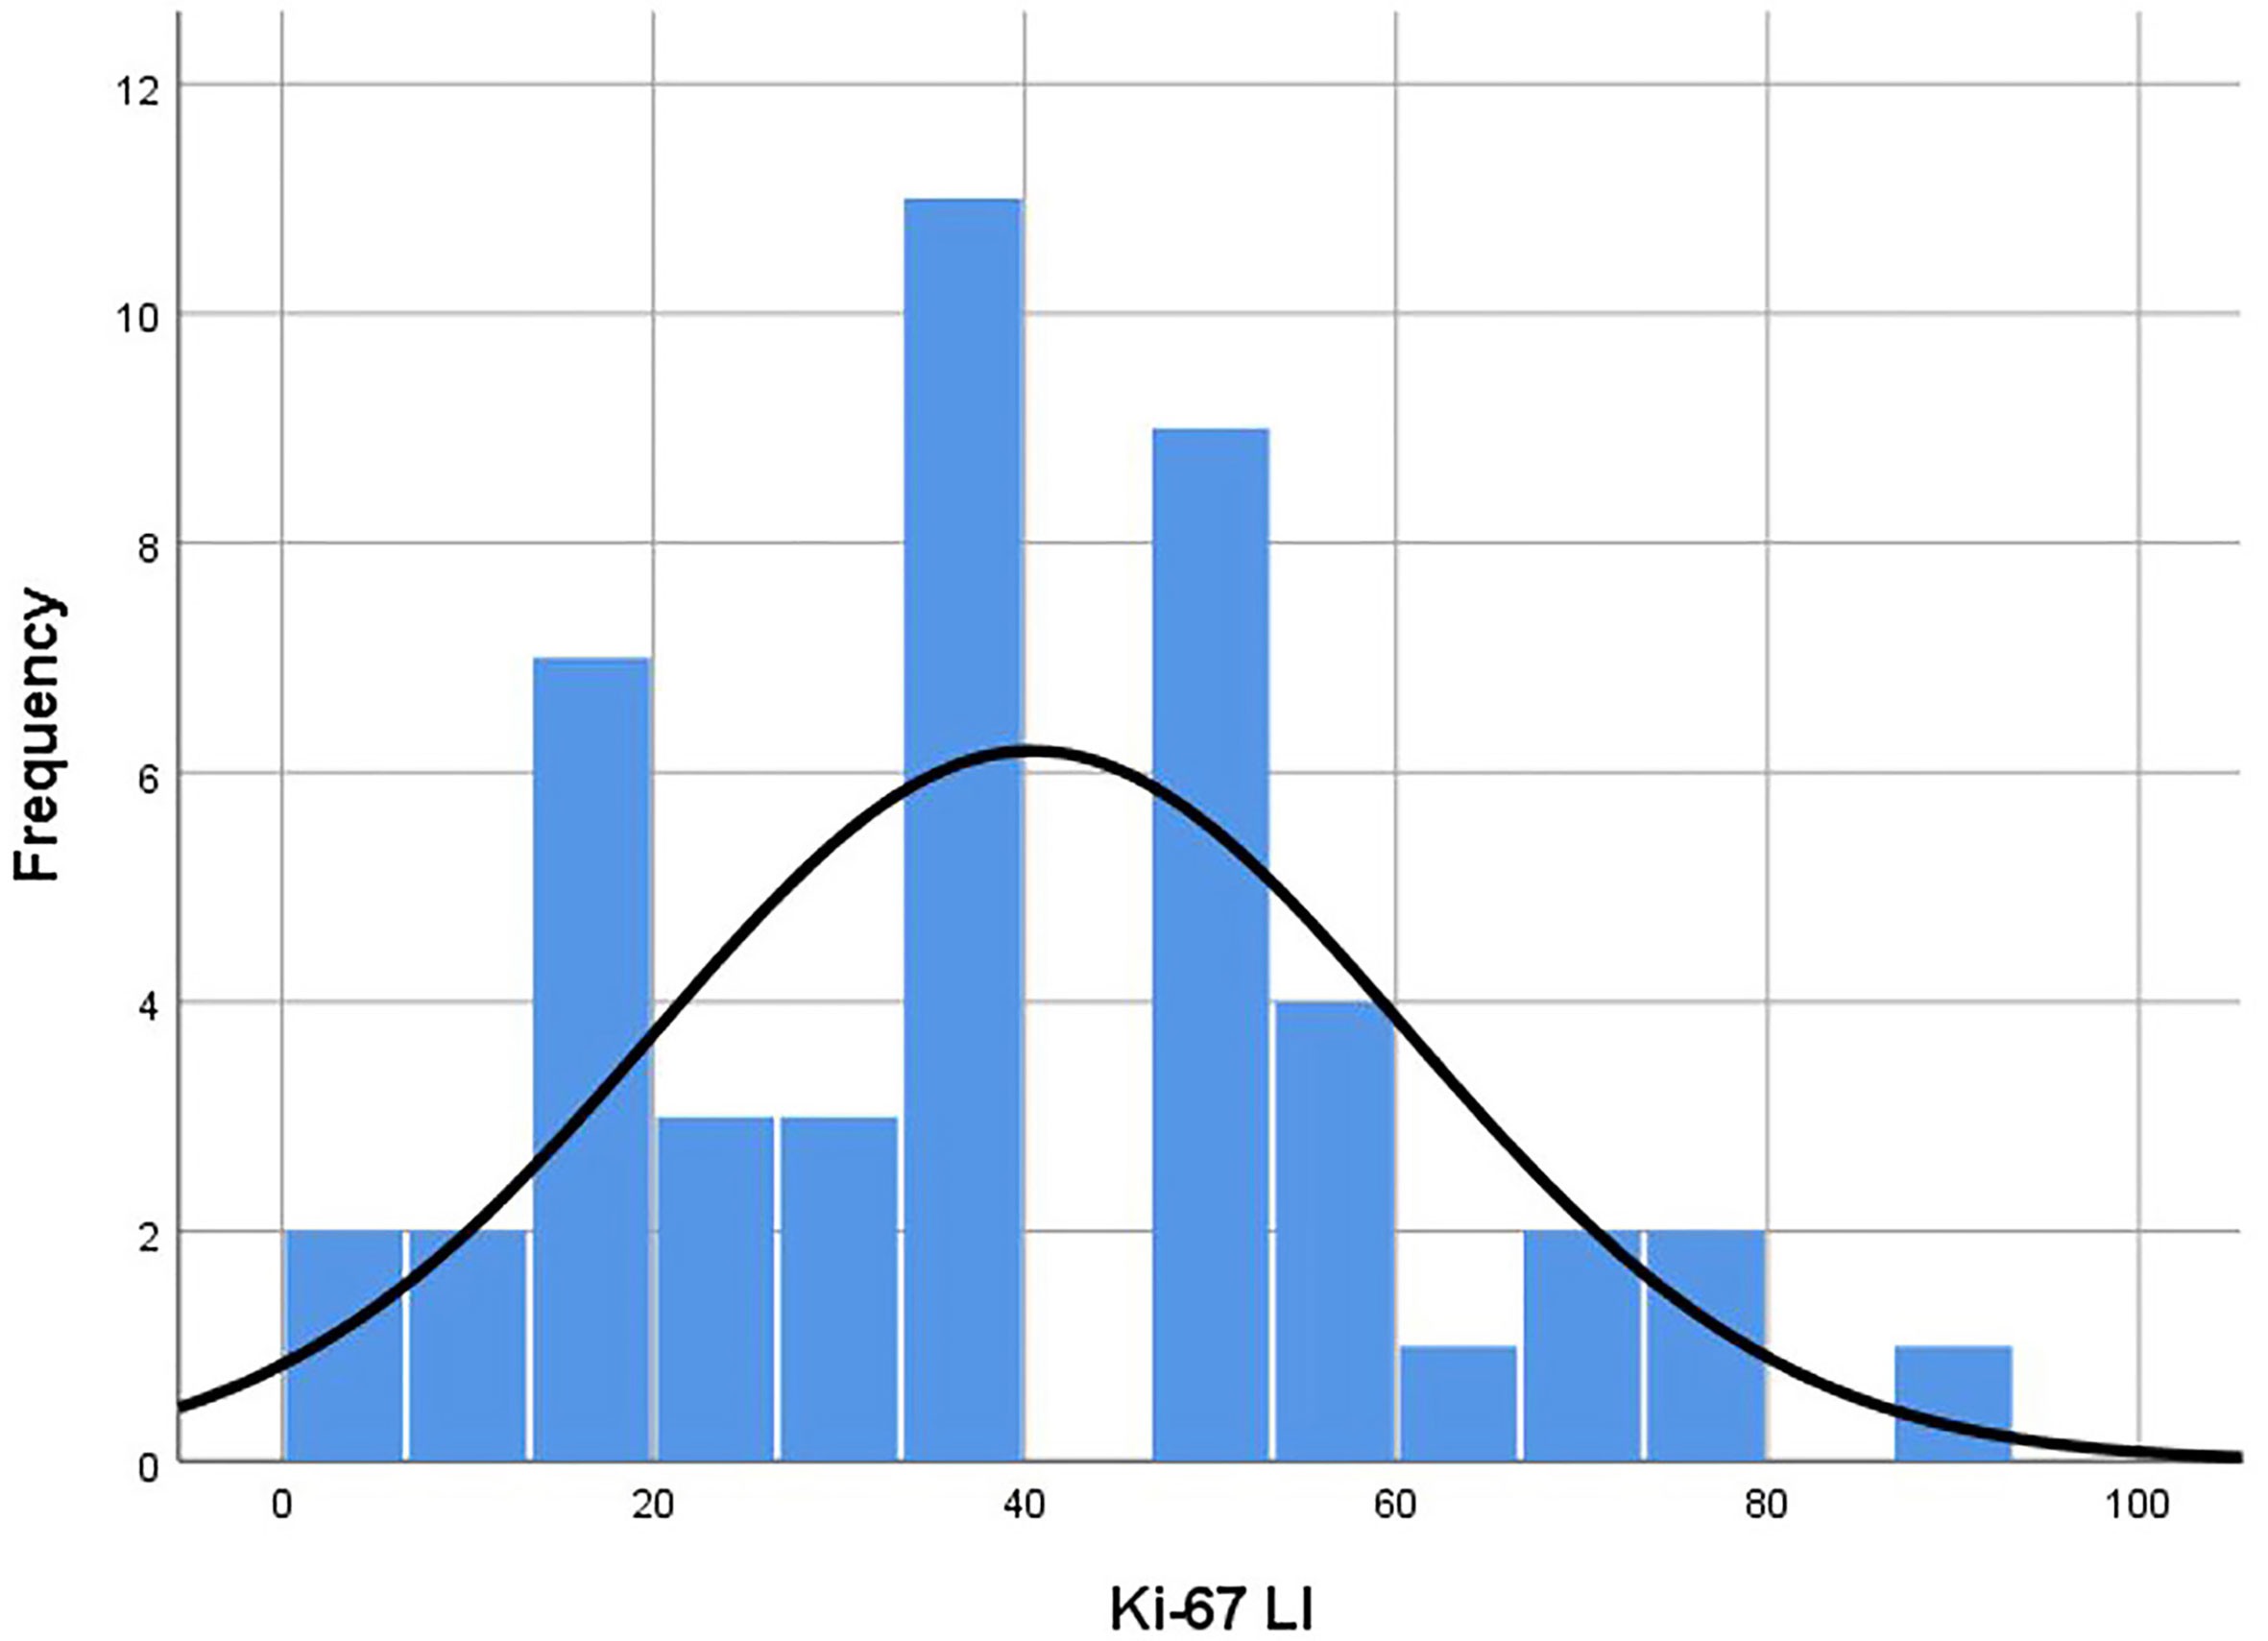
Figure 3 Histogram of Ki-67 LI distribution of the lesions. Distribution was in accordance with the Kolmogorov-Smirnov test (p = 0.20). Median was 40.00 and standard deviation was 20.20. LI, labeling index.
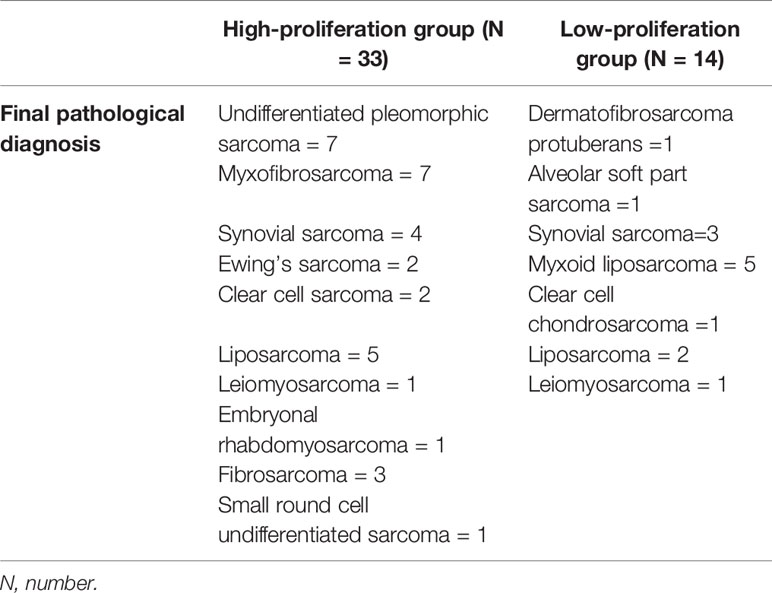
Table 1 Detailed histological diagnoses in the low- and high-proliferation groups.
Table 2 showed the distribution of general characteristics and ultrasound features of 47 lesions in the high- and low-proliferation groups. Additionally, the correlation of these parameters with KI-67 status and whether these parameters were statistically different in the high- and low-proliferation groups were also included in the table. As shown in Table 2, there was a moderate correlation between the vascular density grade of STS and the proliferation level (high/low) of Ki-67 with a correlation coefficient of 0.409 (P = 0.004). At the same time, there was a significant difference in the grade of vascular density between high- and low-proliferation groups (P = 0.005). The most appropriate “cut-off” of vascular density to evaluate the proliferation ability was between grade II and III. This meant that in clinical practice, if the ultrasound results of STS show that the vascular density is grade III, it may have high Ki-67 LI with exuberant cell proliferation ability; if the vascular density of STS is grade 0/I/II, it may have low Ki-67 LI with meagre cell proliferation ability. The sensitivity and specificity for differentiating low- and high-proliferation groups was 60.6 and 78.6%, with an area under the ROC curve of 0.74 (p = 0.011) (Figure 4). Moreover, the diameterMAX and depth of the STS demonstrated correlation respectively (ρ = 0.28, 0.25) between high and low groups that nearly met statistical significance (p = 0.06 and 0.09). However, shape, margin, internal echo, internal texture, internal component, calibrations, and the blood flow distribution had no correlation with the Ki-67 LI, and there was no significant difference between the high and low groups.
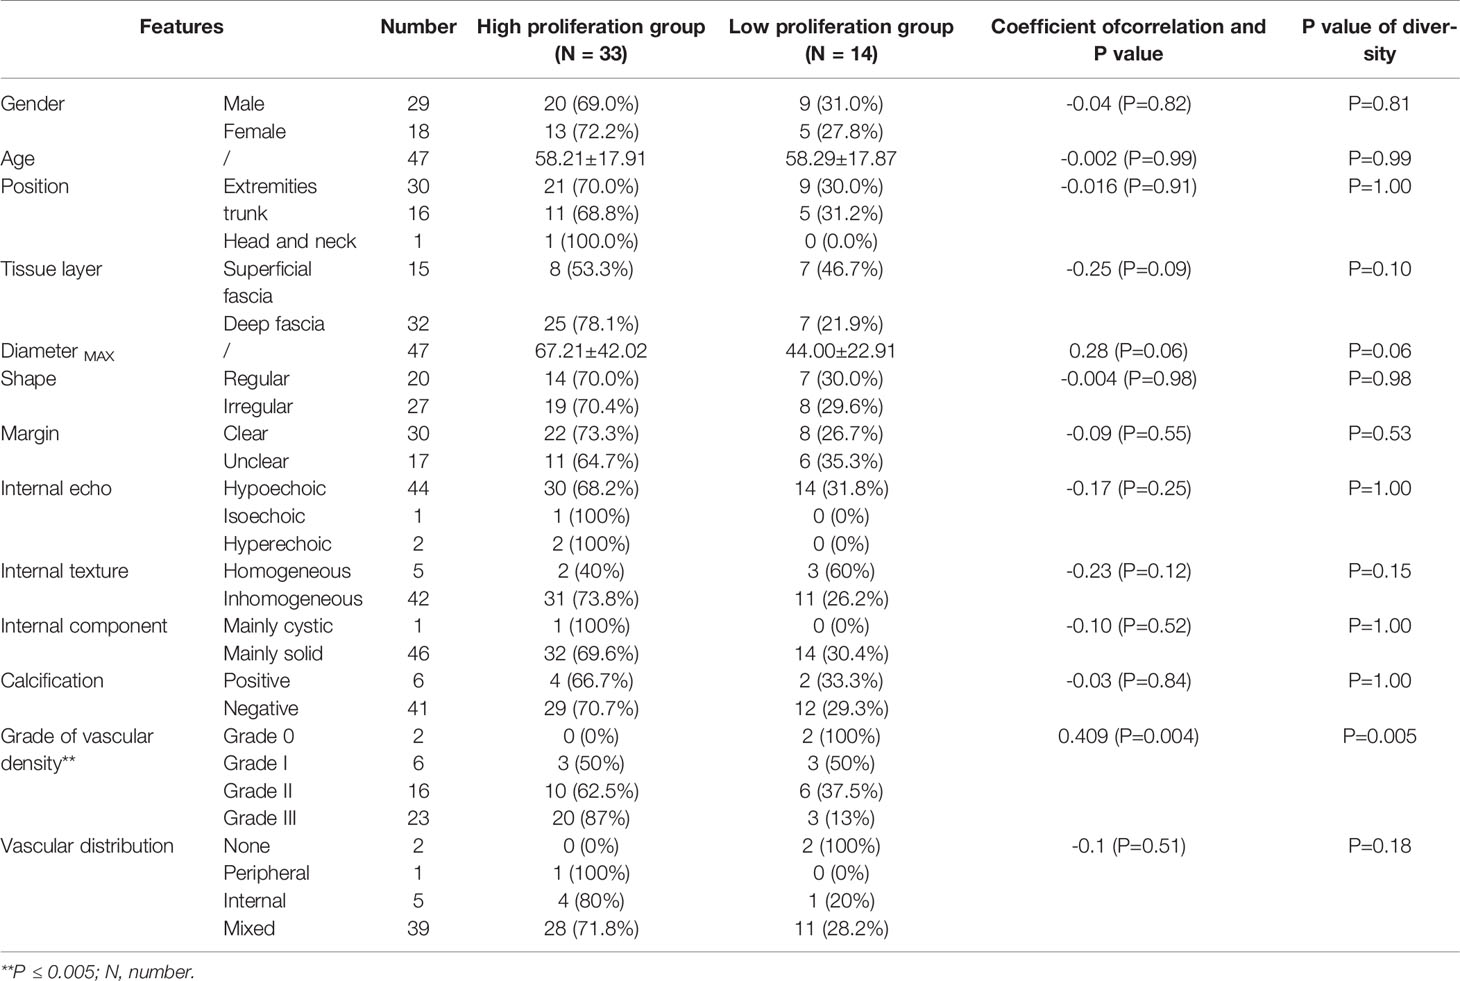
Table 2 Characteristics of soft tissue sarcomas.
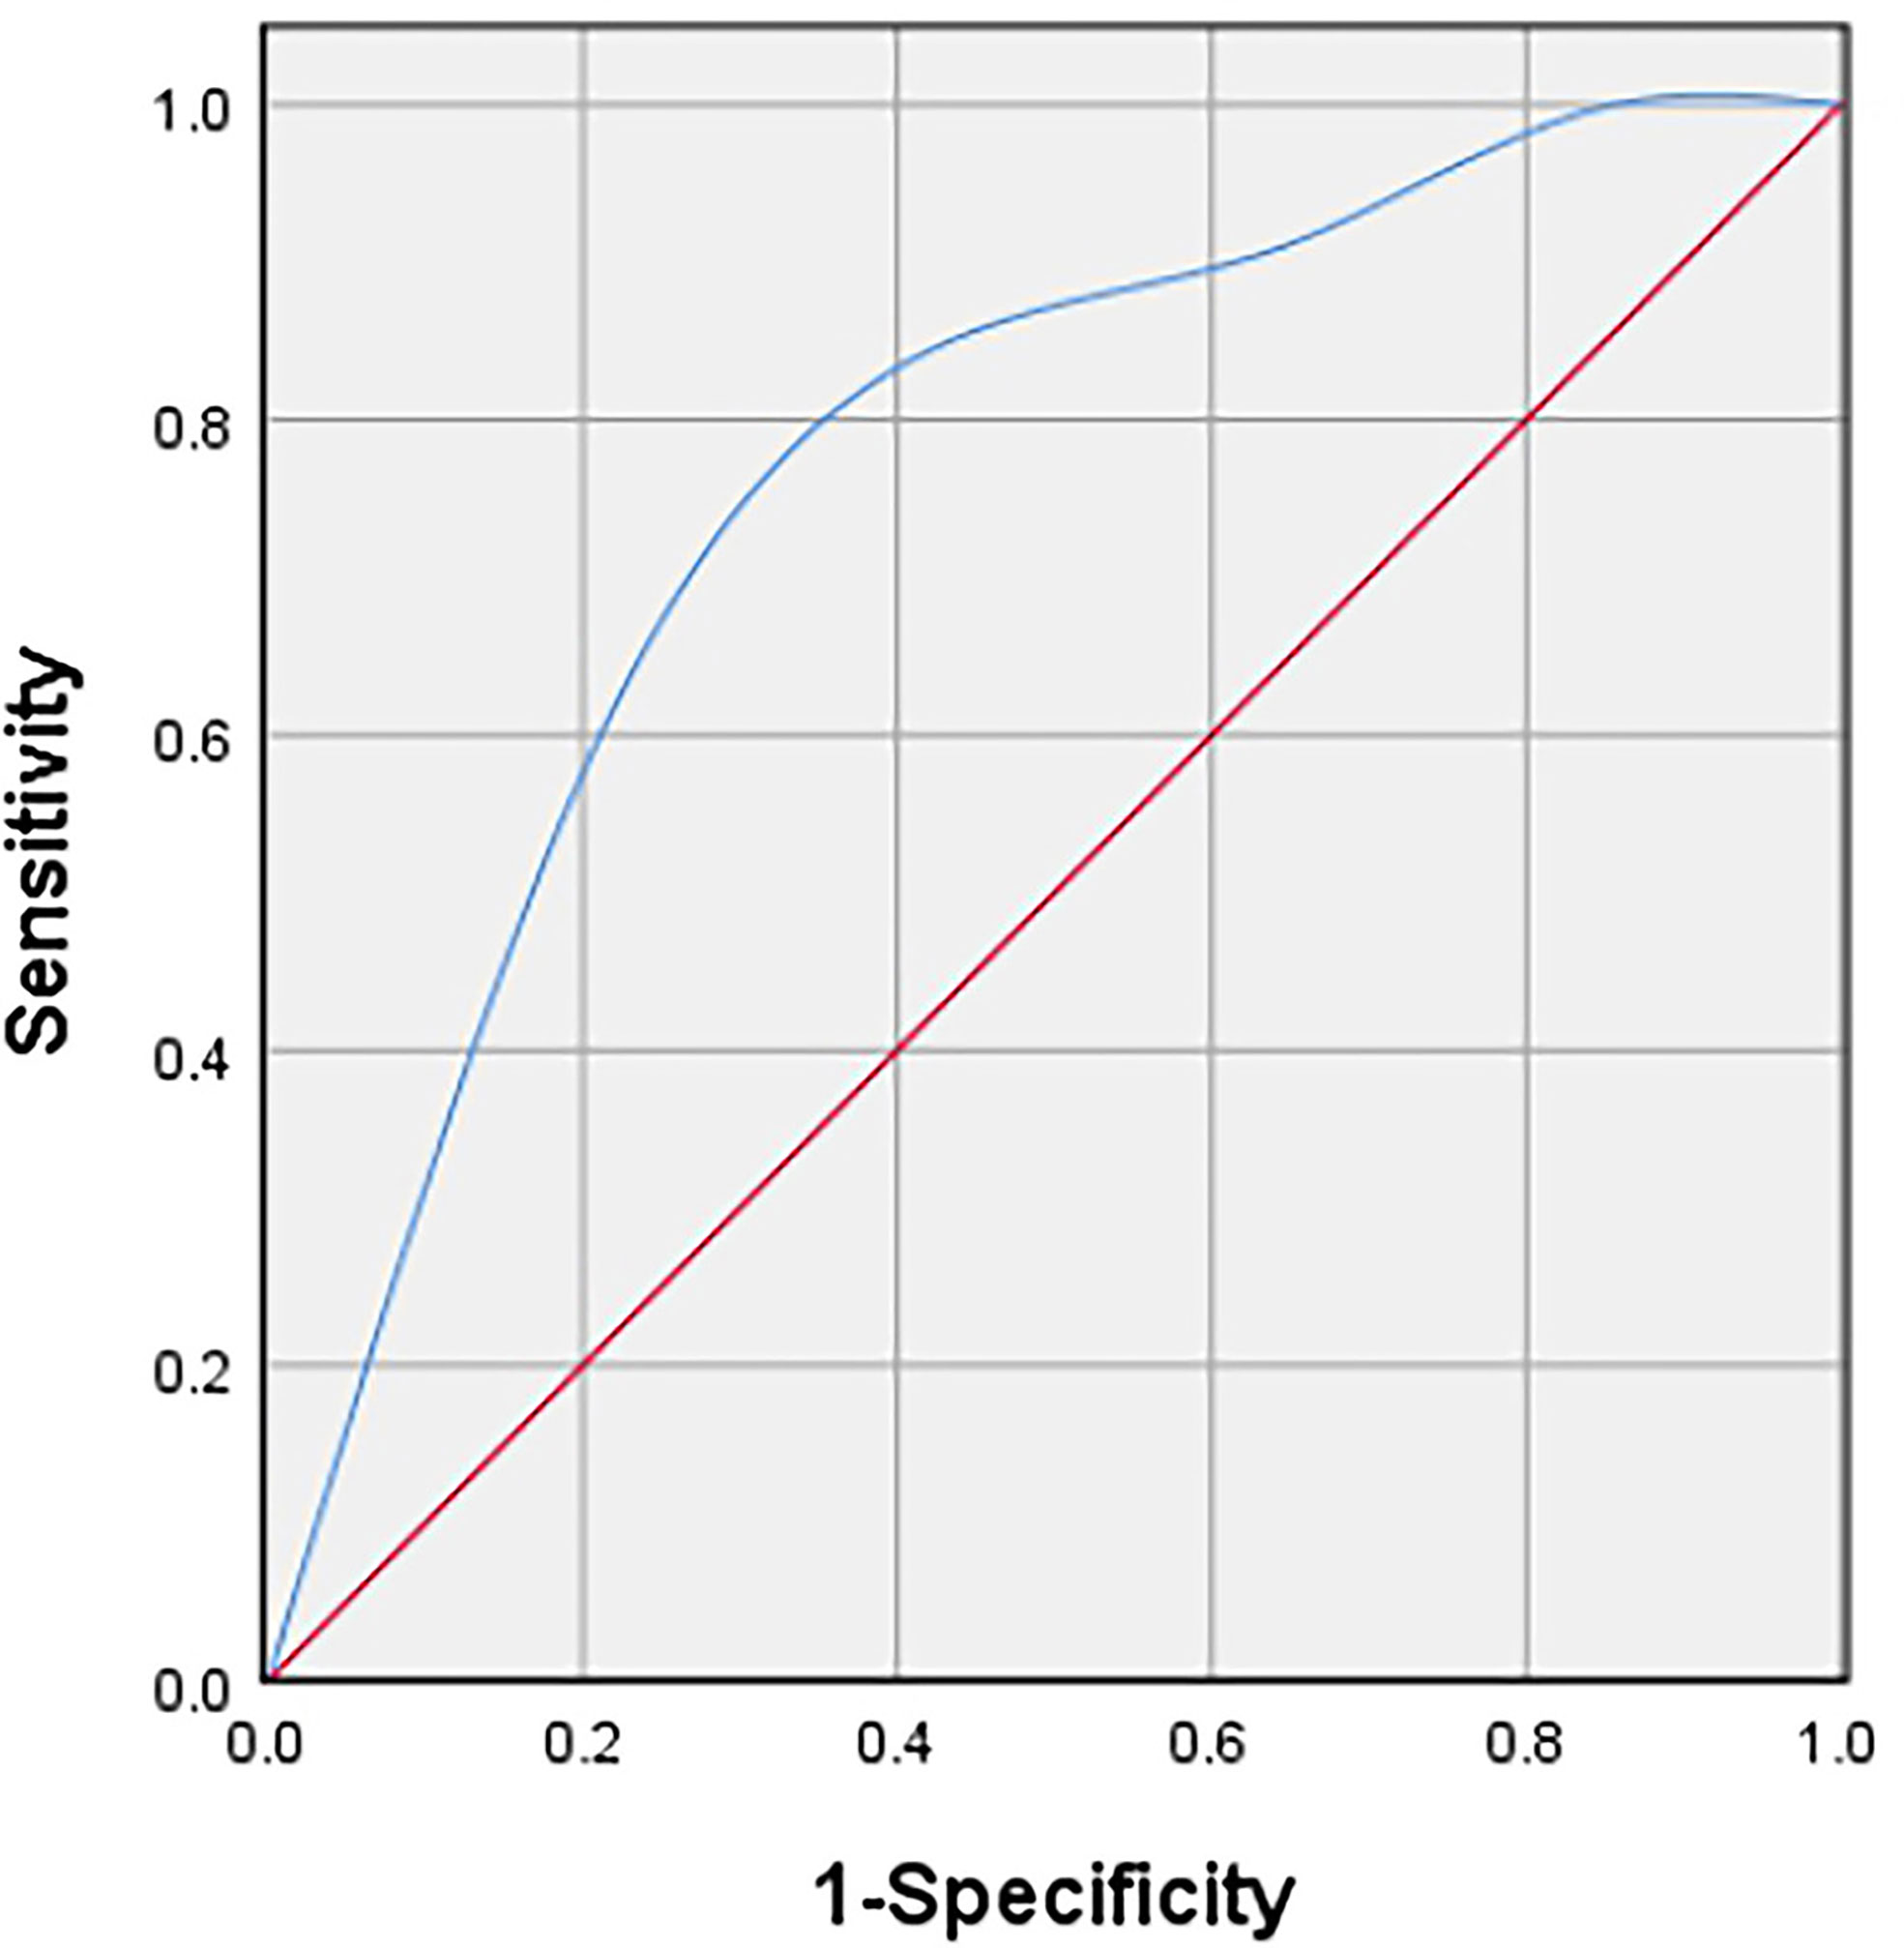
Figure 4 Receiver operating characteristic (ROC) curve to determine the cut-off value of the vascular density grade with Adler criteria in discriminating between high and low proliferation groups.
The ICC and kappa values showed excellent agreement between observers (Table 3).
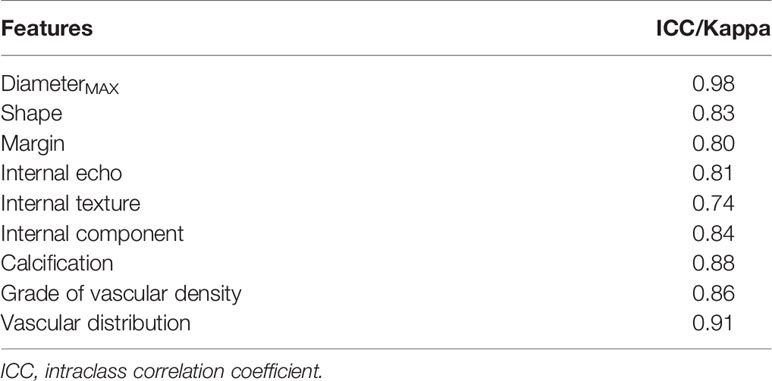
Table 3 Consistency of the observers with regard to US features of soft tissue sarcomas.
Discussion
At present, the correlation between the imaging manifestations of STS and its prognosis has gradually attracted attention and research, providing more auxiliary suggestions for clinical treatment. Our study is the first to explore the correlation between US features and Ki-67 LI of musculoskeletal soft tissue sarcoma. The final result illustrated that there was a positive correlation between the STS vascular density grade and Ki-67 LI (ρ = 0.409, P = 0.004). The sensitivity and specificity to distinguish between low-proliferation and high-proliferation groups were 60.6 and 78.6%, respectively. And the area under ROC curve was 0.74 (p = 0.011). This indicates that US is not only cheap, convenient, real-time and easy-to-follow up, but also has potential in predicting the cell proliferation of STS.
Higher Ki-67 LI means thriving proliferation ability of tumor cells, which can be manifested by the increase of cell number and cell volume. Simultaneously, too rapid tumor proliferation causes extensive pathological angiogenesis, which is essential and integral for the growth of solid tumors (such as STS). In this process, vascular endothelial growth factor (VEGF) can effectively induce the formation of messy and fragile blood vessels and provide nutrients and oxygen for tumor. Nakopoulou et al. (16) found that VEGF was positively correlated with Ki-67 expression in breast carcinomas. In this study, we found that when the Ki-67 LI of STS was high, the blood vessel density was relatively increased. This was consistent with other types of tumors, such as breast cancer and multiple myeloma (17–19).
In addition to blood flow density, the diameterMAX and tissue layer (depth) showed a correlation with Ki-67 (ρ = 0.28, 0.25), which was very close to statistical significance (P = 0.06, 0.09). These two features are universally considered to be related to the prognosis of STS. Deeply located and greater than 5 cm in size are the risk factors of STS metastasis (20, 21). However, Soffer et al. found that although the combination of Ki-67 and tumor size of rhabdomyosarcoma had an association with lymph node proliferation, Ki-67 LI was not directly interrelated to tumor size (22). This appeared to be in line with our results. But it might be due to the small sample size of our study.
What’s more, there was no correlation between the Ki-67 LI and the internal echo, internal structure, internal component, margin, shape, or blood flow distribution type of the mass in our study. However, the correlation between these US features and Ki-67 LI was found in breast cancer and glioma. In intraoperative ultrasonography (IOUS), Baskan et al. (23) found that the pathogenicity of the solid parts, margins, and contours of glioma were related to the level of Ki-67. Zhang et al. (24) discovered that breast cancer with heterogeneous internal echo had stronger proliferative ability and poor prognosis. Compared with other studies, in addition to the differences in tumor types, the constituent cells of different subtypes of STS are diverse. In addition, excessive neovascularization can increase the central pressure of the tumor, which may lead to internal necrosis and liquefaction (25). All of these result in the disorder of tumor internal structure and complex components. In particular, the internal structure and echo are greatly affected by the tissue composition and cell density.
Recently, Lee et al. (26) found that the average apparent diffusion coefficient (ADCmean) on MRI was negatively correlated with Ki-67 LI of STS. Furthermore, correlation between the standard uptake value (SUV) of PET and a combination of cellularity and Ki-67 LI was already described (27). However, these studies had similar low sensitivity and specificity to our study, which might also be related to intricate subtypes and biological behaviors of STS mentioned above. It was worth noting that even though the best “cut-off” for the vascular density grade was level II in our study, its sensitivity was low. Which signified that 39.4% of STS would still escape diagnosis under this criterion. It can be fatal for patients. Therefore, it is undeniable that the vascular density grade of STS in US can only be utilized as an auxiliary method for clinicians in the diagnosis and follow-up process.
This study has the following limitations. First of all, it was a retrospective study. Bias in US examination and feature extraction might be occurred as the US machines and examiners were different. Secondly, some STS lesions were large. Although we evaluated the lesions from as many images as possible, the stored ultrasound images were only a cross-sectional view and might not represent the whole. Moreover, some cases using core needle biopsy specimens to evaluate Ki-67 LI was another shortcoming of our study. In addition, the histological classification of STS was complicated in general, but the sample size of STS included in this study was small and the pathological type was limited, which might lead to selection bias. Finally, in this study, we only used the conventional US features. Other US technologies, such as contrast-enhanced ultrasound and elastography, would be further studied in the future.
In conclusion, our study exhibited that the US features of STS had no significant correlation with Ki-67 LI, except for the moderate positive correlation of vascular density. Although its sensitivity and specificity are not satisfactory, as a non-invasive imaging method, US may help differentiate between STS with low and high proliferation potential and further studies are needed.
Data Availability Statement
The raw data supporting the conclusions of this article will be made available by the authors, without undue reservation.
Ethics Statement
The studies involving human participants were reviewed and approved by the ethics committee of the First Affiliated Hospital of Nanjing Medical University. Written informed consent to participate in this study was provided by the participants’ legal guardian/next of kin.
Author Contributions
PW: Conceptualization, writing—original draft, software, and editing. HL: Writing—original draft, resources, and investigation. YH: Resources and investigation. XP: Resources and investigation. XY: Resources and investigation. DX: Conceptualization and project administration. AL: Data curation, conceptualization, and writing—review and editing. All authors contributed to the article and approved the submitted version.
Funding
This work was supported by the Jiangsu Province Key Research & Development Plan (No. BE2018703) and the National Natural Science Foundation of China (No. 81401427).
Conflict of Interest
The authors declare that the research was conducted in the absence of any commercial or financial relationships that could be construed as a potential conflict of interest.
Acknowledgments
We are extremely thankful to all the co-workers of our department.
References
1. Jo VY, Fletcher CD. WHO Classification of Soft Tissue Tumours: An Update Based on the 2013 (4th) Edition. Pathology (2014) 46(2):95–104. doi: 10.1097/PAT.0000000000000050
2. Tanaka K, Hasegawa T, Nojima T, Oda Y, Mizusawa J, Fukuda H, et al. Prospective Evaluation of Ki-67 System in Histological Grading of Soft Tissue Sarcomas in the Japan Clinical Oncology Group Study Jcog0304. World J Surg Oncol (2016) 14:110. doi: 10.1186/s12957-016-0869-6
3. Gerdes J, Schwab U, Lemke H, Stein H. Production of a Mouse Monoclonal Antibody Reactive With a Human Nuclear Antigen Associated With Cell Proliferation. Int J Cancer (1983) 31(1):13–20. doi: 10.1002/ijc.2910310104
4. Jain P, Doval DC, Batra U, Goyal P, Bothra SJ, Agarwal C, et al. Ki-67 Labeling Index as a Predictor of Response to Neoadjuvant Chemotherapy in Breast Cancer. Japan J Clin Oncol (2019) 49(4):329–38. doi: 10.1093/jjco/hyz012
5. Folescu R, Levai CM, Grigoraş ML, Arghirescu TS, Talpoş IC, Gîndac CM, et al. Expression and Significance of Ki-67 in Lung Cancer. Romanian J Morphol Embryol Rev Roumaine Morphol Embryol (2018) 59(1):227–33.
6. Yoshikawa K, Shimada M, Higashijima J, Nakao T, Nishi M, Takasu C, et al. Ki-67 and Survivin as Predictive Factors for Rectal Cancer Treated With Preoperative Chemoradiotherapy. Anticancer Res (2018) 38(3):1735–9. doi: 10.21873/anticanres.12409
7. Kontzoglou K, Palla V, Karaolanis G, Karaiskos I, Alexiou I, Pateras I, et al. Correlation Between Ki67 and Breast Cancer Prognosis. Oncology (2013) 84(4):219–25. doi: 10.1159/000346475
8. Hoos A, Stojadinovic A, Mastorides S, Urist MJ, Polsky D, Di Como CJ, et al. High Ki-67 Proliferative Index Predicts Disease Specific Survival in Patients With High-Risk Soft Tissue Sarcomas. Cancer (2001) 92(4):869–74. doi: 10.1002/1097-0142(20010815)92:4<869::AID-CNCR1395>3.0.CO;2-U
9. Li Y, Chen J, Weng S, Sun H, Yan C, Xu X, et al. Small Hepatocellular Carcinoma: Using MRI to Predict Histological Grade and Ki-67 Expression. Clin Radiol (2019) 74(8):653.e1–.e9. doi: 10.1016/j.crad.2019.05.009
10. Chen M, Li X, Wei Y, Qi L, Sun YS. Spectral CT Imaging Parameters and Ki-67 Labeling Index in Lung Adenocarcinoma. Chin J Cancer Res Chung-kuo Yen Cheng Yen Chiu (2020) 32(1):96–104. doi: 10.21147/j.issn.1000-9604.2020.01.11
11. Liu W, Cheng Y, Liu Z, Liu C, Cattell R, Xie X, et al. Preoperative Prediction of Ki-67 Status in Breast Cancer With Multiparametric MRI Using Transfer Learning. Acad Radiol (2020) 28(2):e44–53. doi: 10.1016/j.acra.2020.02.006
12. Taljanovic MS, Gimber LH, Klauser AS, Porrino JA, Chadaz TS, Omar IM. Ultrasound in the Evaluation of Musculoskeletal Soft-Tissue Masses. Semin Roentgenol (2017) 52(4):241–54. doi: 10.1053/j.ro.2017.08.002
13. Nagano S, Yahiro Y, Yokouchi M, Setoguchi T, Ishidou Y, Sasaki H, et al. Doppler Ultrasound for Diagnosis of Soft Tissue Sarcoma: Efficacy of Ultrasound-Based Screening Score. Radiol Oncol (2015) 49(2):135–40. doi: 10.1515/raon-2015-0011
14. Adler DD, Carson PL, Rubin JM, Quinn-Reid D. Doppler Ultrasound Color Flow Imaging in the Study of Breast Cancer: Preliminary Findings. Ultrasound Med Biol (1990) 16(6):553–9. doi: 10.1016/0301-5629(90)90020-D
15. Chhabra A, Ashikyan O, Slepicka C, Dettori N, Hwang H, Callan A, et al. Conventional MR and Diffusion-Weighted Imaging of Musculoskeletal Soft Tissue Malignancy: Correlation With Histologic Grading. Eur Radiol (2019) 29(8):4485–94. doi: 10.1007/s00330-018-5845-9
16. Nakopoulou L, Stefanaki K, Panayotopoulou E, Giannopoulou I, Athanassiadou P, Gakiopoulou-Givalou H, et al. Expression of the Vascular Endothelial Growth Factor Receptor-2/Flk-1 in Breast Carcinomas: Correlation With Proliferation. Hum Pathol (2002) 33(9):863–70. doi: 10.1053/hupa.2002.126879
17. Wang XY, Zhang B, He Y, Ning B, Nong MF, Wei HM, et al. Relation Between Qualitative and Quantitative 3-Dimensional Ultrasound and Ki-67 Expression in Breast Cancer. Int J Clin Exp Med (2015) 8(10):18538–42.
18. Himani B, Meera S, Abhimanyu S, Usha R. Ki-67 Immunostaining and its Correlation With Microvessel Density in Patients With Mutiple Myeloma. Asian Pacific J Cancer Prev APJCP (2016) 17(5):2559–64.
19. Krüger K, Stefansson IM, Collett K, Arnes JB, Aas T, Akslen LA. Microvessel Proliferation by Co-Expression of Endothelial Nestin and Ki-67 is Associated With a Basal-Like Phenotype and Aggressive Features in Breast Cancer. Breast (Edinburgh Scotland) (2013) 22(3):282–8. doi: 10.1016/j.breast.2012.07.008
20. van Vliet M, Kliffen M, Krestin GP, van Dijke CF. Soft Tissue Sarcomas at a Glance: Clinical, Histological, and MR Imaging Features of Malignant Extremity Soft Tissue Tumors. Eur Radiol (2009) 19(6):1499–511. doi: 10.1007/s00330-008-1292-3
21. Grimer RJ. Size Matters for Sarcomas! Ann R Coll Surg Engl (2006) 88(6):519–24. doi: 10.1308/003588406X130651
22. Soffer S, Amitai MM, Shimon O, Ohana O, Rozendorn N, Barshack I, et al. Rhabdomyosarcoma Disease Spread Evaluation on CT Scans: Association With Primary Tumor Size and Ki-67 Proliferation Marker. Clin Imaging (2019) 56:41–6. doi: 10.1016/j.clinimag.2019.02.009
23. Baskan O, Silav G, Sari R, Canoz O, Elmaci I. Relationship of Intraoperative Ultrasound Characteristics With Pathological Grades and Ki-67 Proliferation Index in Intracranial Gliomas. J Med Ultrasonics (2001) (2015) 42(2):231–7. doi: 10.1007/s10396-014-0593-1
24. Zhang H, Sui X, Zhou S, Hu L, Huang X. Correlation of Conventional Ultrasound Characteristics of Breast Tumors With Axillary Lymph Node Metastasis and Ki-67 Expression in Patients With Breast Cancer. J Ultrasound Med (2019) 38(7):1833–40. doi: 10.1002/jum.14879
25. Gruber L, Loizides A, Luger AK, Glodny B, Moser P, Henninger B, et al. Soft-Tissue Tumor Contrast Enhancement Patterns: Diagnostic Value and Comparison Between Ultrasound and MRI. AJR Am J Roentgenol (2017) 208(2):393–401. doi: 10.2214/AJR.16.16859
26. Lee JH, Yoon YC, Seo SW, Choi YL, Kim HS. Soft Tissue Sarcoma: DWI and DCE-MRI Parameters Correlate With Ki-67 Labeling Index. Eur Radiol (2020) 30(2):914–24. doi: 10.1007/s00330-019-06445-9
Keywords: ultrasonography, Ki-67, soft tissue sarcoma, musculoskeletal, immunohistochemistry
Citation: Wang P, Li H, Hu Y, Peng X, Ye X, Xu D and Li A (2021) Relationship Between Ultrasound Features and Ki-67 Labeling Index of Soft Tissue Sarcoma. Front. Oncol. 11:687878. doi: 10.3389/fonc.2021.687878
Received: 30 March 2021; Accepted: 07 June 2021;
Published: 28 June 2021.
Edited by:
Youyong Kong, Southeast University, ChinaReviewed by:
Smita Manchanda, All India Institute of Medical Sciences, IndiaZhichao Li, Chongqing West District Hospital, China
Copyright © 2021 Wang, Li, Hu, Peng, Ye, Xu and Li. This is an open-access article distributed under the terms of the Creative Commons Attribution License (CC BY). The use, distribution or reproduction in other forums is permitted, provided the original author(s) and the copyright owner(s) are credited and that the original publication in this journal is cited, in accordance with accepted academic practice. No use, distribution or reproduction is permitted which does not comply with these terms.
*Correspondence: Di Xu, xudi@njmu.edu.cn; Ao Li, liaonj@njmu.edu.cn