Balancing predictability and flexibility through operation volume-constrained visual flight rule operations in low altitude airspaces
 Adriana Andreeva-Mori
- Aviation Integration Innovation Hub, Aviation Technology Directorate, Japan Aerospace Exploration Agency, Tokyo, Japan
The advancement in uncrewed aircraft systems such as small drones and advanced air mobility vehicles such as Electric Vertical Take Off and Landing aircraft (eVTOL) has called for airspace integration at low altitudes of both traditional aircraft, such as helicopters and new entrants, such as drones and eVTOL. Currently, the trajectories and necessary buffers around them of flights operating under visual flight rules are not possible to predict. This research proposes the use of flight mission characteristics to model the trajectory and evaluates temporal, lateral and vertical deviations to define the safety buffers which can be used to generate operation volumes, geo-fencing such low-altitude flights and separating them from other traffic in a safe and efficient manner. Real flight test data obtained for the purposes of this study and pilots’ interviews assure high fidelity and practicability of the proposal.
1 Introduction
At present, there exist only two types of flight rules: visual flight rules (VFR) and instrument flight rules (IFR). VFR operations are based on the “see and avoid” principle-separation is responsibility of the pilot, who relies on the view outside the cockpit, and any information which might be available from air traffic control (ATC) through radio. The latter is not a requirement in all airspaces, however, and VFR operations can happen in uncontrolled airspace where aircraft may not be visible to ATC at all. For terminal operations two-way communication with ATC is required regardless of the type of operation, however. VFR weather minimums depend on the airspace and type of day/night (FAA, 2024b), and may vary from country to country, but minimum visibility and clearance from clouds are part of the operation conditions. VFR operations, however, provide a lot of flexibility to the pilot. Depending on the airspace the flight is operating in (FAA, 2024a), the pilot is required to file a flight plan prior to departure. There are many regional differences, however. Within the continental U.S., a VFR flight plan is not normally required, but in Japan all flights which are expected to fly longer than 9 km are required to submit a flight plan to the local air navigation service provider (ANSP) (Toratani and Hirabayashi, 2023). Even when not required, filing a flight plan is strongly recommended as indicated by FAA. The flight plan does not contain detailed spatial and temporal information on the trajectory, however. The take-off and flight times, for example, are generally used in case of distress only and do not provide a reliable estimate for ATC planning. That is why VFR usually applies to less congested airspaces, low altitudes and small aircraft.
IFR operations, on the other hand, are possible in most weather conditions, as there are usually less regulations on minimum visibility. However, to be able to perform such operations, aircraft must be equipped with instruments and navigation devices to allow the pilot to fly even in the lack of visual cues. Most importantly, separation is ATC’s responsibility, which in turn means that pilots have a lot less flexibility than in VFR operations. IFR operations require very detailed flight plan submission, which allows for strategic planning as well. In other words, IFR operations are very structured, both spatially and temporally. This allows operations of more aircraft in the same airspace, which makes IFR suited for congested airspaces such as airport proximity.
Until recently, VFR operations were sufficient for low altitude airspaces (up to 3,000 ft AGL approximately). The advancement in uncrewed aircraft systems such as small drones and advanced air mobility vehicles such as Electric Vertical Take Off and Landing aircraft (eVTOL) has called for airspace integration, however. This raises the questions whether operations combining to a certain extent the flexibility of VFR and predictability of IFR are possible. Due to the existing trade-off between these two properties, some constraints to the VFR operations need to be placed to increase both spatial and temporal predictability. The authors propose using mission type information as a key feature of the flight. Most IFR operations are point-to-point transport of goods or cargo, such as the scheduled airline passenger or cargo flights. VFR operations, on the other hand, are much more diverse-point-to-point movement, reconnaissance along landmarks such as highroads and rivers, search and rescue, patrol, telecasting of sport events, etc. Note that this research focuses on disaster reconnaissance, i.e., the assessment of damages and evacuee location in the immediate aftermath of a disaster, and does not consider reconnaissance in the sense of military information gathering.
Interviews with pilots and past flight data analysis have shown that each operation’s trajectory can be described by a number of parameters which characterize the type of manual control done by the pilot in each particular mission type. In their past work the authors have focused on disaster reconnaissance missions as a representative of VFR operations and concluded that the trajectory can be predicted based on the landmark which the pilot tracks during the reconnaissance, the target speed and altitude, as well as the view angle, which is dependent on the pilot, but within a certain predictable range (Andreeva-Mori et al., 2022). The trajectory predicted based on these features was verified in flight test using Japan Aerospace Exploration Agency’s experimental helicopter. Here, we propose designing operation volumes, i.e., geofencing the VFR operation similar to a small uncrewed aircraft system operation in UTM, so that the pilot can complete their mission while staying within such volumes. The volumes are designed prior to departure based on the predicted trajectory, landmark characteristics (a curvier landmark is associated with more lateral deviations than a straight line, for example,), terrain (mountainous areas need larger buffers due to the variations in above ground altitude AGL in respect to the GPS altitude, for example), and potential changes in the target altitudes (obstacles or visibility might require lower/higher altitudes altered in flight and thus differing from the originally-planned ones). The authors develop a situation-awareness tool to help the pilot stay within the assigned volume. The tool issues alerts when the pilot differs from the predicted position, and this work considers deviations in the temporal, vertical and lateral components.
Flight test results indicate that operation volume-constrained VFR operations, called briefly constrained VFR operations below, can be completed with no significant increase on the pilot’s workload. In fact, pilots reported that the increased level of confidence that no other aircraft is in the assigned volume assures higher safety and can be welcomed in busy airspaces.
The above results allow the author to propose changes to the information currently submitted in the VFR flight plans to ATC to make them applicable to constrained VFR operations. Such constrained VFR operations can provide the flexibility of conventional VFR operations but allow strategic planning thus contributing to the safe and efficient integration of crewed and uncrewed vehicles in low altitude airspace. Therefore, the goal of the current research is to utilize mission type characteristics in modeling VFR trajectories and evaluate the necessary temporal, lateral and vertical deviations present in operations, which can be used in generating operation volumes to segregate the low-altitude VFR flights from other airspace users in a safe and efficient manner.
The rest of the paper is organized as follows: early research and relevant work is presented in Section 2. The flight tests, where all the data was obtained are described next, and results are discussed in Section 3. Requirements for the operation volume design are established in Section 4. Discussions on potential implementation challenges are provided in Section 5. The paper finishes with concluding remarks in Section 6.
2 Related works and preliminary analysis
Current regulations do not require pilots to submit detailed flight plans when they operate under VFR. In particular, the spatial component of VFR trajectories is very difficult to predict. The main reason is the variety of missions type which are flown under VFR, especially in low altitude airspace under 3,000 ft by rotor aircraft. Unlike IFR missions which are often transport of goods and passengers between two points, helicopter missions include reconnaissance, arial imaging, firefighting, medical evacuation, crop spraying, media coverage and a wide variety of public good missions (Entzinger and Kubo, 2023). General aviation flights are mainly leisure flights with complex trajectories characterized by low predictability and traceability. Therefore, VFR operations have been treated as open-loop ones. Recently, event detection (Olive et al., 2020) in VFR operations and trajectory prediction (Le Tallec, 2014; Bulusu et al., 2023) have been attempted based on historical big data analysis. The authors recognized that general aviation flights can be challenging to predict both spatially and temporally, but early discussions as part of the disaster response aircraft operation research conducted at the authors’ research institution indicated that low-altitude flights with specific missions can be modeled based on the mission type. In disaster response, reconnaissance missions precede search and rescue and are therefore of the utmost importance for the overall response efficiency. This led the authors to start their work with reconnaissance missions. Pilot interviews indicated that they often fly along a landmark tracking it while confirming the state of damages and looking for evacuees. Early tests indicated that the pilots maintained a somewhat constant view of the landmark which the authors described by a constant view angle (Andreeva-Mori et al., 2021a). Interviews with pilots revealed that whenever possible, they maintain constant altitude above ground to enable a stable flight for the disaster crew at the back of the aircraft (Andreeva-Mori et al., 2023a). The trajectory model was then improved by implementing the speed constraints (Yoshida et al., 2022). These works verified that the reconnaissance trajectory along a landmark such as highway, river or railroad can be modeled as a collection of line segments and arcs based on the target altitude AGL, view angle of 37°, target ground speed of 65 kt with deceleration at turns. These previous works paved the way to the current work, which aims to provide insights into the lateral, vertical and temporal deviations from the predicted trajectory and the necessary buffers which need to be implemented in operation volume design in order to segregate such VFR operations in a safe and efficient manner from other low-altitude airspace users. The authors collect data over two flight tests conducted in Jan/Feb 2022 and August 2022, and verify the conformance to an operation volume real-time using onboard mission support technology. The next section will provide the details of these flight tests and discuss obtained results.
To design a volume which is large enough to account for uncertainties but small enough to maximize the airspace usage without hindering the execution of the missions, analysis of the temporal and spatial dimensions in essential. The following methodology is adopted in the current research. First, trajectories generated according to the model discussed in the author’s past research are used to predict the position of the helicopter while it executes the disaster reconnaissance mission. The lateral portion of the trajectory is used to design an operation volume with a buffer of 300 m or 500 m where the missions is expected to be contained. Next, a deviation alert is developed based on the original pre-flight predicted position and the actual one. The predicted trajectories, operation volumes and alert functionalities are implemented in a portable situation awareness mission support tool which can be taken onboard a helicopter. Two series of flight tests are conducted to verify the effectiveness of the alerts and collect real life data. The data is then analyzed, and pilots’ feedback is obtained on the potential challenges and advantages of the proposed volume-constrained VFR operations. This work builds up on previous research by using conducting actual flight tests and using real flight data to evaluate the safety buffers needed for efficient operation volume design, as well as by establishing the current challenges and directions for further research to enable real-world implementations.
3 Flight tests
3.1 Test goals
Flight tests over two time periods were conducted to collect data, verify the assumptions related to flight trajectory predictions and obtain pilots’ feedback on situation awareness support technology functionalities and practicality of constrained VFR operations.
3.2 Test period and aircraft type
To verify the conformance to the operation volume, deviation alert and trajectory correction capabilities, two flight tests were conducted. The first one consisted of 9 flights conducted between January 24 and 16 February 2022, and the second consisted of 4 flights conducted between August 22 and 24 August 2022. Each flight was conducted on a separate day, and lasted for about 2 h. Both flight tests used JAXA’s research helicopter BK117C-2 (JAXA, 2020). The BK 117C-2 is a medium-sized multipurpose twin-engine helicopter, with applications raging from firefighting, disaster relief, emergency medical services, cargo and personnel transport, to law enforcement and broadcasting (Kawasaki Heavy Industries, 2017). Since this type of aircraft are often used for disaster response, the choice of JAXA’s research helicopter to conduct flight tests mimicking disaster reconnaissance missions is well justified.
3.3 Flight areas and test setup
3.3.1 Flight test areas
The helicopter took off and landed at Chofu Aerodrome, a local aerodrome servicing small aircraft in western Tokyo. Fuel constraints limited the flight time to about 2 h. The reconnaissance missions were not conducted over densely populated areas to allow for more flexibility in altitude setting and minimize the noise disturbance for the general population on the ground. The reconnaissance missions were conducted in non-controlled airspace. The transfer from Chofu Aerodrome to each of the test areas took between 15 and 20 min, which left 70–90 min for reconnaissance-modeled flight testing. The missions modeled for the flight tests required reference landmarks. Both flight tests were conducted in the same set of areas and followed the same set of landmarks. Three areas were visited-area A, a mountainous area in the vicinity of Mount Fuji was chosen due to its complicated topology and various elevation even within a small area. The landmark there was a highway. The flight segment was projected to take 11 min. The second area B was chosen in another mountainous area, the Boso Peninsula, just east of Tokyo across Tokyo Bay. Unlike the Mount Fuji area, however, the elevation fluctuations are less pronounced there. The landmark in area B was also a highway, but this segment was about twice as long as the one in area A. Area C was chosen in the Miura Peninsula, and is characterized by multiple landmarks - highway, river and a coastal line. A single flight over this set of landmarks was projected to last about 11 min. The same segments were flown multiple times on the same day, but the test conditions differed among the flights.
3.3.2 Deviation algorithms
Two types of alerts were tested during the flights. The corresponding support technology was developed for each one and pilots’ feedback was obtained after each test. The alert which mimicked early UTM (FAA, 2020) non-conformance alerts was issued when the aircraft left their prescribed volume. This was explored in our earlier research as well (Andreeva-Mori et al., 2021b). In such a case, a 4-dimensional operation volume defined by lateral, vertical and time components is set around each projected flight segment. This is illustrated in the left panel of Figure 1. Assume a reconnaissance mission along the landmark shown in grey. Since the pilot flies tracking the landmark while looking at it through their right windshield, the vehicle is on the left when flying northwards. Assume a volume is defined by the lateral geography shown in amber. For simplicity, here the vertical profile is not discussed. The volume is described by a temporal component as well, defined by tbegin and tend. As long as the helicopter is within the volume both spatially and temporally, the operation is conforming. For example, assuming times ti, tj and tk are all between tbegin and tend, and the positions of the vehicle are as shown in Figure 1 left, non-conformance occurs only at tj because the helicopter is outside the operation volume geography. Therefore, if an alert were to be issued, this would happen at tj because the helicopter is outside its assigned operation volume. The temporal conformance is controlled by the entry and exit times, and so overall a 4-dimensional conformance is tracked. Alternatively, the predicted trajectory can be used to issue deviation alerts, as shown in the right panel of Figure 1. Previous research has indicated that the take-off time and thus the start time for each flight segment are the most difficult to predict accurately and involve many uncertainties. In order to isolate this effect, deviations from the trajectory are considered relative to the segment tbegin, the flight is considered to start when the position coincides with the predicted starting position for the segment. The predicted positions at times ti, tj and tk are shown in blue. At ti and tk the actual positions and predicted positions are within the pre-defined margin, so no alert is issued. At tj the helicopter is further than the predicted position by a distance exceeding the allowed threshold, so a non-conformance alert is issued. Note that the distance from the actual position to the predicted trajectory is not calculated as the closest distance to the predicted trajectory, so accuracy in the temporal dimension is very important. The test in Jan/Feb 2022 tested this second 4D deviation alert, while the test in August 2022 tested the volume non-conformance alert.
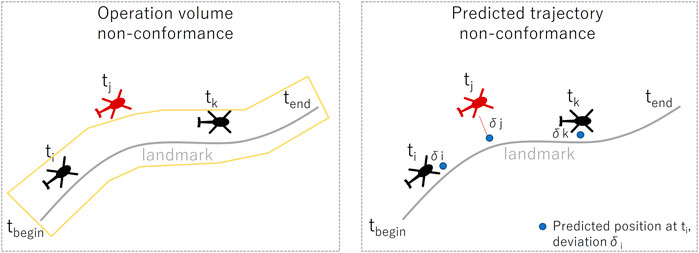
FIGURE 1. Two types of deviation alert algorithm concepts.
3.3.3 Onboard situation awareness support tool
The equipment available in the cockpit provides no immediate information on the relative position of the aircraft to either the landmark or the predicted trajectory. VFR pilots are required to carry a certified, updated and accurate VFR paper chart onboard and be able to find their own aircraft position on it (SKYbrary, 2023). Like most small aircraft pilots, the flight tests conducted as part of the current research used paper charts, as they are certified and reliable in the case of any technical glitches. Detecting the aircraft’s position on a paper chart might increase the pilot’s workload and has limited accuracy, as the pilot overlays the position information available from the onboard equipment on the map while relying on the visual cues as well. Recent technology advances offer the possibility of GPS navigation-based equipment integrated in the aircraft, but such functionalities are expensive and not standard for disaster response aircraft yet. Combining the advantages of GPS integrated system and the flexibility of paper charts are the portable software implemented on portable devices. Such applications vary in functionality scope, but the one used in our flight tests was D-PAS, originally developed as part of JAXA’s D-NET research (Andreeva-Mori et al., 2021c; Okuno et al., 2016). D-PAS is a fully portable system consisting of three main components: a satellite transmission component, a digital antenna, and a touch-screen display (see the left panel of Figure 2). Since the system is fully-portable, it can be carried onboard right before the mission-the antenna can be attached to the windshield by suction cups and removed after flight. The antenna is connected to the satellite-transmission device, which is in turn connected to the display equipment. The system has a build-in map and combined with the GPS data obtained real-time, position awareness can be achieved easily. The telemetry data is transmitted to the ground via an iridium-satellite connection, so the progress of the flight can be tracked from researchers on the ground as well. The touch-screen display allows the crew to not only confirm the position of other D-PAS equipped aircraft in real time, but also to input data, such as disaster type or evacuee information, and send it to the ground support system. The interface has been developed considering pilot, doctor, and fire department personnel’s feedback to assure usability and high efficiency. Sharing data other than telemetry is one of the main differences between D-PAS and ADS-B, for example,. Several flight-specific additions to the original display functionalities which focused on airspace information such as control zone, aircraft premises (airport, heliport,…) and map information, were made. Each flight is divided into multiple segments. The predicted trajectory discretized over several seconds is shown (see the pink dots in Figure 2). Based on pilots’ feedback after the Jan/Feb 2022 flight test, an arrow was added for the August 2022 flight test to indicate the direction of the flight. The associated operation volume for each segment is shown in purple. The volume was added after the Jan/Feb 2022 flight test. All of the predicted trajectory and volume data is imported into D-PAS prior to take-off. Note that the trajectory is 4 dimensional and is described by latitude, longitude, altitude and time of each point. The actual current position of the aircraft is shown by the red arrow. Past research has indicated that some of the largest uncertainties come from the take-off times, and thus start times of each flight segment. To minimize the effect of such departure time prediction uncertainties on the current flight test, each flight segment is initialized by the “Begin” button, which changes to an “End” button once pressed. Once the segment is over, the “Next” button allows the operator to move to the next one. Expected time begin and time end are there only for reference. A unique capability developed for this research is the deviation alert based on the current and predicted positions. When the difference between the predicted and current 4D positions exceeds a certain buffer limit, an alert is issued and shown in the upper right corner. The alert shown the current deviation from the predicted waypoint, for example, 0.4 nm. This alert functionality was only tested in the Jan/Feb 2022 flight test. It was active in the August 2022 flight test as well, but was there only for reference and the alerts were visible only to the researcher, and not conveyed to the pilot. In this second flight test, the volume was used to provide alerts, but this functionality was not yet implemented in D-PAS, so the researcher was looking at the screen and providing aural advisories when the aircraft left the volume. Using different deviation algorithms as discussed in the previous subsection allowed to obtain pilots’ feedback on the most efficient alert method calculation.
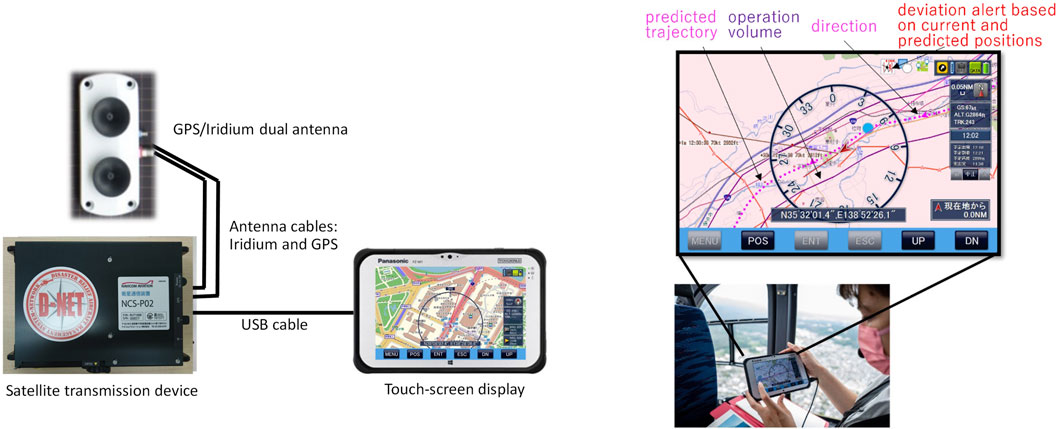
FIGURE 2. D-PAS display with operation volume and predicted trajectory. Right panel reprinted with permission from Andreeva-Mori et al. (2023b).
The constructed volumes displayed on D-PAS differed in size, with the volume of area A being the tightest (300 m buffer on the left and right of the predicted trajectory). The other areas had volumes with a buffer limit of 500 m. All reconnaissance mission segments were flown manually. The pilot was given target above ground altitude, 1,000 ft in most cases, but with some variations for some of the August 2022 tests. The predicted trajectories and operation volumes were constructed based on 1,000 ft AGL data only. The change of altitude was introduced to test the robustness of the volume and alert functionalities only. Considering a view angle of 37 deg and target altitude 1,000 ft AGL, the lateral distance of the predicted trajectory to the landmark is 404 m. When the altitude changes to 1,500 ft, this distance increases to 606 m, or a difference of 202 m exists (see Table 1), which is still within the 300 m buffer had there been no deviations due to the manual flight control. When the attitude is increased to 1800 ft, however, the nominal distance to the landmark increases by 323 m, which exceeds the operation volume buffer limit of 300 m.
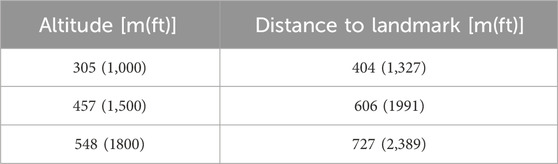
TABLE 1. Distances for each reference altitude assuming view angle of 37°.
3.4 Flight preparation
The predicted trajectories along each segment and the corresponding lateral volumes for the August 2022 test were imported into D-PAS on the morning of each day prior to departure. During the briefing, the pilots used D-PAS to familiarize themselves with the characteristics of each mission, projected trajectories and operation volumes. Besides, pilots were given a booklet containing information on each flight segment, including the coordinates of the start and end point of the segment, target landmark, target speed and altitude. A map of the area with the predicted trajectory and volume plotted on it was provided for each segment. Note that the changes in the target altitude were not included in the briefing to simulate real world uncertainty conditions, i.e., prior to the flight pilots were unaware that they would be requested to adjust their altitude for some of the segments. During the flight, the booklet was used by the co-pilot to provide situational awareness and advisories to the pilot in control.
In both flight tests, two series of experiments were conducted: in the first series the researchers could see the position of the aircraft in respect to the predicted trajectory and any alerts issued by D-PAS (Jan/Feb 2022) and operation volume (August 2022), but gave no advisories to the pilots even if the flight was non-conforming. In the second series, the researchers provided oral advisories when the helicopter left the volume. The way these advisories were given was agreed during briefing. In the first flight test, the researcher informed the pilot of the magnitude of the deviation and based on D-PAS display advised them whether the deviation mostly temporal (e.g., the pilot was flying too fast/slow), lateral or vertical. In the second test, both pilots proposed issuing advisories in respect to the landmark instead of using east/west/north/south directions. A sample advisory was “move (closer to)/(further from) the landmark”. The second test did not consider any temporal deviations.
3.5 Pilot and researcher task distribution
Two pilots participated in each flight test. Pilot A was the pilot-in-command (PIC) and pilot-flying (PF) on most occasions in the first flight test and the PF on all flights in the second flight test. Pilot B was acting as co-pilot in most flights in the Jan/Feb test and was the pilot not-flying (PNF), but was the PF on one of the test days. Pilot C was co-pilot and PNF on all days in the August flight test. Apart from the pilots, 1 to 4 researchers were onboard to track the flight test progress, monitor the trajectory and volume conformance on the mission support tool D-PAS and provide oral advisories to the pilot based on the alerts.
Pilot A is a veteran with more than 3,500 h of total flight time in disaster response and flight testing. Both pilots B and C have multiple years of flying missions in disaster response as well. Throughout the flight test, the pilot in control (sitting in the right seat) was given oral advisories and assistance on landmarks and general situational awareness by the pilot in the left seat. This operation style mimicked real disaster response operations.
Each flight segment was initialized manually by the researcher using the “Start” button. The co-pilot counted-down as the aircraft approached the start point of the segment, and the researcher used the co-pilot’s instructions only.
3.6 Flight conditions
The visibility on all flight days allowed for flights under VFR. The cloud level was consistent throughout the flight tests. Wind data could not be recorded automatically, so the researchers onboard asked the co-pilot to provide periodically the wind speed and direction. These were recorded and available for post-event analysis. It was confirmed that no extreme wind cases were included in the data set. The wind varied in both direction and magnitude reaching up to 20 kt especially in Area A, which is the mountainous area in the vicinity of Mount Fuji, however, but these fluctuations were present on all test days. The current analysis is based on positioning data only, but detailed wind data calculated based on positioning data and airspeed available as part of the GPS data recorded on D-PAS is to be presented as part of a follow-up publication.
3.7 Flight test summary
An overview of the three test areas, predicted trajectories and operation volumes is shown in Figure 3. Note that the start point of all segments was the northernmost point of each segment and the aircraft was flying south following the landmark situated on the west of the predicted trajectory. In area C, the target landmark changes from highway to a river about half way (see the 90 deg right turn midway), and then on to the coastal line.
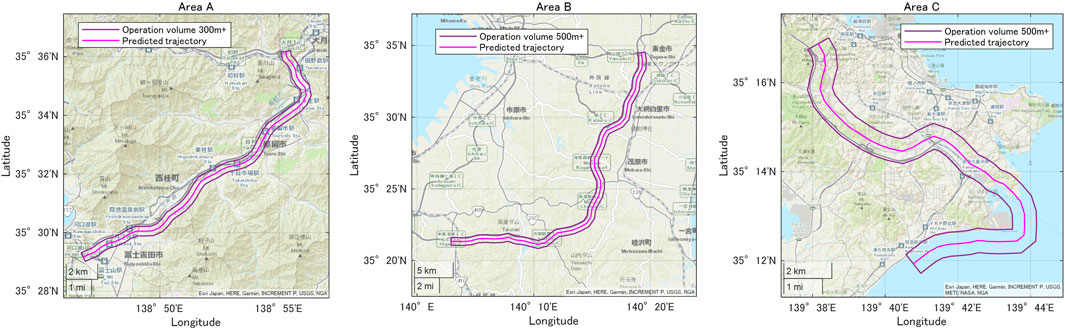
FIGURE 3. Flight test area overview of Area A (left), Area B (center) and Area C (right).
3.8 Data acquisition and processing
Flight data were available from the aircraft measurement system and D-PAS for post-event analysis. The positioning data used in the current study was the avionics data recorded by the aircraft measurement system. The data consisted of latitude, longitude, and altitude references in the World Geodetic System (WGS84), available every 0.02 s. The analysis presented uses the data recorded every second only, without applying any filters, and corrects for the geoid height. Detailed elevation data is obtained (Geospatial Information Authority of Japan, 2024) for the test area and together with the GPS data recorded by the helicopter’s data recording system, is used to calculate the altitude AGL.
4 Results and analysis
The operation volumes are defined in each of the lateral, vertical and temporal dimension. The spatial component of the volume is a 3-dimensional shape, i.e., a polyhedron, which encompasses the predicted trajectory. In the simplest version of the vertical dimension definition, each volume is described by a minimum and maximum altitude. When the elevation of the flight area is stable, this is a practical approach. To optimize the airspace usage, however, setting minimum and maximum altitude at each waypoint (vertex) is more efficient and can accommodate more airspace users simultaneously. Therefore, the current analysis considers the elevation when analysing the vertical component of the volume.
4.1 Key findings
Analyses in each of the temporal, lateral and vertical dimensions are performed. A summary of the key findings is provided before each detailed discussion in the subsequent subsections.
Key finding 1 (temporal): Pilots tend to complete the flight segment earlier when no advisories are issued to increase the efficiency of the information gathering.
Key finding 2 (temporal): The temporal volume component should be set based on the time predicted by the trajectory model. Pilots can comply with time constraints when provided with temporal advisories in the form of deviation alerts without any significant increase in their workload as long as a small buffer corresponding to flight time for speed deviations of 5 kt is allowed.
Key finding 3 (temporal): Higher altitudes lead to faster flights, so an increase in the temporal buffer when such altitude alterations are likely is recommended.
Key finding 4 (lateral): A volume constructed around a trajectory modeled based on a view angle of 37 deg and deviation alerts issued upon the helicopter leaving the assigned volume can assure a safe flight without obstructing the disaster reconnaissance mission. The volume buffer limit should be large enough to cover both unintentional and intentional trajectory deviations. Using the current trajectory model and flight test results, a value of 300 m is recommended. More detailed trajectory modeling can benefit congested airspaces.
Key finding 5 (lateral): The perceived view angle varies among pilots and depends on the height and posture of the pilot. Calibration in the beginning of the flight is possible using the advisory provided by the situation-awareness support tool, however.
Key finding 6 (lateral): Unexpected traffic in non-segregated airspaces can require the pilot to leave the assigned volume. Pilots’ feedback suggests that reserved volumes such as the ones proposed in the current research can help avoid such interferences with other traffic, reduce the workload in the cockpit and contribute to flight’s safety.
Key finding 7 (vertical): A vertical buffer limit of 100 ft is sufficient for flat areas, but under the current trajectory model of a constant target altitude AGL regardless of the topology, does not cover the deviations for areas with significant elevation fluctuations.
Key finding 8 (vertical): The vertical dimension has the lowest predictability and poses the most significant challenges in airspace integration.
4.2 Operation volume temporal component
In the UTM concept (FAA, 2020), each volume is described by a start and end time, so temporal compliance is important when airspace integration is considered. As discussed in the author’s past work (Andreeva-Mori et al., 2023a), take-off times lead to the largest uncertainties in the temporal mission planning. Even as part of flight tests, the take-off times varied by more than 15 min from the planned one. The actual take-off time in disaster operations is even more difficult to predict, as the aircraft would take off as soon as the mission is assigned, and necessary preparations are completed. On the other hand, once the aircraft is aloft, flight times tend to be more predictable. Therefore, in the current research, the flight times in each time segment only are analyzed.
Most data is available for Area A, so this segment is predominantly used for the current analysis. The reference ground speed for the reconnaissance mission is 65 kt with deceleration at turns. The total predicted flight time for the segment is 11:07 min. This segment was flown 24 times during flight test 1 (Jan/Feb 2022) and flight test 2 (August 2022) combined. Note that time advisories were provided only during flights 13–18. As seen from Figure 4, during the first flight test (Jan/Feb 2022), when no detailed deviation advisories based on D-PAS alerts were issued, both pilots A and B completed the mission earlier than planned (blue and red markers). When advisories were available, the temporal predictability increased (black markers in Figure 4), and the pilots completed the mission with less than 1 min of deviation in all cases. In the second flight test conducted in August 2022, however, Pilot A maintained temporal conformance even without any advisories when the flight altitude was the same as the one used in planning the trajectory. The flight times were shorter when the pilot flew at higher altitudes, raising from 1,000 ft to 1,500 ft AGL.
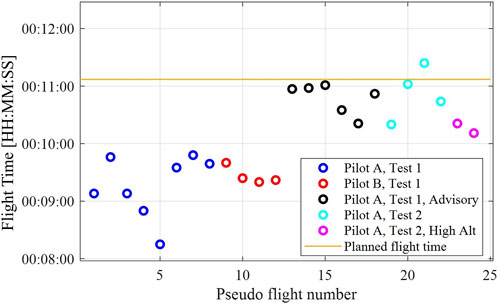
FIGURE 4. Actual and predicted flight times for Area A.
In flight test 1, the pilots seemed to fly at a slightly higher speed than the one originally planned throughout the entire segment when no advisories were given. This is seen in the deviations shown in Figure 5. The horizontal axis shows the planned time, and the vertical one the temporal deviation. Negative values mean faster flight (early arrival). In general, there were no significant differences between the control of Pilot A (blue) and Pilot B (red). Limited number of test days did not allow for Pilot B tests with advisory, but their comments in the debriefing after the flight indicated that managing the time will not be an issue if advisories are available, so data similar to the one of Pilot A with advisory is expected. During the final debriefing after flight test 1, the preliminary flight data was available for discussions and the researchers noted that the pilots were flying faster than the planned ground speed of 65 s. This information, combined with the experience of pilot A flying over the same landmark is considered to have contributed to better temporal conformance during flight test 2 even when no advisories were provided. When the target altitude is changed, however, the pilots tended to fly faster (pink in both Figure 4; Figure 5). Interviews with the pilots revealed this may be due to the way they perceive the landmark when the altitude is higher, and their field of vision expands. Data showed that faster flights are more common than slower ones. Pilots commented that in actual operations there is usually no lower bound temporal constraint, and completing the mission earlier than expected saves fuel, flight time, and results in delivering valuable reconnaissance information to the relevant parties sooner. Therefore, pilots have not experienced the necessity to delay the execution of the mission for trajectory conformance reasons. Airspace reservation and high-density operations, however, might require this in the future. Providing temporal advisories in the form of deviation alerts during flight test 1 demonstrated that maintaining temporal conformance is possible and pilots reported no significant increase in their workload when no strict adherence to fly-over time over a certain waypoint was required. Note, however, that earlier tests revealed increased workload potentially obstructing the reconnaissance mission when the pilot was required to enter and leave the segment at a specified time (Andreeva-Mori et al., 2023a). Discussions with pilots indicated that a buffer corresponding to speed differences of 5 knots will be sufficient to account for uncertainties without increasing the pressure and pilot’s workload. The asymmetry in the temporal deviations imply that the temporal buffer should be bigger on the negative side, allowing for early mission completion.
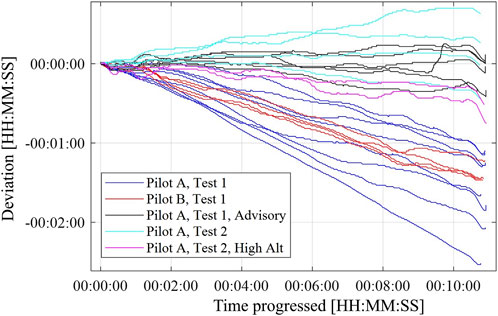
FIGURE 5. Time deviations.
Since pilots recommended a temporal buffer based on a speed buffer, it was assumed that longer flight segments would result in larger time deviations. This was not entirely supported by the data from the second flight test, however. Even for two out of the four tests (light blue in Figure 5), the temporal deviations did not increase over time, which means that the deviation was not necessarily proportional to the segment’s length. This is seen from the overall time deviations for all test areas in the second flight test data (August 2022), summarized in Table 2. Note that the numbers in brackets for the flights in Area A correspond to the numbers used in the analysis so far. For this analysis, flight times were calculated based on the time when the aircraft left and exited the operation volume. This caused an apparent increase in the time in one of the flights in Area B, as the aircraft took a premature early turn before completely exiting the volume which added additional 12 s in this volume. The time deviations for the segment in area B, however, which was almost twice the length of the one in Area A, however, were not any larger than those for Area A. Similar to the case for Area A, since this data was obtained in flight test 2 and after flying in Area A, this might be due to the pilot’s experience with the 65 kt ground speed and the area.

TABLE 2. Flight time deviation in Flight Test two
Note however, that regardless of the area, higher altitudes lead to faster flights. Such dependence of the time deviations on altitude changes requires an increased temporal buffer when such altitude alterations are likely. The main reasons for such changes are either other traffic in the airspace using the same or near altitude, or connectivity/broadcasting issues, common for media helicopters who relay real-time images, for example, and might need to increase altitude for more stable connections.
Therefore, the temporal volume component should be set based on the time predicted by the trajectory model and a buffer, dependent on the length of the segment (±5 kt), and the projected traffic density and mission type, which contribute to the negative value. Note that the buffer is not symmetrical and should be larger in the negative direction, allowing for early finish of the mission.
4.3 Operation volume lateral component
The lateral component of the volume is determined based on the predicted trajectory and the buffer necessary to encompass navigation and flight control uncertainties. Therefore, this section analyzes lateral deviations based on the actual flight data, focusing primarily on Area A.
The segment in Area A was flown 24 times altogether during the tests in Jan/Feb and August 2022. The trajectory profiles are shown in Figure 6. The same color coding as the one used in Figure 4 is applied. The predicted trajectory is shown by the dotted ochre line. The segment started near Tanokura station in the upper right of the figure, and ended near Kawaguchiko Station in the lower left corner. Overall, Pilot A’s flights were all clustered together when the target altitude was the same as the planned one, i.e., 1,000 ft AGL. During the first test, even when deviation advisories were provided to the pilot, there was no significant difference among the trajectories as these deviations occurred due to the speed being higher than planned, and the helicopter was flying along the planned track, so no lateral deviations were observed. There was no notable difference among the days either, and trajectories in both Jan/Feb and Aug had similar lateral profiles. This verified the robustness of the trajectory prediction model and the major assumption that the pilot controls the flight by maintaining a constant view angle of 37 deg. Note that the pilot was not requested to calibrate their view angle at the start of the flight-they were flying so that the landmark was easily trackable and were considering the task of the disaster response crew which were to be at the back of the helicopter inspecting for damages and evacuees had this been an actual mission. Flight test results reveal dependence on the pilot, however. Compared to Pilot A, Pilot B flew closer to the landmark, i.e., their view angle was not 37 deg, but somewhat larger. To investigate this in more detail, the actual view angles calculated based on the actual AGL and lateral coordinates are calculated. Assuming Pilot B’s target altitude was the same as that of Pilot A, their view angle was about 40 deg. Discussions with the pilots after the end of the first flight test in Jan/Feb revealed that these perceived view angle differences are due to the pilot’s position in the seat of the helicopter. Therefore, depending on the height and posture of the pilot, the view angle becomes steeper or shallower as the pilot uses the same part of the lower right windshield for situation awareness and calibration of their position in respect to the landmark. The deviations for flights 1–8 (Pilot A, no advisories) and flights 9–12 (Pilot B, no advisories) from the first flight data set obtained during the Jan/Feb tests are shown in the boxplots in Figure 7. Negative values indicate that the actual flight track was closer to the landmark than the predicted trajectory. The median values are 61 m and −141 m for Pilot A and B, respectively, so on average Pilot B flew 200 m closer to the landmark than Pilot A. The 25th and 75th percentile for both pilots are [19, 99] for Pilot A and [-173, −94] for Pilot B, so apart from the differences in the offset values, the variations are almost identical. Pilot B commented that had they been provided with advisories to adjust their initial view angle to match the predicted trajectory, they would have maintained this new angle.

FIGURE 6. Lateral trajectory profiles for the flights in Area A.
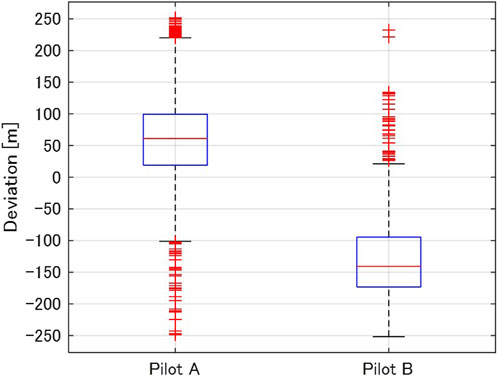
FIGURE 7. Lateral deviations for Pilot A (flights 1–8) and Pilot B (9–12).
The largest lateral deviation happened during one of Pilot A’s flights. Since the flight test area was not exclusively reserved for JAXA’s flight, other traffic approached head-on slightly on the right of the test helicopter, so to avoid the danger of collision, the pilot increased the separation by deviating to the left of the original track. They returned on track in less than 30 s. Pilots commented, however, that reserved volumes such as the ones proposed later in this paper can help avoid such interferences with other traffic, reduce the workload in the cockpit and contribute to flight’s safety.
The flight data obtained in first flight test in Jan/Feb 2022 was used to determine the lateral volume size set for the second flight test in August 2022. Even when the data of both pilots is combined, only a total of 18 flight segment data was available. To overcome the issues arising from such a small dataset, Gaussian process regression (GPR) is applied. GRP is known to work well on small datasets and can provide uncertainty measurements on the predictions, so it is suitable to identify the buffer necessary in lateral volume design (GPR Tutorial, 2023). The Gaussian process regression (GPR) model was trained using the flight data from the flight test in Jan/Feb 2022. The confidence interval was set at 95%. The GPR was modeled using MATLAB’s Statistics and Machine Learning Toolbox (MATLAB, 2024). The GPR model was fitted using the matern kernel with parameter 3/2 and a separate length scale per predictor with default kernel parameters, and used the subset of regressors method for parameter estimation and fully independent conditional method for prediction.
When both pilots’ data is considered, the confidence interval encompassed deviations between −220 and 290 m (see Figure 8). For Pilot A, the interval is between −150 and 249, and for pilot B- between −279 and 150 m. Note, however, than less data is available for Pilot B, so the interval might expand with further tests. The main difference in the obtained GPR predictions and confidence interval come from the different offset (view angle) for both pilots. Pilot B flew with a shortcut at the turns in the first 2 min (up to pseudo position 120) of the flight, and this is seen by both the lateral trajectory profile and the deviations. Pilot A tracked the landmark more precisely. From a reconnaissance mission perspective, however, the control of Pilot B is not necessarily any worse than Pilot A. Therefore, such behavior should be accounted for by the buffer used to construct the operation volume. Another characteristic in both pilots’ control is the increased deviation around pseudo position 200, when the pilots flew more outwards than the predicted trajectory. This happened in a series of turn when the pilots did not track the landmark strictly, but opted to maintain a more stable heading instead. To increase the accuracy of the predicted trajectory and reduce the necessary operation volume in dense operations, considerations of the landmark’s curvature should be made.
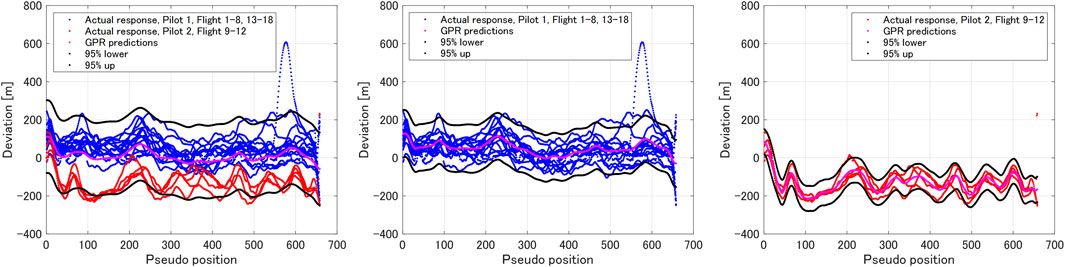
FIGURE 8. GPR predictions.
Based on these results, the lateral buffer limit for the operation volume in Area A in the second flight test conducted in August 2022 was set to 300 m. For Areas B and C, the buffer limit was set at 500 m. Note that turns and constraints on the number of vertices defining the volumes to be imported in D-PAS resulted in some parts of the volume being slightly larger than the buffer limit set. The lateral trajectory profiles, their corresponding altitudes and deviations are shown in Figure 9. Flights 19–22 were flown at the same target altitude as the planned one, so their deviations were not only within the 300 m volume buffer limit, but fit well with the confidence interval determined by the GPR predictions which used the data from the first flight test in Jan/Feb 2022. To test the pilot’s response to non-conforming alerts and confirm the appropriateness of the 300 m lateral buffer limit setting, during the flight on 23 Aug 2022. In the second flight on this day (flight #23), the target AGL was set at 1,500 ft, and in the last flight (#24) the target altitude was even higher, set at 1800 ft. As the altitude increased, the trajectories moved further from the landmark, a feature discussed in our previous work as well, and reflects the somewhat constant view angle maintained by the pilot. As seen from the upper right panel of the figure, during flight #23 around pseudo position #200, the deviation exceeded the 300 m buffer limit defining the operation volume, but since the aircraft went within the volume almost momentarily, no alert was issued to the pilot. For flight #24, right after the start of the segment flight, the research indicated that the pilot should move closer to the landmark. The pilot then confirmed conformance and the researcher continued tracking it throughout the rest of the flight. Details of the verbal communication between the researcher and the pilot are shown n the lower right panel of Figure 9. In this case, the mission could be performed after the flight trajectory correction, so the advisory helped the pilot adhere to the volume without obstructing the reconnaissance.
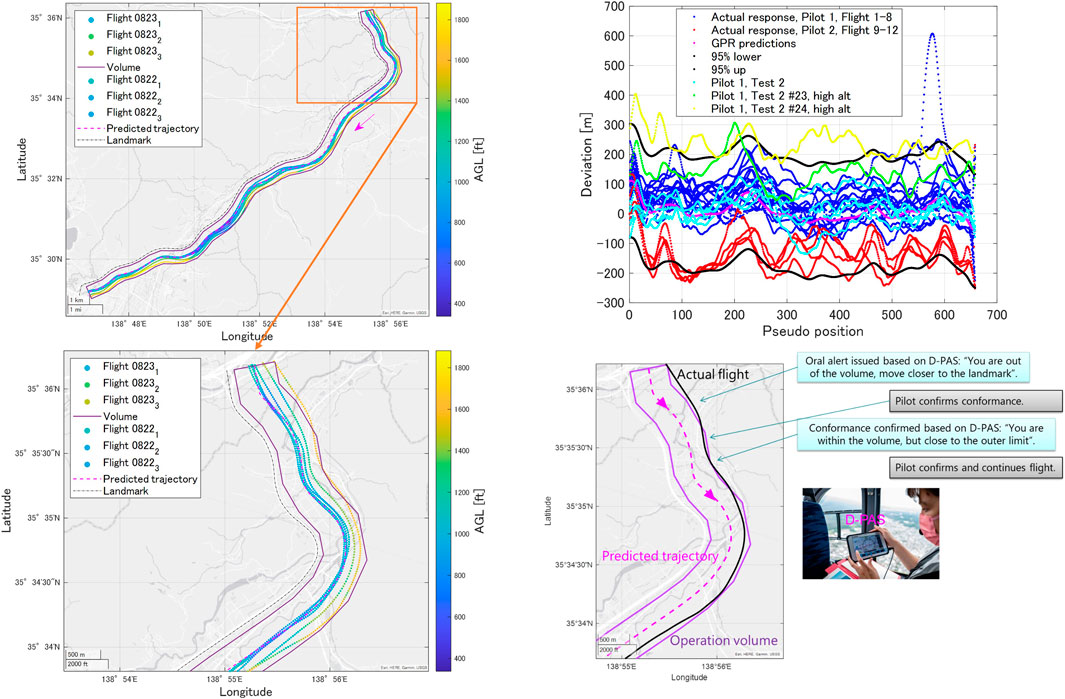
FIGURE 9. Flight test 2 Area A results. Upper left and lower right panel reprinted with permission from Andreeva-Mori et al. (2023b).
The main disadvantage of issuing the alert after the aircraft has left the operation volume is that in high-density airspaces this might increase the risk of collision with other traffic. Several approaches have been considered to overcome this issue. Similar to many detect and avoid concepts, a multi-layered volume is an option. For example, consider an inner volume at 250 m and an outer one at 300 m. An alert can be issued when the aircraft leaves the inner volume so that the pilot can correct their trajectory before they leave the outer one. This can cause many false alerts, however, when the pilot flies closer to the threshold but parallel to the volume’s boundaries. Discussions with the pilots lead the authors to start the development of an alert based on near-term position prediction using real-time telemetry data and the a-priori data of the predicted trajectory. There results will be presented in a follow-up publication.
Apart from the altitude increase cases, the lateral deviations presented above can be treated as unintentional, i.e., the pilot did not know in advance how their control will influence the conformance of the flight. The flight tests, however, indicates that there are multiple cases when the pilot intentionally diverted from the predicted trajectory to be able to complete their reconnaissance mission in a safer and more efficient manner. Two such examples were observed during the flights in Area C. Note that the volume in Area C was constructed with a 500 m buffer limit.
Even when the target altitude was higher that the one used to design the predicted trajectory, the pilot moved closer to the landmark during all five flights, as seen in the left panel of Figure 10. Prior to deviating from the nominal trajectory, however, the pilot announced his intentions and shared situational awareness with the co-pilot and the researchers onboard. A hill was obstructing the view of the landmark, and since the mission was simulating reconnaissance, not having a clear view of the landmark was not acceptable. Therefore, the pilot had to alter their trajectory to avoid the visual obstacle. Such topology characteristics must be taken into account by either adjusting the predicted trajectory or expanding the operation volume in the vicinity of a visual obstruction, for example,.
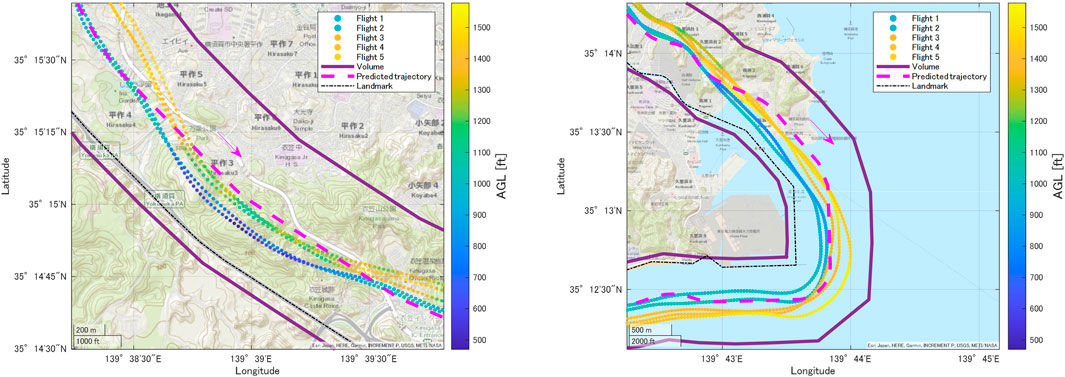
FIGURE 10. Intentional deviation examples. Reprinted with permission from Andreeva-Mori et al. (2023b).
The second example of considerable lateral deviation was observed when the pilot made a right turn to continue their reconnaissance mission along the coastline, as seen in the right panel of Figure 10. The trajectory was generated to follow the coast, but the pilot chose to maintain constant heading as this would provide the shortest most efficient and safe path towards the next reconnaissance target. For a volume buffer limit of 500 m the deviations did not lead to any violations, but for smaller values non-conformances might occur, so transitions between landmarks might be better modeled by point-to-point movement, for example,. This work considers operation volumes defined by lateral polygons and minimum and maximum altitudes, and not cylinders constructed around the predicted trajectory. Other 3D shapes are a subject of future work.
4.4 Operation volume vertical component
Past research, pilot interviews and initial data analysis indicated that the pilot try to maintain a stable altitude above ground to provide smooth and efficient flights, as well as optimize the conditions for the disaster crew at the back of the helicopter who perform the reconnaissance mission either relying on their naked eye or any imaging tools. As discussed in the author’s early work (Andreeva-Mori et al., 2023a), for flat areas a buffer limit of 100 ft below and above the reference altitude seemed to be sufficient to account for uncertainties. Very often, however, disaster operations happen in hilly areas where the topology is very diverse. That is why Area A was chosen as a representative of a mountainous area with severe topology fluctuations. Note that the volume used to issue alerts considered only lateral deviations, so during the flight test altitude data was collected but not used to provide any real-time situation awareness. For all areas, flights at the target altitude of 1,000 ft were conducted. Note that the GPS altitude was available only after the flight test and the pilots in the cockpit had only access to barometric pressure altimeter data and the radio altimeter. Most small uncrewed aircraft systems (drones), however, rely on GPS altitude only. The lack of common reference is a known issue raised by many researchers (Nunes, 2023; ICARUS Integrated Common Altitude Reference system for U–space, 2022), with several potential solutions being proposed as part of the ICARUS project. The current research does not investigate in detail the instrument measurement errors, and focuses only on pilot control and fluctuations in the GPS altitude compared to the predicted altitude, which is considered equivalent to the elevation plus the target AGL. Sample results are shown in Figure 11. Note that the vertical axes have different scales. For all areas, the elevation changes much more severely (al higher frequencies) than the actual GPS altitude. For the segment in Area A, the elevation increased gradually as the aircraft proceeded. Besides, there were three “bumps”, i.e., hills along the way, where the pilot chose to follow the GPS altitude rather than constant AGL, and deviations reached 500 ft. In area B the elevation increased gradually as well, but the “bumps” were less clearly expressed, apart from a spike around 12:16 where the deviation reached 200 ft. In Area C, the largest deviation was around 11:51 and equaled 460 ft. Note that along the coast the elevation is 0 ft, but the GPS altitude fluctuated between 930 and 1,030, which can be treated as instrument error as well. Such 100 ft buffer limit is in agreement with the results from the initial study, were deviations were within 100 ft of the target altitude. High-frequency deviations such as the ones in Area B can be treated as noise and thus the buffer should be set large enough to al least account for such uncertainties. The spikes observed in Areas A and C could be avoided by improved trajectory prediction. The current model is very simplistic-it adds the target AGL to the elevation at the given point. Pilots reported, however, that they do not necessarily track strictly every hill along the track, and this can be modeled by applying a low pass filter to the predicted altitudes.
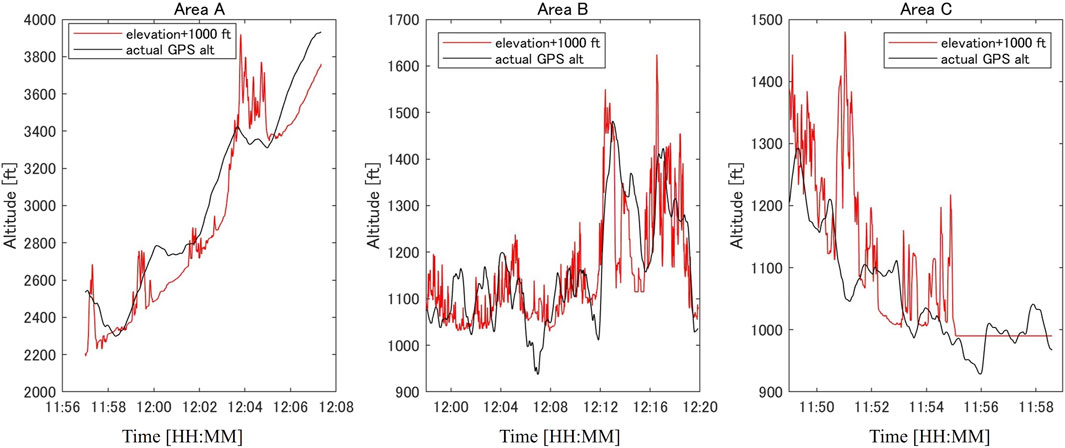
FIGURE 11. Sample predicted and actual altitude profiles for the Areas A (left), B (center), and C (right).
The results revealed that setting small buffers in the vertical plane is not feasible under the current trajectory models and instrument environment. Since a lot of the crewed and uncrewed vehicle separation is going to happen in the vertical plane at first, with small drones flying at lower altitudes, such vertical trajectory characteristics are very important for safe and efficient volume design. Even in areas with small elevation fluctuations, the vertical volume needs to be at least 200 ft below and above the target altitude, when it is defined as elevation + constant AGL. Results from the current research indicate that the vertical dimension has the lowest predictability and poses the most significant challenges in airspace integration.
5 Discussions on potential implementation challenges
Volume-constrained VFR operations require trajectory predictions and adequately designed volumes. Using the mission information can help trajectory modeling, but some VFR operations may not have specific routes or areas. The authors believe that introducing airspaces where, by default, VFR operations are volume-constrained, can be a potential solution. Should other users be willing to enter such airspaces, they must make sure they do not enter any of the already assigned volumes of other aircraft. This information can be made available through a dedicated platform or portal, for example. Users with predetermined plans have priority usage of the airspace, so the proposed concept provides incentives for VFR pilots to share their intentions. Note that some areas and airspaces might not require such structures approach, for example, airspaces with sparse flight density, for instance, where the main users are general aviation pilots.
Another potential challenge in the volume design lies in the trajectory model, which requires input data not necessarily available on published charts. Currently, to model a disaster reconnaissance mission trajectory, the research uses the landmark’s coordinates obtained manually from publicly available maps and/or databases (for example, the highroad database in Japan). These need to be integrated if the same technology is to be used in real operations. Combining human-machine interface technologies such as converting routes described by tracing a landmark on a touchscreen to specific coordinates based on map data can help overcome this challenge.
The proposed volume-constrained operations might require changes to the training and certification as well. Current training and certification for VFR operations do not cover instrument-related skills. The disaster response onboard mission support technology D-NET, which D-PAS is part of, has already been implemented on all fire service helicopters in Japan, and although it does not include any volume information, it has been demonstrated that flight crew can operate the technology and benefit from it after initial training had been completed. It should be noted that disaster response pilots undergo training and licensing very different from that of general aviation pilots, for example, so the proposed volume-constrained operations can first be implemented in disaster response, where data and lessons-learned to aid further certification and licensing standards can be gathered.
6 Concluding Remarks
This research conducted temporal, lateral and vertical deviation analysis of trajectories of helicopter operations flown under VFR to identify parameters necessary for the operation volume design. Trajectory predictions are important for the basic volume design, but the deviation determine the necessary buffers, which in turn define the size and thus maximum airspace capacity for multiple vehicle operations. The flight tests verified that the temporal aspect of the operation volume can be relatively easily predicted and any large deviations can be corrected through 4D alerts. In reconnaissance missions pilots often do not have a lower temporal constraint and tend to complete the mission earlier when possible, so the temporal buffers should be large enough to account for such behavior. The lateral buffer component, on the other hand, depends on the availability of conformance alert capability of the onboard mission support tools. Pilots were able to adjust their flights and stay within the 300 m volume even when the nominal trajectory changed due to the altered altitude. This implies that improving the pilot’s situation awareness with suitable technology can help them maintain conformance to the predicted trajectory, thus operation volume, which in turn will enable high-density airspace operations. The vertical volume component is the most difficult to design as it depends on the topology of the area and requires a large buffer to account for elevation fluctuations.
The airspace integration can benefit from additional information sharing through the flight plans submitted for VFR operations. Information on the mission type, target landmark, target altitude and speed, as well as onboard situation awareness equipage can be used to both design and verify operation volumes supporting high-density versatile operations at low altitudes.
Data availability statement
The datasets presented in this article are not readily available because detailed pilots’ data cannot be publicly shared. Requests to access the datasets should be directed to andreevamori.adriana@jaxa.jp.
Author contributions
AA-M: Conceptualization, Data curation, Formal Analysis, Investigation, Methodology, Software, Supervision, Validation, Visualization, Writing–original draft.
Funding
The author(s) declare that no financial support was received for the research, authorship, and/or publication of this article.
Acknowledgments
The authors are grateful to Ayano Yoshida and Noboru Takeichi from Tokyo Metropolitan University for their work on the trajectory prediction model, presented in the earlier versions of this work. We thank the Aviation Technology Directorate Fundamental Aeronautics Research Unit team for their dedicated support in planning and conducting the flight test, as well as obtaining and analyzing the data. Special thanks go to Aviation Technology Directorate Management and Integration Department Public Relations team for their assistance in filming and documenting the flight tests.
Conflict of interest
The author declares that the research was conducted in the absence of any commercial or financial relationships that could be construed as a potential conflict of interest.
Publisher’s note
All claims expressed in this article are solely those of the authors and do not necessarily represent those of their affiliated organizations, or those of the publisher, the editors and the reviewers. Any product that may be evaluated in this article, or claim that may be made by its manufacturer, is not guaranteed or endorsed by the publisher.
References
Andreeva-Mori, A., Kubo, D., Kobayashi, K., Okuno, Y., Homola, J., Johnson, M., et al. (2021c). Operational testing of unmanned aircraft system traffic management in disaster response. J. Air Transp. 29, 160–170. doi:10.2514/1.d0245
Andreeva-Mori, A., Ohga, K., and Kobayashi, K. (2021a). “Reconnaissance mission flight modeling for strategic planning of manned and unmanned vehicle integrated disaster response,” in The 40th Digital Avionics Systems Conference, San Antonio, Texas.
Andreeva-Mori, A., Ohga, K., Kobayashi, K., Okuno, Y., Homola, J., Johnson, M., et al. (2021b). “Management of operations under visual flight rules in UTM for disaster response missions,” in SESAR innovation days.
Andreeva-Mori, A., Ohga, K., Kobayashi, K., Yoshida, A., and Takeichi, N. (2022). “Manned aircraft situation awareness technology for low-altitude predicted trajectory conformance,” in IEEE/AIAA 41st Digital Avionics Systems Conference (DASC).
Andreeva-Mori, A., Ohga, K., Kobayashi, K., Yoshida, A., and Takeichi, N. (2023a). Feasibility study of operation volume design concept for integration of aircraft flying under visual flight rules based on actual flights. IEEE Aerosp. Electron. Syst. Mag. 38 (6), 14–26. doi:10.1109/maes.2023.3246951
Andreeva-Mori, A., Ohga, K., Ishida, K., Kobayashi, K., Yoshida, A., and Takeichi, N. (2023b). Development and real-flight testing of volume-based situation awareness technology for integrated reconnaissance missions. in IEEE/AIAA 42nd Digital Avionics Systems Conference (DASC), 1–7. IEEE.
Bulusu, V., Idris, H. R., and Chatterji, G. (2023). “Analysis of VFR traffic uncertainty and its impact on uncrewed aircraft operational capacity at regional airports,” in AIAA AVIATION 2023 Forum.
Entzinger, J. O., and Kubo, D. (2023). “Modeling low level flight patterns of manned aircraft from actual flight tracking data,” in The proceedings of the 2021 Asia-Pacific International Symposium on Aerospace Technology (APISAT 2021), Volume 2. APISAT 2021. Lecture Notes in Electrical Engineering, 193 (Singapore: Springer). doi:10.1007/978-981-19-2635-8_25
FAA (2020). UTM concept of operations ver.2. Available: https://www.faa.gov/uas/research_development/traffic_management/media/UTM_ConOps_v2.pdf (Accessed March 4, 2021).
FAA (2024a). Chapter 5. Air traffic procedures. Available: https://www.faa.gov/air_traffic/publications/atpubs/aim_html/chap5_section_1.html (Accessed January 5, 2024).
FAA (2024b). VFR weather minimums. Available: https://www.faasafety.gov/files/gslac/courses/content/25/185/vfr%20weather%20minimums.pdf (Accessed January 5, 2024).
Geospatial Information Authority of Japan (2024). Geospatial information authority of Japan. Available: https://maps.gsi.go.jp/development/elevation_s.html.
GPR Tutorial (2023). Available: https://www.apps.stat.vt.edu/leman/VTCourses/GPtutorial.pdf (Accessed November 03, 2023).
ICARUS Integrated Common Altitude Reference system for U–space (2022). ICARUS integrated common altitude reference system for U–space. Available: https://www.u-spaceicarus.eu/ (Accessed November 13, 2023).
JAXA (2020). JAXA’s research helicopter. Available: http://www.aero.jaxa.jp/publication/pamphlets/pdf/heli.pdf (Accessed February 21, 2020).
Kawasaki Heavy Industries (2017). Kawasaki delivers BK117C-2 firefighting and disaster relief helicopter to tokushima prefecture. Available: https://global.kawasaki.com/en/corp/newsroom/news/detail/?f=20160314_2537 (Accessed November 8, 2023).
MATLAB (2024). fitrgp-Fit a Gaussian process regression (GPR) model. [Online]. Available: https://www.mathworks.com/help/stats/fitrgp.html (Accessed January 10, 2024).
Okuno, Y., Kobayashi, K., and Ishii, H. (2016). Development of a helicopter operations management system for disaster relief missions. J. Am. Helicopter Soc. 61 (1), 1–9. doi:10.4050/jahs.61.012006
Olive, X., Sun, J., Lafage, A., and Basora, L. (2020). “Detecting events in aircraft trajectories: rule-based and data-driven approaches,” in the Proceedings of 8th OpenSky Symposium 2020.
SKYbrary (2023). Navigation aids for VFR flights. Available: https://skybrary.aero/articles/navigation-aids-vfr-flights (Accessed November 09, 2023).
Toratani, D., and Hirabayashi, H. (2023). Analysis of flight plans for visual flight rules toward preflight information sharing. J. Air Transp. 31 (4), 172–183. doi:10.2514/1.d0288
Keywords: visual flight rules, airspace integration, operation volume, flight test, trajectory uncertainties
Citation: Andreeva-Mori A (2024) Balancing predictability and flexibility through operation volume-constrained visual flight rule operations in low altitude airspaces. Front. Aerosp. Eng. 3:1338388. doi: 10.3389/fpace.2024.1338388
Received: 14 November 2023; Accepted: 27 February 2024;
Published: 19 March 2024.
Edited by:
Linyue Gao, University of Colorado Denver, United StatesReviewed by:
Nihad E. Daidzic, Minnesota State University, United StatesMaria Neto, University of Coimbra, Portugal
Ruichen He, University of Minnesota Twin Cities, United States, in collaboration with reviewer MN
Copyright © 2024 Andreeva-Mori. This is an open-access article distributed under the terms of the Creative Commons Attribution License (CC BY). The use, distribution or reproduction in other forums is permitted, provided the original author(s) and the copyright owner(s) are credited and that the original publication in this journal is cited, in accordance with accepted academic practice. No use, distribution or reproduction is permitted which does not comply with these terms.
*Correspondence: Adriana Andreeva-Mori, andreevamori.adriana@jaxa.jp