Early Postnatal Comprehensive Biomarkers Cannot Identify Extremely Preterm Infants at Risk of Developing Necrotizing Enterocolitis
 Alice Hoffsten1*
  Laszlo Markasz1,2
  Helene Engstrand Lilja1,3
  Karl Wilhelm Olsson1,4
  Richard Sindelar1,2
- 1Department of Women's and Children's Health, Uppsala University, Uppsala, Sweden
- 2Neonatal Intensive Care Unit, University Children's Hospital, Uppsala, Sweden
- 3Section of Pediatric Surgery, University Children's Hospital, Uppsala, Sweden
- 4Department of Surgical Sciences, Uppsala University, Uppsala, Sweden
Background: Necrotizing enterocolitis (NEC) is a fatal disease where current diagnostic tools are insufficient for preventing NEC. Early predictive biomarkers could be beneficial in identifying infants at high risk of developing NEC.
Objective: To explore early biomarkers for predicting NEC in extremely preterm infants (EPIs).
Methods: Blood samples were collected on day 2 (median 1.7; range 1.5–2.0) from 40 EPI (median 25 gestational weeks; range 22–27): 11 developed NEC and 29 did not (controls). In each infant, 189 inflammatory, oncological, and vascular proteomic biomarkers were quantified through Proximity Extension Assay. Biomarker expression and clinical data were compared between the NEC group and Controls. Based on biomarker differences, controls were sorted automatically into three subgroups (1, 2, and 3) by a two-dimensional hierarchical clustering analysis.
Results: None of the biomarkers differed in expression between all controls and the NEC group. Two biomarkers were higher in Control 1, and 16 biomarkers were lower in Control group 2 compared with the NEC group. No biomarker distinguished Control 3 from the NEC group. Perinatal data were similar in the whole population.
Conclusions: Early postnatal comprehensive biomarkers do not identify EPIs at risk of developing NEC in our study. Future studies of predictors of NEC should include sequential analysis of comprehensive proteomic markers in large cohorts.
Introduction
Even though mortality rates among preterm infants have halved during the past two decades (1), the aim to reduce it further continues. Recent studies (2–5) have found an upsurge of necrotizing enterocolitis (NEC) as cause of death. The increase of mortality from NEC can be due to successful care of other early illnesses, allowing the preterm infants to survive long enough to be susceptible to NEC (6, 7).
Since the first description of NEC (8), decades have been devoted to understand its pathogenesis and etiology. The recent knowledge on NEC suggests that mechanisms are multifactorial with both prenatal and postnatal factors. Current consensus proposes that NEC is an inflammatory disease, where injuries to the intestinal wall barrier lead to bacterial invasion and necrosis (6). The immaturity of the preterm gut barrier and the developing, over-reactive immune system enhance the response and destruction (9). Exaggerated mucosal inflammation and necrosis may be amplified by abnormal microcirculation (10). Postnatally, diet (11, 12) and epidermal growth factors (13) will affect intestinal maturation and can thus have an impact on the susceptibility of NEC. Furthermore, low birth weight (BW), being small for gestational age (SGA), anemia, and increased immaturity are all recognized risk factors of NEC (14, 15).
Besides substantial mortality, NEC is associated with longer hospital stays (16), impaired neurodevelopment (17), and morbidity due to short bowel syndrome following lifesaving surgical interventions (18).
Diagnosis of NEC is based on the modified Bell's staging criteria, consisting of radiographic, clinical, and laboratory findings (19, 20). Early diagnosis is more challenging in more immature infants, due to non-specific clinical and radiographic signs (21). Desolately, it is also in the most premature newborns that the mortality and incidence of NEC are the largest (22). It is therefore of great interest to find a more reliable and earlier diagnosis of NEC in these individuals. This would enable earlier intervention and thus reduce progression, morbidity, and mortality of NEC. A precise diagnosis will also decrease over-treatment (23).
Plasma proteins have been proven useful in identifying diseases in extremely preterm newborns, for instance, in bronchopulmonary disease (BPD), patent ductus arteriosus (PDA), and retinopathy of prematurity (ROP) (23–26). Many attempts have been made to identify biomarkers in serum, stool, and urine for early diagnosis of NEC, but the clinical relevance of these findings still remains low. Individual inflammatory biomarkers are usually non-specific, reflect general inflammation rather than specifically NEC, and are detected at later stages of NEC (24–26). Thus, they do not facilitate an earlier diagnosis. Some biomarkers require the infant to pass stool, which is not always possible in advanced NEC (25, 27). Inter-individual and intra-individual variations have also been obstacles to exploring useful biomarkers (28). Other difficulties for finding predictive biomarkers in NEC could be that the correlation between biomarkers and disease is not as linear, for instance, between vascular endothelial growth factor (VEGF) and ROP, and that NEC probably is multifactorial. The individuals at risk of developing NEC may also display heterogeneity and have different risks. Therefore, exploring combinations of comprehensive biomarkers in infants at the highest risk of developing NEC may be useful.
The aim was to prospectively study early comprehensive biomarkers in serum from extremely preterm infants who might or might not develop NEC. Biomarker patterns in healthy infants are compared with patterns in those who later developed NEC. Besides finding useful potential early biomarkers to improve current diagnostic tools in this high-risk population, this could also yield valuable information about the pathophysiology of NEC.
Methods and Materials
Study Setting and Participants
Infants born in November 2012–May 2015 at Uppsala University Children's Hospital before 28 weeks of gestation were prospectively included. Those with major congenital anomalies or heart defects were excluded. The population has previously been studied in the DAPPR-cohort (Ductus Arteriosus and Pulmonary circulation in PReterm infants) (29) and have been approved for study by the Regional Ethical Review Board in Uppsala, D:nr 2011/046. Out of 122 infants born during this period, 40 completed the full blood sampling needed in this study to obtain a level of significance of 5% and a power of at least 0.80 in this multi-parametrical study (Figure 1). All infants were included after informed and written consent from the parents was obtained. Eventually, 11 developed NEC and 29 controls did not. Background data from SNQ for the 122 individuals born during the period were used to compare background data in the study population, to ensure a reliable representation of the study period.
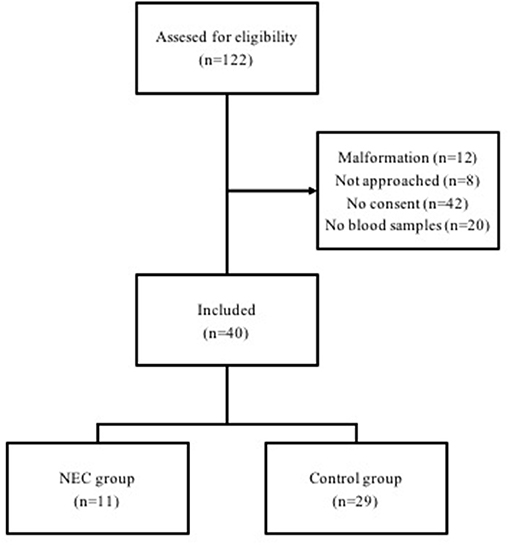
Figure 1. Flowchart of included infants (n = 40) born between 22 and 27 weeks of gestational age, and reasons for exclusion.
Data Extraction and Study Variables
For each individual, clinical and laboratory parameters were studied. This included diagnosis of NEC defined as Bell stage ≥ IIa (19), as well as other associated diseases, such as PDA, intraventricular hemorrhage (IVH), bronchopulmonary dysplasia (BPD), respiratory distress syndrome (RDS), ROP, and infection/septicemia. Clinical features also included administration of prenatal steroids, preeclampsia, chorioamnionitis, delivery mode, twin birth, APGAR score, GA, BW, respiratory illnes, onset of illness, and mortality.
Proximity Extension Assay (PEA)
Blood samples were collected from the umbilical arterial catheter on day 2 (median 1.7; range 1.5–2.0) after birth. The samples were centrifuged for 7 min at 2,400 × g, after which the serum was extracted to be stored at −80°C while awaiting analysis. A total of 202 biochemical markers (Table 1) were quantified in each individual with proximity extension assay (PEA), Olink, with the Proseek Multiplex 96 × 96 CVD I, Oncology I, and Inflammation I biomarker panels. PEA is suitable for serum analysis of pre-terms since it requires small blood volumes (1 μl) (30). Thirteen biomarkers were excluded due to analytical error (marked in Table 1). The final number of biomarkers in this study was 189.
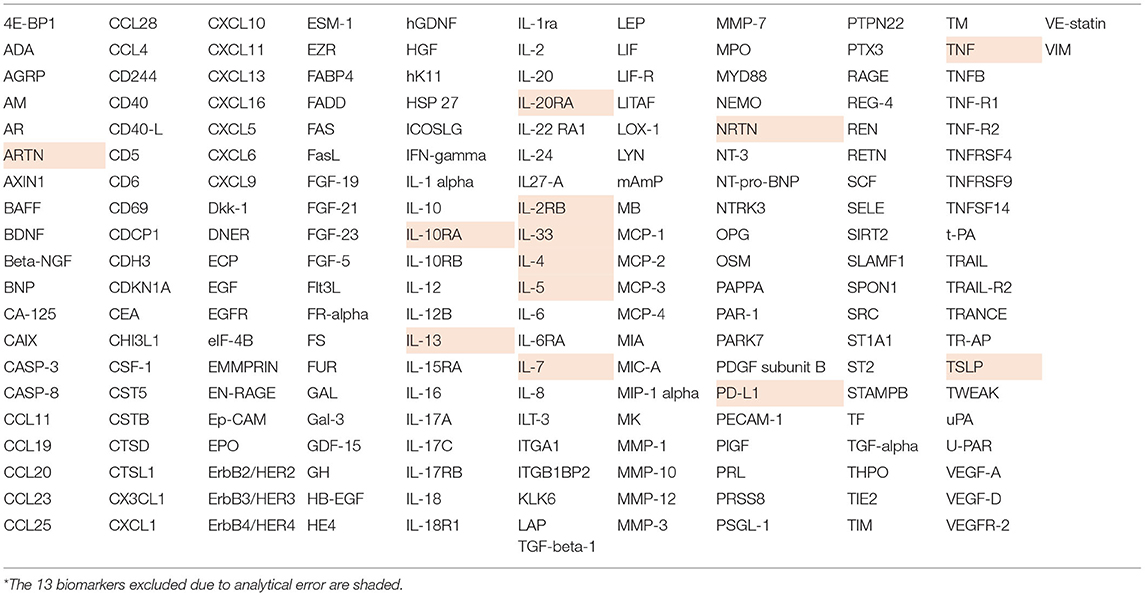
Table 1. All quantified biomarkers (n = 202*).
Clustering and Identification of Control Groups
Automatic cluster analysis of biomarker levels was performed with Cluster 3.0 (31), in which all biomarker levels were weighed equally. The two-dimensioned hierarchical multivariate analysis outlines the Euclidean distance between two factors or groups. Results from the cluster analysis were displayed as a map of color pixels with Java Treeview (32).
The controls were divided automatically into three subgroups by the clustering program (Control 1, Control 2, and Control 3) according to their biomarker expression patterns. After this, biomarker levels were statistically compared between the control groups, to ensure statistical support for the identified groups. New clustering was performed to explore how the NEC group clusters with the controls. A multivariate logistic regression to verify correlation found in the cluster analysis was not possible due to the amount of variables.
Statistical Analysis
Statistical analysis was performed in Excel Version 15.27 (161010) and SPSS (1.0.0. 1447 64-bit edition). A p-value was considered statistically significant when <0.05. All tests of significance were two-tailed. The expression level of each biomarker was compared with a Student's t-test. After this, a Benjamini–Hochberg analysis was performed to reduce the risk for false-positive results. The q-value for this explorative study was set at 0.1. Background data within the study population (n = 40) were compared in the NEC group (n = 11) and the control group (n = 29) with Student's t-test for parametric data and the Mann–Whitney U for non-parametric data. Pearson's correlation was used to determine whether a biomarker level correlated to GA or BW. Background data from SNQ for the individuals born during the period (n = 122) were compared with data from the study population (n = 40) by chi-square test for nonparametric values and Student's t-test for parametric values.
Results
No statistical difference was found in biomarker expression levels (n = 189) when comparing the NEC group with all controls: however, heterogeneities in controls could be further studied (see in Appendix 1).
Identification of Control Groups Through Cluster Analysis
Two-dimensional hierarchical clustering of biomarkers was performed including only controls to explore subgroups with unique biomarker profiles. The clustering software identified three control groups: Control 1, Control 2, and Control 3. Each control group had a unique pattern of biomarker expression. After statistical analysis, 37 biomarkers were identified to differentiate between any combinations of the control groups (Figure 2). Thus, each control group was characterized by an individual biomarker expression pattern. The expression pattern of the control groups, the differences in the expression levels between the groups, and the biological function of the presented biomarkers are shown in Figure 2. In Appendix 1, all biomarkers (n = 189) are clustered in all individuals (n = 40), where most of the NEC patients form a cluster with infants from Control 3.
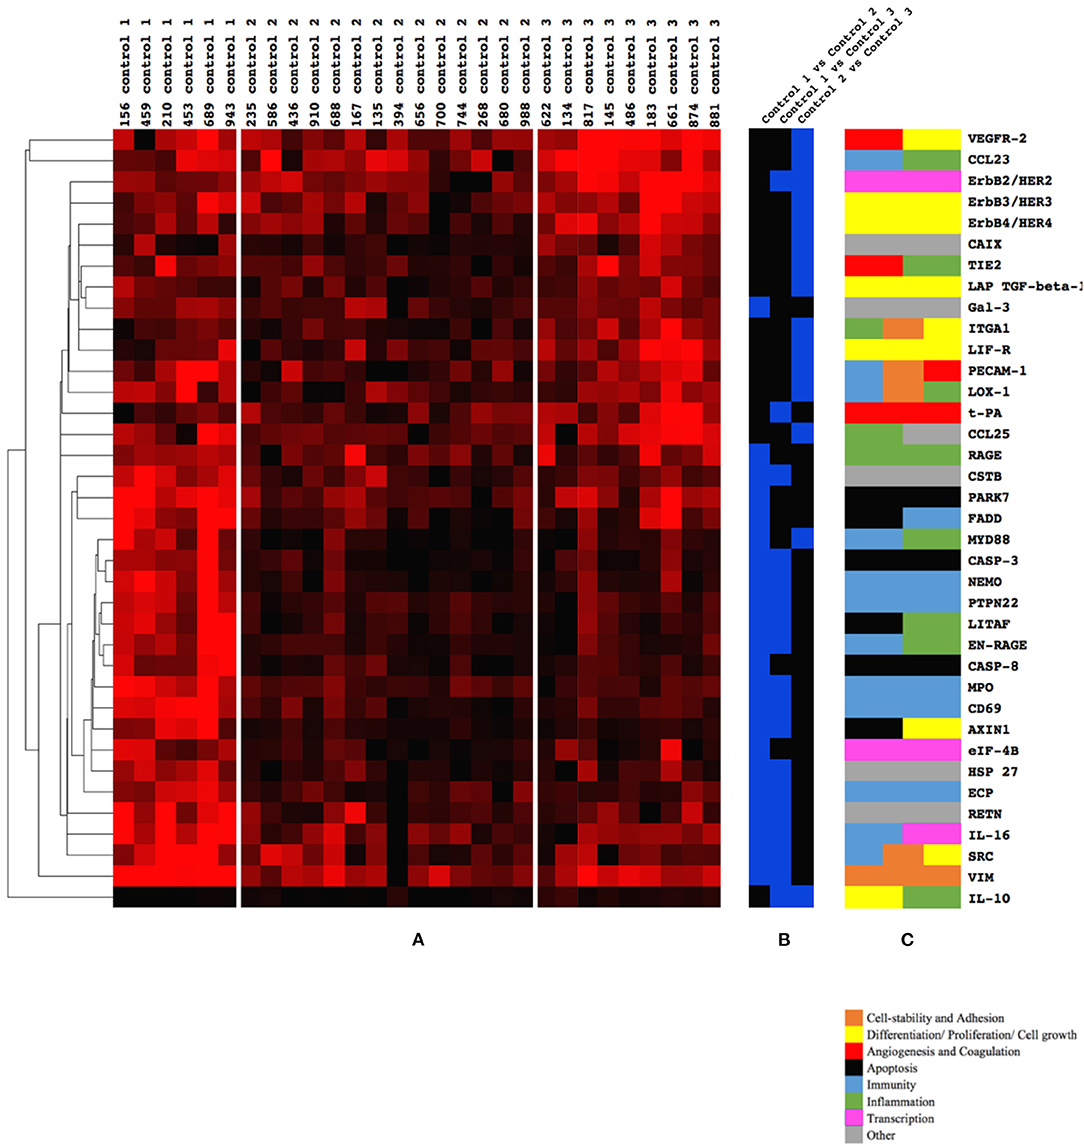
Figure 2. (A–C) Biomarkers (n = 37) that differed between the three Control groups, 1, 2, and 3 (blue), and their physiological function (brown, yellow, red, black, light blue, green, pink, and gray). (A) Three control subgroups could be identified by clustering of all biomarkers (n = 189). Significantly different biomarkers (n = 37) between the three control groups (1, 2, and 3) are presented. Higher intensity of red color indicates a higher expression of a given biomarker. (B) The comparison in which the biomarker differed in a comparison. Blue color indicates a significant difference of expression between control groups listed at the top of the column. Note that 23 biomarkers differed between Controls 1 and 2; 16 between Controls 1 and 3; and only 14 between Controls 2 and 3. (C) The function/functions of each biomarker as defined by www.humanproteinatlas.org (brown, yellow, red, black, light blue, green, pink, and gray).
Biomarkers of Significance
Eighteen biomarkers differed when comparing the NEC group with any combination of the three control groups (Figure 3). Two biomarkers differed when comparing NEC with Control 1, six biomarkers differed when comparing the NEC group with Control 2, and no biomarker (n = 189) differed in expression when comparing the NEC group with Control 3. This seems to be visually confirmed when all controls were clustered together with NEC patients, as most of the NEC patients appeared in the same cluster as Control 3 (Appendix 2). The direction (+/–) of differences in biomarker expression between NEC patients and control groups are displayed in Figure 3B. Figure 3C shows the differences of the given biomarker between the control groups.
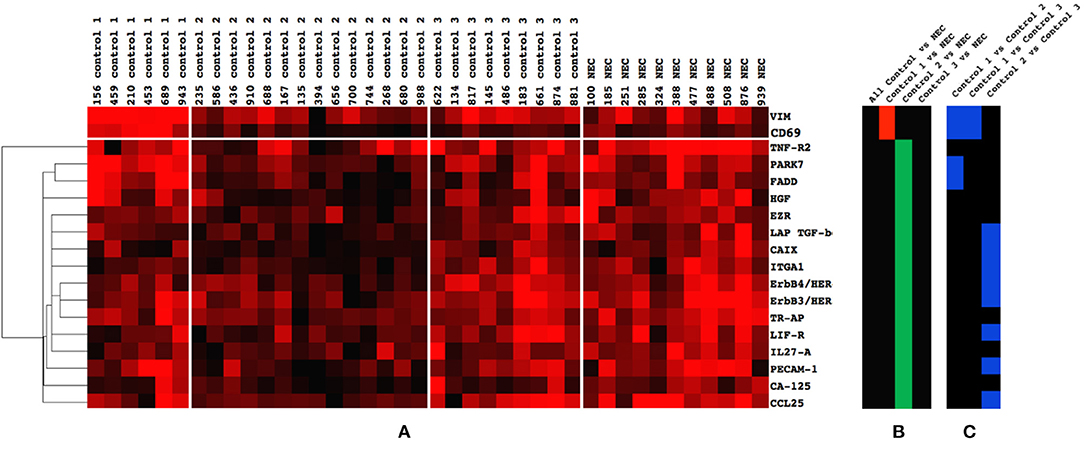
Figure 3. (A–C) Biomarkers (n = 18) that differed between Controls 1, 2, and 3 and the necrotizing enterocolitis (NEC) group. (A) Cluster of biomarkers (n = 18) that exhibited significant difference in expression when the NEC group was compared with all controls or separate control groups (1, 2, and 3). (B) Significant difference between controls and NEC. A red color is an indication that the mean expression level of the given protein was lower in NEC patients as compared with the control group. A green color signifies that the mean expression in the NEC patients was higher than in the control group. Note the higher expression of two biomarkers in Control 1 compared with the NEC group (red) and the lower expression of 16 biomarkers in Control 2 compared with the NEC group (green). Note also that no biomarker differed between all controls and the NEC group (black), nor between Control 3 and the NEC group (black). (C) Comparison of the 18 NEC specific biomarkers between Controls 1, 2, and 3. A blue color indicates a difference in expression between the two control groups listed at the top of the column. Note that four biomarkers differed between Controls 1 and 2 (blue), two biomarkers between Controls 1 and 3 (blue), and eight biomarkers between Controls 2 and 3 (blue). Only two biomarkers differed between all three control groups (VIM and CD69). The biological function according to www.humanproteinatlas.org of the six factors TNF-R2, HGF, EZR, TR-AP, IL-27A, and CCL25 are as follows: TNF-R2, apoptosis; HGF, differentiation/proliferation/cell growth; EZR, cell stability and adhesion; TR-AP, other (blood pressure regulation); IL-27A, immunity; and CCL25, inflammation and immunity.
Clinical Characteristics of the Study Population
Prenatal steroids were administered to the all individuals (n = 40). Incidence of the comorbidities RDS, IVH, BPD, infection, ROP, and persistent pulmonary hypertension of the newborn (PPHN) was compared in NEC group vs. all controls as well as NEC group vs. control groups 1, 2, and 3; however, no difference in incidence was found (Appendix 3). Twin pregnancy, preeclampsia, chorioamnionitis, and APGAR score (at 1, 5, and 10 min) did not differ between the NEC group, all controls, and Control groups 1, 2, and 3 (Appendix 3). A cluster analysis of clinical parameters along with significant biomarkers is displayed in Appendix 2.
The ratio of NEC in the individuals born during the study period (n = 122) was 16.4%, similar to that of the study group (n = 40, 27.5%, p = 0.211). The mortality during the 2 years was 25.4%, and in the study population, 17.5% (p = 0.412). The controls in the study population (n = 29) who did decease (n = 3) lived at least 3 months.
Median GA of all individuals was 25 weeks (range 22–27). No difference was found in GA between the groups (Figure 4A; Table 2). The BW was lower in NEC as compared with all controls (p = 0.023), or with Control 2 (p = 0.026) (Figure 4B; Table 2). Differences disappeared when the BW was adjusted to BW percentile (BW%) and BW Z score (Figures 4C,D; Table 2). None of the infants were growth restricted, as BW Z score was >-2 SD (Figure 4D). Visually, there was a tendency toward lower median GA, BW%, and BW Z score in Control 3 as compared with the NEC group (Figures 4A,C,D); however, this could not be statistically confirmed (Table 2; Control 3 vs. NEC). The median GA of Control 1 appears to be higher than the rest of the study population (Figure 4A).
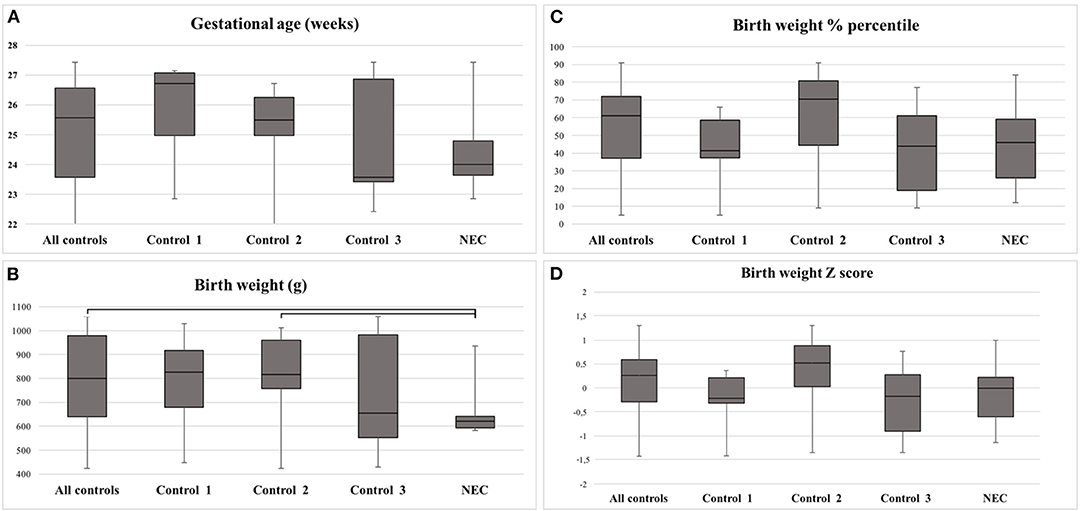
Figure 4. (A–D) Clinical data for the study population and detected differences. (A) Gestational age (GA) in weeks and days. (B) Birth weight (BW) in grams. (C) BW in percentiles. (D) BW in Z score. Note that BW differed between all controls and the necrotizing enterocolitis (NEC) group, as well as between Control 2 and the NEC group. Bars depict significant differences. Statistical calculations displayed in Table 2.
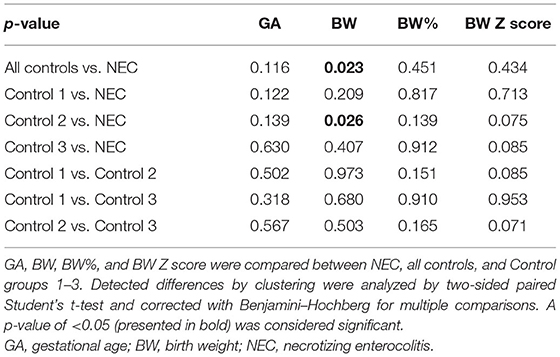
Table 2. Detected statistical differences in parameters presented in Figures 4A–D.
The median time from birth until diagnosis of NEC was 9 days (range 2–18). The mean GA of those developing NEC earlier than 9 days was 24.4 weeks, which was not higher (p = 0.882) than the mean GA of those who developed NEC later (mean GA 23.8).
Correlation Analysis
A negative correlation was found between BW and expression of hepatocyte growth factor (HGF), ErbB3/HER3, and Erb4/HER4. For the rest of the biomarkers, no correlation between biomarker expression and BW or GA could be confirmed (Table 3).
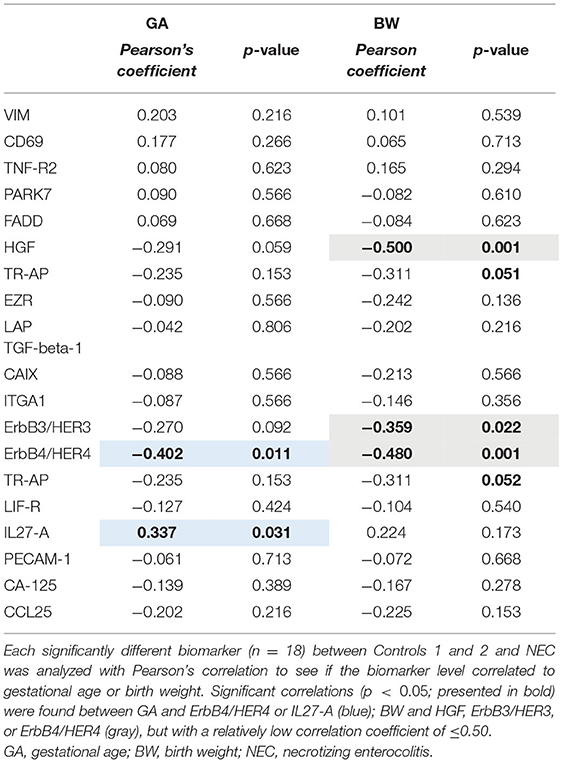
Table 3. Correlations between biomarkers (n = 18) and GA or BW.
Selected Analysis of Biomarkers Previously Studied in Necrotizing Enterocolitis and Colitis
A literature search in PubMed of the 18 biomarkers that differed between the control groups and the NEC group (Figure 2) showed that TNF-R2, HGF, and tartrate-resistant acid phosphatase 5 (TR-AP) have previously been described in relation to NEC. Fas-associated protein with death domain (FADD) and PARK7 have been reported in relation to colitis. Besides the expression of these five proteins, Figure 5 includes vimentin (VIM) and CD69, which were elevated in Control 1 as compared with all other groups. The levels of FADD, TNF-R2, HGF, TR-AP, and PARK7 were elevated in NEC compared with Control 2 (Figure 5).
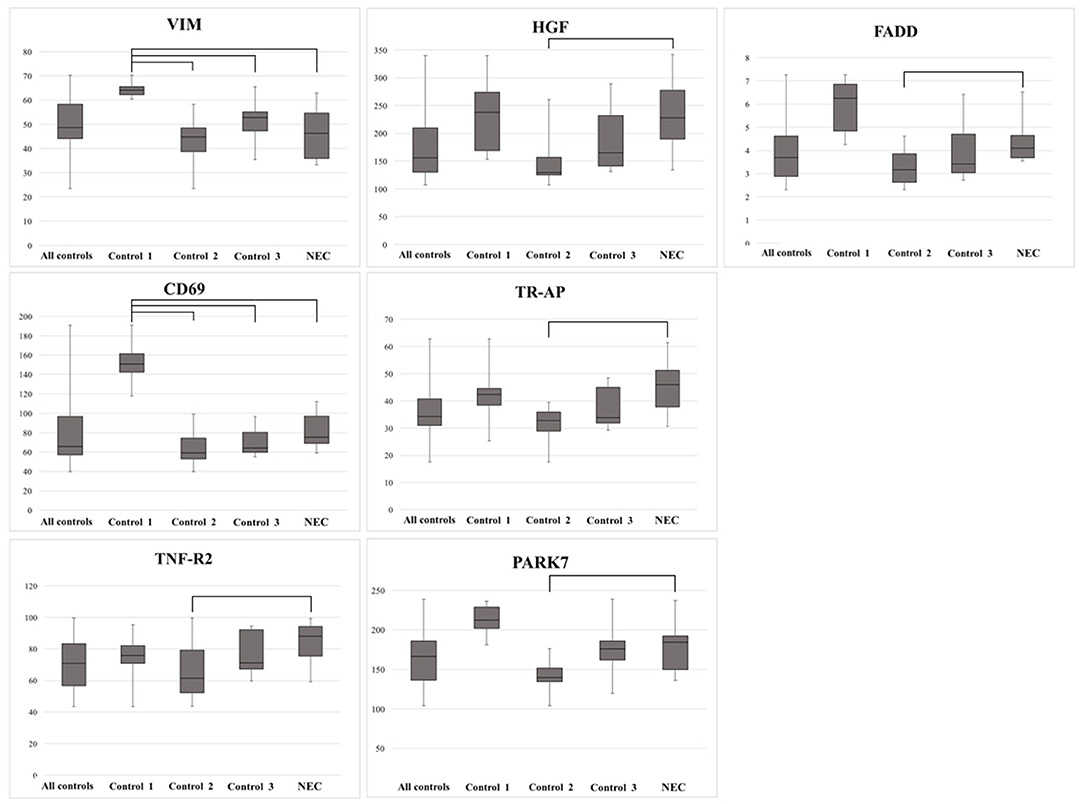
Figure 5. Biomarkers previously reported linked to necrotizing enterocolitis (NEC) (n = 7), and with the significant difference between Controls 1, 2, and 3 and the NEC group. Note the higher expression of VIM and CD69 in Control 1 compared with the NEC group, and the lower expression of TNF-R2, PARK7, FADD, HGF, and TR-AP in Control 2 compared with the NEC group. Bars depict significant differences.
Discussion
In this study of 40 extremely preterm infants, 189 biomarkers with functions mostly in inflammation, proliferation, and vascularization were quantified at day 2 after birth in an effort to find potential early risks of emerging NEC. Eleven of 40 infants later developed NEC.
Our main finding is that no biomarker (n = 189) differed in expression when comparing infants who later developed NEC with all controls. Furthermore, all infants (n = 40) had comparable clinical perinatal history. This suggests that on day 2, the individuals in this high-risk group overall exhibit the same starting point in regard to inflammation, vascularization, and possibly in the risk of NEC development. This opens up for postnatal factors influencing which individuals go on to develop NEC and that prophylactic treatment and close monitoring very well can be beneficial in reducing NEC incidence.
The subdivision of the controls may be important to investigate variation of NEC risk shortly after birth. If a blood test taken at day 2 reveals biomarker patterns incongruent with those found in NEC, this could be an indication of lower risk of developing NEC. Contrariwise, a group of individuals exhibiting similar patterns as the NEC group could be suspected to have an increased risk of developing NEC. The latter group could benefit from close observation and prophylactic treatment.
Control 3 stands out as particularly interesting to compare with the NEC group. Besides similar clinical and perinatal parameters, not a single biomarker (n = 189) differed in expression when comparing Control 3 with those who later developed NEC. Control 3 even exhibited a visual trend toward lower median GA and adjusted BW than the NEC group. Both factors would essentially make Control 3 more prone to develop NEC (15) than the NEC group itself. Our data suggest that at day 2 after birth, Control 3 may exhibit the same risk of developing NEC as the individuals that later did develop NEC. Based on these observations, it seems feasible to hypothesize that postnatal, rather than perinatal, factors determine which individuals are at the highest risk of developing NEC in this cohort of extremely preterm infants.
Several biomarkers (n = 18) differed when comparing the NEC group with Control 1 and 2. Two of them were higher in Control 1 as compared with NEC, Control 2, and Control 3, namely, VIM and CD69.
VIM, a type III intermediate filament, is a component in the cytoskeleton (33). In rat models with inflammatory bowel disease (IBD), VIM expression was increased (34). Knock-out of VIM in mouse models with induced IBD has considerably less inflammation that in those with VIM (35). In our study, VIM is lower in NEC patients than Control 1, which is incongruent with the function of VIM.
CD69 expression indicates leucocyte activation and is an early marker of inflammation (36). CD69 has been found to be upregulated after intestinal bacterial exposure (37) and downregulated in murine models with severe anemia (38). Furthermore, CD69 is thought to reduce tissue damage from ischemia, by reducing endothelial activation (39) and has increased expression in blood cells after intake of probiotics in healthy adults (40). It also plays a role in immunosuppressive regulatory cells, through promotion of IL-10 production (41). We found lower levels of CD69 in NEC patients compared with Control 1, which is not conflicting in with the functions described above.
In a risk evaluation, we observed that a simultaneously higher expression of VIM and CD69 on day 2 indicated a lower risk for NEC. There was a visual tendency toward higher GA in Control 1, which could affect biomarker levels. However, in the correlation analysis of VIM and CD69 with clinical data, expression levels could not be linked to GA and BW.
The homogeneity in clinical characteristics of the patients both with and without NEC signifies a suitable basis for analysis, since it minimizes the risk of confounding factors influencing biomarker concentrations. The inverse correlations between NEC and GA and/or BW are well-known major risk factors for NEC (15). In the present study, we found only a tendency for such a correlation, probably because the study population consisted of extremely preterm infants, thus focusing on individuals already at the highest risk of developing NEC.
Sixteen biomarkers were lower in Control 2 as compared with the NEC group. Twelve of these also differed in expression when comparing the three control groups, while six biomarkers (Ca-125, IL27A, TR-AP, EZR, HGF, and TNF-R2) did not. Since these six biomarkers do not differ when comparing NEC with Control 3, they could be what indicates a high risk of developing NEC. Some of these proteins have previously been linked to colitis.
We found that TNF-R2 was lower in a group of controls, which is in accordance with previous NEC studies (42, 43). Tumor necrosis factor has pleiotropic effects with both pro- and anti-inflammatory effects (44). TNF-R2 has been postulated to be a pro-inflammatory mediator in the pathophysiology of NEC (42). Increased TNF-R2 signaling in mice has been found to induce intestine barrier loss, resulting in colitis (45, 46). TPN nutrition further contributes to TNF dysregulation of the epithelial barrier function in mouse models (45). The increased level of TNF-R2 found in the NEC group could be an indication of a predisposed compromised intestinal barrier.
HGF regulates cell proliferation, cell survival, and angiogenesis (47), which are especially important in enterocytes (48). In our study, we found that HGF expression was inversely correlated to BW and a tendency toward it being inversely correlated to GA. Inverse correlation of GA and HGF expression has been found previously (49) and would be in line with the fact that increased prematurity increases risk for NEC (15). Protein levels are higher in the second trimester as compared with levels found in urine from newborns (50). Although HGF correlation to BW in preterm has not been fully studied, HGF has been described to be a biomarker for being SGA (51). Being SGA is a risk factor for NEC (15). In contrast, it has been found that fetal swallowing of amniotic fluid containing HGF decreases NEC incidence in rats (52) and that induced colitis yields greater damage in HGF-deficient mice (53). To summarize, high HGF could be an indication of increased immaturity and being SGA.
TR-AP is a serum marker for activated macrophages and chronic inflammation and is being explored for diagnosis of chronic inflammatory diseases (54). TR-AP-positive macrophages reside in the lamina propria of the healthy colon, and a histopathological increase of TR-AP expression has been found in colitis-induced rats (55). NEC has to our knowledge not previously been linked to TR-AP. The elevated TR-AP expression in the NEC group could signify increased inflammatory activity.
Leukemia inhibitory factor receptor (LIF-R), carbonic anhydrase IX (CAIX), integrin alpha (ITGA), and their potential links to NEC and colitis have, to our knowledge, not been reported. Although no link has previously been made between FADD and NEC, FADD has been found to prevent intestinal inflammation (56), and knock-out of FADD has been shown to induce colitis (57). Parkinson's disease protein 7 (PARK7) deficiency leads to increased apoptosis in colitis and has been proposed as a therapeutic target for colitis (58) but has never been linked to NEC.
There are previous studies on the link between NEC/colitis and expression of ezrin (EZR) (59, 60), tumor growth factor beta 1 (TGF-β1) (42), VIM (34, 35), IL-10 (61), epidermal growth factor receptor 3 (ErbB3/HER3) (62), epidermal growth factor receptor 4 (ErbB4/HER4) (63, 64), platelet endothelial cell adhesion molecule 1 (PECAM-1) (65, 66), carcinoma antigen 125 (CA-125) (67, 68), and chemokine ligand 25 (CCL25) (69, 70). These findings are not congruent with the direction of expression level (+/–) in NEC patients compared with controls in this study. However, this analysis is not a study of biomarker level in stated NEC but an attempt to determine levels before onset of fulminant NEC. To this date, few data are available for such comparison.
Strengths and Limitations
The reason for not finding differences in biomarkers between NEC and all controls could be that day 2 after birth is too early to detect relevant biomarkers. Given the single blood sampling, it was not possible to consider the chance of biomarker levels being influenced by diurnal variation, or whether day 2 after birth is the optimal time to find valuable biomarkers. Further studies with sequential blood sampling would be beneficial to take these factors into account.
A strength of this study is its benchmarking of biomarker patterns along with perinatal clinical data to explore risk of NEC development. The results from this study can be used for comparison in future studies. The single, early blood sampling illustrates the starting point of extremely preterm infants before being influenced by postnatal factors. While we hypothesize that postnatal factors influence why Control group 3 did not develop NEC, it was not possible to verify this in this study due to the data not being collected.
The reason for the relatively high NEC incidence in the study group (27%) as compared with national data on extremely preterm infants (9%) (71) could be the fact that survival until day 2 was necessary to be included in the study, since this was the time of blood sampling. This excluded infants who died from early causes of death, such as asphyxia, respiratory conditions, IVH, congenital anomalies, and early infections (72–75). The relatively high incidence of NEC could also be ascribed to the low GA in the entire study group.
Conclusion
In this study of extremely preterm infants, the expression of early comprehensive biomarkers (n = 189) at day 2 of life could not distinguish those who later developed NEC from all controls. Thus, the study could not identify biomarkers that can be used to select infants at high risk of developing NEC when comparing the NEC group with all controls. After subdivision of controls into three groups, simultaneously elevated VIM and CD69, or simultaneously lower expression of TNF-R2, PARK7, FADD, HGF, and TR-AP, could be regarded as a lower risk for developing NEC in some of the infants. Known risk factors of NEC were not higher in individuals who later developed NEC, which suggests that postnatal factors influence NEC development.
Data Availability Statement
The raw data supporting the conclusions of this article will be made available by the authors, without undue reservation.
Ethics Statement
The studies involving human participants were reviewed and approved by Etikprövningsmyndigheten, Uppsala, Sweden. Written informed consent to participate in this study was provided by the participants' legal guardian/next of kin. Written informed consent was obtained from the individual(s), and minor(s)' legal guardian/next of kin, for the publication of any potentially identifiable images or data included in this article.
Author Contributions
AH performed collection of data, statistical analysis, wrote and edited the manuscript. LM performed data collection analysis, statistical analysis as well as writing and revising of the manuscript. HL partook in data analysis and in writing and revising the manuscript. KO set up the study, performed data collection, statistical analysis, and revised the manuscript. RS set up the study, performed data collection, data analysis, and writing and revising of the manuscript. The manuscript has been read and approved for submission by all authors. All authors approve this version to be published.
Funding
This study was funded by H.K.H. Kronprinsessan Lovisas Förening för Barnasjukvård (Grant Number 2018-00459).
Conflict of Interest
The authors declare that the research was conducted in the absence of any commercial or financial relationships that could be construed as a potential conflict of interest.
Publisher's Note
All claims expressed in this article are solely those of the authors and do not necessarily represent those of their affiliated organizations, or those of the publisher, the editors and the reviewers. Any product that may be evaluated in this article, or claim that may be made by its manufacturer, is not guaranteed or endorsed by the publisher.
Supplementary Material
The Supplementary Material for this article can be found online at: https://www.frontiersin.org/articles/10.3389/fped.2021.755437/full#supplementary-material
References
1. World Health Organisation. GHO | By category | Number of deaths (thousands) - Data by WHO Region. WHO (2018). Available online at: http://apps.who.int/gho/data/view.main.CM1300N?lang=en (accessed October 3, 2020).
2. Berrington JE, Hearn RI, Bythell M, Wright C, Embleton ND. Deaths in preterm infants: changing pathology over 2 decades. J Pediatr. (2012) 160:49–53.e1. doi: 10.1016/j.jpeds.2011.06.046
3. Norman M, HAllberg B, Abrahamsson T, Björklund LJ, Domellöf M, Farooqi A, et al. Association between year of birth and 1-year survival among extremely preterm infants in Sweden during 2004-2007 and 2014-2016. JAMA. (2019) 321:1188–99. doi: 10.1001/jama.2019.2021
4. Stoll BJ, Hansen NI, Bell EF, Walsh MC, Carlo WA, Shankaran S, et al. Trends in care practices, morbidity, and mortality of extremely preterm neonates, 1993–2012. JAMA. (2015) 314:1039–51. doi: 10.1001/jama.2015.10244
5. Hoffsten A, Markasz L, Ericson K, Nelin LD, Sindelar R. The value of autopsy in preterm infants at a Swedish tertiary neonatal intensive care unit 2002–2018. Sci Rep. (2021) 11:14156. doi: 10.1038/s41598-021-93358-7
6. Rasiah V, Yajamanyam PK, Ewer AK. Necrotizing enterocolitis: current perspectives. RRN. (2014) 2014:31–42. doi: 10.2147/RRN.S36576
7. Travers CP, Clark RH, Spitzer AR, Das A, Gerite TJ, Carlo WA. Exposure to any antenatal corticosteroids and outcomes in preterm infants by gestational age: prospective cohort study. BMJ. (2017) 356:j1039. doi: 10.1097/01.aoa.0000527027.63123.44
8. Mizrahi A, Barlow O, Berdon W, Blanc WA, Silverman WA. Necrotizing enterocolitis in premature infants. J Pediatr. (1965) 66:697–705. doi: 10.1016/S0022-3476(65)80003-8
9. Javid PJ, Riggle KM, Smith C. Necrotizing enterocolitis and short bowel syndrome. In: Gleason CA, Juul SE, editors. Avery's Diseases of the Newborn. Seattle, WA: Elsevier. (2017). p. 1090–7.
10. Watkins DJ, Besner GE. The role of the intestinal microcirculation in necrotizing enterocolitis. Semin Pediatr Surg. (2013) 22:83–7. doi: 10.1053/j.sempedsurg.2013.01.004
11. Colomé G, Sierra C, Blasco J, García MV, Velverde E, Sánchez E. Intestinal permeability in different feedings in infancy. Acta Paediatr. (2007) 96:69–72. doi: 10.1111/j.1651-2227.2007.00030.x
12. Weaver LT, Laker MF, Nelson R, Lucas A. Milk feeding and changes in intestinal permeability and morphology in the newborn. J Pediatr Gastroenterol Nutr. (1987) 6:351–8. doi: 10.1097/00005176-198705000-00008
13. Dvorak B. Milk epidermal growth factor and gut protection. J Pediatr. (2010) 156:S31–5. doi: 10.1016/j.jpeds.2009.11.018
14. Patel RM, Knezevic A, Shenci N, Hinkes M, Keene S, Roback KA, et al. Association of red blood cell transfusion, anemia, and necrotizing enterocolitis in very low-birth-weight infants. JAMA. (2016) 315:889–97. doi: 10.1001/jama.2016.1204
15. Samuels N, van de Graaf RA, de Jonge RCJ, Reiss IKM, Vermeulen MJ. Risk factors for necrotizing enterocolitis in neonates: a systematic review of prognostic studies. BMC Pediatr. (2017) 17:105. doi: 10.1186/s12887-017-0847-3
16. Bisquera JA, Cooper TR, Berseth CL. Impact of necrotizing enterocolitis on length of stay and hospital charges in very low birth weight infants. Pediatrics. (2002) 109:423–428. doi: 10.1542/peds.109.3.423
17. Brunse A, Abbaspour A, Sangild PT. Brain barrier disruption and region-specific neuronal degeneration during necrotizing enterocolitis in preterm pigs. Dev Neurosci. (2018) 40:198–208. doi: 10.1159/000488979
18. Rich BS, Dolgin SE. Necrotizing enterocolitis. Pediatr Rev. (2017) 38:552–9. doi: 10.1542/pir.2017-0002
19. Bell MJ, Ternberg JL, Feigin RD, Keating JP, Marshall R, Barton L, et al. Neonatal necrotizing enterocolitis. Therapeutic decisions based upon clinical staging. Ann. Surg. (1978) 187:1–7. doi: 10.1097/00000658-197801000-00001
20. Walsh MC, Kliegman RM. Necrotizing enterocolitis: treatment based on staging criteria. Pediatr Clin North Am. (1986) 33:179–201. doi: 10.1016/S0031-3955(16)34975-6
21. Palleri E, Aghamn I, Bexelius TS, Bartocci M, Wester T. The effect of gestational age on clinical and radiological presentation of necrotizing enterocolitis. J Pediatr Surg. (2018) 53:1660–4. doi: 10.1016/j.jpedsurg.2017.09.018
22. Lin PW, Stoll BJ. Necrotising enterocolitis. Lancet. (2006) 368:1271–83. doi: 10.1016/S0140-6736(06)69525-1
23. Nantais-Smith L, Kadrofske M. Noninvasive biomarkers of necrotizing enterocolitis. J Perin Neonatal Nurs. (2015) 29:69–80. doi: 10.1097/JPN.0000000000000082
24. Aydemir O, Aydemir C, Sarkabadayi YU, Canpolat FE, Erdeve O, Biyyikli Z, et al. Fecal calprotectin levels are increased in infants with necrotizing enterocolitis. J Maternal Fetal Neonatal Med. (2012) 25:2237–41. doi: 10.3109/14767058.2012.684172
25. Garg BD, Sharma D, Bansal A. Biomarkers of necrotizing enterocolitis: a review of literature. J Maternal Fetal Neonatal Med. (2018) 31:3051–64. doi: 10.1080/14767058.2017.1361925
26. Terrin G, Stronati L, Cucchiara S, De Curtis M. Serum markers of necrotizing enterocolitis: a systematic review. J Pediatr Gastroenterol Nutr. (2017) 65:e120. doi: 10.1097/MPG.0000000000001588
27. Josefsson S, Bunn SK, Domellöf M. Fecal calprotectin in very low birth weight infants. J Pediatr Gastroenterol Nutr. (2007) 44:407–13. doi: 10.1097/MPG.0b013e3180320643
28. Däbritz J, Jenke A, Wirth S, Foell D. Fecal phagocyte-specific S100A12 for diagnosing necrotizing enterocolitis. J Pediatr. (2012) 161:1059–64. doi: 10.1016/j.jpeds.2012.06.003
29. Olsson KW, Larsson A, Jonzon A, Sindelar R. Exploration of potential biochemical markers for persistence of patent ductus arteriosus in preterm infants at 22-27 weeks' gestation. Pediatr Res. (2019) 86:333–8. doi: 10.1038/s41390-018-0182-x
30. Olink. Proximity Extension Assay (PEA) Technology. Olink (2020). Available online at: https://www.olink.com/data-you-can-trust/technology/ (accessed April 9, 2020).
31. de Hoon MJL, Imoto S, Nolan J, Miyano S. Open source clustering software. Bioinformatics. (2004) 20:1453–4. doi: 10.1093/bioinformatics/bth078
32. Saldanha AJ. Java Treeview–extensible visualization of microarray data. Bioinformatics. (2004) 20:3246–8. doi: 10.1093/bioinformatics/bth349
33. The Human Protein Atlas Project. Tissue expression of VIM - Summary - The Human Protein Atlas. The Human Protein Atlas. Available online at: https://www.proteinatlas.org/ENSG00000026025-VIM/tissue (accessed October 23, 2020).
34. Boros É, Csatári M, Varga C, Bálint B, Nagy I. Specific gene- and microRNA-expression pattern contributes to the epithelial to mesenchymal transition in a rat model of experimental colitis. Mediators Inflamm. (2017) 2017:5257378. doi: 10.1155/2017/5257378
35. Mor-Vaknin N, Legendre M, Yu Y, Serezani CHC, Garg SK, Jatzek A, et al. Murine colitis is mediated by vimentin. Sci Rep. (2013) 3:1045. doi: 10.1038/srep01045
36. Laguna T, Notario L, Pippa R, Fontela M, Vázquez B, Maicas M, et al. New insights on the transcriptional regulation of CD69 gene through a potent enhancer located in the conserved non-coding sequence 2. Mol Immunol. (2015) 66:171–9. doi: 10.1016/j.molimm.2015.02.031
37. Ge Y, Gong M, Colliou N, Zadeh M, Li J, Jones DP, et al. Neonatal intestinal immune regulation by the commensal bacterium, P. UF1. Mucosal Immunol. (2019) 12:434–44. doi: 10.1038/s41385-018-0125-1
38. Arthur CM, Nalbant D, Feldman HA, Saeedi BJ, Matthews J, Kamili NA, et al. Anemia induces gut inflammation and injury in an animal model of preterm infants. Transfusion. (2019) 59:1233–45. doi: 10.1111/trf.15254
39. Brait VH, Miró-Mur F, Pérez-de-Puig I, Notario L, Hurtado B, Pedragosa J, et al. CD69 plays a beneficial role in ischemic stroke by dampening endothelial activation. Circ Res. (2019) 124:279–91. doi: 10.1161/CIRCRESAHA.118.313818
40. Harbige LS, Pinto E, Allgrove J, Thomas LV. Immune Response of healthy adults to the ingested probiotic lactobacillus casei Shirota. Scand J Immunol. (2016) 84:353–64. doi: 10.1111/sji.12495
41. Yu L, Yang F, Zhang F, Guo D, Li L, Wang J, et al. CD69 enhances immunosuppressive function of regulatory T-cells and attenuates colitis by prompting IL-10 production. Cell Death Dis. (2018) 9:905. doi: 10.1038/s41419-018-0927-9
42. Cho SX, Berger PJ, Nold-Petry CA, Nold MF. The immunological landscape in necrotising enterocolitis. Expert Rev Mol Med. (2016) 18:e12. doi: 10.1017/erm.2016.13
43. Olsson KW, Sindelar R. Early Biochemical markers associated with development of necrotizing enterocolitis. Pediatr Neonat Individualized Med. (2017) 6:e060244. doi: 10.7363/060244
44. Ye LL, Wei XS, Zhang M, Niu YR, Zhou Q. The significance of tumor necrosis factor receptor type II in CD8+ regulatory t cells and CD8+ effector T cells. Front Immunol. (2018) 9:583. doi: 10.3389/fimmu.2018.00583
45. Feng Y, Teitelbaum DH. Tumour necrosis factor-α-induced loss of intestinal barrier function requires TNFR1 and TNFR2 signalling in a mouse model of total parenteral nutrition. J Physiol. (2013) 591:3709–23. doi: 10.1113/jphysiol.2013.253518
46. Su L, Nalle SC, Shen L, Turner ES, Singh G, Breskin LA, et al. TNFR2 activates MLCK-dependent tight junction dysregulation to cause apoptosis-mediated barrier loss and experimental colitis. Gastroenterology. (2013) 145:407–15. doi: 10.1053/j.gastro.2013.04.011
47. Boros P, Miller CM. Hepatocyte growth factor: a multifunctional cytokine. Lancet. (1995) 345:293–5. doi: 10.1016/S0140-6736(95)90279-1
48. MohanKumar K, Namachivayam K, Ho TTB, Torres BA, Ohls RK, Maheshwari A. Cytokines and growth factors in the developing intestine and during necrotizing enterocolitis. Semin Perinatol. (2017) 41:52–60. doi: 10.1053/j.semperi.2016.09.018
49. Jimenez-Gomez G, Benavente-Fernandez I, Lubian-Lopez SP, Matias-Vega M, Lechuga-Campoy JL, Saez-Benito A, et al. Hepatocyte growth factor as an indicator of neonatal maturity. J Pediatr Endocrinol Metab. (2013) 26:709–14. doi: 10.1515/jpem-2012-0303
50. Kurauchi O, Itakura A, Ando H, Kuno N, Mizutani S, Tomoda Y. The concentration of hepatocyte growth factor (HGF) in human amniotic fluid at second trimester: relation to fetal birth weight. Horm Metab Res. (1995) 27:335–8. doi: 10.1055/s-2007-979973
51. Tjoa ML, Mulders MAM, van Vugt JMG, Blankenstein MA, Oudejans CBM, van Wijk IJ. Plasma hepatocyte growth factor as a marker for small-for-gestational age fetuses. Eur J Obstetr Gynecol Reprod Biol. (2003) 110:20–5. doi: 10.1016/S0301-2115(03)00083-6
52. Jain SK, Baggerman EW, MohanKumar K, Namachivayam K, Jagadeeswaran R, Reyes VE, et al. Amniotic fluid-borne hepatocyte growth factor protects rat pups against experimental necrotizing enterocolitis. Am J Physiol Gastrointest Liver Physiol. (2014) 306:G361–9. doi: 10.1152/ajpgi.00272.2013
53. Itoh H, Naganuma S, Takeda N, Miyata S, Uchinokura S, Fukushima T, et al. Regeneration of injured intestinal mucosa is impaired in hepatocyte growth factor activator-deficient mice. Gastroenterology. (2004) 127:1423–35. doi: 10.1053/j.gastro.2004.08.027
54. Janckila AJ, Yam LT. Biology and clinical significance of tartrate-resistant acid phosphatases: new perspectives on an old enzyme. Calcif Tissue Int. (2009) 85:465–83. doi: 10.1007/s00223-009-9309-8
55. Lång P, Lange S, Delbro D, Andersson G. Induction and cellular expression of tartrate resistant acid phosphatase during dextran sodium sulphate induced colitis in rats. Histochem Cell Biol. (2009) 132:599–612. doi: 10.1007/s00418-009-0647-4
56. Schwarzer R, Jiao H, Wachsmuth L, Tresch A, Pasparakis M. FADD and caspase-8 regulate gut homeostasis and inflammation by controlling MLKL- and GSDMD-mediated death of intestinal epithelial cells. Immunity. (2020) 52:978–93.e6. doi: 10.1016/j.immuni.2020.04.002
57. Welz PS, Wullaert A, Vlantis K, Kondylis V, Fernández-Majada V, Ermolaeva M, et al. FADD prevents RIP3-mediated epithelial cell necrosis and chronic intestinal inflammation. Nature. (2011) 477:330–4. doi: 10.1038/nature10273
58. Zhang J, Xu M, Zhou W, Li D, Zhang H, Chen Y, et al. Deficiency in the anti-apoptotic protein DJ-1 promotes intestinal epithelial cell apoptosis and aggravates inflammatory bowel disease via p53. J Biol Chem. (2020) 295:4237–51. doi: 10.1074/jbc.RA119.010143
59. Murchie R, Guo CH, Persaud A, Muise A, Rotin D. Protein tyrosine phosphatase σ targets apical junction complex proteins in the intestine and regulates epithelial permeability. Proc Natl Acad Sci USA. (2014) 111:693–8. doi: 10.1073/pnas.1315017111
60. Solaymani-Mohammadi S, Singer SM. Regulation of intestinal epithelial cell cytoskeletal remodeling by cellular immunity following gut infection. Mucosal Immunol. (2013) 6:369–78. doi: 10.1038/mi.2012.80
61. Edelson MB, Bagwell CE, Rozycki HJ. Circulating pro- and counterinflammatory cytokine levels and severity in necrotizing enterocolitis. Pediatrics. (1999) 103:766–71. doi: 10.1542/peds.103.4.766
62. Almohazey D, Lo YH, Vossler CV, Simmons AJ, Hsieh JJ, Bukar EB, et al. The ErbB3 receptor tyrosine kinase negatively regulates Paneth cells by PI3K-dependent suppression of Atoh1. Cell Death Differ. (2017) 24:855–65. doi: 10.1038/cdd.2017.27
63. Frey MR, Brent Polk D. ErbB receptors and their growth factor ligands in pediatric intestinal inflammation. Pediatr Res. (2014) 75:127–32. doi: 10.1038/pr.2013.210
64. McElroy SJ, Castle SL, Bernard JK, Almohazey D, Hunter CJ, Bell BA, et al. The ErbB4 ligand neuregulin-4 protects against experimental necrotizing enterocolitis. Am J Pathol. (2014) 184:2768–78. doi: 10.1016/j.ajpath.2014.06.015
65. Sugimoto N, Rui T, Yang M, Bharwani S, Handa O, Yoshida N, et al. Points of control exerted along the macrophage-endothelial cell-polymorphonuclear neutrophil axis by PECAM-1 in the innate immune response of acute colonic inflammation. J Immunol. (2008) 181:2145–54. doi: 10.4049/jimmunol.181.3.2145
66. Rijcken E, Menningen RB, Schaefer SD, Laukoetter MG, Anthoni C, Spiegel HU, et al. PECAM-1 (CD 31) mediates transendothelial leukocyte migration in experimental colitis. Am J Physiol Gastrointest Liver Physiol. (2007) 293:G446–52. doi: 10.1152/ajpgi.00097.2007
67. Ataseven H, Oztürk ZA, Arhan M, Yüksel O, Köklü S, Ibiş M, et al. Cancer antigen 125 levels in inflammatory bowel diseases. J Clin Lab Anal. (2009) 23:244–8. doi: 10.1002/jcla.20323
68. Yamamoto-Furusho JK, Ascaño-Gutiérrez I, Furuzawa-Carballeda J, Fonseca-Camarillo G. Differential expression of MUC12, MUC16, and MUC20 in patients with active and remission ulcerative colitis. Mediators Inflamm. (2015) 2015:659018. doi: 10.1155/2015/659018
69. Egan CE, Sodhi CP, Good M, Lin J, Jia H, Yamagichi Y, et al. Toll-like receptor 4–mediated lymphocyte influx induces neonatal necrotizing enterocolitis. J Clin Invest. (2016) 126:495–508. doi: 10.1172/JCI83356
70. Trivedi PJ, Bruns T, Ward S, Mai M, Schmidt C, Hirschfield GM, et al. Intestinal CCL25 expression is increased in colitis and correlates with inflammatory activity. J Autoimmun. (2016) 68:98–104. doi: 10.1016/j.jaut.2016.01.001
71. SNQ Report Group. Årsrapport 2018, Yearly Report 2018. (2019). Vol. 103. Available online at: https://www.medscinet.com/PNQ/uploads/website/arsrapporter/Neonatalregistrets%20%C3%85rsrapport%202018._3.0.pdf (accessed September 30, 2020).
72. Avery ME. Surface properties in relation to atelectasis and hyaline membrane disease. Arch Pediatr Adolesc Med. (1959) 97:517. doi: 10.1001/archpedi.1959.02070010519001
73. Ballabh P. Intraventricular hemorrhage in premature infants: mechanism of disease. Pediatr Res. (2010) 67:1–8. doi: 10.1203/PDR.0b013e3181c1b176
74. Bancalari E, Claure N, Sosenko IRS. Bronchopulmonary dysplasia: changes in pathogenesis, epidemiology and definition. Semin Fetal Neonatal Med. (2003) 8:63–71. doi: 10.1016/S1084-2756(02)00192-6
75. Håkansson S, Lilja M, Jacobsson B, Källén K. Reduced incidence of neonatal early-onset group B streptococcal infection after promulgation of guidelines for risk-based intrapartum antibiotic prophylaxis in Sweden: analysis of a national population-based cohort. Acta Obstet Gynecol Scand. (2017) 96:1475–1483. doi: 10.1111/aogs.13211
Keywords: necrotizing enterocolitis, biomarker, preterm infant, cluster analysis, serum
Citation: Hoffsten A, Markasz L, Lilja HE, Olsson KW and Sindelar R (2021) Early Postnatal Comprehensive Biomarkers Cannot Identify Extremely Preterm Infants at Risk of Developing Necrotizing Enterocolitis. Front. Pediatr. 9:755437. doi: 10.3389/fped.2021.755437
Received: 08 August 2021; Accepted: 16 September 2021;
Published: 22 October 2021.
Edited by:
Yuan Shi, Children's Hospital of Chongqing Medical University, ChinaReviewed by:
Lu-Quan Li, Chongqing Medical University, ChinaShan He, The First People's Hospital of Yunnan Province, China
Copyright © 2021 Hoffsten, Markasz, Lilja, Olsson and Sindelar. This is an open-access article distributed under the terms of the Creative Commons Attribution License (CC BY). The use, distribution or reproduction in other forums is permitted, provided the original author(s) and the copyright owner(s) are credited and that the original publication in this journal is cited, in accordance with accepted academic practice. No use, distribution or reproduction is permitted which does not comply with these terms.
*Correspondence: Alice Hoffsten, alice.hoffsten@kbh.uu.se