 Jane Robertson1,2
 Kotoji Iwamoto1*
 Iris Hoxha3
 Lilit Ghazaryan4
 Vafa Abilova5
 Ana Cvijanovic6
 Halina Pyshnik7Marina Darakhvelidze8Larissa Makalkina9
 Arianit Jakupi10†Aigul Dzhakubekova11Angela Carp12Lidija Cizmovic13Svetlana Rachina14Vesela Radonjic15,16
 Salomudin Yusufi17Mesil Aksoy18Muhabbat Ibragimova19
 Brian Godman20,21,22,23Hans Kluge1Hanne Bak Pedersen1
  on behalf of the WHO Europe AMC Network
- 1World Health Organization Regional Office for Europe, Copenhagen, Denmark
- 2Department of Clinical Pharmacology, The University of Newcastle, Callaghan, NSW, Australia
- 3Department of Pharmacy, University of Medicine, Tirana, Tirana, Albania
- 4Scientific Centre of Drug and Medical Technology Expertise, Ministry of Health, Yerevan, Armenia
- 5Department of Import Medicines and Medical Devices, Analytical Expertise Center, Ministry of Health, Baku, Azerbaijan
- 6Sector for Providing Information on Drugs and Medical Products, Agency for Medicinal Products and Medical Devices of Bosnia and Herzegovina, Sarajevo, Bosnia and Herzegovina
- 7Department of Pharmaceutical Inspection and Organization of Medicinal Supply, Ministry of Health of the Republic of Belarus, Minsk, Belarus
- 8Health Care Department, Ministry of IDPs, Labour, Health and Social Affairs of Georgia, Tbilisi, Georgia
- 9Department of Cardiology and Internal Medicine with a Course of Clinical Pharmacology and Pharmacy Astana Medical University, Astana, Kazakhstan
- 10A2 – Pharmaceutical Consulting and UBT – Higher Education Institution, Pristina, Kosovo†
- 11Specialized Expertise of Medicines Unit, Department of Drug Provision and Medical Devices, Ministry of Health, Bishkek, Kyrgyzstan
- 12P.I. Coordination, Implementation and Monitoring Unit of the Health System Projects, Chişinãu, Moldova
- 13Department for Establishing Maximum Prices and Monitoring Consumption of Medicines, Agency for Medicines and Medical Devices, Podgorica, Montenegro
- 14Internal Medicine Department with Cardiology and Functional Diagnostics Course, Russian Friendship University, Moscow, Russia
- 15National Centre for Information on Medicines and Medical Device, Medicines and Medical Devices Agency of Serbia, Belgrade, Serbia
- 16Department of Pharmacy, Faculty of Medical Sciences, University of Kragujevac, Kragujevac, Serbia
- 17Vice-Rector for Science, Avicenna Tajik State Medical University, Dushanbe, Tajikistan
- 18Turkish Medicines and Medical Devices Agency, Department of Rational Use of Medicines, Ministry of Health, Ankara, Turkey
- 19Head of the Information and Analytical Department, The State Center for Expertise and Standardization of Medicines, Medical Devices and Medical Equipment of the Agency for the Development of the Pharmaceutical Industry under the Ministry of Health of the Republic of Uzbekistan, Tashkent, Uzbekistan
- 20Strathclyde Institute of Pharmacy and Biomedical Sciences, University of Strathclyde, Glasgow, United Kingdom
- 21Liverpool Health Economics, University of Liverpool, Liverpool, United Kingdom
- 22Division of Clinical Pharmacology, Karolinska Institute, Karolinska University Hospital Huddinge, Stockholm, Sweden
- 23Department of Public Health Pharmacy and Management, School of Pharmacy, Sefako Makgatho Health Sciences University, Pretoria, South Africa
Introduction: Surveillance of antimicrobial medicines consumption is central to improving their use and reducing resistance rates. There are few published data on antibiotic consumption in Eastern Europe and Central Asia. To address this, 18 non-European Union (EU) countries and territories contribute to the WHO Regional Office for Europe (WHO Europe) Antimicrobial Medicines Consumption (AMC) Network.
Objectives: (i) Analyze 2015 consumption of J01 class antibacterials for systemic use from 16 AMC Network members; (ii) compare results with 2011 data and 2015 ESAC-Net estimates; (iii) assess consumption against suggested indicators; (iv) evaluate the impact of planned changes to defined daily doses (DDDs) in 2019 for some commonly used antibiotics; and (v) consider the utility of quantitative metrics of consumption for policy action.
Methods: Analysis methods are similar to ESAC-Net for EU countries. The Anatomical Therapeutic Chemical (ATC) classification and DDD methodology were used to calculate total consumption (DDD/1000 inhabitants/day [DID]), relative use measures (percentages), extent of use of WHO Watch and Reserve group antibiotics and impact of DDD changes.
Findings: Total J01 consumption in 2015 ranged 8.0–41.5 DID (mean 21.2 DID), generally lower than in 2011 (6.4–42.3 DID, mean 23.6 DID). Beta-lactam penicillins, cephalosporins, and quinolones represented 16.2–56.6, 9.4–28.8, and 7.5–24.6% of total J01 consumption, respectively. Third-generation cephalosporins comprised up to 90% of total cephalosporin consumption in some countries. Consumption of WHO Reserve antibiotics was very low; Watch antibiotics comprised 17.3–49.5% of total consumption (mean 30.9%). Variability was similar to 2015 ESAC-Net data (11.7–38.3 DID; mean 22.6 DID). DDD changes in 2019 impact both total and relative consumption estimates: total DIDs reduced on average by 12.0% (7.3–35.5 DID), mostly due to reduced total DDDs for commonly used penicillins; impact on rankings and relative use estimates were modest.
Discussion: Quantitative metrics of antibiotic consumption have value. Improvements over time reflect national activities, however, changes in total volumes may conceal shifts to less desirable choices. Relative use measures targeting antibiotics of concern may be more informative. Some, including WHO Watch and Reserve classifications, lend themselves to prescribing targets supported by guidelines and treatment protocols.
Introduction
The rise in antimicrobial resistance (AMR) is a growing public health concern impacting on morbidity, mortality and costs, calling for urgent action as local problems with resistance become a global threat (Gandra et al., 2014; Michael et al., 2014; Taylor et al., 2014; O’Neill, 2015; Prestinaci et al., 2015; Jinks et al., 2016; United Nations, 2016; Jakovljevic et al., 2018). Strengthening the evidence base through surveillance of AMR and antimicrobial medicines consumption, and optimizing antimicrobial medicines use in human and animal health, are two of the five objectives of the Global Action Plan (GAP) to reduce AMR (World Health Organization, 2015). To implement the GAP, the World Health Assembly in 2015 urged Member States to develop national action plans on AMR that aligned with the objectives of the GAP (World Health Organization, 2016). Routine data collection on antimicrobial consumption in Europe predated the GAP, with reference data on antimicrobial medicines consumption from European Union (EU) member countries along with Norway and Iceland available from 1997 (European Centre for Disease Prevention and Control [ECDC], 2018). The European Surveillance of Antimicrobial Consumption (ESAC) Network (ESAC-Net) utilizes standardized methods to collect and analyze antimicrobial consumption data for both the community and the hospital sector [European Centre for Disease Control (ECDC), 2018]. Since 2011, similar methods have been used in the WHO Regional Office for Europe (WHO Europe) Antimicrobial Medicines Consumption (AMC) Network to estimate antimicrobial medicines consumption in 18 non-EU countries and territories of the WHO European region. As with ESAC-Net, data collection is based on the WHO Anatomical Therapeutic Chemical (ATC) classification system and defined daily doses (DDDs) methodology (WHO Collaborating Centre for Drug Statistics Methodology, 2018a,b). This work supplements local studies on patterns of antimicrobial consumption (Stratchounski et al., 2001; Malo et al., 2014; Smiljanic et al., 2016).
2011 data from selected countries of the WHO Europe AMC Network were published in 2014 and an analysis of AMC data for 2011–2014 published in 2017 (Versporten et al., 2014; World Health Organization Regional Office for Europe, 2017a). Both analyses reported total consumption of J01 antibacterials for systemic use (DDD per 1000 inhabitants per day [DID]), and the relative use of different pharmacological subgroups including tetracyclines, penicillins, cephalosporins, aminoglycosides, macrolides, and quinolones. These analyses also reported the relative consumption of agents recommended as second-line treatment choices including cephalosporins (particularly third- and fourth-generation agents) and quinolones on the basis that these metrics might focus attention on areas where antibiotic use could be improved. Despite some differences in data sources used and differences in levels of expenditure on medicines between Western and Eastern Europe (Jakovljevic et al., 2016), comparisons between ESAC-Net and AMC data were presented, giving a pan-European perspective on antibiotic consumption (Versporten et al., 2014; World Health Organization Regional Office for Europe, 2017a). Since then, a new classification of antibiotics introduced by WHO and some significant changes to DDD values that will take effect in 2019 have increased the range of metrics that might be reported and will affect the interpretation of some existing measures of antibiotic consumption. In addition, a number of members of the AMC Network have reviewed their antibiotic utilization patterns alongside ongoing policies to improve utilization to provide guidance for the future (Abilova et al., 2018; Bojanic et al., 2018), building on activities among European countries (Adriaenssens et al., 2011; Malo et al., 2014; Smith et al., 2014; Furst et al., 2015). There have also been activities among AMC Network countries and areas to improve the knowledge and activities of community pharmacists regarding the treatment of infections in ambulatory care as pharmacists are often the first point of contact for patients (Markovic-Pekovic et al., 2017; Hoxha et al., 2018). This builds on proposed WHO activities among pharmacists in Europe (World Health Organization Regional Office for Europe, 2014).
In April 2017, the Expert Committee on the Selection and Use of Essential Medicines recommended changes to the WHO Model Lists of Essential Medicines for adults (EML) and children (EMLc), following a comprehensive review of sections 6.2.1 (Beta-lactam medicines) and 6.2.2 (Other antibacterials) (World Health Organization, 2017c). After reviewing up-to-date evidence summaries on the treatment of 21 priority infectious conditions (based on disease burden, severity of illness and prospects for improving antibiotic use), five pediatric infectious syndromes and several sexually transmitted infections (World Health Organization, 2017a), the Committee identified empirical first- and second-choice treatments for common, community-acquired infections, focusing on treatment choices broadly applicable in most countries (Sharland et al., 2018). The Expert Committee also proposed a categorization of antibiotics into Access, Watch, and Reserve groups (Boxes 1, 2), taking account of recommendations of WHO and OIE (World Organisation for Animal Health) for the management of antibacterials that are critically important for both human and animal health (World Organisation for Animal Health, 2015; World Health Organization, 2017b). Not all medicines on the Model Lists were assigned to the three groups, leaving a fourth “ungrouped” category, with the classification to be revised as additional clinical syndromes are reviewed (Sharland et al., 2018). However, this classification could support antimicrobial stewardship efforts and focus attention on prescribing practices that should be further reviewed.
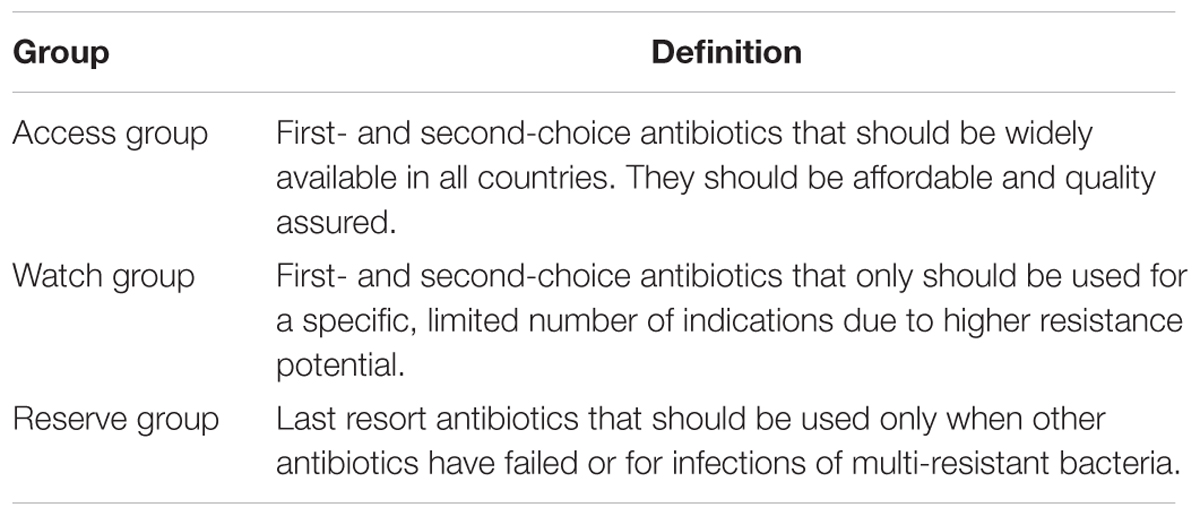
BOX 1. WHO categories of antibiotics – descriptions.
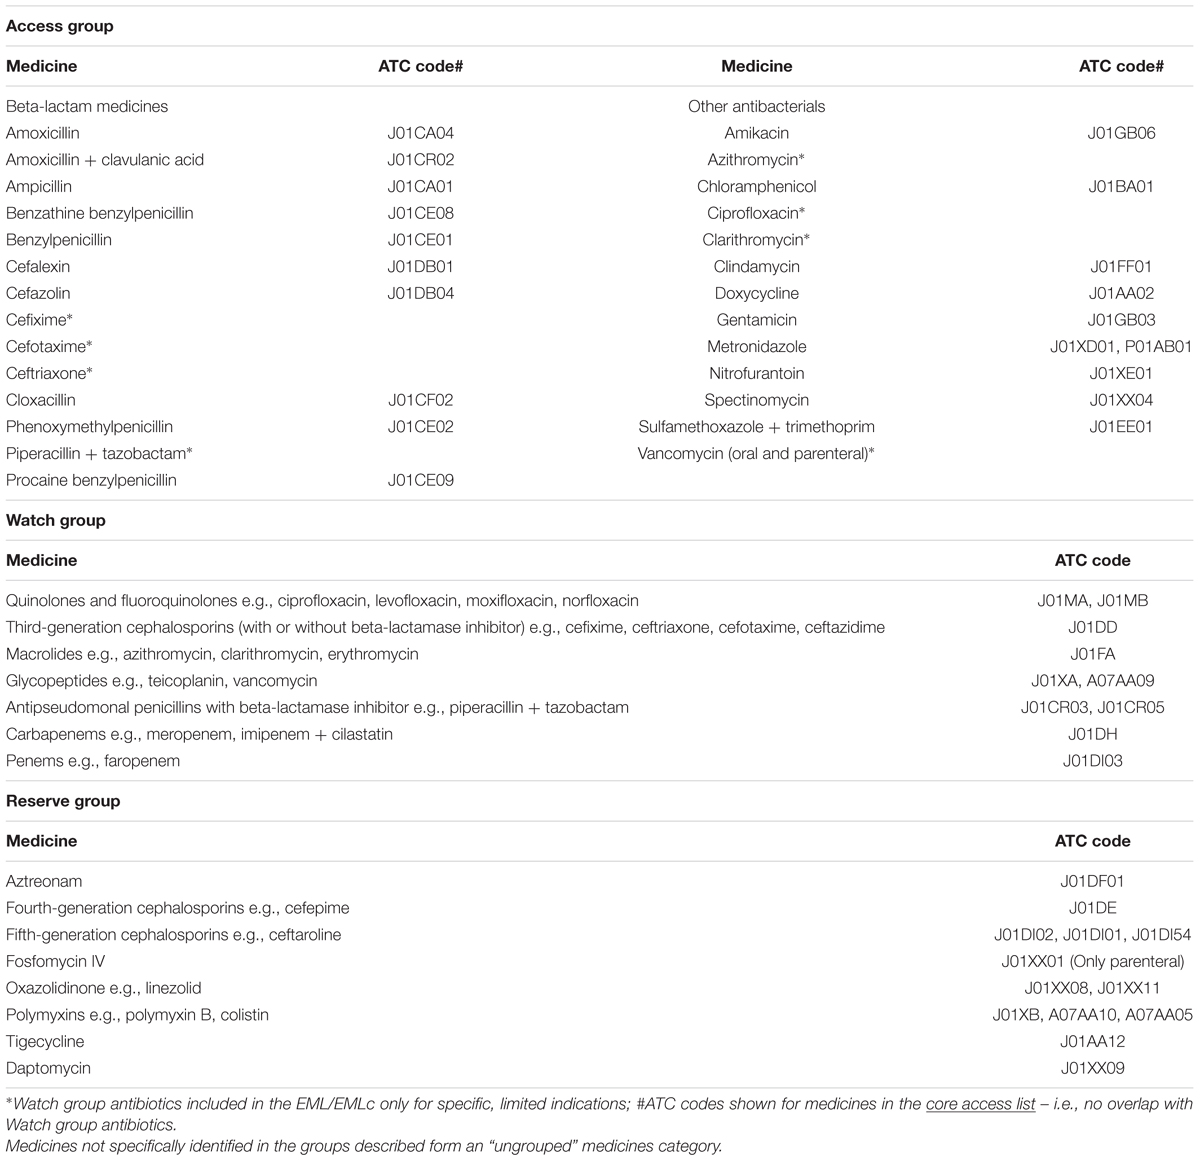
BOX 2. Medicines assigned to WHO access, watch, and reserve groups.
Following an application from the European Centre for Disease Control (ECDC), in October 2017 the WHO International Working Group for Drug Statistics Methodology recommended changes to the DDDs for seven commonly used antibiotics (mainly penicillins), and endorsed new DDDs for oral colistin along with changes for a number of other products (Box 3) (WHO Collaborating Centre for Drug Statistics Methodology, 2018c). The changes were requested given evidence that current DDD allocations for commonly used medicines differed substantially from recommended doses and doses used in clinical practice. The DDD changes will be fully adopted in 2019 and will affect estimates of total antibiotic medicines consumption, relative use of classes of antibiotics and interpretation of national and cross-national comparisons over time.
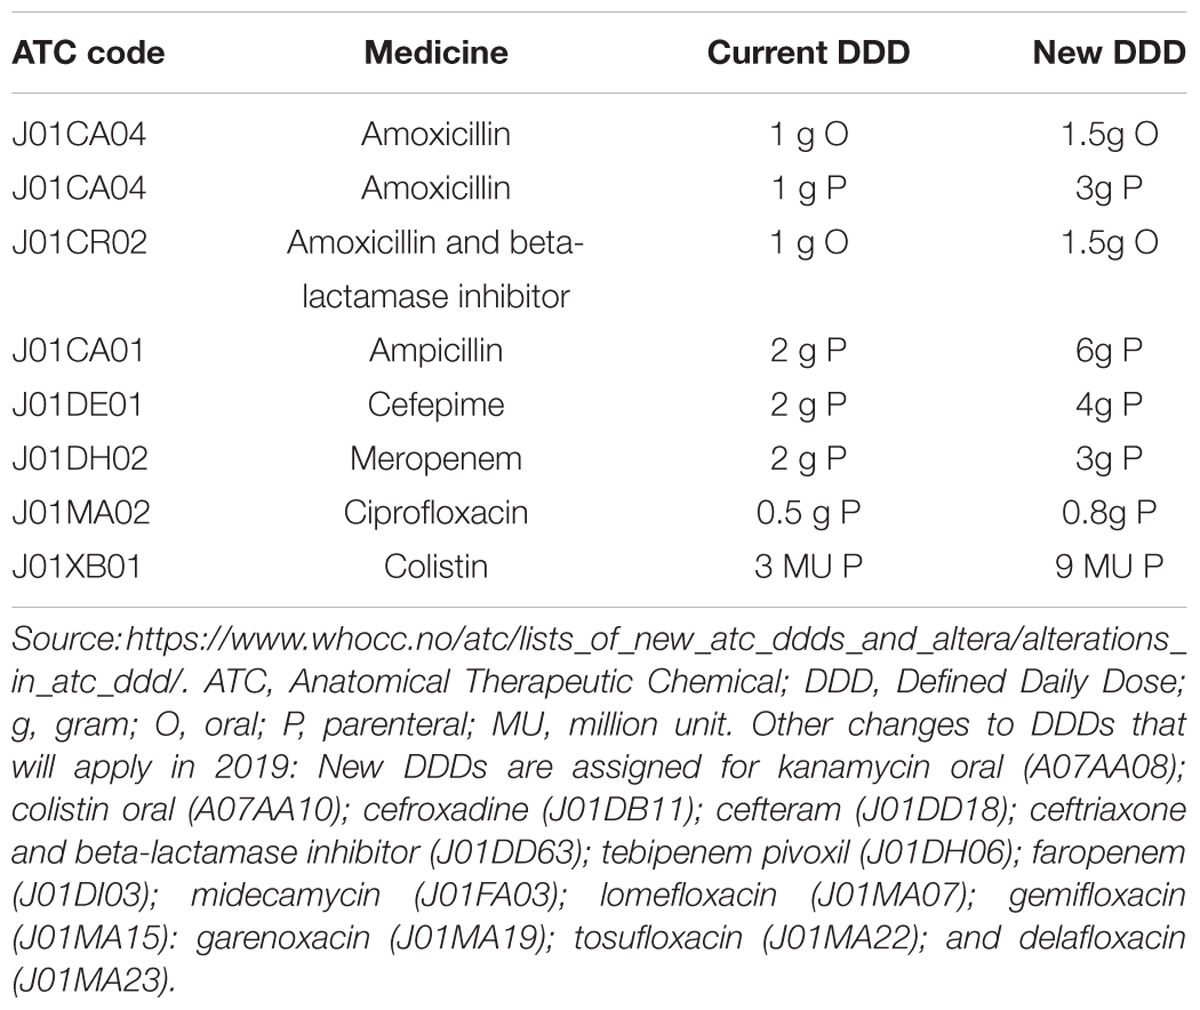
BOX 3. 2019 changes to DDDs for commonly prescribed J01 antibacterials.
This study presents updated data from the WHO Europe AMC Network using cross-national comparisons of 2015 antibiotic consumption data for 16 network members where the Ministry of Health approved data sharing and publication. Consumption estimates for 2011 and 2015 are compared; the WHO “Watch” and “Reserve” classification of antibiotics is applied, and the impact of proposed changes to DDDs in 2019 are examined. In addition, we consider the information value of different quantitative metrics to policymakers, consumers, and health care professionals to provide future guidance.
Materials and Methods
Participating Countries and Areas
Sharing of the 2015 data was approved for 16 of 18 AMC Network members – Albania, Armenia, Azerbaijan, Bosnia and Herzegovina, Belarus, Georgia, Kazakhstan, Kyrgyzstan, Republic of Moldova, Montenegro, Russian Federation, Serbia, Tajikistan, Turkey, Uzbekistan, and Kosovo [in accordance with Security Council resolution 1244 (1999)].
Data Collection
The methods used in the AMC Network have been described elsewhere (Versporten et al., 2014; World Health Organization Regional Office for Europe, 2017a). Briefly, data collection follows a standardized protocol using an Excel template based on a national register of antimicrobial medicines with marketing authorization. Products are identified by ATC code facilitating analyses from the main class (level 1) to individual medicines (level 5). National AMC focal points enter data on the numbers of packages of each product imported or sold in their country, relevant product information, population data, and assigned DDD (World Health Organization Regional Office for Europe, 2017a; Table A1).
The core medicines monitored are the antibacterials for systemic use (ATC group J01); antibiotics for alimentary tract and metabolism (A07AA); and nitroimidazole derivatives against amoebiasis and other protozoal diseases (P01AB). There is optional data collection for antimycotics (J02), antifungals (D01BA), and antivirals for systemic use (J05), drugs for treatment of tuberculosis (J04A) and antimalarials (P01B). Only data for the core medicines are presented here.
Data Sources
Import data from customs records and declaration forms is the most commonly reported source of information supplemented with sales records from market authorization holders, local manufacturing estimates, wholesaler records, and in some cases, commercial data sources (see Supplementary Table 1). Data represent total consumption estimates with the exception of Kazakhstan where a commercial data source provides coverage of around 80–85% of hospital and community sales.
Data Validation
A template macro detects missing compulsory data and incorrect data units. WHO Europe also reviews entries to identify data inconsistencies, improbable estimates, errors in estimates for combination products when converted to standardized units, and a final data set for analysis is agreed.
Data Analysis and Metrics Reported
Total numbers of DDDs for each product are aggregated to give the total number of DDDs at the desired ATC code level and adjusted for population to calculate DID. World Bank population estimates were applied apart from Turkey, where estimates were adjusted to take account of the large refugee and displaced persons populations. Results are compared to publicly available 2015 ESAC-Net data that are derived using similar methods (European Centre for Disease Control [ECDC], 2017).
Measures of relative consumption, expressed as a percentage of total consumption of groups of antimicrobials, were derived for pharmacological subgroups of J01, cephalosporins and quinolones as a proportion of total J01 consumption, cephalosporins by generation of agent, and for WHO Watch and Reserve groups of antibiotics. These relative use measures demonstrate the extent of consumption of second-line and last resort antibiotics. Means, medians, and ranges of estimates are presented to illustrate the variability of the 16 national datasets.
Changes in total and relative consumption between 2011 and 2015 are reported. The impact of changes to assigned DDDs in 2019 is explored for total consumption and relative consumption estimates by applying DDDs for 2019 to numbers of packages consumed in 2015. Change was calculated as the percentage increase or decrease in total DDDs from the 2015 estimate using 2016 DDD values.
Role of the Funding Source
The funder (Netherlands Ministry of Health, Welfare and Sport) had no role in study design, data collection, data analysis, data interpretation, or writing the report.
Results
Total antibiotic consumption (ATC group J01) in 2015 ranged from 41.5 DID in Turkey to 8.0 DID in Azerbaijan (Figure 1). Mean and median consumption were 21.2 and 19.0 DID, respectively. The relative use of parenteral formulations varied from 4% in Turkey and Bosnia and Herzegovina to 52% in Uzbekistan (see Supplementary Figure 1). Beta-lactam penicillins (ATC group J01C) were the most commonly used antibiotics in almost all AMC Network countries, ranging from 56.6% of total J01 consumption in Kyrgyzstan to 16.2% in Georgia. In Georgia, highest relative consumption was reported for medicines in the sulfonamides and trimethoprim group (J01E, 26.4% of total consumption).
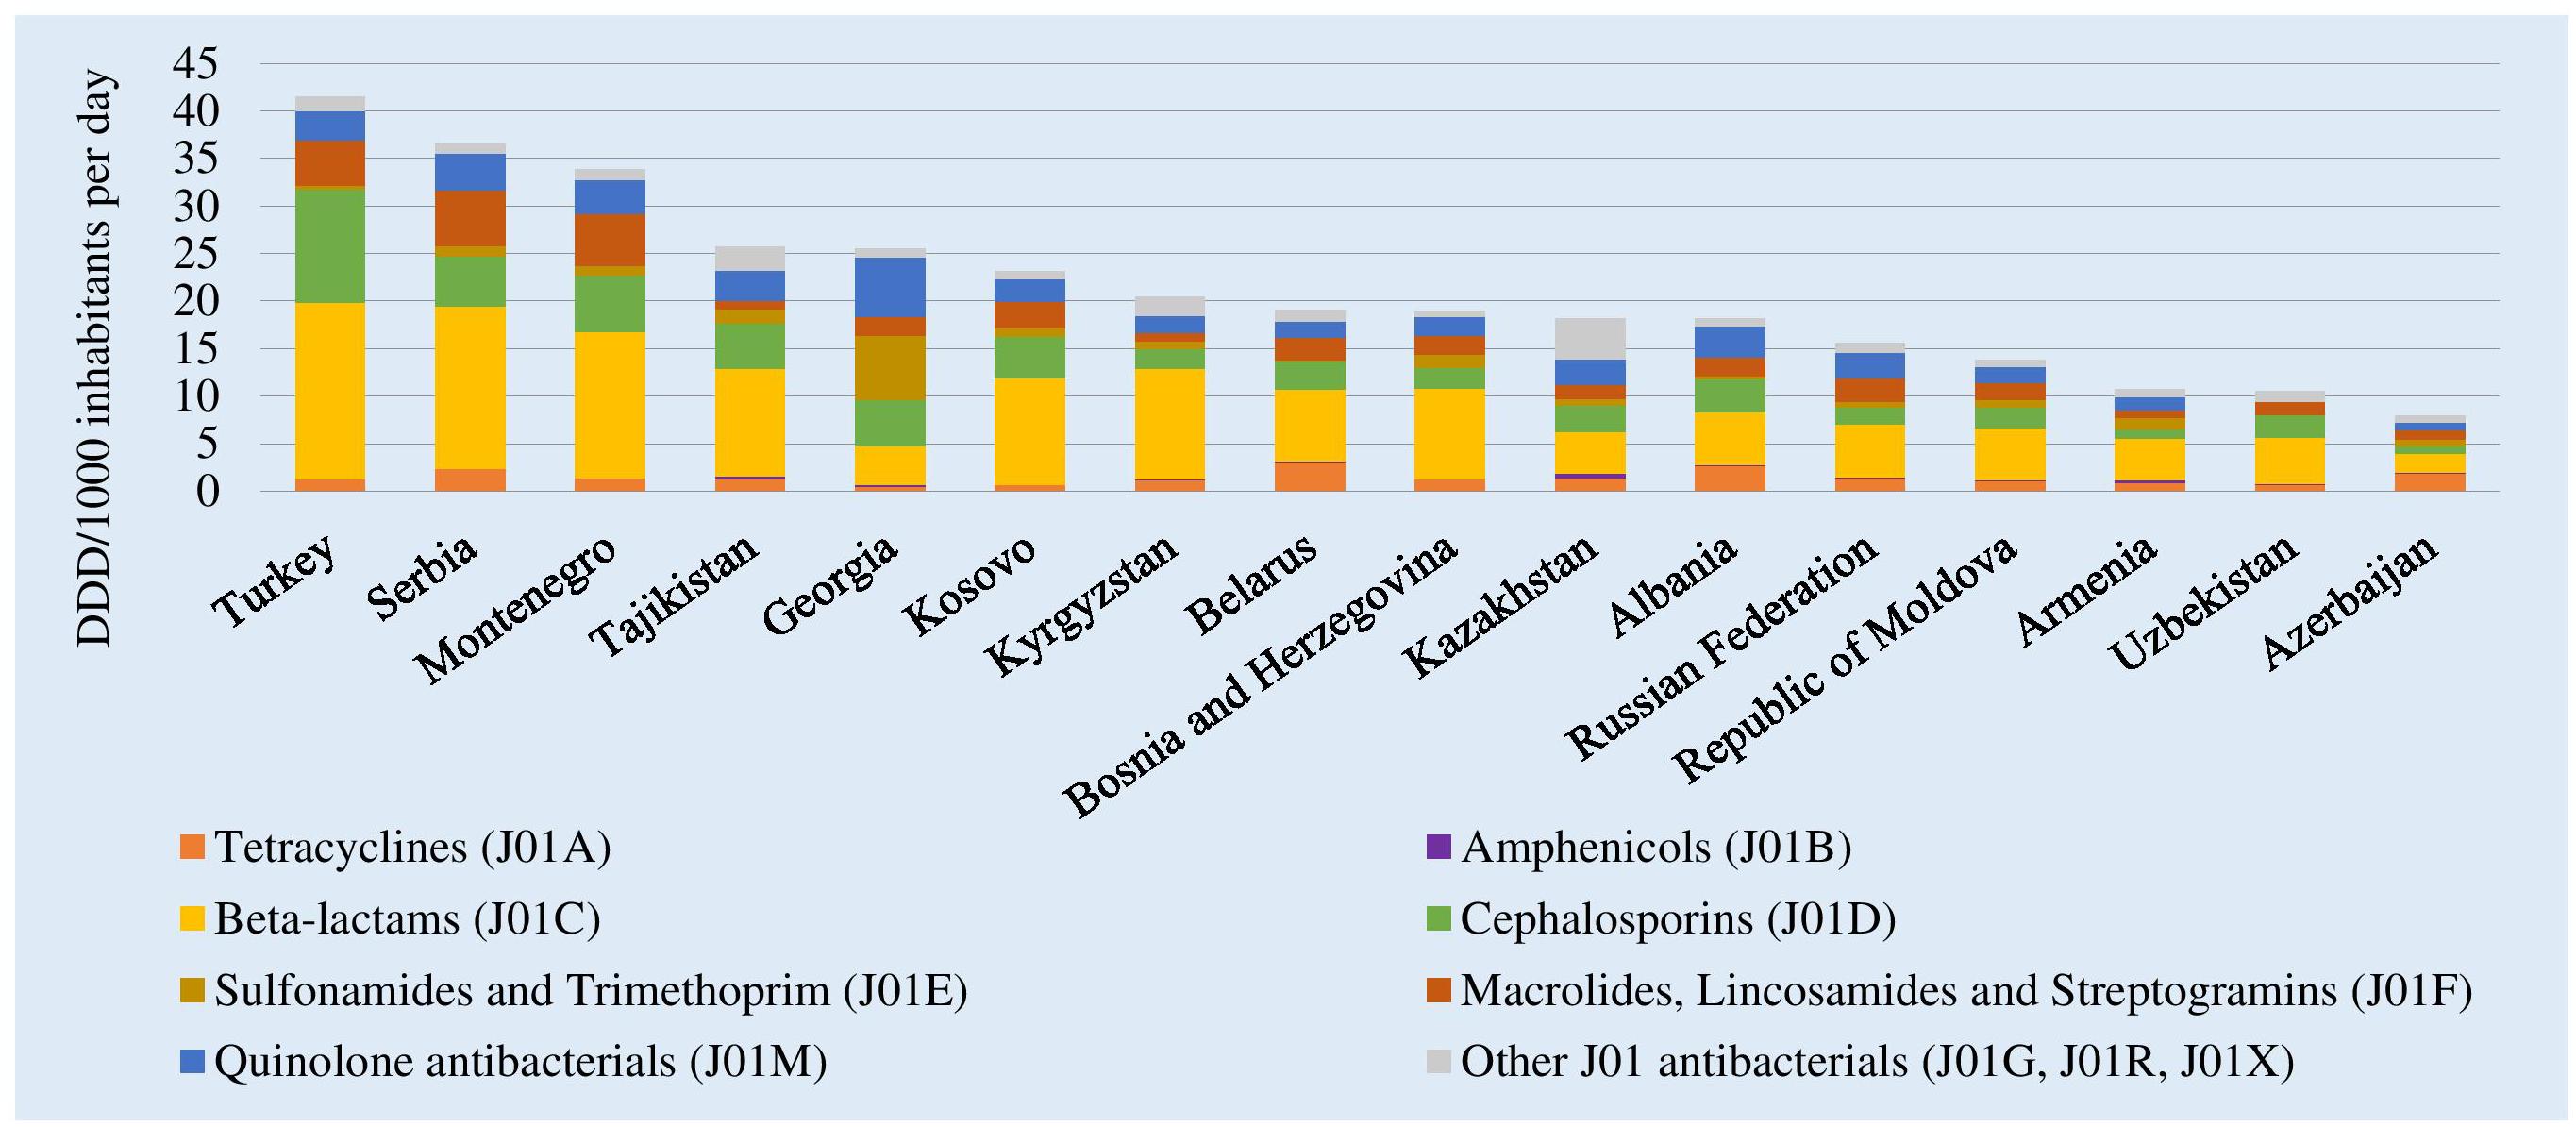
Figure 1. Total consumption of J01 antibacterials by pharmacological subgroup in 15 countries and Kosovo, 2015. DDD, Defined Daily Dose; ∗Kosovo [in accordance with United Nations Security Council resolution 1244 (1999)]; #Kazakhstan: commercial data source provides coverage of around 80–85% of hospital and community sales.
ESAC-Net estimates from 25 countries reporting both community and hospital sector data in 2015 show similar variability with a range from 38.3 DID in Greece to 11.7 DID in Netherlands, with mean and median consumption of 22.6 and 22.2 DID, respectively [European Centre for Disease Control (ECDC), 2017].
Figure 2 shows the consumption of cephalosporins and quinolones as a proportion of total consumption of J01 antibacterials. Highest relative consumption of cephalosporins was reported in Turkey (28.8%,) and lowest in Azerbaijan (9.2%). Highest relative quinolone consumption was in Georgia (24.6%). Together these two groups combined represented 44% of total J01 consumption in Georgia to 20% of consumption in Kyrgyzstan.
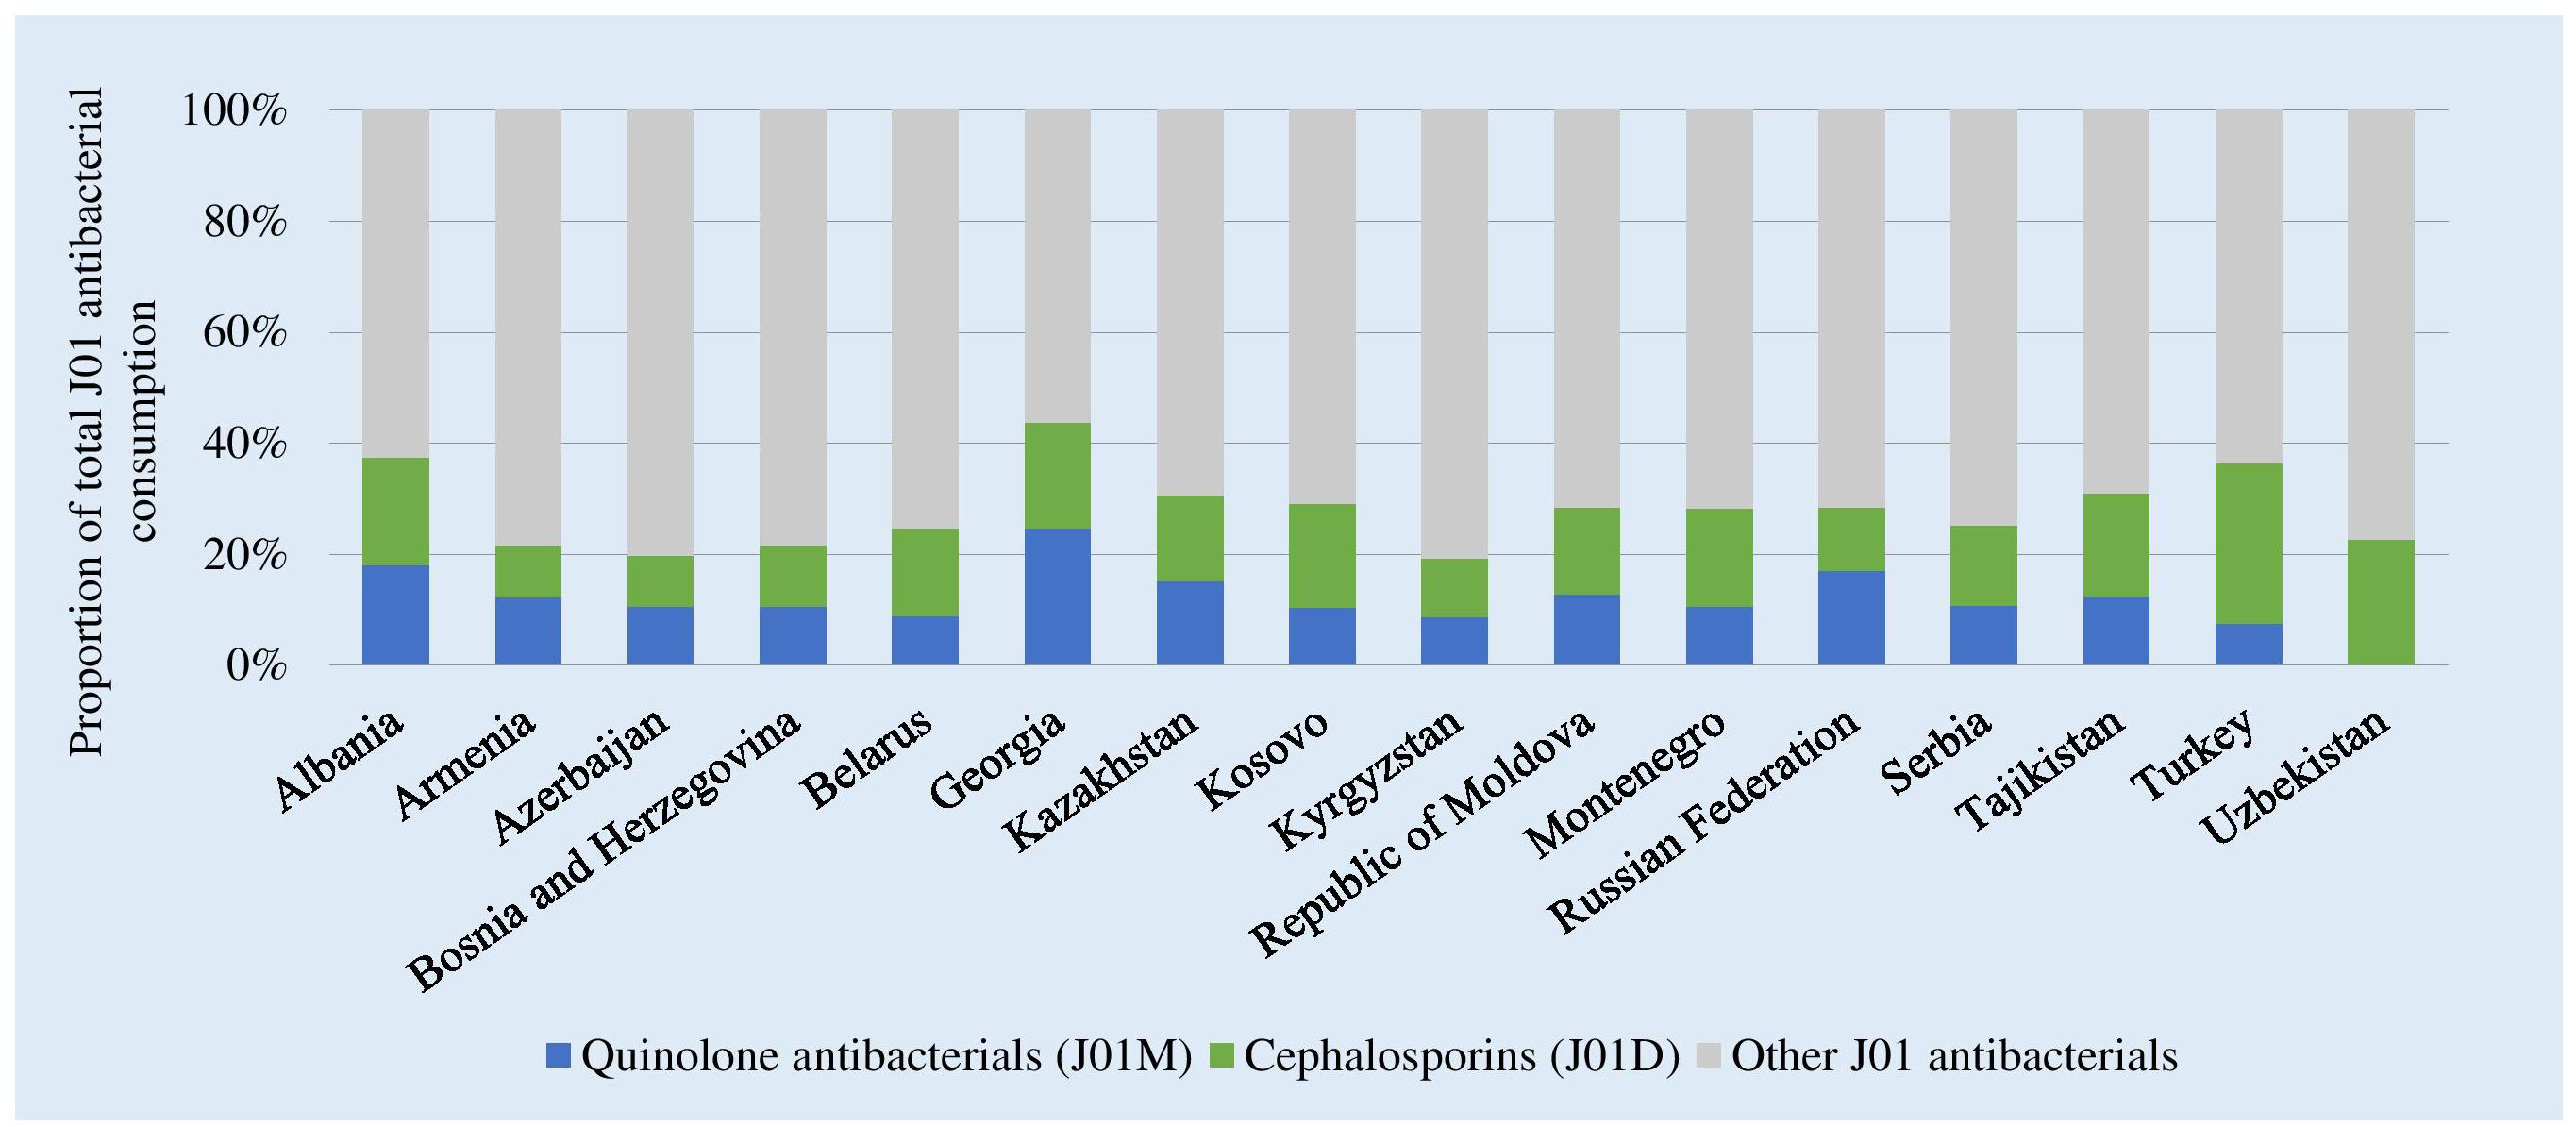
Figure 2. Consumption of cephalosporins and quinolones as a proportion of the total consumption of J01 antibacterials, 2015. ∗Kosovo [in accordance with United Nations Security Council resolution 1244 (1999)].
There were high levels of consumption of first- and second-generation cephalosporins in Bosnia and Herzegovina (82% of total cephalosporin consumption) and Serbia (75%). Consumption of third-generation agents that are mostly second-line treatment options, and included in the WHO Watch list, dominated in almost half of the participating countries and represented up to 90% of total cephalosporin consumption in Tajikistan and Georgia (Figure 3). Reported consumption of fourth-generation agents (Reserve category) was low.
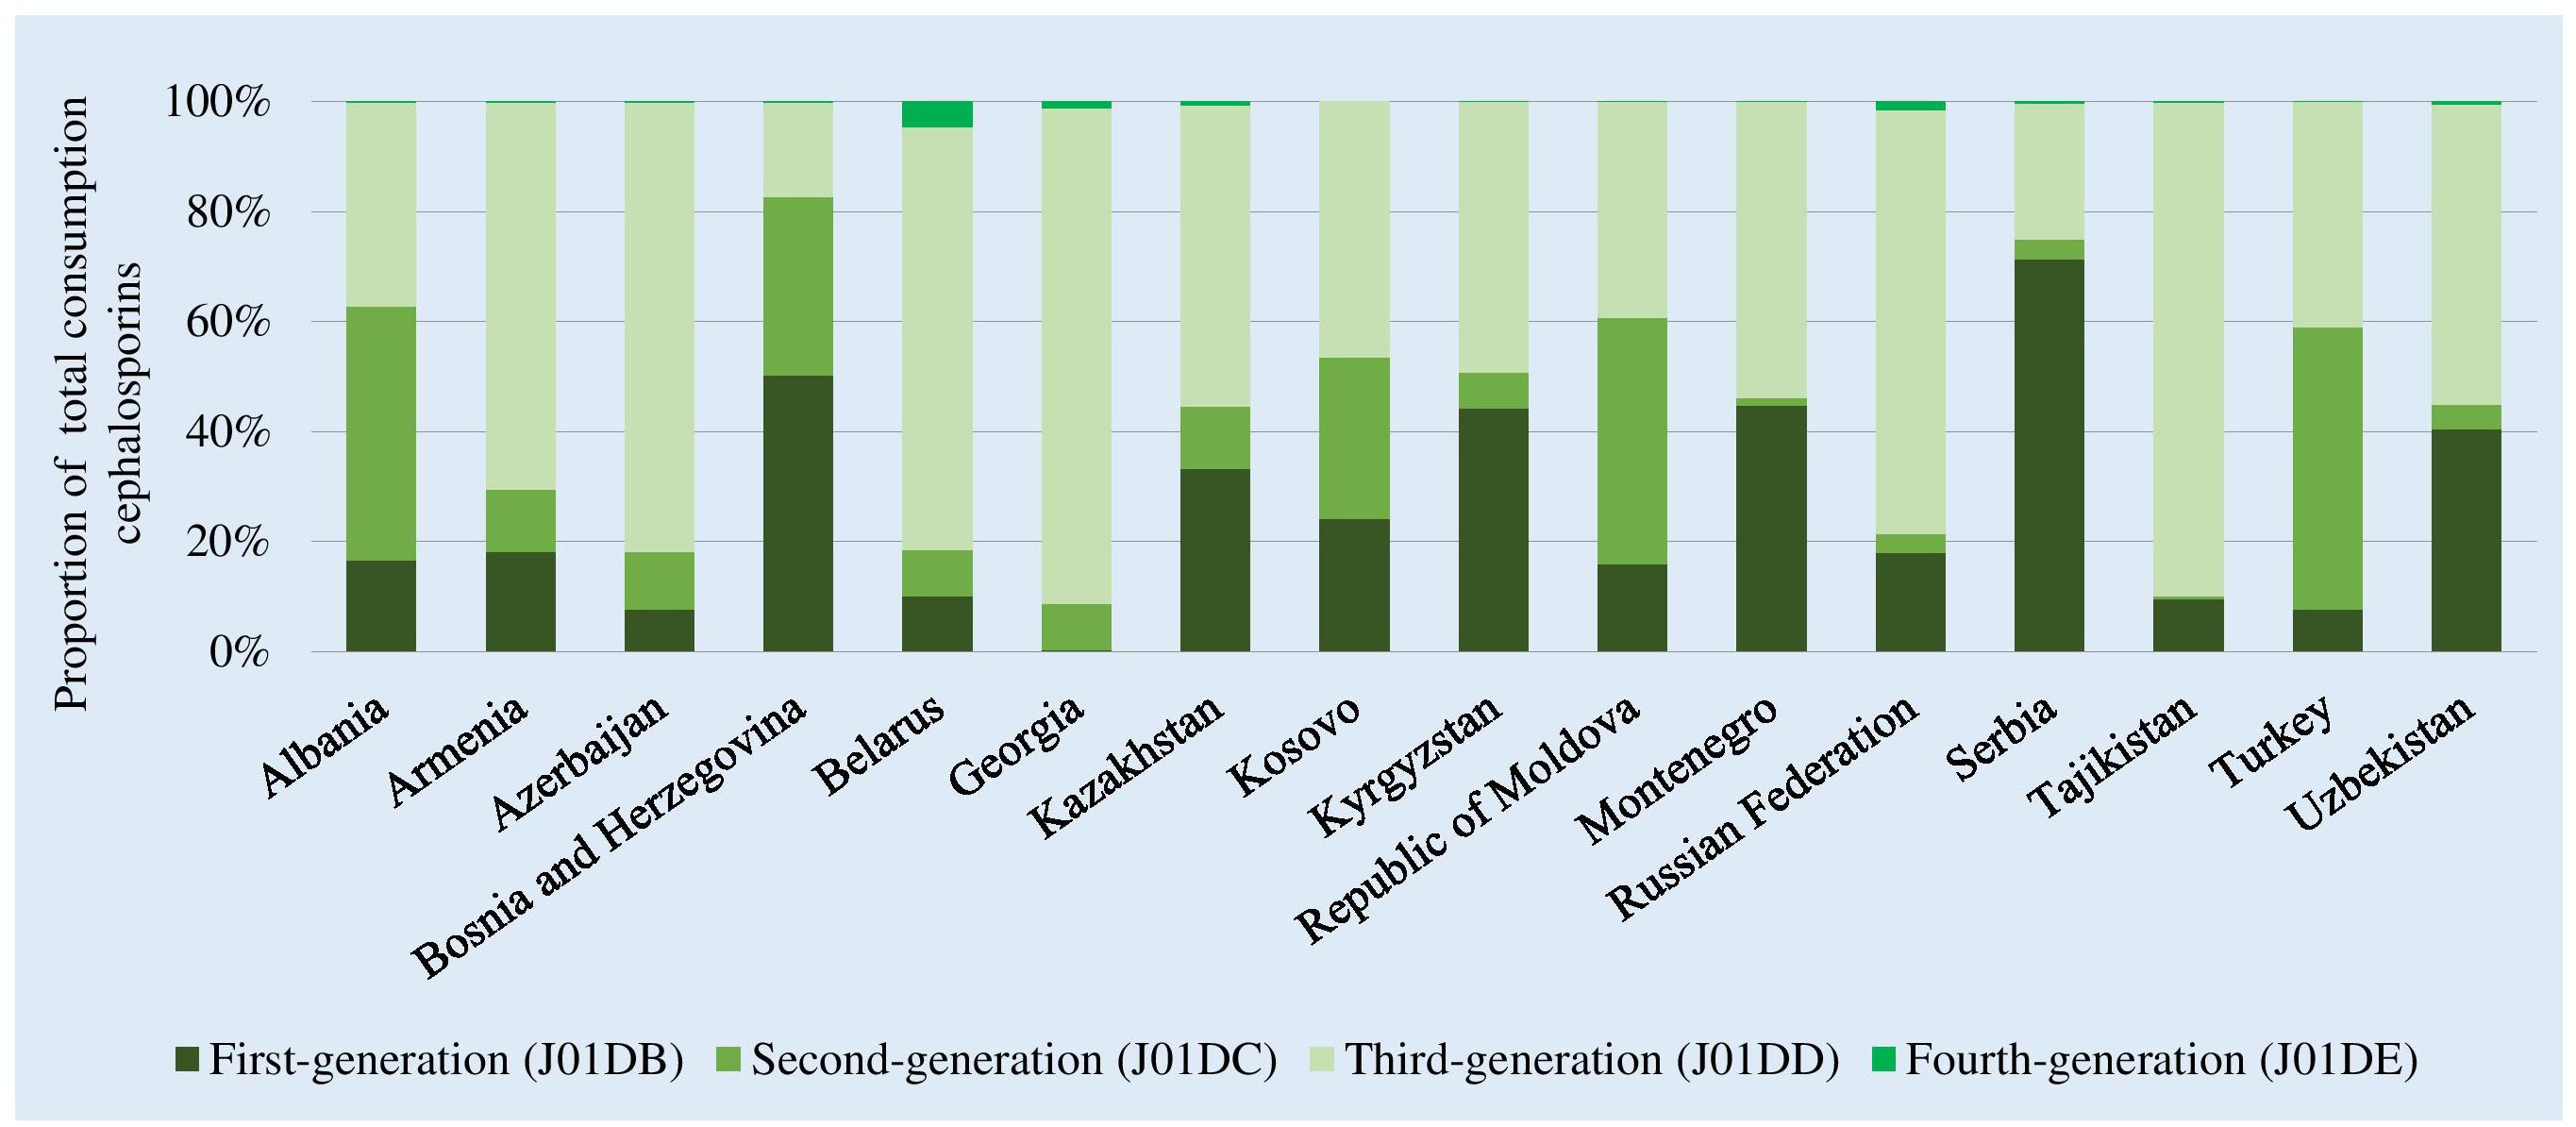
Figure 3. Relative consumption of cephalosporins by generation of agents, 2015. ∗Kosovo [in accordance with United Nations Security Council resolution 1244 (1999)].
WHO Watch and Reserve Category Medicines
There were no or very low levels of consumption of Reserve group antibiotics across the studied countries (0.01–0.83% of total consumption; see Supplementary Table 2). Watch group antibiotics comprised 49.5% of total J01 consumption in Georgia to 17.3% of consumption in Kyrgyzstan (Figure 4). The mean and median relative consumption of Watch group antibiotics were 30.9 and 30.5%, respectively.
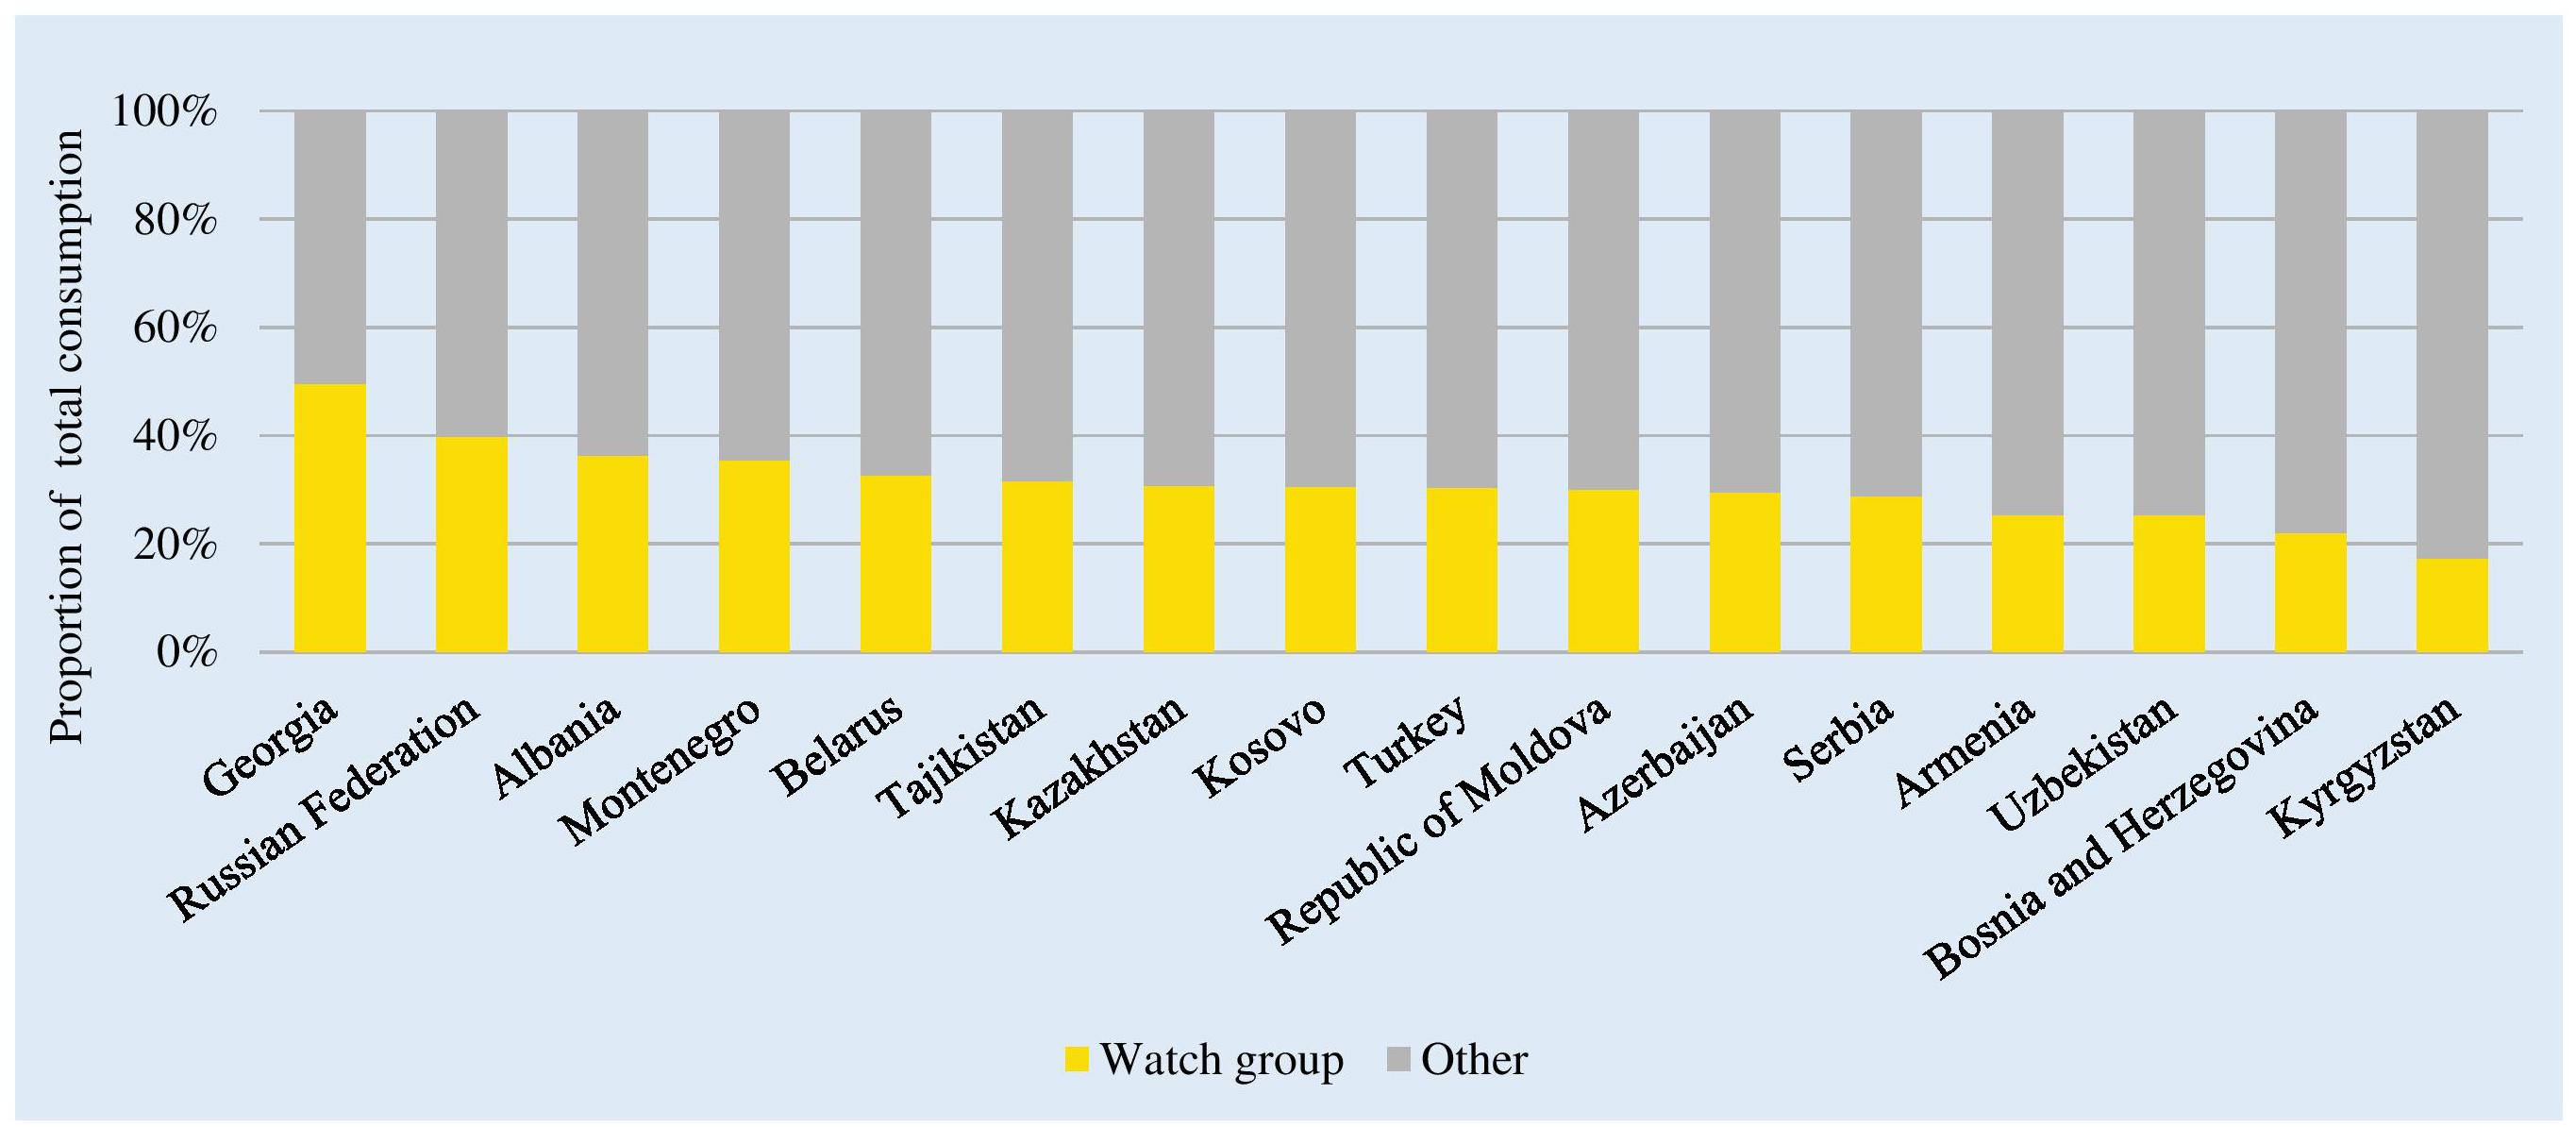
Figure 4. Consumption of “Watch” group of antibiotics classes as a proportion of total consumption of antibacterials. Watch group: Quinolones (J01MA and J01MB); 3rd generation cephalosporins (J01DD); macrolides (J01FA); glycopeptides (J01XA and A07AA09); antipseudomonal penicillins with beta-lactamase inhibitor (J01CR03 and J01CR05); carbapenems (J01DH); and faropenem (J01DI03). ∗Kosovo [in accordance with United Nations Security Council resolution 1244 (1999)].
Changes Over Time
There were decreases in total consumption estimates between 2011 and 2015 in nine countries, increases in five and in one remaining reasonably stable over time (Table 1). Mean J01 consumption decreased from 23.6 to 21.2 DID between 2011 and 2015, and median consumption from 22.0 to 19.0 DID.
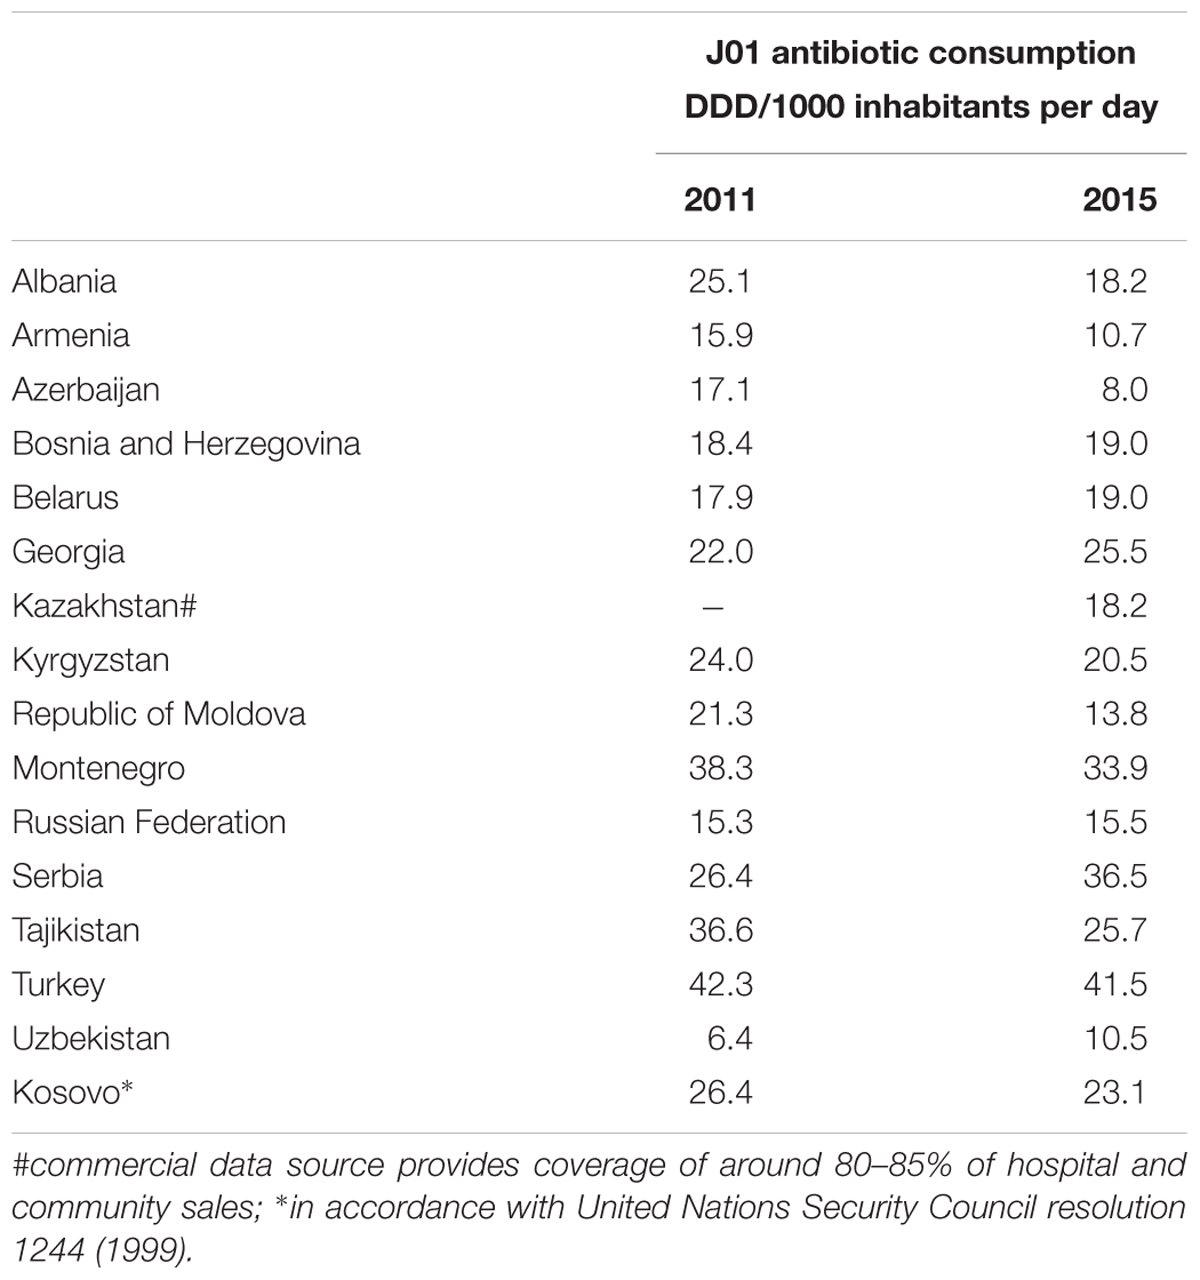
Table 1. Total antibiotic consumption 2011, 2015 in DDD/1000 inhabitants per day.
Within these changes in total DIDs, there were some substantial changes in the reported consumption of parenteral formulations: decreasing relative consumption in Azerbaijan (47–22%) and Kyrgyzstan (72–42%) and increasing in Georgia (16–36%) and Uzbekistan (42–52%).
Between 2011 and 2015, there were substantial increases in relative consumption of the cephalosporin and quinolones combined in Albania (22–37%), Azerbaijan (8–20%), Georgia (19–44%), and Kyrgyzstan (9–20%). Conversely, there were reductions in the consumption of these groups combined in Turkey (42–37%) and Uzbekistan (33–23%).
Changes to DDDs in 2019
Applying the DDD changes to be implemented in 2019 to consumption data for 2015 reduced total consumption estimates from a range of 41.5–8.0 DID using 2016 DDD values to 35.5–7.3 DID using 2019 DDD values (Table 2). The percentage reductions in total DIDs ranged from 18.4 (Uzbekistan) to 4.3% (Kazakhstan), with mean and median DID reductions of 12.0 and 13.0%, respectively, mostly due to reduced total DDDs for penicillins. However, there was limited impact on rankings from highest to lowest total consumption in DIDs (Table 2).
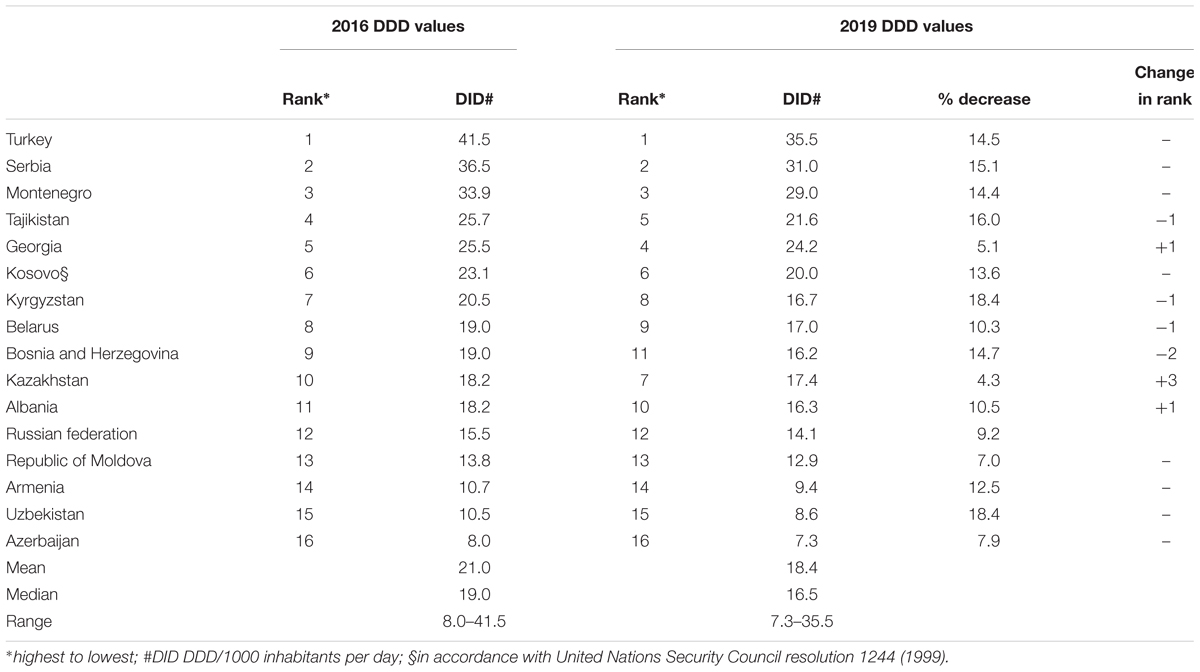
Table 2. Impact of 2019 changes in DDDs on estimates of total antibiotic consumption and ranking of countries.
While absolute consumption estimates for cephalosporins and quinolones changed very little, relative consumption of the two groups combined increased slightly from 1.3% in Kazakhstan to 6.1% in Tajikistan (data not shown). Changes to DDD values increased the estimate of relative consumption of Watch group antibiotics – 17–49% of total consumption using 2016 DDD values and 21–52% using 2019 DDD values (data not shown).
Discussion
Our main findings are that total antibiotic consumption in 2015 ranged from 8.0 DID for Azerbaijan to 41.5 DID for Turkey (mean 21.2 DID). These estimates were mostly lower than those reported in 2011 (range 6.4 DID Uzbekistan to Turkey 42.3 DID, mean 23.6 DID). There were increases in relative consumption of parenteral formulations, cephalosporins (particularly third-generation agents), and quinolones that are included in the WHO Watch list of antibiotics in several countries. Changes to DDDs to be implemented in 2019 impacted on both total and relative consumption estimates, driven mostly by DDD changes for several commonly used beta-lactam penicillins. The impact of the DDD changes on ranking of countries by total consumption estimates was modest. Where the relative consumption of beta-lactams was similar, there were similar percentage reductions in total DIDs.
These observations are important given the paucity of published data on antibiotic consumption from AMC network countries and areas. An IQVIA MIDAS-based study used national sample surveys of 2015 antibiotic sales extrapolated to national sales volumes for 76 countries and reported quantitative estimates of consumption for only two AMC Network members – Turkey and Russian Federation (Klein et al., 2018). We report total consumption of 41.5 DID for Turkey compared to Klein’s estimate of around 47 DID. There are likely several reasons for these differences including the extrapolation and interpolation algorithms applied to IQVIA data to generate national estimates of consumption and the assignment of DDDs for all products without a formal WHO DDD value. Medicines without an assigned DDD are excluded from our analyses. Klein et al. (2018) demonstrated good correlation of their estimates with ESAC-Net data; however, it may reflect that IQVIA data collection in EU countries is more comprehensive than in other parts of the world, reducing the impact of the extrapolations applied. The difference in absolute estimates of consumption in Turkey raises questions about using such data for “setting and enforcing per capita consumption targets” at the national level (Klein et al., 2018). AMC Network data for Russian Federation are based on IQVIA data, perhaps explaining the much closer estimates of 15.5 and 16 DIDs from the two sources. Further work is needed to compare consumption estimates from different data sources – import records, wholesaler data, health insurance records, and other commercial information sources – as the need is for reliable, actionable data on antibiotic consumption that can be used to monitor the impact of interventions to change prescribing practices. We are aware for instance that there can be considerable variation with import data from month to month.
Our estimates have some limitations, relying on a complete register of antimicrobial products, full and accurate reporting of data, distinguishing between medicines for local consumption and export, and the impact of import cycles. In the absence of universal health coverage or e-prescribing, widespread availability of antibiotics without prescription, few mechanisms to engage private wholesalers and limited ability to disaggregate data to hospital and community sectors, import records remain the most feasible data source in most AMC Network countries and areas. However, the broad comparability of total consumption estimates for AMC Network and ESAC-Net countries suggest that estimates reported here are plausible and can provide a platform for national level discussions and actions.
Reported decreases in total DIDs in this study are credible, reflecting sustained efforts at the national level to improve antibiotics use. Turkish health authorities have implemented an electronic prescription system to track prescription data and provide feedback to physicians and adopted a Rational Drug Use National Action Plan 2014–2017 that prioritizes the appropriate use of antibiotics (World Health Organization Regional Office for Europe, 2017b). 2011 Turkey estimates (42.3 DID) relied on commercial IMS data and reflected community consumption; the comparable community estimate in 2015 was 40.0 DID, derived from the comprehensive pharmaceutical “track and trace” system that follows medicines from production to consumption (Government of Turkey, 2018). 2015 data are also unlikely to reflect the full impact of the sustained educational and regulatory interventions undertaken since 2014.
The reduction in total antibiotic consumption from 15.9 to 10.7 DID between 2011 and 2015 in Armenia is likely related to targeted awareness activities conducted by the multisectoral team of the Ministry of Health. Multiple ongoing reforms and activities in Azerbaijan targeting physicians, pharmacists and patients are suggested to have contributed to reducing total antibiotic consumption from 17.1 to 8.0 DID in the same time period (Abilova et al., 2018). However, changes in pricing policies have seen a shift from penicillins toward consumption of tetracyclines, and while overall consumption of cephalosporins was low, more than 80% was third-generation agents. Pricing policies aimed at improving affordability and access has affected market dynamics, with some manufacturers leaving the market, influencing medicine choices (Abilova et al., 2018). Pricing policies could be used to drive more appropriate use, for example, lower prices for first- and second-generation cephalosporins than third-generation agents (Abilova et al., 2018).
More modest increases in total consumption in Georgia (22.0 DID in 2011 to 25.5 DID in 2015) may reflect, in part, issues in data collection, as exported products are not fully accounted for. Nonetheless, there appear to be some substantial shifts in consumption patterns, with reductions in relative consumption of beta-lactams (67.7–16.2%), increases in cephalosporins (8.8–19.2%) with more than 90% third-generation agents, and increases in quinolone consumption (10.5–24.6% of total J01 consumption). These observations highlight the importance of metrics other than total volumes of use. The choice of antimicrobial is as important as the volume of use given increasing concerns with AMR, and may be a more amenable target for changes in prescribing practices and optimizing antibiotic use when supported by evidence-based guidelines (World Health Organization, 2017a; Klein et al., 2018). Serbia reported increased consumption from 26.4 to 36.5 DID between 2011 and 2015. The reasons for this require local level investigation. However, limited resources have compromised the implementation of physician education programs, promotion of rational use of antibiotics and hospital-based antimicrobial stewardship programs (Kalaba et al., 2018).
The DRIVE-AB project distinguishes between prescribing quality indicators and quantitative metrics, proposing 51 inpatient and 32 outpatient quality indicators covering aspects including stewardship, diagnostics, dosing, duration, safety and monitoring of antibiotics, as well as 12 inpatient and 6 outpatient quantity metrics (DRIVE-AB, 2014). A quality indicator reflects the degree in which the antibiotic is correct or appropriate, where the outcome has a value on its own. A quantity metric reflects the volume or costs of antibiotic use and the outcome only gains value in its comparison. By these definitions, most of the metrics presented here are quantitative metrics, although quantitative measures focusing on preferred agents might be considered pointing toward improved prescribing practices and some measure of quality. This is the first step though to improve future antibiotic use in the absence of patient level data, especially given the high rate of self-purchasing of antibiotics without a prescription in a number of network countries.
Metrics such as packages of medicines per 1000 inhabitants per day have been proposed as an alternative to DIDs in the outpatient setting, partly in response to differences in prescribed daily doses in different countries (Bruyndonckx et al., 2014; Coenen et al., 2014; Watier et al., 2017). However, consumption estimates are affected by choice of measurement unit underpinning the importance of the use of the same data sources and metrics over time for assessment of temporal trends and benchmarking (Watier et al., 2017). Patient-linked volume of use measures are being used as national prescribing targets, with Sweden adopting a long-term goal of 250 prescriptions per 1000 inhabitants/year for all age groups, and the 2016 UK government proposing to halve inappropriate prescribing by 2020 (Government of Sweden, 2016; UK Department of Health Media Centre, 2016). However, prescription data are not available in all settings especially among AMC member countries and areas. Assessment of appropriate use (quality indicators) requires patient-level information linking clinical condition, patient characteristics and prescribing choices. Clinicians will more likely respond to these data than higher level aggregate measures. As health information systems develop, it will become possible to move beyond quantitative metrics toward quality indicators. In the interim, focused studies such as point prevalence studies, prescription analyses, and community surveys supplemented with qualitative studies are being undertaken in AMC Network countries and areas to help fill the information gaps and provide evidence of practices that should be reviewed (Smiljanic et al., 2016). There are also ongoing activities to improve pharmacist and patient knowledge to reduce inappropriate dispensing of antibiotics especially for upper respiratory tract infections (Markovic-Pekovic et al., 2017; Hoxha et al., 2018).
Policymakers and consumers require simple metrics that are easily interpretable, identify the magnitude of problems with antibiotic consumption and suggest the need for policy actions such as regulations, the enforcement of prescription-only status and investments in education and training. In the absence of prescription data, total consumption in DID could be used for this purpose although is difficult to interpret in isolation requiring trend data at the national or cross-national level to provide some context (Van Boeckel et al., 2014; Versporten et al., 2014; World Health Organization Regional Office for Europe, 2017a). DDD changes in 2019 will likely compound the problems of interpretation of consumption estimates, with total DIDs decreasing on average by around 12% with the new DDDs applied, independent of any intervention by government, agencies or professional groups. Communication strategies will be required so stakeholders are aware of the impact of the DDD changes along with re-setting of trend lines and targets for changes in antibiotic consumption at the national level.
The WHO Watch and Reserve group classifications offer promise as metrics that indicate actions required and lend themselves to prescribing targets with lower absolute and relative levels of consumption of these groups of antibiotics desirable. The Access, Watch, and Reserve classifications are already being applied – to IQVIA sales data units for single molecule and combination antibiotic products in India, and in the Access to Medicines Foundation analysis of proportions of pharmaceutical companies’ marketed antibiotics that are listed in the WHO EML antibiotic groups (McGettigan et al., 2017; Access to Medicines Foundation, 2018). More relevant for national stewardship efforts is an analysis of relative consumption of antibiotics by the WHO groups. However, a standardized method of calculation (ATC codes included and denominator definitions) is needed to ensure the validity of comparisons between settings (community, hospital, and total consumption) and for monitoring changes over time. The estimates presented here are based on total consumption – the relative use of Watch and Reserve groups would be substantially higher in a hospital-based analysis. The lists of Watch and Reserve medicines will be modified as evidence emerges, and more clinical conditions are reviewed.
While the quantitative metrics presented have limited application in assessing the appropriateness of prescribing, they do illustrate differing patterns of antibiotic consumption between countries and within countries over time and point to potential problems in antibiotic use. A full exploration of reasons for the changes in consumption patterns reported in each of the 16 AMC Network countries and areas is beyond the scope of this study. However, the impact of locally produced antibiotics on treatment choices, pharmaceutical industry promotion, perverse incentives to prescribe and dispense antibiotics, availability and use of up-to-date guidelines all need to be considered in developing interventions to improve antibiotic use. Quantitative measures can be effective. Turkish health authorities responded to high levels of antibiotic consumption with substantial commitments of resources and integrated activities to improve antibiotic use (World Health Organization Regional Office for Europe, 2017b). Relative use measures targeting less appropriate treatment choices (third- and fourth-generation cephalosporins, quinolones, Watch and Reserve antibiotics) may be more effective with clinicians and provide targets for action supported by evidence-based guidelines and treatment protocols. Other measures such as the removal of incentives to prescribe and dispense antibiotics, enforcement of prescription-only status, better diagnostics, favoring narrow-spectrum over broad-spectrum antibiotics and raising awareness and education of the public regarding the importance of preserving the value of existing antibiotics are also required. These are considerations for the future among AMC Network countries and areas, and we will be reporting further on this in the future.
Data Availability
The datasets used in these analyses are available upon request to interested researchers.
Ethics Statement
Ethics committee approval is not required for this study that is based on aggregate data from customs records and declaration forms, sales records from market authorization holders, local manufacturing estimates, wholesaler records, and in some cases, commercial data sources. We have obtained signed declarations from the Ministries of Health of the 15 countries and one territory included in this study giving permission for data sharing and publication.
Author Contributions
JR, KI, and HBP developed the concept. IH, LG, VA, ACv, HP, MD, LM, AJ, AD, ACa, LC, SR, VR, SY, MA, and MI (national focal points) collected and validated national data. JR and KI undertook analysis and interpretation of data in consultation with the national focal points. JR provided first write-up of the manuscript. All co-authors KI, HBP, BG, HK, IH, LG, VA, ACv, HP, MD, LM, AJ, AD, ACa, LC, SR, VR, SY, MA, and MI reviewed and critiqued the manuscript and agreed to submission of the manuscript.
Funding
The funder (Netherlands Ministry of Health, Welfare, and Sport) had no role in study design, data collection, data analysis, data interpretation, or writing the report.
Disclaimer
The authors alone are responsible for the views expressed in this publication and they do not necessarily represent the views, decisions or policies of the institutions with which they are affiliated.
Conflict of Interest Statement
The authors declare that the research was conducted in the absence of any commercial or financial relationships that could be construed as a potential conflict of interest.
The reviewer MJ declared a shared affiliation, with no collaboration, with one of the authors, VR, to the handling Editor at the time of review.
Supplementary Material
The Supplementary Material for this article can be found online at: https://www.frontiersin.org/articles/10.3389/fphar.2018.01156/full#supplementary-material
References
Abilova, V., Kurdi, A., and Godman, B. (2018). Ongoing initiatives in Azerbaijan to improve the use of antibiotics; findings and implications. Expert Rev. Anti Infect. Ther. 16, 77–84. doi: 10.1080/14787210.2018.1417835
Access to Medicines Foundation (2018). Antimicrobial Resistance Benchmark 2018. Available at: https://amrbenchmark.org/wp-content/uploads/2018/03/Antimicrobial-Resistance-Benchmark-2018.pdf [accessed March 10, 2018].
Adriaenssens, N., Coenen, S., Tonkin-Crine, S., Verheij, T. J., Little, P., and Goossens, H. (2011). European surveillance of antimicrobial consumption (ESAC): disease-specific quality indicators for outpatient antibiotic prescribing. BMJ Q. Safety 20, 764–767. doi: 10.1136/bmjqs.2010.049049
Bojanic, L., Markovic-Pekovic, V., Skrbic, R., Stojakovic, N., Ethermanovic, M., Bojanic, J., et al. (2018). Recent initiatives in the republic of srpska to enhance appropriate use of antibiotics in ambulatory care; their influence and implications. Front. Pharmacol. 9:442. doi: 10.3389/fphar.2018.00442
Bruyndonckx, R., Hens, N., Aerts, M., Goossens, H., Molenberghs, G., and Coenen, S. (2014). Measuring trends of outpatient antibiotic use in Europe: jointly modelling longitudinal data in defined daily doses and packages. J. Antimicrob. Chemother. 69, 1981–1986. doi: 10.1093/jac/dku063
Coenen, S., Gielen, B., Blommaert, A., Beutels, P., Hens, N., and Goossens, H. (2014). Appropriate international measures for outpatient antibiotic prescribing and consumption: recommendations from a national data comparison of different measures. J. Antimicrob. Chemother. 69, 529–534. doi: 10.1093/jac/dkt385
DRIVE-AB (2014). DRIVE-AB WP1A Quality Indicators & Quantity Metrics of Antibiotic Use. Available at: http://drive-ab.eu/wp-content/uploads/2014/09/WP1A_Final-QMs-QIs_final.pdf [accessed March 9, 2018].
European Centre for Disease Control [ECDC] (2017). Antimicrobial Consumption Database: Consumption of. (Antibacterials) for Systemic Use (ATC Group J01) in the Community and Hospital Sector in Europe, Reporting Year 2016. Available at: https://ecdc.europa.eu/en/antimicrobial-consumption/database/rates-country [accessed February 19, 2018].
European Centre for Disease Prevention and Control [ECDC] (2018). European Surveillance of Antimicrobial. (Consumption) Network (ESAC-Net): Data Collection and Analysis. Available at: https://ecdc.europa.eu/en/about-us/networks/disease-networks-and-laboratory-networks/esac-net-data (accessed March 10, 2018).
Furst, J., Cizman, M., Mrak, J., Kos, D., Campbell, S., Coenen, S., et al. (2015). The influence of a sustained multifaceted approach to improve antibiotic prescribing in Slovenia during the past decade: findings and implications. Expert Rev. Anti Infect. Ther. 13, 279–289. doi: 10.1586/14787210.2015.990381
Gandra, S., Barter, D. M., and Laxminarayan, R. (2014). Economic burden of antibiotic resistance: how much do we really know? Clin. Microbiol. Infect. 20, 973–980. doi: 10.1111/1469-0691.12798
Government of Sweden (2016). Swedish Strategies and Methods to Combat Antibiotic Resistance. Available at: https://www.government.se/contentassets/168838e186de455ca7fe868bee92d209/swedish-strategy-to-combat-antibiotic-resistance.pdf [accessed April 1, 2018].
Government of Turkey (2018). Turkish Pharmaceutical track and Trace System. Available at: http://its.technarts.com/content.php?Id=69#.WqQzV-hubD6 [accessed March 10, 2018].
Hoxha, I., Malaj, A., Kraja, B., Bino, S., Oluka, M., Markovic-Pekovic, V., et al. (2018). Are pharmacists’ good knowledge and awareness on antibiotics taken for granted? The situation in Albania and future implications across countries. J. Glob. Antimicrob. Resist. 13, 240–245. doi: 10.1016/j.jgar.2018.01.019
Jakovljevic, M., Alahdab, S., Jurisevic, M., and Mouselli, S. (2018). Antibiotic resistance in Syria: a local problem turns into a global threat. Front. Public Health 6:212. doi: 10.3389/fpubh.2018.00212
Jakovljevic, M., Lazarevic, M., Milovanovic, O., and Kanjevac, T. (2016). The new and old Europe: east-West split in pharmaceutical spending. Front. Pharmacol. 7:18. doi: 10.3389/fphar.2016.00018
Jinks, T., Lee, N., Sharland, M., Rex, J., Gertler, N., Diver, M., et al. (2016). A time for action: antimicrobial resistance needs global response. Bull. World Health Organ. 94, 558A–558A. doi: 10.2471/BLT.16.181743
Kalaba, M., Kosutic, J., Godman, B., Radonjic, V., Vujic, A., Jankovic, S., et al. (2018). Experience with developing antibiotic stewardship programs in Serbia: potential model for other Balkan countries? J. Comp. Eff. Res. 7, 247–258. doi: 10.2217/cer-2017-0055
Klein, E. Y., Van Boeckel, T. P., Martinez, E. M., Pant, S., Gandra, S., Levin, S. A., et al. (2018). Global increase and geographic convergence in antibiotic consumption between 2000 and 2015. Proc. Nat. Acad. Sci. 115:201717295. doi: 10.1073/pnas.1717295115
Malo, S., Bjerrum, L., Feja, C., Lallana, M. J., Abad, J. M., and Rabanaque-Hernandez, M. J. (2014). The quality of outpatient antimicrobial prescribing: a comparison between two areas of northern and southern Europe. Eur. J. Clin. Pharmacol. 70, 347–353. doi: 10.1007/s00228-013-1619-0
Markovic-Pekovic, V., Grubisa, N., Burger, J., Bojanic, L., and Godman, B. (2017). Initiatives to reduce nonprescription sales and dispensing of antibiotics: findings and implications. J. Res. Pharm. Pract. 6, 120–125. doi: 10.4103/jrpp.JRPP-17-12
McGettigan, P., Roderick, P., Kadam, A., and Pollock, A. M. (2017). Access, watch, and reserve antibiotics in India: challenges for WHO stewardship. Lancet Glob. Health 5, e1075–e1076. doi: 10.1016/S2214-109X(17)30365-0
Michael, C. A., Dominey-Howes, D., and Labbate, M. (2014). The antimicrobial resistance crisis: causes, consequences, and management. Front. Public Health 2:145. doi: 10.3389/fpubh.2014.00145
O’Neill, J. (2015). Securing New Drugs for Future Generations: The Pipeline of Antibiotics. The Review of Antimicrobial Resistance. Available at: https://amr-review.org/sites/default/files/SECURING%20NEW%20DRUGS%20FOR%20FUTURE%20GENERATIONS%20FINAL%20WEB_0.pdf
Prestinaci, F., Pezzotti, P., and Pantosti, A. (2015). Antimicrobial resistance: a global multifaceted phenomenon. Pathog. Glob. Health 109, 309–318. doi: 10.1179/2047773215Y.0000000030
Sharland, M., Pulcini, C., Harbarth, S., Zeng, M., Gandra, S., Mathur, S., et al. (2018). Classifying antibiotics in the WHO essential medicines list for optimal use—be AWaRe. Lancet Infect. Dis. 18, 18–20. doi: 10.1016/S1473-3099(17)30724-7
Smiljanic, M. T., Radonjic, V., and Djuric, D. (2016). Evaluation of antibiotic consumption at Rakovica community Health Center from 2011 to 2015. Ser. J. Exp. Clin. Res. 17, 245–250. doi: 10.1515/SJECR-2016-0054
Smith, P., McQuattie, K., and Hogg, K. (2014). Reducing Antibiotic Prescribing for Self-Limiting Respiratory Tract Infections in Primary Care: A Pilot Study. Selfcare 5:110-4. Available at: http://www.selfcareforum.org/wp-content/uploads/2011/07/Smith-5.5.110-114-author-copy-Self-Care-Journal.pdf
Stratchounski, L., Bedenkov, A., Hryniewicz, W., Krcmery, V., Ludwig, E., and Semenov, V. (2001). The usage of antibiotics in Russia and some countries in Eastern Europe. Int. J. Antimicrob. Agents 18, 283–286. doi: 10.1016/S0924-8579(01)00381-8
Taylor, J., Hafner, M., Yerushalmi, E., Smith, R., Bellasio, J., Vardavas, R., et al. (2014). Estimating the Economic Costs of Antimicrobial Resistance: Model and Results. 2014. Available at: https://www.rand.org/pubs/research_reports/RR911.html
UK Department of Health Media Centre (2016). UK Leading the Global Fight Against Drug Resistant Bugs. Available at: https://healthmedia.blog.gov.uk/2016/05/27/amr/ [accessed April 1, 2018].
United Nations (2016). Draft Political Declaration of the High-Level Meeting of the General Assembly on Antimicrobial Resistance. Available at: https://www.un.org/pga/ 71/wp-content/uploads/sites/40/2016/09/DGACM_GAEAD_ESCAB-AMR-Draft-Politi-cal-Declaration-1616108E.pdf [accessed June 27, 2017].
Van Boeckel, T. P., Gandra, S., Ashok, A., Caudron, Q., Grenfell, B. T., and Levin, S. A. (2014). Global antibiotic consumption 2000 to 2010: an analysis of national pharmaceutical sales data. Lancet Infect. Dis. 14, 742–750. doi: 10.1016/S1473-3099(14)70780-7
Versporten, A., Bolokhovets, G., Ghazaryan, L., Abilova, V., Pyshnik, G., Spasojevic, T., et al. (2014). Antibiotic use in eastern Europe: a cross-national database study in coordination with the WHO regional office for Europe. Lancet Infect. Dis. 14, 381–387. doi: 10.1016/S1473-3099(14)70071-4
Watier, L., Cavalié, P., Coignard, B., and Brun-Buisson, C. (2017). Comparing antibiotic consumption between two European countries: are packages an adequate surrogate for prescriptions? Eur. Surveill. 22:16. doi: 10.2807/1560-7917.ES.2017.22.46.17-00352
WHO Collaborating Centre for Drug Statistics Methodology (2018a). Anatomical Therapeutic Chemical (ATC) Classification System: Guidelines for ATC Classification and DDD Assignment. Available at: http://www.whocc.no/atc_ddd_methodology/purpose_of_the_atc_ddd_system/ [accessed January 9, 2018].
WHO Collaborating Centre for Drug Statistics Methodology (2018b). DDD: Definition and General Considerations. Available at: https://www.whocc.no/ddd/definition_and_general_considera/ [accessed March10, 2018].
WHO Collaborating Centre for Drug Statistics Methodology (2018c). World Health Organization. Updates Included in the ATC/DDD Index. Available at: https://www.whocc.no/atc_ddd_index/updates_included_in_the_atc_ddd_index/ [accessed March 10, 2018].
World Health Organization (2015). Global Action Plan on Antimicrobial Resistance. Available at: http://www.who.int/antimicrobial-resistance/global-action-plan/en/ [accessed February 8, 2018].
World Health Organization (2016). Antimicrobial Resistance: National Action Plans. Available at: http://www.who.int/antimicrobial-resistance/national-action-plans/en/ [accessed February8, 2018].
World Health Organization (2017a). Comprehensive Review of Antibiotic Medicines: 21st Expert Committee on the Selection and Use of Essential Medicines. Available at: http://www.who.int/selection_medicines/committees/expert/21/applications/comprehensive_antibiotics_rev/en/ [accessed February 8, 2018].
World Health Organization (2017b). Critically Important Antimicrobials for Human Medicine – 5th Rev. Geneva: World Health Organization; 2017c. Licence: CC BY-NC-SA 3.0 IGO. Available at: http://apps.who.int/iris/bitstream/10665/255027/1/9789241512220-eng.pdf?ua=1 [accessed February 8,2018].
World Health Organization (2017c). The Selection and Use of Essential Medicines Report of the WHO Expert Committee, 2017 (including the 20th WHO Model List of Essential Medicines and the 6th WHO Model List of Essential Medicines for Children). WHO Technical Report Series, No. 1006. Geneva: World Health Organization.
World Health Organization Regional Office for Europe (2014). The Role of Pharmacist in Encouraging Prudent Use of Antibiotics and Averting Antimicrobial Resistance: a Review of Policy and Experience. Available at URL: http://www.euro.who.int/en/health-topics/disease-prevention/antimicrobial-resistance/publications/2014/the-role-of-pharmacist-in-encouraging-prudent-use-of-antibiotic-medicines-and-averting-antimicrobial-resistance-a-review-of-current-policies-and-experiences-in-europe-2014
World Health Organization Regional Office for Europe (2017a). Antimicrobial Medicines Consumption (AMC) Network. AMC Data 2011–2014.Available at: http://www.euro.who.int/en/health-topics/Health-systems/health-technologies-and-medicines/publications/2017/antimicrobial-medicines-consumption-amc-network.-amc-data-20112014-2017 [accessed February 10, 2018].
World Health Organization Regional Office for Europe (2017b). Turkey Takes Strong Action to Reduce Antibiotic Consumption and Resistance. (News 13 Nov 2017). Available at: http://www.euro.who.int/en/health-topics/disease-prevention/antimicrobial-resistance/news/news/2017/11/turkey-takes-strong-action-to-reduce-antibiotic-consumption-and-resistance [accessed March 8, 2018].
World Organisation for Animal Health (2015). OIE List of Antimicrobial Agents of Veterinary Importance. Available at: http://www.oie.int/fileadmin/Home/eng/Our_scientific_expertise/docs/pdf/Eng_OIE_List_antimicrobials_May2015.pdf [accessed February 8, 2018].
Appendix
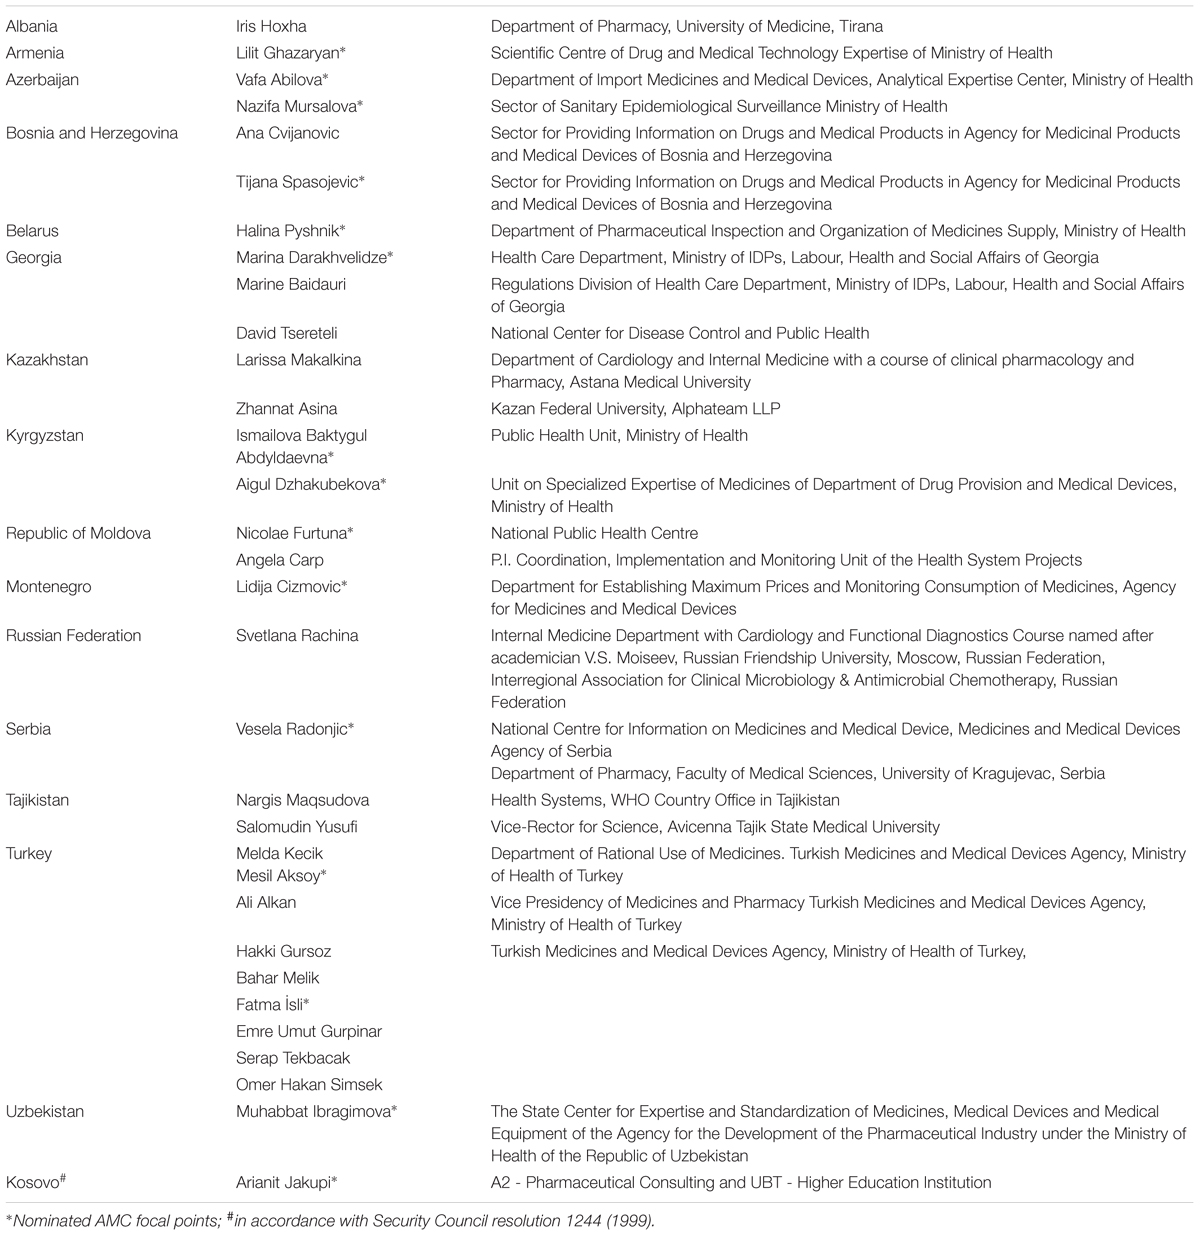
TABLE A1. List of AMC focal points and contributors to the 2015 data collection.
Keywords: antibiotic utilization, antimicrobial medicines consumption, national surveillance networks, cross-national comparative study, Eastern Europe, Central Asia, quality indicators
Citation: Robertson J, Iwamoto K, Hoxha I, Ghazaryan L, Abilova V, Cvijanovic A, Pyshnik H, Darakhvelidze M, Makalkina L, Jakupi A, Dzhakubekova A, Carp A, Cizmovic L, Rachina S, Radonjic V, Yusufi S, Aksoy M, Ibragimova M, Godman B, Kluge H and Bak Pedersen H (2019) Antimicrobial Medicines Consumption in Eastern Europe and Central Asia – An Updated Cross-National Study and Assessment of Quantitative Metrics for Policy Action. Front. Pharmacol. 9:1156. doi: 10.3389/fphar.2018.01156
Received: 23 August 2018; Accepted: 24 September 2018;
Published: 05 March 2019.
Edited by:
Dominique J. Dubois, Free University of Brussels, BelgiumReviewed by:
Robert L. Lins, Retired, Antwerpen, BelgiumMihajlo Jakovljevic, University of Kragujevac, Serbia
Copyright © 2019 World Health Organization. This is an open access article distributed under the terms of the Creative Commons Attribution IGO License, which permits unrestricted use, adaptation (including derivative works) distribution, and reproduction in any medium, provided the original work is properly cited. In any reproduction or adaptation of this article there should not be any suggestion that WHO or this article endorse any specific organisation or products. The use of the WHO logo is not permitted. This notice should be preserved along with the article’s original URL.
*Correspondence: Kotoji Iwamoto, iwamotok@who.int
†For the purposes of this publication, all references, including in the bibliography, to “Kosovo” should be understood/read as “Kosovo [in accordance with Security Council Resolution 1244 (1999)]”