Transcriptomic meta-analysis and functional validation identify genes linked to adaptation and involved in high-light acclimation in Synechocystis sp. PCC 6803
 Eslam M. Abdel-Salam
 Theo Figueroa-Gonzalez
 Dario Leister
- Plant Molecular Biology, Faculty of Biology, Ludwig-Maximilians-Universität München, Munich, Germany
Several mechanisms of high light (HL) acclimation have been identified in Synechocystis sp. PCC 6803. However, there are still gaps in understanding of the complex regulatory networks and molecular interactions involved. This study aims to investigate the molecular mechanisms underlying HL acclimation in Synechocystis by performing a meta-analysis of transcriptomic data. A total of 411 differentially expressed genes (DEGs) were identified in the meta-analysis, of which 179 were unique to the meta-analysis. These findings indicate a coordinated response of the Synechocystis transcriptome to HL, with specific genes being activated or suppressed to cope with the challenging conditions. Of all the DEGs, 307 were related to primary metabolism, 52 were involved in photosynthesis and light-harvesting processes, and 52 genes had no known function or were not properly annotated. Gene ontology and KEGG pathway enrichment analyses revealed the involvement of DEGs in various biological processes and pathways, including photosynthesis, energy metabolism and oxidative stress response. Comparison with previous HL adaptive laboratory evolution (ALE) experiments revealed 17 DEGs that had acquired adaptive mutations after HL ALE. Three of these adaptive mutations which lead to amino acid exchanges in the corresponding proteins (sll0267L1189P, sll0355F254S, and slr1855D200G) were selected to test their impact on HL acclimation in Synechocystis. The laboratory validation of strains carrying these three mutations, showed that each mutation had a positive effect on HL acclimation when reconstructed in the Synechocystis laboratory type (LT) background. The three mutants reached higher cell densities at the end of cultivation, showed comparable levels of chlorophyll fluorescence when exposed to incremental red-orange light, and at least one of the three mutations may alter gene function rather than suppress it. These findings offer valuable insight into the HL acclimation and adaptation of Synechocystis and contribute to a more comprehensive understanding of the molecular mechanisms that underlie its adaptation to HL. These results may direct future studies seeking to enhance the adaptability of cyanobacteria and related species to HL.
1 Introduction
Synechocystis sp. PCC 6803 (hereafter referred to as Synechocystis) is a unicellular cyanobacterium that has attracted considerable attention in both basic and applied research. This non-heterocystous strain belongs to the genus Synechocystis and was originally isolated from a freshwater lake in the United States (Stanier et al., 1971). Over the years, Synechocystis has become a model organism for studying various aspects of cyanobacterial physiology, molecular biology and biotechnology due to its genetic tractability, rapid growth and ability to perform oxygenic photosynthesis. It has a complex photosynthetic machinery consisting of photosystems, pigments and electron transport chains. As such, Synechocystis provides a well-established platform for genetic engineering and adaptive laboratory experiments (Jensen and Leister, 2014) and could therefore help to improve plant adaptability to high light (HL) conditions. One of the key attributes that makes Synechocystis an attractive organism for biotechnological applications is its ability to efficiently convert solar energy into biomass and valuable products through photosynthesis (Angermayr et al., 2009). The genome sequencing of Synechocystis, completed in 1996 (Kaneko et al., 1996), revealed a compact circular chromosome of approximately 3.57 million base pairs, encoding approximately 3,200 protein-coding genes (Kaneko et al., 2003). The availability of the complete genome sequence paved the way for comprehensive studies of the metabolic pathways, regulatory networks and cellular processes of Synechocystis. More recently, data on the fitness of each Synechocystis gene has become available through a genome-wide CRISPR-based gene suppression technique. Elton Hudson and his colleagues conducted a genome-wide CRISPR interference study to explore the effect of suppressing Synechocystis genes on growth under various biological conditions (Miao et al., 2023). The study examined 11 conditions, including three that combined high CO2 (1%) with three different light intensities (60, 150 and 1,000 μmol photons m−2 s−1). The study quantified the growth inhibitory effects of gene suppression as fitness scores, ranging from −4 to 4.
Photosynthetic organisms, including cyanobacteria and plants, have different limits of acclimation and adaptability to HL due to their evolution in different environments (Bobrovskikh et al., 2022). In general, exposure to HL negatively affects photosynthesis, growth and productivity of these organisms. Several mechanisms behind the acclimation and adaptation of Synechocystis to HL conditions have been described, including the regulation of the composition and activity of the photosynthetic apparatus to optimize its energy balance and prevent energy overload, and the deployment of a suite of antioxidant defense systems to mitigate the harmful effects of reactive oxygen species (ROS) generated under HL conditions (Sonoike et al., 2001; Hackenberg et al., 2009; Kirilovsky and Kerfeld, 2016; Komenda and Sobotka, 2016). However, although there has been significant progress in comprehending the mechanisms of acclimation to HL, which is a reversible physiological event, and adaptation, which is an irreversible response that depends on genetic changes, in Synechocystis, additional research is necessary to completely understand the intricate regulatory networks and molecular interactions involved. Although many key components and pathways have been identified, there are still gaps in our knowledge of the precise mechanisms and dynamics of HL acclimation and adaptation in this cyanobacterium. These responses can be investigated by various physiological and genetic experiments, e.g., by identifying differentially expressed genes (DEGs) under HL conditions (e.g., Bhaya et al., 2000; Singh et al., 2008; Mitschke et al., 2011; Hakkila et al., 2013; Ogawa et al., 2018; Cho et al., 2021; Turunen et al., 2022) or by identifying adaptive mutations after adaptive laboratory evolution (ALE) under HL (Dann et al., 2021).
To address the need for further studies on the mechanisms of HL acclimation in Synechocystis, RNA-Seq meta-analysis emerges as a promising tool. RNA-Seq, a high-throughput sequencing technique, allows the quantification of transcript abundance and provides valuable insights into gene expression dynamics. Meta-analysis, which involves the integration and analysis of multiple independent transcriptomic datasets, can increase the power and reliability of gene expression studies by combining data from different experiments (Paul and Barari, 2022). RNA-Seq meta-analysis allows researchers to pool and compare transcriptomic data from different studies, resulting in a comprehensive view of the HL response in Synechocystis. By integrating multiple datasets, it is possible to identify consistently regulated genes and pathways across different experimental conditions and genetic backgrounds. Furthermore, meta-analysis can uncover subtle but significant transcriptional changes that may be missed in individual studies with limited statistical power. Several meta-analysis methods have been developed to address the challenges associated with integrating RNA-Seq transcriptomic data. These include statistical meta-analysis, co-expression network analysis and pathway enrichment analysis. Statistical meta-analysis methods aim to combine effect sizes or raw RNA-Seq data from multiple studies to identify differentially expressed genes or expression patterns that are consistently dysregulated across datasets (Rau et al., 2014). However, several challenges and considerations need to be addressed when conducting meta-analyses of RNA-Seq data, in particular the interpretation of meta-analytic results given the variation in tissue specificity, experimental conditions and sample characteristics across included studies.
In the current study, we analyzed data from three experiments monitoring transcriptional changes in the laboratory type (LT) strain of Synechocystis under HL conditions compared to normal growth conditions. The aim of this study was to identify potential genes and/or pathways involved in the process of HL adaptation in this organism and to identify links between HL acclimation and adaptation by comparing our results with those found of Dann et al. (2021). In their comprehensive study, Dann et al. (2021) examined the genetic basis of HL tolerance in Synechocystis by subjecting it to random mutagenesis and adaptive evolution under HL conditions. The study involved whole-genome re-sequencing and conducting a detailed variant analysis, identifying 612 mutations, with a focus on mutations common to multiple lineages or genes with multiple mutations. The study reconstructed two mutations, specifically F124L in Slr0844 [NAD(P)H-quinone oxidoreductase subunit F] and R461C in Sll1098 (elongation factor EF-G2), in the Synechocystis background. In our current study, three genes with HL-adaptive mutations and differential expression under HL were identified and validated. The candidate non-synonymous SNPs were reconstructed in the glucose-tolerant, non-motile Synechocystis sp. PCC 6803 and their effects on growth and chlorophyll fluorescence were monitored. The results of this analysis will provide valuable information for future studies aimed at identifying the function of unknown genes and their potential response or regulatory roles in acclimation and adaptation to HL situations.
2 Methods
2.1 Searching and pre-processing transcriptomic data
We performed a meta-analysis by combining several RNA-Seq and microarray datasets obtained from two databases, the Gene Expression Omnibus (GEO) repository (http://ncbi.nlm.nih.gov/geo/) of the National Centre for Biotechnology Information (NCBI) and Array Express (http://www.ebi.ac.uk/arrayexpress/) of the European Bioinformatics Institute (EBI). The keywords used were “high light” with “Synechocystis sp. PCC 6803 [porgn:__txid1148]" as organism and “expression profiling by array” or “expression profiling by high throughput sequencing” as study type. Studies including control and HL-treated samples were considered. This search resulted in the curation of three RNA-Seq and three microarray studies, in addition to one microarray study that examined changes occurring in the tolerated strain compared to wild type (Table 1). This latter study was not included in the meta-analysis, but we used it for comparison. HL conditions of at least 200 μmol photons m−2 s−1 were used for the treatment. Samples from mutant strains were not used in the analysis.
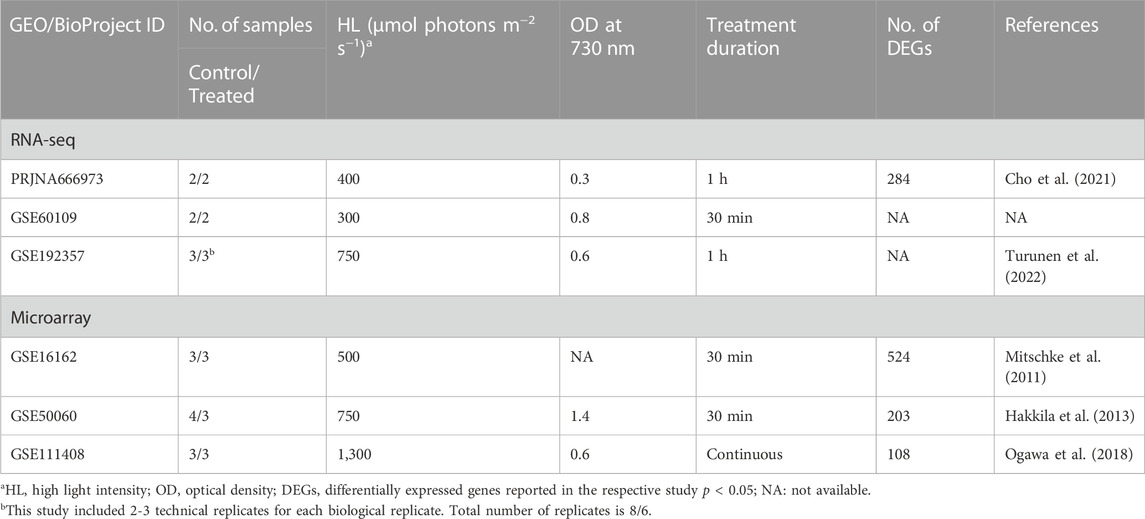
TABLE 1. The curated datasets from transcriptomic studies used in the current meta-analysis related to the response of Synechocystis sp. PCC 6803 to HL conditions.
For RNA-Seq experiments, the quality of the raw reads obtained was assessed using FastQC v0.11.9 (Andrews, 2010). Cutadapt v 4.1 (Martin, 2011) was used to filter out low quality reads and those containing adapters and/or more than 10% of N bases. The RNA-Seq error Corrector (Rcorrector) tool (Song and Florea, 2015) was used to perform k-mer correction on the filtered files using the default k-mer length. Finally, the filtered and corrected reads (clean reads) were used for further analysis.
For microarray studies, the GEOquery package v2.64.2 (Davis and Meltzer, 2007) in R v4.2.2 (https://www.r-roject.org/) using RStudio software v2022.07.2 + 576 was used to obtain the data from the NCBI GEO repository. Data were normalized using log2 transformation and used for further analysis.
2.2 Determination of differentially expressed genes in individual datasets
Each RNA-Seq experiment was analyzed individually and a list of differentially expressed genes (DEGs) was generated. For this, clean reads were aligned against the Synechocystis sp. PCC 6803 reference genome (ASM972v1) using BWA-MEM v0.7.17 (Li, 2013). The FeatureCounts tool v2.0.3 (Liao et al., 2013) was used to count the number of reads mapped to each known feature of the genome with default parameters but without counting multi-mapping reads. All count matrices generated were combined using an in-house Python script to prepare them for differential expression analysis. The DESeq2 package v1.36.0 (Love et al., 2014) in R was used to identify DEGs between different treatments. Count data generated by FeatureCounts were tested using the negative binomial distribution to compare light-treated samples with control replicates in each study. A given gene was identified as a DEG if it had a false discovery rate (FDR)-corrected p-value < 0.05 and a |log2(fold change)| > 1.
Similarly, microarray studies were analysed using the Linear Models for Microarray Data (limma) package v3.52.4 (Ritchie et al., 2015). The Bayesian adjusted t-statistic analysis was used. p-values were corrected using the FDR method and genes with FDR values less than 0.05 were identified as DEGs. Analysis scripts were generated for each dataset using the GEO2R tool (https://www.ncbi.nlm.nih.gov/geo/geo2r/) provided by the NCBI GEO.
2.3 Meta-analysis of transcriptomic data
In the current study, the metaRNASeq package v1.0.7 (Rau et al., 2014) in R was used for the meta-analysis of the curated RNA-Seq datasets. Fisher’s combination method (Fisher, 1992) and Stouffer’s inverse normal method (Stouffer et al., 1949) were used. The main difference between these two methods is that Stouffer’s method considers the number of replicates in each study analyzed, allowing the studies with a large number of biological replicates to have a larger effect than smaller studies. Only genes that were identified as DEGs by both methods were considered. Furthermore, genes with conflicting differential expression in different studies (downregulated in one study and upregulated in another) were not considered as DEGs. Similarly, the metaDE package v2.2.3 (Wang et al., 2012) in R was used to meta-analyze microarray datasets. Fisher’s combination method was applied. Genes with conflicting differential expressions were removed from the list of DEGs. A gene was considered as a DEG if the adjusted p-value of the given gene was less than 0.05. However, as the results of the meta-analysis of the microarray studies were not consistent (will be discussed later in the results section), the following analyses were performed on the DEGs identified in the RNA-Seq meta-analysis. The final list of DEGs was generated and used for further gene ontology (GO) and KEGG pathway enrichment analyses. The pheatmap package v1.0.12 in R was used to generate the heatmaps of the expression levels. The hierarchical clustering method (Ward, 1963) was applied.
2.4 GO and KEGG pathway enrichment analyses
The clusterProfiler package v4.4.4 (Wu et al., 2021) in R was used for KEGG pathway enrichment analysis. The list of DEGs identified under HL conditions was searched against all known KEGG pathways with an adjusted p-value cut-off of 0.05 using the Benjamini–Hochberg adjustment method (Benjamini and Hochberg, 1995). PANTHER Classification System v17.0 (Mi et al., 2019) was used to identify gene ontology (GO) terms affected by the identified DEGs in the three main categories, namely, biological process (BP), cellular component (CC) and molecular function (MF).
2.5 Validation of candidate non-synonymous SNPs
2.5.1 Strains and upkeep conditions
Experiments were performed on Synechocystis sp. PCC 6803, a glucose-tolerant and non-motile strain (designated as laboratory-type, LT) provided by Prof. Dr. Himadri Pakrasi (Washington University, St. Louis, United States) and cultivated in BG11 medium (defined, photoautotrophic medium, Rippka et al., 1979). To maintain the strains, they were routinely propagated on solid media (BG11-agar) under “upkeep” conditions. This entails continuous illumination with 25–50 μmol photons m−2 s−1 of warm-white light (Osram T5 FH 28W/830 HE High Efficiency LUMILUX Warm White G5) at 23°C.
2.5.2 Reconstruction of SNPs in Synechocystis LT
Marker-less gene editing of Synechocystis LT was accomplished through homologous recombination, following the “allele swapping” strategy detailed previously (Dann et al., 2021). To accelerate mutant generation, media were supplemented with 5 mM glucose and transformants were propagated in the presence of adequate concentrations of antibiotic (here, kanamycin) under “control conditions,” i.e., continuous illumination with 25–50 μmol photons m−2 s−1 of warm-white light (Osram T5 FH 14W/830 HE High Efficiency LUMILUX Warm White G5) at 30°C. Curation of the double-selection cassette (nptI-SacB) and complete segregation of mutant alleles were confirmed through PCR (Phire Plant Direct PCR Kit, Thermo Fisher Scientific, Waltham, MA, United States), followed by in-house Sanger sequencing.
2.5.3 Functional validation of mutant strains under HL conditions
Growth experiments were conducted under strictly controlled conditions employing 8-slot photobioreactors (Multi-Cultivators MC 1000-OD, Photon Systems Instruments, Drásov, Czech Republic), adapting the methodology described (Dann et al., 2021). Pre-cultures were grown at 23°C with 50 μmol photons m−2 s−1 of warm-white light while aerated with atmospheric air at a rate of 90–100 mL min−1 (ADM Flow Meter, Agilent Technologies, Santa Clara, CA, United States). Aliquots from these pre-cultures were used as inoculum to evaluate the adaptive potential of strains with point mutations under HL conditions. HL conditions were the same as those during the pre-culturing stage, except for the light intensity which was 700 μmol photons m−2 s−1.
Growth curves were reconstructed from optical density (OD) measurements taken periodically from the photobioreactors at λabs = 720 nm (OD720nm) every 15 min. The growth parameters were then calculated from the data using Widdel’s method (Widdel, 2007): Growth rate (µ) = (ln ODf−ln ODi)/(tf−ti) and generation time (tg) = 1/µ. The subscripts “f” and “i” refer to final and initial values, respectively.
Fitness scores “F” for each constructed mutant were calculated based on the method of Miao et al. (2023) using the area under curve (AUC) of the normalized growth rates to LT strain growth rates and expressed as optical density at 730 nm “OD730” over time “t” normalized by total cultivation time “max(t)” via the following equation:
After 7 days post inoculation (dpi), the HL treatment is completed and photographs are taken. Final cellular density was measured using a spectrophotometer (Ultrospec 2100 pro UV/Visible, Biochrom Ltd., Cambridge, United Kingdom) at λabs = 730 nm (OD730nm).
A gravimetric method to quantify dry weight per mL of media was conducted with the contents of each vessel. Cultures were gently collected and resuspended in 2 mL microtubes before being pelleted at maximum speed for 3 min. The supernatant was carefully removed and the cell material was dried in a rotary vacuum desiccator (Concentrator plus, Eppendorf, Hamburg, Germany) for about 3 h. Pellets were subsequently transferred onto a small (tared) square of paper before being weighed on an analytical scale.
2.5.4 Volumetric profiling
The volumetric profiling of Synechocystis strains was conducted with samples grown under HL conditions employing a CASY cell counter/analyzer (OMNI Life Science, Bremen, Germany) according to the manufacturer. HL-acclimated cultures were diluted 1:10000 in CASYton and measured in triplicate. Data was analyzed with the CASY Software provided by the manufacturer. To distinguish debris (including dead cells) from intact cells, a diameter threshold was empirically obtained for each strain, accordingly to the manufacturer’s guidelines. Basically, Synechocystis suspensions were treated with an alcoholic solution (CASYblue) to induce cell death, and these were then mixed in different proportions with non-treated cells before being diluted in CASYton and measured. The threshold for each strain was determined as the lowest value within the valley between both peaks (i.e., debris and cells). Final curves were reconstructed from image files generated with CASY Software.
2.5.5 Fluorescence at room temperature under incremental light
Fast fluorescence kinetics were measured using a FluorCam 800MF (Photon Systems Instruments, Drásov, Czech Republic). Synechocystis suspensions collected from pre-culturing conditions in photobioreactors (see Section 2.5.3) were washed once with fresh BG11 medium and normalized at OD730nm = 0.5. Then, 5 mL aliquots (10 per strain) were dark-incubated for 30 min and placed in 30 mm one-way Petri dishes before being measured four at a time in a FluorCam 800MF (Photon Systems Instruments, Drásov, Czech Republic) (Ogawa et al., 2018). The instrument sensitivity was adjusted manually (20%–30%) before running the standard “light curve” routine provided by the manufacturer: Fo− duration: 5 s, Fm− pulse: 800 ms, actinic light ON 10%: 60 s, actinic light ON 20%: 60 s, actinic light ON 40%: 60 s, actinic light ON 60%: 60 s, actinic light ON 80%, 60 s, actinic light ON 100%: 60 s, where Fo− and Fm− represent the (“quenched”) minimum and maximum fluorescence, respectively. Actinic light intensity at 100% was approximately 215 μmols of red-orange photons m−2 s−1 with λmax = 625 nm. Saturating pulses (cold-white 6500 K LEDs providing ∼1,200 µmol photons m−2 s−1) were administered immediately prior to and following actinic illumination, as well as between the incremental steps to determine quenching parameters. Once the “light curve” routine was completed, the “quenched” maximum fluorescence (Fm−) was obtained in the presence of 20 µM DCMU (Ogawa et al., 2017) employing an independent protocol consisting of a single saturating pulse. The highest Fm− value obtained per genotype was used to calculate the quenching parameters as follows: “quenched”quantum yield of PSII (Fv−/Fm−) = (Fm− - Fo−)/Fm−, coefficient of non-photochemical quenching of PSII variable fluorescence mid-illumination (qN) = 1 - (Fm′ - Fo′)/(Fm− - Fo−), i.e., 1 - (Fv′)/(Fv−) (Van Kooten and Snel, 1990). Fv is the variable fluorescence, Fo′ and Fm′ are the minimum and maximum fluorescence at steady-state mid-illumination, respectively.
3 Results
3.1 Differentially expressed genes in response to HL
Regarding the individual analysis of the datasets, our findings showed almost the same number of identified DEGs as reported by the respective studies (Table 1; Supplementary Tables S1, S2). In two individual RNA-Seq datasets, more downregulated DEGs were identified than upregulated ones, while in the other, more upregulated DEGs were observed (Figure 1A). In the microarray datasets, we observe the opposite picture with two individual datasets having more upregulated genes and one dataset with more downregulated genes (Figure 1A). In our meta-analysis, we identified 411 differentially expressed genes (DEGs) with a false discovery rate (FDR) of less than 0.05 from the analysis of three RNA-Seq experiments. Among these DEGs, 179 were unique to our meta-analysis (Figure 1B; Supplementary Table S1). Moreover, we found 447 DEGs from the analysis of microarray studies, of which 349 DEGs were unique to our meta-analysis (Figure 1C; Supplementary Table S2). Remarkably, only 43 genes were identified as DEGs in both analyses. Furthermore, the results of the microarray studies were not consistent. No genes were identified as DEGs in every microarray study and in the meta-analysis, only two genes were identified as DEGs in all individual microarray studies (Figure 1C). Therefore, we decided to continue the further analyses with the results of the RNA-Seq meta-analysis only.
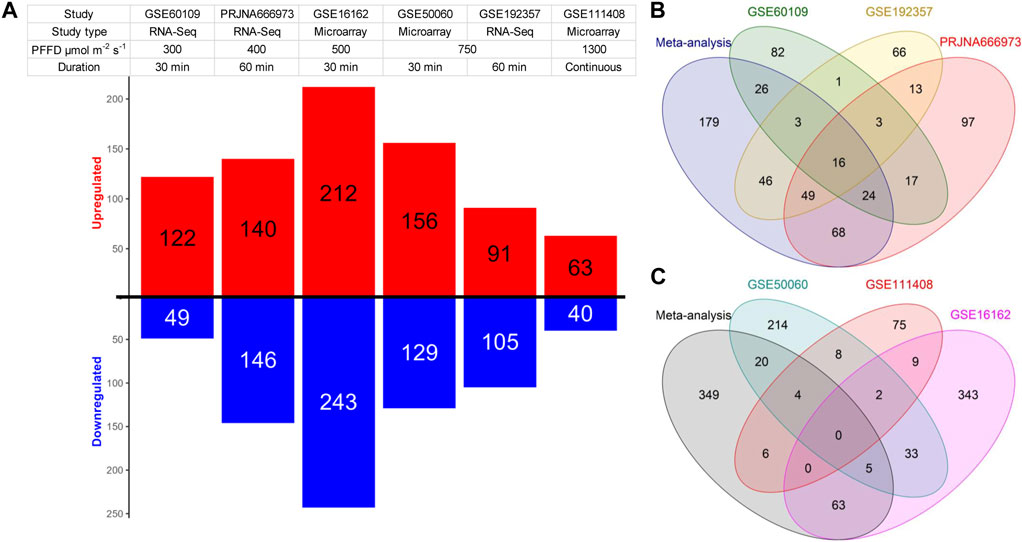
FIGURE 1. Summary of the DEGs identified in the individual studies included in the meta-analysis. (A) Red and blue bars depict the number of up and downregulated DEGs respectively in each dataset. (B,C) Venn diagrams illustrating the gene overlap between significant DEGs that were identified either in individual datasets or in the meta-analysis of the RNA-Seq (B) and the microarray (C) datasets.
In our meta-analysis of RNA-Seq datasets, we identified 180 upregulated and 231 downregulated DEGs (Figure 2A). The DEGs identified in the meta-analysis of RNA-Seq were grouped into two clusters with one cluster containing genes upregulated under HL and the other containing genes downregulated under HL. Similarly, the experiments were clustered into two groups with respect to growth conditions: control and HL (Figure 2A). The analysis of the set of 179 unique genes identified in the meta-analysis showed that the experiments were clustered into three groups, as two technical replicates (for the same biological replicate) of study GSE192357 (coded as study C) showed slightly different levels of regulation from other replicates (Figure 2B). The results of this analysis may partially explain the lack of ability to detect some DEGs through analyses of individual datasets. Nevertheless, the identified DEGs were grouped into two main clusters as an indication of the robustness of the results obtained (Figure 2B).
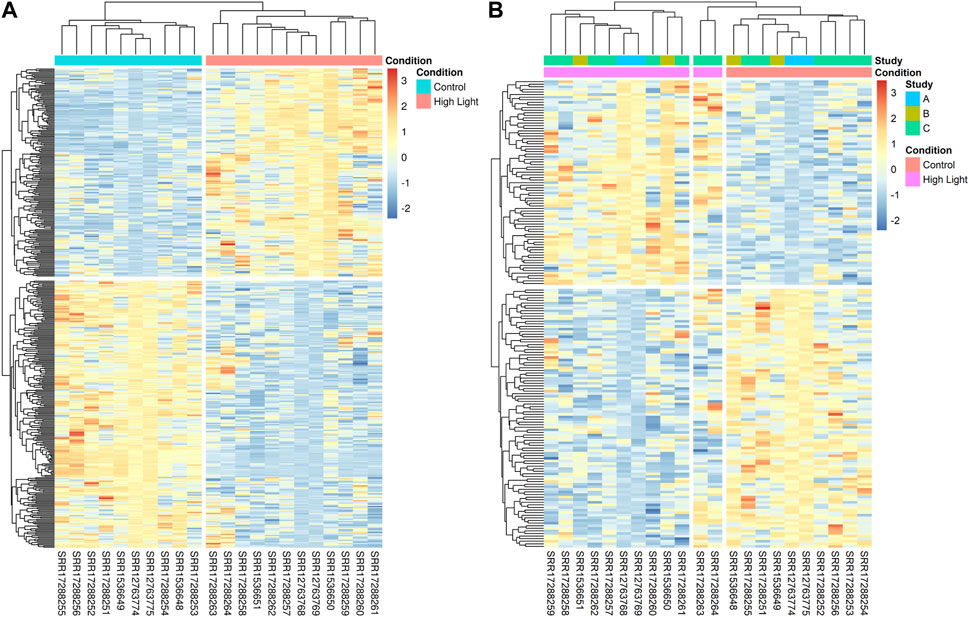
FIGURE 2. Identification of 411 HL DEGs by meta-analysis of the 3 different RNA-Seq datasets. (A) The heatmap shows the expression levels of the 411 DEGs identified in the meta-analysis across 10 and 14 replicates of samples grown under normal and HL conditions, respectively, with the DEGs divided into two clusters. The upper cluster contains 180 upregulated genes under HL compared to control conditions, while the lower cluster presents the 231 downregulated genes. (B) The expression levels of the 179 unique DEGs identified solely in the meta-analysis.
The majority of the identified DEGs (378 genes) were located on the main chromosome of Synechocystis and only 33 DEGs were located on the four different plasmids (Figure 3A). Out of all identified DEGs, 52 DEGs are involved in photosynthesis and antenna demonstrating the importance of these pathways in the acclimation of Synechocystis to HL conditions (Figure 3A). Interestingly, 4 DEGs are annotated as HL inducible (HLI) genes. A set of 303 genes is associated with metabolic processes beyond photosynthesis, highlighting the metabolic adaptations that occur in response to HL conditions. Furthermore, 52 genes have no known function and are not properly annotated (Figure 3A) indicating the need for further investigation to elucidate their roles in the response. Of the DEGs with unknown function, 33 genes were identified only in our meta-analysis, of which 13 genes were upregulated and 20 were downregulated under HL compared to control growth conditions. The annotation status and expression patterns of the 179 DEGs identified only by meta-analysis are shown in the stacked bar charts and heat maps in Supplementary Figures S1–S3.
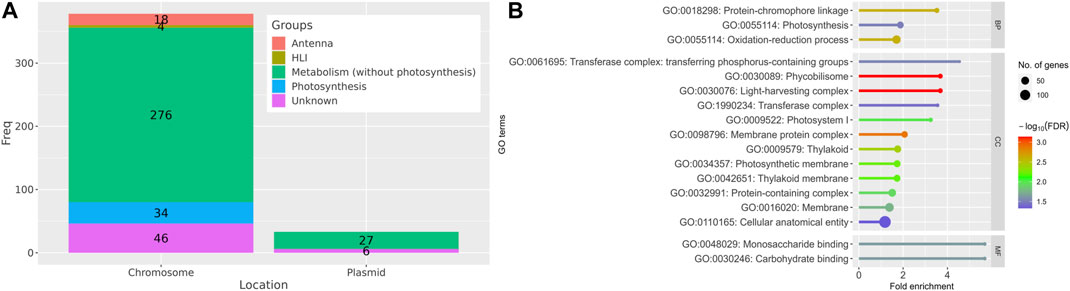
FIGURE 3. Categorization and functional annotation of the 411 DEGs identified in the meta-analysis. (A) Summary of localization and annotation of the DEGs. HLI: HL inducible genes. (B) The identified DEGs under HL conditions are significantly enriched (FDR < 0.05) in several Gene Ontology (GO) terms, including biological process (BP), cellular component (CC), and molecular function (MF), as compared to the control.
3.2 GO and KEGG pathway enrichment analyses
GO and KEGG pathway enrichment analyses provided insights into the functional implications of the identified DEGs. The potential roles of the identified DEGs in the cell were investigated by searching these genes against the gene ontology (GO) database. In “biological process” category, protein-chromophore binding, photosynthesis and oxidation-reduction process terms were enriched (Figure 3B) indicating the importance of these processes in the cellular response to HL. Monosaccharide and carbohydrate binding were the only terms enriched in the “molecular function” category. This finding could indicate the involvement of these molecules in the acclimation to HL conditions. Several “cellular component” terms were enriched, but mainly related to photosynthesis, e.g., photosystem (PS) I (8 genes), phycobilisome (11 genes), light-harvesting complex (11 genes), thylakoid (37 genes), thylakoid membrane (34 genes) and photosynthetic membrane (35 genes), highlighting the impact of HL conditions on the photosynthetic machinery and related structures.
The identified DEGs were also searched against the KEGG pathway database. This analysis further supported the involvement of photosynthesis (Figure 4) and carbon fixation (Supplementary Figures S4, S5) pathways in the response to HL conditions as four pathways related to these processes were enriched. Photosynthesis—antenna proteins, glycolysis/gluconeogenesis, photosynthesis and carbon metabolism were enriched with 12, 13, 23 and 26 genes respectively, suggesting their functional relevance in the acclimation of Synechocystis to HL conditions. All genes identified in photosynthetic antenna proteins were downregulated in HL samples compared to control conditions (Figure 4A). Similarly, all PSI genes were downregulated; however, 6 of the PSII genes showed slight to moderate upregulation and 2 genes (sll0427 “psbO” and slr1739 “psb28-2”) were significantly downregulated. Furthermore, ferredoxin-1 (petF) of the electron transport chain and several F-type ATPase enzymes showed downregulation (Figure 4B). This downregulation of antenna proteins and PSI genes, together with the upregulation of certain PSII genes, under HL conditions implies intricate regulatory mechanisms within the photosynthetic apparatus to maintain optimal performance and mitigate photodamage.
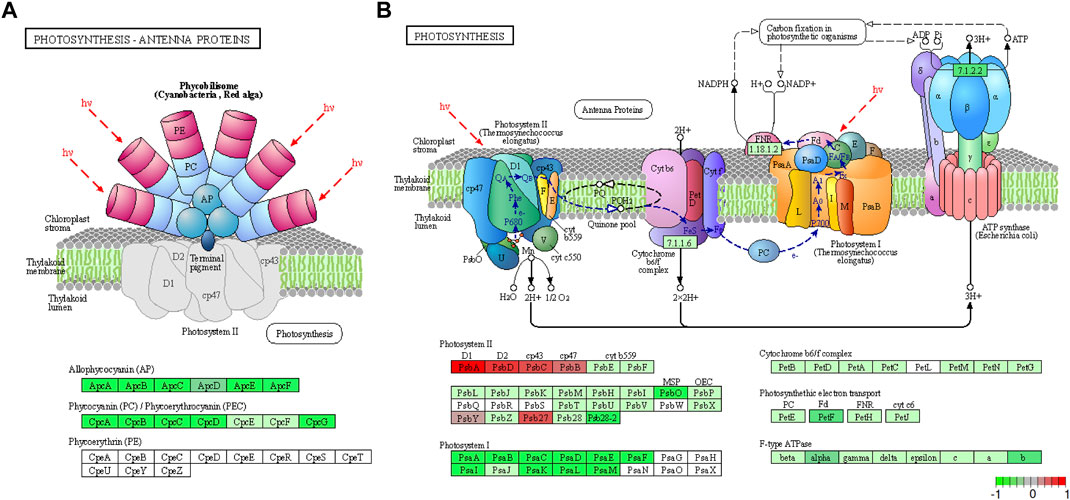
FIGURE 4. The meta-analysis identified the Photosynthesis – Antenna Proteins (A) and Photosynthesis (B) pathways as the most enriched by DEGs. In the case of antenna protein DEGs, all of them have been downregulated in HL conditions when compared to the control, while the PSI genes have been downregulated and most PSII genes have been upregulated in HL conditions. The KEGG graph has been visualized by utilizing Pathview.
3.3 Data mining to identify potential links between HL acclimation, gene fitness and adaptation
A plausible prediction is that CRISPR-based suppression of genes that are downregulated under HL could be beneficial for growth/fitness, whereas suppression of upregulated genes should be detrimental. This prediction can now be tested by determining the number of up and downregulated DEGs that strongly affect growth at HL conditions (1,000 μmol photons m−2 s−1), either negatively (fitness scores from −4 to −2) or positively (fitness scores from +2 to +4) following Miao et al. (2023)’s findings. Notably, for 24 upregulated HL DEGs, suppression of the corresponding gene resulted in strong negative effects on fitness (Supplementary Figure S6; Supplementary Table S3). However, no instances of substantially positive effects on fitness under HL were observed in the case of suppression of downregulated HL DEGs. Instead, the CRISPR suppression of a set of 23 genes that represent downregulated HL DEGs produced significant negative effects under HL (Supplementary Figure S6; Supplementary Table S3). This indicates that the assumption that suppressing the function of genes that are either up or downregulated at the transcript level under certain conditions will automatically lead to decreased or increased fitness under the same condition, respectively, is too simplistic.
Next, we compared the results of the current meta-analysis with the results of previous ALE experiments performed in our laboratory (Dann et al., 2021) to identify potential links between acclimation and adaptation to HL conditions in Synechocystis. The comparison showed that 17 DEGs identified in this study were found to be mutated in the HL ALE experiments of Dann et al. (2021). Of these, 12 genes had non-synonymous SNPs, 3 genes had synonymous SNPs, 1 gene had an insertion and 1 gene had a deletion. Under HL, 7 of these genes were upregulated and 10 were downregulated (Figure 5). The 12 genes identified as HL DEGs in this study, which carry non-synonymous mutations after the ALE experiment of Dann et al. (2021), constitute a potential link between acclimation and adaptation to HL in Synechocystis. These genes encode for proteins with diverse functions (Table 2). Three of these 12 genes (sll0267, sll0355, and slr1855) have sequence similarities with proteins involved in organism-environment interactions and/or have been previously reported to be differentially expressed upon environmental changes (see below) and were selected for functional validation of their role in HL acclimation. Notably, sll0267 and sll0355 are upregulated DEGs during HL, while slr1855 is downregulated under HL conditions.
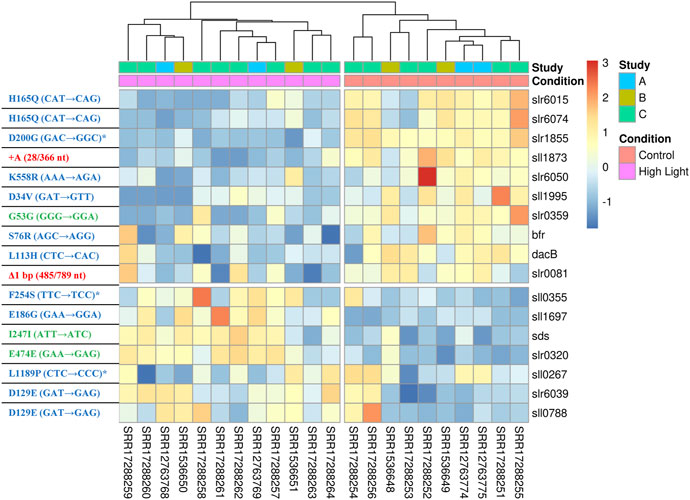
FIGURE 5. A heat map showing the expression levels of the 17 DEGs that were mutated in the previous ALE experiments of Dann et al. (2021). The left-hand side of the panel contains information on each mutated gene, with red, green, and blue colors indicating indels, synonymous SNPs, and non-synonymous SNPs, respectively. The mutations marked with an asterisk were selected for functional validation under HL (refer to Figure 6 and main text).
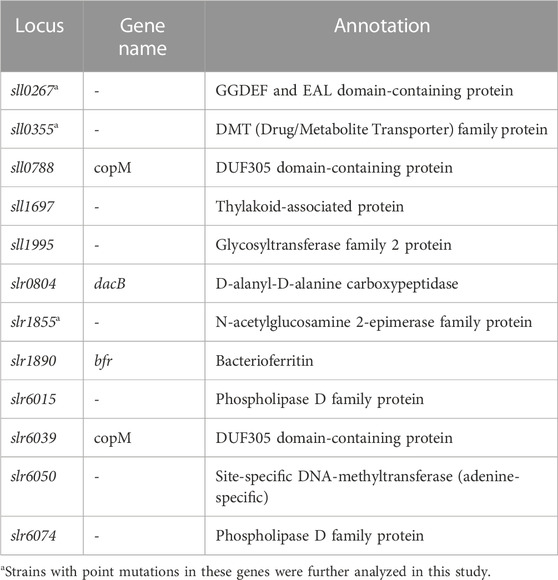
TABLE 2. Annotations of the 12 genes that showed differential expression under HL conditions and non-synonymous SNPs in the HL ALE experiment of Dann et al. (2021).
The gene sll0267 codes for a protein containing GGDEF and EAL domains, typical components of signaling molecules involved in cyclic diguanylate (c-di-GMP) metabolism (Paul et al., 2004; Tamayo et al., 2005), which plays a crucial role in modulating bacterial behavior and responses to environmental stimuli (Merritt et al., 2007). It has been noted that c-di-GMP domains in cyanobacteria typically associate with photoreceptor-related domains (Agostoni et al., 2013). These photoreceptor domains include blue light photoreceptor domains, such as the light, oxygen or voltage (LOV) domain. Wallner et al. (2020) demonstrated that blue light increased the concentration of c-di-GMP by 2-fold in Synechocystis and that this effect relied on the phytochrome-like protein Cph2, which activates the GGDEF domain during blue light exposure (Savakis et al., 2012).
The sll0355 gene encodes a transporter from the DMT (Drug/Metabolite Transporter) family, which is recognized for its role in the transport of different molecules such as metabolites, drugs and signaling molecules across cellular membranes (Jack et al., 2001). Moreover, amino acid sequence analysis of the corresponding protein suggests that the chloroplastic WAT1-related protein (At3g02690) in Arabidopsis thaliana and Arabidopsis lyrata subsp. lyrate may be a potential homolog. In plants, the genes encoding WAT1-related proteins exhibit responsiveness to diverse environmental stimuli, such as HL (Sang et al., 2022), elevated temperature (Zhao et al., 2021), drought (Guo et al., 2017) and heavy metals (Leng et al., 2015; Pandey et al., 2022; Zhou et al., 2023). These genes are also implicated in the regulation of chlorophyll levels (Siddique et al., 2021). Interestingly, the sll0355 gene showed a more than 2-fold increase in expression upon exposure to 60 µmol photons m−2 s−1 of UV-B for 2 h and a slightly higher upregulation upon exposure to 200 µmol photons m−2 s−1 of white light for 2 h (Huang et al., 2002). It has also been shown to be specifically induced by cold treatment in Synechocystis (Sinetova and Los, 2016).
The slr1855 gene encodes an epimerase/isomerase of the AGE family and is similar to bacterial porins (Sergeyenko and Los, 2000). The expression of this gene was significantly downregulated under low temperature exposure (Suzuki et al., 2001), high temperature and salty conditions (Sergeyenko and Los, 2002), which is consistent with its downregulation under HL as observed in this study.
3.4 Validation of potential adaptive alleles under HL conditions
Strains carrying the ALE mutations of the three genes mentioned above, namely, sll0267L1189P (HL3), sll0355F254S (HL4) and slr1855D200G (HL5), were generated. To this end, corresponding point mutations were introduced in the Synechocystis LT background. Analysis of growth showed that all three mutations had a positive effect on growth in HL conditions (Figure 6A). HL3, HL4, and HL5 had significantly higher cell densities at the end of the cultivation compared to the LT control (+205%, +360%, and +197%; with p = 9.24 × 10⁻¹⁴, 0.00, 7.96 × 10⁻⁶, respectively, according to Bonferroni-Holm simultaneous comparison; Figure 6B). This correlated with an increased accumulation of biomass in all mutants (+151%, +702%, and +459% more than LT; with p = 1.41 × 10⁻³, 1.08 × 10⁻¹², and 1.66 × 10⁻⁹, for HL3, HL4, and HL5 respectively), determined gravimetrically as dry weight per culture volume. The growth advantage of HL4 and HL5 became even more evident in Figure 6B (middle), as the dry weight of both mutants was drastically higher than what would be predicted by the final OD730nm measurements. This occurs because aggregated cells, which were abundant in HL4 and HL5 cultures, escape solution and cannot be accounted for by the Beer-Lambert law.
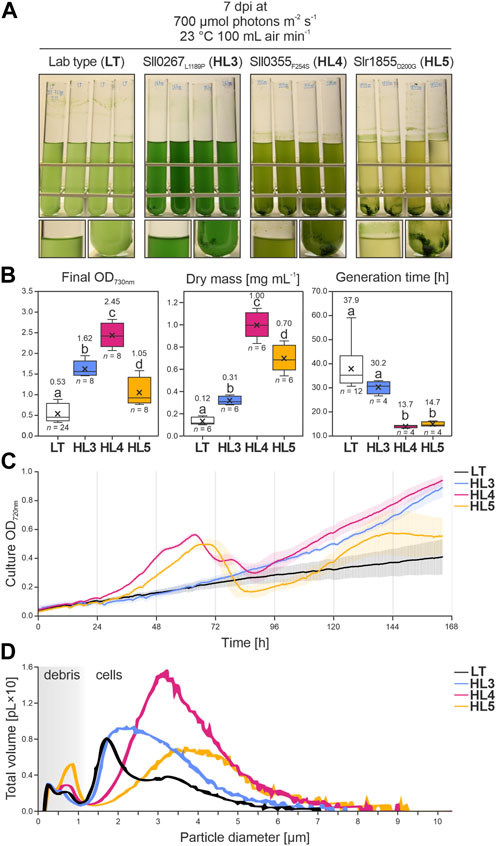
FIGURE 6. Growth of Synechocystis point-mutation strains under HL conditions. (A) Images of the Synechocystis control strain (laboratory type, LT) and three point-mutation strains (Sll0267L1189P, HL3; Sll0355F254S, HL4; and Slr1855D200G, HL5) grown at 700 µmol photons m−2 s−1, 23°C, and 100 mL air min−1. Photographs were taken 7 days after inoculation (dpi). (B) Data distribution from each strain regarding cellular density at the end of cultivation, measured as optical density at λabs = 730 nm (OD730nm) (left panel); dry mass per mL of fresh media, determined gravimetrically (middle panel); and generation time (in hours) calculated from the exponential growth phase (right panel) according to Widdel. (2007). The horizontal middle lines indicate the inclusive medians, the crosses indicate the average values, the boxes indicate the second and third quartiles, the whiskers indicate the first and fourth quartiles, and the points outside the whisker ranges represent outliers beyond 1.5 times the interquartile range. Sample size (n) and average values are provided. Lowercase letters indicate statistically significant differences with p ≤ 0.05 according to post hoc Bonferroni-Holm simultaneous comparison of all measurements after significant differences between groups were detected by one-factorial ANOVA. (C) Growth curves for each strain cultivated under the conditions in A were monitored at OD720nm. Colored vertical lines indicate the standard deviation. (D) Volumetric profile of each strain under the conditions in A, measured using a CASY cell counter (OMNI Life Science, Bremen, Germany). The x-axis represents the particle diameter (in micrometers), with a distinction between cells and debris, and the y-axis represents the sum of all volumes (in picolitres ×10) of (spherical) particles with a certain diameter. Data were derived from four biological replicates per strain, except for the control LT, for which 12 biological replicates were prepared.
While the generation times of HL3 were not statistically different from the LT control, optical densities in the mutant cultures continued to increase and became notably higher than the paternal strain after about 96 h (Figure 6C). By the end of cultivation, cell densities of HL3 grown at 700 µmol photons m−2 s−1 (Figure 6B) were similar to those reported for the point-mutation strain HL1 by Dann et al. (2021). On the other hand, the generation times of HL4 and HL5 were significantly improved (i.e., decreased) by 64% and 61%, respectively (with p = 1.06 × 10⁻⁵ and 1.54 × 10⁻⁵, respectively). Furthermore, growth curves under HL conditions show that while HL3 maintains a steady growth, cell densities of HL4 and HL5 cultures fluctuate, peaking between 48 and 72 h post-inoculation (Figure 6C). The subsequent decline in OD720nm is a result of cell sinking and adhesion to the glass tubes. This occurs as cells aggregate, likely due to the rapid consumption of nutrients in the BG11 medium induced by the accelerated growth of HL4 and HL5 (Allen et al., 2019, and references therein). Both mutants continue to grow after 24 h, but HL5 cultures relapse, concentrating their biomass at the bottom of the vessel.
The volumetric profile of LT cultures under HL conditions shows a sharp peak (between 1 and 2 µm) with a biovolume that was mostly represented by ∼1.95 µm-diameter particles (Figure 6D), which is a typical size for Synechocystis LT cells (1.67–2.46 µm; Zavřel et al., 2017). The volumetric shoulder peaking at ∼3 µm seems to be a subpopulation of LT cells about twice as wide. The volumetric profiles of all point-mutation strains show biovolumes peaking at wider diameters than the LT control. HL3 exhibited a right-skewed asymmetric shoulder with a mean particle diameter of 2.45% ± 1.0% µm; HL4 presented the largest biovolume (i.e., the highest peak), composed mostly of cells with a diameter of 2.94% ± 0.5% µm; and HL5 displayed a wide range of large particles with a mean diameter of 3.18% ± 0.8% µm (see Supplementary Table S4; Figure 6D). The size of Synechocystis cells typically maintains a negative correlation with generation time, as cell volume increases in proportion with growth rates (see Du et al., 2016). Interestingly, the mean cell diameter in the point-mutation strains corresponds to the degree of aggregation observed in Figure 6A, i.e., LT < HL3 < HL4 < HL5. This implies that the increased surface area of the enlarged Synechocystis mutant cells likely contributed to the aggregation phenotypes observed under HL conditions.
In the next step, fitness scores based on growth were calculated (see Methods) to allow a preliminary comparison of the positive effect of the point mutations on growth with the effects of suppression of gene function (Miao et al., 2023). Three mutants, HL3 (sll0267L1189P), HL4 (sll0355F254S), and HL5 (slr1855D200G), showed fitness values of 0.216 ± 0.025, 0.403 ± 0.041, and 0.146 ± 0.092, respectively (Table 3). Miao et al. (2023) reported comparable enhancements in fitness resulting from the suppression of the sll0267 and slr1855 genes. However, sll0355 suppression had little impact on fitness/growth, while sll0355F254S showed a modest yet definitive positive effect. These findings suggest that the enhanced HL tolerance exhibited by HL3 and HL5 may be associated with gene function loss, whereas the impacts observed in HL4 differ from those observed through CRISPR-based gene suppression.
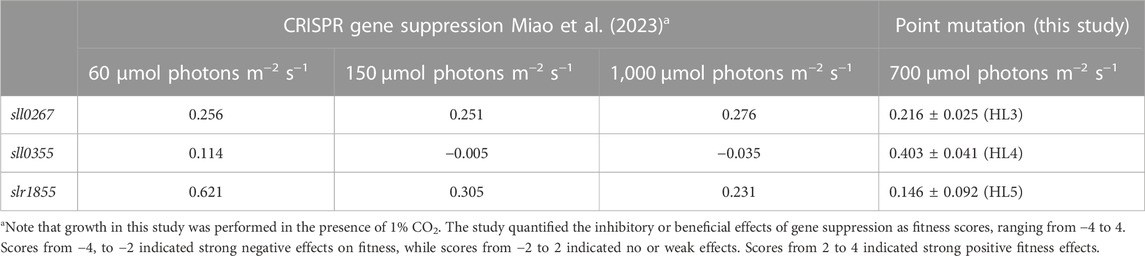
TABLE 3. Comparison of fitness scores derived from gene suppression or point mutations in the three genes sll0267, sll0355 and slr1855.
All three mutants showed comparable levels of chlorophyll fluorescence when exposed to incremental red-orange light (Figure 7A; Supplementary Table S5). The analysis of fluorescence at room temperature in cyanobacteria is non-trivial, as the parameters are easily underestimated due to the co-localization of both the photosynthetic and respiratory machinery in the thylakoid membranes, leading to the reduction of the theoretical maximum fluorescence (Fm) to an “apparent” or “quenched” maximum (Fm−). The same applies to the minimum fluorescence (Fo), which is considered as “quenched” minimum fluorescence (Fo−) (Ogawa et al., 2017).
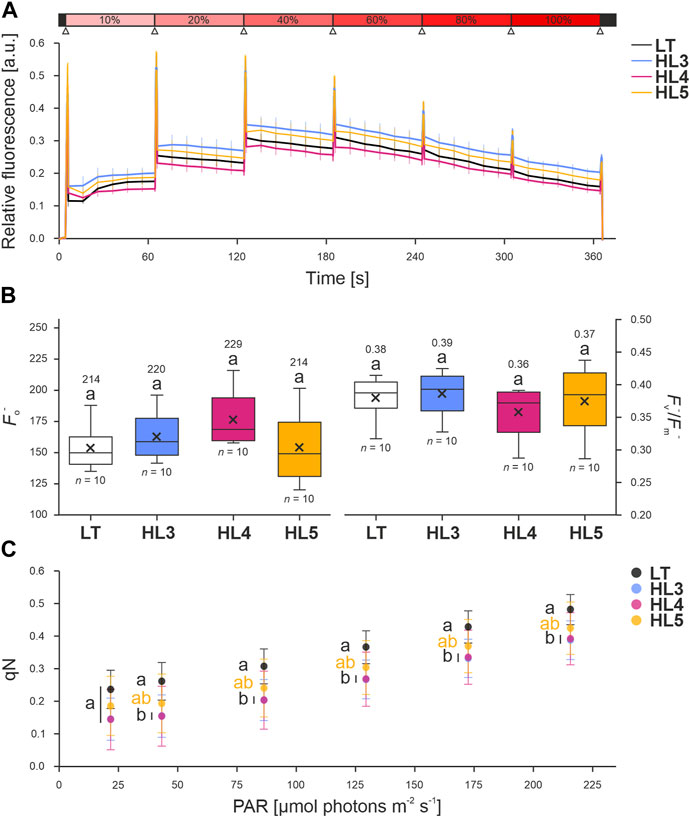
FIGURE 7. Fluorescence of Synechocystis point-mutation strains under incremental illumination. Liquid cultures of the Synechocystis control strain (laboratory type, LT) and three point-mutation strains (Sll0267L1189P, HL3; Sll0355F254S, HL4; and Slr1855D200G, HL5) were dark-incubated and placed in small one-way Petri dishes before prior measurement in a FluorCam 800MF (Photon Systems Instruments, Drásov, Czech Republic). (A) Fluorescence trace of liquid cultures, normalized to the (quenched) minimum fluorescence (Fo−), when exposed to incremental illumination. Colored vertical lines indicate the standard deviation. The “light saturation curve” routine (see Methods) is shown above: dark periods are indicated in black, actinic red-orange light (100%∼215 μmols photons m−2 s−1; λmax = 625 nm) in red, and saturating pulses (cold-white 6500 K LEDs providing ∼1,200 µmol photons m−2 s−1) as upward triangles in white. (B) Effect of incremental illumination on the parameter qN, the coefficient of non-photochemical quenching of PSII variable fluorescence in mid illumination, calculated from the data in A [as described by Campbell and Oquist (1996)]. (C) Data distribution of (left) Fo− measured from dark-incubated samples and (right) “quenched” quantum yield of PSII (Fv−/Fm−), calculated after determining the “quenched” maximum fluorescence (Fm−) in the presence of 20 µM DCMU. Sample size (n) and average values are provided. Lowercase letters denote statistically significant differences with p ≤ 0.05 according to post hoc Bonferroni-Holm simultaneous comparison of all measurements after significant differences between groups were detected by one-factorial ANOVA.
The baseline signal, defined by the “quenched” minimum fluorescence or Fo−, and the “quenched” quantum yield of PSII (Fv−/Fm−) were both statistically comparable between all strains (i.e., p > 0.5 according to Bonferroni-Holm simultaneous comparison), but minor disturbances were noted, particularly in HL4 samples (Figure 7B). The baseline fluorescence is determined by illuminating dark-acclimated cells with low irradiance, which does not drive photosynthesis. In addition to PSII fluorescence, Fo in cyanobacteria is contributed by both PSI and phycobilisomes (PBS) fluorescence (Kalaji et al., 2017; Ogawa et al., 2017). Although ruled out as statistically insignificant, the slightly increased Fo− in HL4 implies that Sll0355F254S may have altered the PSI-PSII-PBS stoichiometries. This is likely due to the more abundant peripheral antennae, as these contribute to more than 60% of non-quenched Fo (i.e., measured when the PQ pool is oxidized, Ogawa and Sonoike, 2016).
Similar to Fo−, the “quenched” quantum yield of PSII was comparable among all strains (i.e., p > 0.5 according to Bonferroni-Holm simultaneous comparison; Figure 7B). The maximum quantum yield of PSII is as a widely used parameter in plant sciences for describing photosynthetic capacity. Mathematically, it corresponds to the fraction of variable fluorescence (Fv = Fm − Fo) relative to the maximum fluorescence (Fm), commonly written as Fv/Fm (Kitajima and Butler, 1975). A saturating pulse is used to determine this parameter after Fo has been established (i.e., in the dark). However, non-photochemical quenching of PSII fluorescence (NPQ) remains active in cyanobacteria due to the interference of respiratory components, leading to an underestimation of both Fv and Fm (Ogawa et al., 2017). Furthermore, basal fluorescence from PBS also contributes to the underestimation of Fm, even in the presence of the PSII inhibitor DCMU (Ogawa and Sonoike, 2016). In anticipation of these underestimations, this parameter needs to be referred to as the “apparent” or “quenched” quantum yield of PSII, Fv−/Fm− (Ogawa et al., 2017). Nevertheless, in a conservative analysis, this observation implies that PSII abundance was minimally altered, if at all, in these mutants.
The main contributor to NPQ in cyanobacteria is state transition (Campbell and Oquist, 1996; Ogawa et al., 2017; and references therein). State transition refers to the energetic decoupling of peripheral antennae, i.e., PBS, from PSII, which favors excitation transfer to PSI [see review by Calzadilla and Kirilovsky (2020)]. Since the fluorescence yield of PSI chlorophylls at room temperature and mid-illumination is negligible compared to that of PSII [early observations by Krause and Weis (1984); reviewed by Kalaji et al. (2017)], state transition reduces the overall signal. It is noteworthy that NPQ in cyanobacteria might be underestimated due to the co-location of photosynthetic and respiratory machinery in the thylakoid membranes. This occurs even in the dark, as respiratory components such as dehydrogenases can supply electrons to the plastoquinone (PQ) pool, inducing its reduction. This downregulates light harvesting to PSII, resulting in the generalized reduction of fluorescence to “apparent” or “quenched” values, such as Fm− and Fo− (see Ogawa et al., 2017, and references therein). The process of NPQ was monitored as the parameter qN (Van Kooten and Snel, 1990), which is the coefficient of nonphotochemical quenching of PSII variable fluorescence at mid-illumination. The parameter qN was significantly reduced (i.e., p ≤ 0.5 according to Bonferroni-Holm simultaneous comparison) in HL3 and HL4 when exposed to incremental light intensities (Figure 7C), indicating a reduction in state transition.
4 Discussion
The results of the present study extend the repertoire of tentative components involved in the response of Synechocystis to HL. Based on the expression patterns of the DEGs identified, two distinct clusters were observed under HL. One cluster comprised upregulated genes, while the other contained downregulated genes. These findings indicate that the Synechocystis genome responds concertedly to HL by activating or repressing specific genes to adapt to the challenging conditions. By assigning the fitness scores of CRISPR-based suppression strains under HL to corresponding up or downregulated DEGs, we found that predicting the fitness of corresponding suppression lines based on the up or downregulation of transcript accumulation under the same conditions is virtually impossible. However, it must be noted that the criteria utilized by Miao et al. (2023) to assess the fitness scores differ from our methodology in terms of light intensity (1,000 vs. 700 μmol photons m−2 s−1) and other factors.
This study has recognized 12 DEGs carrying non-synonymous mutations following the ALE experiment of Dann et al. (2021). The ALE point mutations found in three of these 12 genes (sll0267, sll0355, and slr1855) were functionally validated and found to enhance growth under HL conditions. Consistent evidence for HL-tolerant phenotypes was observed when analyzing final biovolume, dry mass, and optical densities as well as growth parameters such as generation times. The accelerated growth of HL4 and HL5 seems to allow Synechocystis cells to increase in volume, which together with a rapid depletion of nutrients might have resulted in significant cell aggregation and sinking in these mutants. Cell aggregation is modulated by blue light-dependent c-di-GMP signaling in Synechocystis (Enomoto et al., 2023), and is believed and is believed to protect cells from HL protect cells from HL via self-shading (Conradi et al., 2019). But interestingly, HL3 carrying a point mutation in the gene sll0267 that has been implicated in c-di-GMP signaling by its GGDEF and EAL domains displays increased HL tolerance in the absence of cell aggregation. In a HL-tolerant (Tol) strain of Synechocystis PCC6803 obtained through an ALE experiment, a point mutation in slr1916 (a predicted esterase), slr1916C53Y, was identified (Yoshikawa et al., 2021). This mutation likely represents a loss-of-function mutation, as the knockout strain showed similar HL tolerance and increased cell aggregation as the point mutant strain (Yoshikawa et al., 2021). These findings suggest that cell aggregation may correlate with increased HL tolerance, but it is not an essential requirement (see HL3).
Moreover, NPQ was altered in HL3 and HL4, which was evident as a decrease in the coefficient of non-photochemical quenching of PSII variable fluorescence when exposed to incremental red-orange light. This observation has been linked to a reduction in state transition (Campbell and Oquist, 1996). This seems counter intuitive, as NPQ is a well-known photoprotective process that allows the cell to dissipate excess light energy as heat. In Synechocystis, the orange carotenoid protein (OCP) plays a major role in the regulation of this process upon exposure to HL (see Sluchanko et al., 2018, and references therein). This soluble pigmented protein complex is able to act as a light sensor, changing from its inactive orange form to its active red conformation in the presence of elevated light intensities (Kirilovsky and Kerfeld, 2016). The active form of OCP then binds to the PBS core, triggering NPQ and preventing overexcitation of PSII and the concomitant damage of the sensitive D1 subunit. It is unclear whether limited NPQ is the process behind the adaptation in HL3 and HL4 or merely a consequence of it, i.e., as an upregulation of light harvesting due to increased cell density.
An obvious question is what effect the point mutations in the three genes studied have on gene function: whether there is a loss of function, a change in protein accumulation due to altered stability or expression, or a gain of function. Our comparison of the fitness scores determined by Miao et al. (2023) for the suppression strains of sll0267, sll0355, and slr1855 and the fitness scores we determined based on the growth behavior for our three point-mutation strains of the same genes indicates that one of them is not a loss-of-function line. As mentioned above, the different growth conditions used by Miao et al. (2023) and this study do not allow firm conclusions, but it seems clear that at least one mutation does not cause a loss of function, but has more subtle effects on gene function. Additional research can clarify this by utilizing knock-out and overexpression lines as controls.
In conclusion, this study provides valuable insights into the transcriptional response of Synechocystis sp. PCC 6803 to HL. The identification of DEGs, their expression patterns, localization, and functional annotations contribute to our understanding of the molecular mechanisms underlying HL acclimation in Synechocystis. The results emphasize the significance of coordinated gene expression, metabolic adaptations, and regulation of photosynthesis in addressing challenges presented by HL. The study provides convincing evidence that evolution targets the same genes regulated during acclimation, connecting reversible physiological responses to short-term environmental changes with adaptation that alter the activity of encoded proteins by (point) mutations. Further research and experimental validation of the identified candidate genes are necessary to understand their molecular functions. In general, combining the analysis of DEGs and differentially expressed proteins with large-scale functional analyses, such as the CRISPR- and ALE-based methods described by Dann et al. (2021) and Miao et al. (2023), will be crucial to comprehensively understanding the adjustment mechanisms of HL in Synechocystis.
Data availability statement
The original contributions presented in the study are included in the article/Supplementary Material, further inquiries can be directed to the corresponding author.
Author contributions
EA-S: Conceptualization, Data curation, Formal Analysis, Investigation, Software, Validation, Visualization, Writing–original draft. TF-G: Conceptualization, Investigation, Validation, Visualization, Writing–original draft. DL: Conceptualization, Funding acquisition, Project administration, Writing–review and editing.
Funding
The author(s) declare financial support was received for the research, authorship, and/or publication of this article. The work in the authors’ laboratory is supported by the ERC (Synergy project Photoredesign project number 854126), the Deutsche Forschungsgemeinschaft (CRC Transregio 175) and the Deutscher Akademischer Austauschdienst.
Acknowledgments
The authors would like to thank Sabine Jarzombski for her technical assistance.
Conflict of interest
The authors declare that the research was conducted in the absence of any commercial or financial relationships that could be construed as a potential conflict of interest.
Publisher’s note
All claims expressed in this article are solely those of the authors and do not necessarily represent those of their affiliated organizations, or those of the publisher, the editors and the reviewers. Any product that may be evaluated in this article, or claim that may be made by its manufacturer, is not guaranteed or endorsed by the publisher.
Supplementary material
The Supplementary Material for this article can be found online at: https://www.frontiersin.org/articles/10.3389/fphbi.2023.1290382/full#supplementary-material
References
Agostoni, M., Koestler Benjamin, J., Waters Christopher, M., Williams Barry, L., and Montgomery Beronda, L. (2013). Occurrence of cyclic di-gmp-modulating output domains in cyanobacteria: an illuminating perspective. mBio 4 (4), 004511–e513. doi:10.1128/mbio.00451-13
Allen, R., Rittmann, B. E., and Curtiss, R. (2019). Axenic biofilm formation and aggregation by Synechocystis sp. strain PCC 6803 are induced by changes in nutrient concentration and require cell surface Structures. Appl. Environ. Microbiol. 85 (7), e02192–e02118. doi:10.1128/AEM.02192-18
Andrews, S. (2010). FastQC: a quality control tool for high throughput sequence data. Available at: http://www.bioinformatics.babraham.ac.uk/projects/fastqc.
Angermayr, S. A., Hellingwerf, K. J., Lindblad, P., and Teixeira de Mattos, M. J. (2009). Energy biotechnology with cyanobacteria. Curr. Opin. Biotechnol. 20 (3), 257–263. doi:10.1016/j.copbio.2009.05.011
Benjamini, Y., and Hochberg, Y. (1995). Controlling the False Discovery Rate: a practical and powerful approach to multiple testing. J. R. Stat. Soc. Ser. B Methodol. 57 (1), 289–300. doi:10.1111/j.2517-6161.1995.tb02031.x
Bhaya, D., Vaulot, D., Amin, P., Takahashi, A. W., and Grossman, A. R. (2000). Isolation of regulated genes of the cyanobacterium Synechocystis sp. strain PCC 6803 by differential display. J. Bacteriol. 182 (20), 5692–5699. doi:10.1128/JB.182.20.5692-5699.2000
Bobrovskikh, A. V., Zubairova, U. S., Bondar, E. I., Lavrekha, V. V., and Doroshkov, A. V. (2022). Transcriptomic data meta-analysis sheds light on high light response in Arabidopsis thaliana L. Int. J. Mol. Sci. 23 (8), 4455. doi:10.3390/ijms23084455
Calzadilla, P. I., and Kirilovsky, D. (2020). Revisiting cyanobacterial state transitions. Photochem. Photobiol. Sci. 19 (5), 585–603. doi:10.1039/c9pp00451c
Campbell, D., and Oquist, G. (1996). Predicting light acclimation in cyanobacteria from nonphotochemical quenching of photosystem II fluorescence, which reflects state transitions in these organisms. Plant Physiol. 111 (4), 1293–1298. doi:10.1104/pp.111.4.1293
Cho, S. H., Jeong, Y., Hong, S. J., Lee, H., Choi, H. K., Kim, D. M., et al. (2021). Different regulatory modes of Synechocystis sp. PCC 6803 in response to photosynthesis inhibitory conditions. mSystems 6 (6), e0094321. doi:10.1128/mSystems.00943-21
Conradi, F. D., Zhou, R. Q., Oeser, S., Schuergers, N., Wilde, A., and Mullineaux, C. W. (2019). Factors controlling floc formation and structure in the cyanobacterium Synechocystis sp. Strain PCC 6803. J. Bacteriol. 201 (19), e00344-19. doi:10.1128/JB.00344-19
Dann, M., Ortiz, E. M., Thomas, M., Guljamow, A., Lehmann, M., Schaefer, H., et al. (2021). Enhancing photosynthesis at high light levels by adaptive laboratory evolution. Nat. Plants 7 (5), 681–695. doi:10.1038/s41477-021-00904-2
Davis, S., and Meltzer, P. S. (2007). GEOquery: a bridge between the gene expression Omnibus (GEO) and BioConductor. Bioinformatics 23 (14), 1846–1847. doi:10.1093/bioinformatics/btm254
Du, W., Jongbloets, J. A., Hernández, H. P., Bruggeman, F. J., Hellingwerf, K. J., and dos Santos, F. B. (2016). Photonfluxostat: a method for light-limited batch cultivation of cyanobacteria at different, yet constant, growth rates. Algal Res. 20, 118–125. doi:10.1016/j.algal.2016.10.004
Enomoto, G., Wallner, T., and Wilde, A. (2023). Control of light-dependent behaviour in cyanobacteria by the second messenger cyclic di-GMP. microLife 4, uqad019. doi:10.1093/femsml/uqad019
Fisher, R. A. (1992). “Statistical methods for research workers,” in Breakthroughs in statistics (New York, NY; Springer), 66–70.
Guo, M., Li, S., Tian, S., Wang, B., and Zhao, X. (2017). Transcriptome analysis of genes involved in defense against alkaline stress in roots of wild jujube (Ziziphus acidojujuba). PLOS ONE 12 (10), e0185732. doi:10.1371/journal.pone.0185732
Hackenberg, C., Engelhardt, A., Matthijs, H. C. P., Wittink, F., Bauwe, H., Kaplan, A., et al. (2009). Photorespiratory 2-phosphoglycolate metabolism and photoreduction of O2 cooperate in high-light acclimation of Synechocystis sp. strain PCC 6803. Planta 230 (4), 625–637. doi:10.1007/s00425-009-0972-9
Hakkila, K., Antal, T., Gunnelius, L., Kurkela, J., Matthijs, H. C., Tyystjärvi, E., et al. (2013). Group 2 sigma factor mutant ΔsigCDE of the cyanobacterium Synechocystis sp. PCC 6803 reveals functionality of both carotenoids and flavodiiron proteins in photoprotection of photosystem II. Plant Cell. Physiology 54 (11), 1780–1790. doi:10.1093/pcp/pct123
Huang, L., McCluskey, M. P., Ni, H., and LaRossa, R. A. (2002). Global gene expression profiles of the cyanobacterium Synechocystis sp. Strain PCC 6803 in response to irradiation with UV-B and white light. J. Bacteriol. 184 (24), 6845–6858. doi:10.1128/jb.184.24.6845-6858.2002
Jack, D. L., Yang, N. M., and Saier, M. (2001). The drug/metabolite transporter superfamily. Eur. J. Biochem. 268 (13), 3620–3639. doi:10.1046/j.1432-1327.2001.02265.x
Jensen, P. E., and Leister, D. (2014). Cyanobacteria as an experimental platform for modifying bacterial and plant photosynthesis. Front. Bioeng. Biotechnol. 2, 7. doi:10.3389/fbioe.2014.00007
Kalaji, H. M., Schansker, G., Brestic, M., Bussotti, F., Calatayud, A., Ferroni, L., et al. (2017). Frequently asked questions about chlorophyll fluorescence, the sequel. Photosynth. Res. 132 (1), 13–66. doi:10.1007/s11120-016-0318-y
Kaneko, T., Nakamura, Y., Sasamoto, S., Watanabe, A., Kohara, M., Matsumoto, M., et al. (2003). Structural analysis of four large plasmids harboring in a unicellular cyanobacterium, Synechocystis sp. PCC 6803. DNA Res. 10 (5), 221–228. doi:10.1093/dnares/10.5.221
Kaneko, T., Sato, S., Kotani, H., Tanaka, A., Asamizu, E., Nakamura, Y., et al. (1996). Sequence analysis of the genome of the unicellular cyanobacterium Synechocystis sp. strain PCC6803. II. Sequence determination of the entire genome and assignment of potential protein-coding regions. DNA Res. 3 (3), 109–136. doi:10.1093/dnares/3.3.109
Kirilovsky, D., and Kerfeld, C. A. (2016). Cyanobacterial photoprotection by the orange carotenoid protein. Nat. Plants 2 (12), 16180. doi:10.1038/nplants.2016.180
Kitajima, M., and Butler, W. L. (1975). Quenching of chlorophyll fluorescence and primary photochemistry in chloroplasts by dibromothymoquinone. Biochimica Biophysica Acta (BBA) - Bioenergetics 376 (1), 105–115. doi:10.1016/0005-2728(75)90209-1
Komenda, J., and Sobotka, R. (2016). Cyanobacterial high-light-inducible proteins — protectors of chlorophyll–protein synthesis and assembly. Biochimica Biophysica Acta (BBA) - Bioenergetics 1857 (3), 288–295. doi:10.1016/j.bbabio.2015.08.011
Krause, G. H., and Weis, E. (1984). Chlorophyll fluorescence as a tool in plant physiology: II. Interpretation of fluorescence signals. Photosynth. Res. 5 (2), 139–157. doi:10.1007/BF00028527
Leng, X., Jia, H., Sun, X., Shangguan, L., Mu, Q., Wang, B., et al. (2015). Comparative transcriptome analysis of grapevine in response to copper stress. Sci. Rep. 5 (1), 17749. doi:10.1038/srep17749
Li, H. (2013). Aligning sequence reads, clone sequences and assembly contigs with BWA-MEM. arXiv preprint arXiv:1303.3997. doi:10.48550/arXiv.1303.3997
Liao, Y., Smyth, G. K., and Shi, W. (2013). featureCounts: an efficient general purpose program for assigning sequence reads to genomic features. Bioinformatics 30 (7), 923–930. doi:10.1093/bioinformatics/btt656
Love, M. I., Huber, W., and Anders, S. (2014). Moderated estimation of fold change and dispersion for RNA-seq data with DESeq2. Genome Biol. 15 (12), 550. doi:10.1186/s13059-014-0550-8
Martin, M. (2011). Cutadapt removes adapter sequences from high-throughput sequencing reads. EMBnet J. 17 (1), 10. doi:10.14806/ej.17.1.200
Merritt, J. H., Brothers Kimberly, M., Kuchma Sherry, L., and O'Toole George, A. (2007). SadC reciprocally influences biofilm formation and swarming motility via modulation of exopolysaccharide production and flagellar function. J. Bacteriol. 189 (22), 8154–8164. doi:10.1128/jb.00585-07
Mi, H., Muruganujan, A., Huang, X., Ebert, D., Mills, C., Guo, X., et al. (2019). Protocol Update for large-scale genome and gene function analysis with the PANTHER classification system (v.14.0). Nat. Protoc. 14 (3), 703–721. doi:10.1038/s41596-019-0128-8
Miao, R., Jahn, M., Shabestary, K., Peltier, G., and Hudson, E. P. (2023). CRISPR interference screens reveal growth–robustness tradeoffs in Synechocystis sp. PCC 6803 across growth conditions. Plant Cell. 35, 3937–3956. doi:10.1093/plcell/koad208
Mitschke, J., Georg, J., Scholz, I., Sharma, C. M., Dienst, D., Bantscheff, J., et al. (2011). An experimentally anchored map of transcriptional start sites in the model cyanobacterium Synechocystis sp. PCC6803. Proc. Natl. Acad. Sci. U. S. A. 108 (5), 2124–2129. doi:10.1073/pnas.1015154108
Ogawa, K., Yoshikawa, K., Matsuda, F., Toya, Y., and Shimizu, H. (2018). Transcriptome analysis of the cyanobacterium Synechocystis sp. PCC 6803 and mechanisms of photoinhibition tolerance under extreme high light conditions. J. Biosci. Bioeng. 126 (5), 596–602. doi:10.1016/j.jbiosc.2018.05.015
Ogawa, T., Misumi, M., and Sonoike, K. (2017). Estimation of photosynthesis in cyanobacteria by pulse-amplitude modulation chlorophyll fluorescence: problems and solutions. Photosynth. Res. 133 (1), 63–73. doi:10.1007/s11120-017-0367-x
Ogawa, T., and Sonoike, K. (2016). Effects of bleaching by nitrogen deficiency on the quantum yield of photosystem II in Synechocystis sp. PCC 6803 revealed by Chl fluorescence measurements. Plant Cell. Physiology 57 (3), 558–567. doi:10.1093/pcp/pcw010
Pandey, A., Khan, M. K., Hamurcu, M., Brestic, M., Topal, A., and Gezgin, S. (2022). Insight into the root transcriptome of a boron-tolerant Triticum zhukovskyi genotype grown under boron toxicity. Agronomy 12 (10), 2421. doi:10.3390/agronomy12102421
Paul, J., and Barari, M. (2022). Meta-analysis and traditional systematic literature reviews—what, why, when, where, and how? Psychol. Mark. 39 (6), 1099–1115. doi:10.1002/mar.21657
Paul, R., Weiser, S., Amiot, N. C., Chan, C., Schirmer, T., Giese, B., et al. (2004). Cell cycle-dependent dynamic localization of a bacterial response regulator with a novel di-guanylate cyclase output domain. Genes. & Dev. 18 (6), 715–727. doi:10.1101/gad.289504
Rau, A., Marot, G., and Jaffrézic, F. (2014). Differential meta-analysis of RNA-seq data from multiple studies. BMC Bioinforma. 15 (1), 91. doi:10.1186/1471-2105-15-91
Rippka, R., Deruelles, J., Waterbury, J. B., Herdman, M., and Stanier, R. Y. (1979). Generic assignments, strain histories and properties of pure cultures of cyanobacteria. Microbiology 111 (1), 1–61. doi:10.1099/00221287-111-1-1
Ritchie, M. E., Phipson, B., Wu, D., Hu, Y., Law, C. W., Shi, W., et al. (2015). Limma powers differential expression analyses for RNA-sequencing and microarray studies. Nucleic Acids Res. 43 (7), e47. doi:10.1093/nar/gkv007
Sang, Z., Zuo, J., Wang, Q., Fu, A., Zheng, Y., Ge, Y., et al. (2022). Determining the effects of light on the fruit peel quality of photosensitive and nonphotosensitive eggplant. Plants 11 (16), 2095. doi:10.3390/plants11162095
Savakis, P., De Causmaecker, S., Angerer, V., Ruppert, U., Anders, K., Essen, L. O., et al. (2012). Light-induced alteration of c-di-GMP level controls motility of Synechocystis sp. PCC 6803. Mol. Microbiol. 85 (2), 239–251. doi:10.1111/j.1365-2958.2012.08106.x
Sergeyenko, T. V., and Los, D. A. (2000). Identification of secreted proteins of the cyanobacterium Synechocystis sp. strain PCC 6803. FEMS Microbiol. Lett. 193 (2), 213–216. doi:10.1111/j.1574-6968.2000.tb09426.x
Sergeyenko, T. V., and Los, D. A. (2002). The effect of various stresses on the expression of genes encoding the secreted proteins of the cyanobacterium Synechocystis sp. PCC 6803. Russ. J. Plant Physiology 49 (5), 650–656. doi:10.1023/A:1020293019304
Siddique, M. I., Han, K., Lee, J., Lee, E. S., Lee, Y.-R., Lee, H.-E., et al. (2021). QTL analysis for chlorophyll content in strawberry (Fragaria x ananassa Duch.) leaves. Agriculture 11 (11), 1163. doi:10.3390/agriculture11111163
Sinetova, M. A., and Los, D. A. (2016). New insights in cyanobacterial cold stress responses: genes, sensors, and molecular triggers. Biochimica Biophysica Acta (BBA) - General Subj. 1860 (11), 2391–2403. doi:10.1016/j.bbagen.2016.07.006
Singh, A. K., Elvitigala, T., Bhattacharyya-Pakrasi, M., Aurora, R., Ghosh, B., and Pakrasi, H. B. (2008). Integration of carbon and nitrogen metabolism with energy production is crucial to light acclimation in the cyanobacterium Synechocystis. Plant Physiol. 148 (1), 467–478. doi:10.1104/pp.108.123489
Sluchanko, N. N., Slonimskiy, Y. B., Shirshin, E. A., Moldenhauer, M., Friedrich, T., and Maksimov, E. G. (2018). OCP–FRP protein complex topologies suggest a mechanism for controlling high light tolerance in cyanobacteria. Nat. Commun. 9 (1), 3869. doi:10.1038/s41467-018-06195-0
Song, L., and Florea, L. (2015). Rcorrector: efficient and accurate error correction for Illumina RNA-seq reads. GigaScience 4 (1), 48. doi:10.1186/s13742-015-0089-y
Sonoike, K., Hihara, Y., and Ikeuchi, M. (2001). Physiological significance of the regulation of photosystem stoichiometry upon high light acclimation of Synechocystis sp. PCC 6803. Plant Cell. Physiology 42 (4), 379–384. doi:10.1093/pcp/pce046
Stanier, R. Y., Kunisawa, R., Mandel, M., and Cohen-Bazire, G. (1971). Purification and properties of unicellular blue-green algae (order Chroococcales). Bacteriol. Rev. 35 (2), 171–205. doi:10.1128/br.35.2.171-205.1971
Stouffer, S. A., Suchman, E. A., DeVinney, L. C., Star, S. A., and Williams, R. M. (1949). The american soldier, vol. 1. Adjustment during army life. J. Consult. Clin. Psychol. 13, 310.
Suzuki, I., Kanesaki, Y., Mikami, K., Kanehisa, M., and Murata, N. (2001). Cold-regulated genes under control of the cold sensor Hik33 in Synechocystis. Mol. Microbiol. 40 (1), 235–244. doi:10.1046/j.1365-2958.2001.02379.x
Tamayo, R., Tischler, A. D., and Camilli, A. (2005). The EAL domain protein VieA Is a cyclic diguanylate phosphodiesterase. J. Biol. Chem. 280 (39), 33324–33330. doi:10.1074/jbc.M506500200
Turunen, O., Koskinen, S., Kurkela, J., Karhuvaara, O., Hakkila, K., and Tyystjärvi, T. (2022). Roles of close homologues SigB and SigD in heat and high light acclimation of the cyanobacterium Synechocystis sp. PCC 6803. Life (Basel) 12 (2), 162. doi:10.3390/life12020162
Van Kooten, O., and Snel, J. F. (1990). The use of chlorophyll fluorescence nomenclature in plant stress physiology. Photosynth. Res. 25, 147–150. doi:10.1007/BF00033156
Wallner, T., Pedroza, L., Voigt, K., Kaever, V., and Wilde, A. (2020). The cyanobacterial phytochrome 2 regulates the expression of motility-related genes through the second messenger cyclic di-GMP. Photochem. Photobiological Sci. 19 (5), 631–643. doi:10.1039/c9pp00489k
Wang, X., Kang, D. D., Shen, K., Song, C., Lu, S., Chang, L. C., et al. (2012). An R package suite for microarray meta-analysis in quality control, differentially expressed gene analysis and pathway enrichment detection. Bioinformatics 28 (19), 2534–2536. doi:10.1093/bioinformatics/bts485
Ward, J. H. (1963). Hierarchical grouping to optimize an objective Function. J. Am. Stat. Assoc. 58 (301), 236–244. doi:10.1080/01621459.1963.10500845
Widdel, F. (2007). Theory and measurement of bacterial growth. Di dalam Grundpraktikum Mikrobiol. 4 (11), 1–11.
Wu, T., Hu, E., Xu, S., Chen, M., Guo, P., Dai, Z., et al. (2021). clusterProfiler 4.0: a universal enrichment tool for interpreting omics data. Innovation 2 (3), 100141. doi:10.1016/j.xinn.2021.100141
Yoshikawa, K., Ogawa, K., Toya, Y., Akimoto, S., Matsuda, F., and Shimizu, H. (2021). Mutations in hik26 and slr1916 lead to high-light stress tolerance in Synechocystis sp. PCC6803. Commun. Biol. 4 (1), 343. doi:10.1038/s42003-021-01875-y
Zavřel, T., Očenášová, P., and Červený, J. (2017). Phenotypic characterization of Synechocystis sp. PCC 6803 substrains reveals differences in sensitivity to abiotic stress. PLoS One 12 (12), e0189130. doi:10.1371/journal.pone.0189130
Zhao, Y., Liu, Y., Ji, X., Sun, J., Lv, S., Yang, H., et al. (2021). Physiological and proteomic analyses reveal cAMP-regulated key factors in maize root tolerance to heat stress. Food Energy Secur. 10 (4), e309. doi:10.1002/fes3.309
Keywords: acclimation, adaptation, high light, high light tolerance, meta-analysis, microarray, photosynthesis, RNA-Seq
Citation: Abdel-Salam EM, Figueroa-Gonzalez T and Leister D (2023) Transcriptomic meta-analysis and functional validation identify genes linked to adaptation and involved in high-light acclimation in Synechocystis sp. PCC 6803. Front. Photobiol. 1:1290382. doi: 10.3389/fphbi.2023.1290382
Received: 10 September 2023; Accepted: 23 November 2023;
Published: 19 December 2023.
Edited by:
Johann Lavaud, Centre National de la Recherche Scientifique (CNRS), FranceReviewed by:
Joaquin Giner-Lamia, Universidad de Sevilla, SpainLuis López-Maury, Spanish National Research Council (CSIC), Spain
Copyright © 2023 Abdel-Salam, Figueroa-Gonzalez and Leister. This is an open-access article distributed under the terms of the Creative Commons Attribution License (CC BY). The use, distribution or reproduction in other forums is permitted, provided the original author(s) and the copyright owner(s) are credited and that the original publication in this journal is cited, in accordance with accepted academic practice. No use, distribution or reproduction is permitted which does not comply with these terms.
*Correspondence: Dario Leister, leister@lmu.de