Incoherent color holography lattice light-sheet for subcellular imaging of dynamic structures
 Simon Alford
 Christopher Mann
 Jonathan Art
 Mariana Potcoava
- 1Department of Anatomy and Cell Biology, University of Illinois at Chicago, Chicago, IL, United States
- 2Department of Applied Physics and Materials Science, Northern Arizona University, Flagstaff, AZ, United States
- 3Center for Materials Interfaces in Research and Development, Northern Arizona University, Flagstaff, AZ, United States
The purpose of the article is to explore the need and advantages of using the incoherent color holography lattice light-sheet (ICHLLS) to provide multiwavelength quantitative monitoring of 3D cellular dynamics in live tissue to further understand complex functions of cells and cellular compartments. We have explored the use of incoherent color holography lattice light-sheet to investigate colocalization of fluorescent markers in live cells in intact tissue. Neuronal structures provide an attractive target for incoherent color holography lattice light-sheet. The cells show a complex architecture in 3D space in which signaling both between cells and within subcellular structures requires colocalization of proteins and lipids to function. During activity and over long periods it is important in understanding these signaling functions in Parkinson’s, Alzheimer’s and motoneuron diseases within live cells in intact tissue. As a proof of concept this article recalls the key aspects in lattice light-sheet imaging and provides a description of the incoherent detection system configuration to actively control dual diffractive lenses phase-shifting at multiple excitation wavelengths sequentially, and per each z-galvo scanning level, with extended field-of-view. The incoherent color holography lattice light-sheet system will allow simultaneous recording of multidimensional object waves that contain intensity in 3D space, phase, and wavelength information. We measure colocalization of fluorescence indicators introduced into live cells in intact neural tissue.
1 Introduction
Live cells and particularly neurons are dynamic and three-dimensional in which rapid signaling occurs throughout their complex 3D architecture. Signaling within all cells requires protein-protein interactions and localization of proteins within the framework of lipid and protein structure within the cell (Fivaz and Meyer, 2003). As such understanding brain function requires an understanding of the location and timing of this signaling. A great deal of research has been published examining the spatial relationships between these various structural and signaling elements, but for practical reasons most of this work examines tissue that is fixed and cleared. This improves the visualization of structures and ensures that 3D information can be extracted without time limitations associated with dynamic movement within the cell. This enables relatively slow but accurate point scanning (Denk et al., 1990; Belichenko and Dahlstrom, 1995) or deconvolution approaches to imaging cells. However, fixed tissue loses that very dynamic activity which defines cell function. We seek to develop live cell 3D imaging approaches that can capture multiple wavelengths of fluorescence information in 3D space, sufficiently rapidly to examine dynamic co-localizations between structures and fluorescent molecules. An extreme example of colocalization necessary for function in the central nervous system is in the structural complexity of neurons. To understand neuronal function at all levels, it is necessary to image the spatiotemporal properties of axons, dendrites, and somata in 3-dimensional space simultaneously and with high resolution.
Lattice light-sheet (LLS) imaging helps to resolve dynamical changes in 3D (Tahara et al., 2020), but in common with all 3D imaging the need to maintain the emission objective in focus with the object causes mechanical distortion and takes time. 3D information is obtained by scanning the excitation lattice sheet in the z-dimension using a z-galvanometric mirror (z-galvo) in the excitation light path after the creation of the Bessel beams. The z-scanning principle in LLS, is that both this z-galvo and the detection objective (z-piezo), synchronize in motion to scan the sample in 3D, Figure 1B. Furthermore, because the LLS system excites with a lattice with regions of positive and negative interference, the resulting image intensity will vary. This variance is smoothed by dithering the beam in the x plane with a similar x-galvo. While LLS beams are coherent and produce stronger modulation depth than incoherent patterned light sheets, they work by causing fluorescence in the sample which results in emission light that is incoherent. We explore here the self-interference property of this emitted fluorescent light, at multiple wavelengths, in which interference patterns are created to generate holograms of a 3D object with the depth information encoded in these patterns.
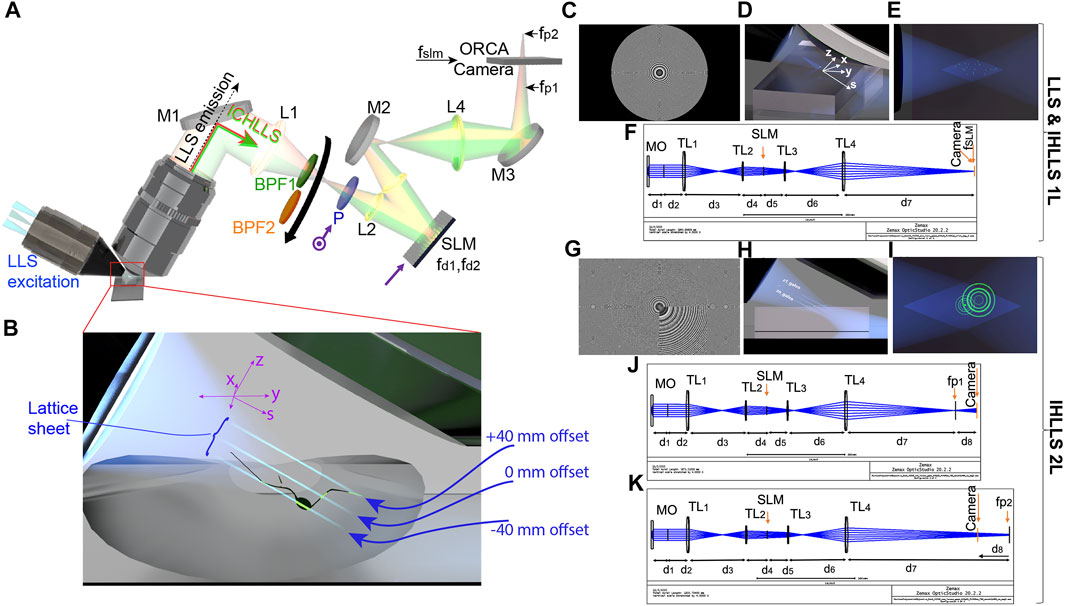
FIGURE 1. The ICHLLS system. (A,B) Schematics of the ICHLLS systems with (C) one diffractive lens (ICHLLS 1L) of focal length  ) to the active axis of the SLM (
 ); band pass filters BPF1 centered at 519 nm (Chroma Tech, 26 nm bandpass width) for the excitation wavelength
Incoherent color digital holography has been an active area of research and development for applications in fluorescence microscopy. Multicolor incoherent digital holography system with a white-light source using a monochrome image sensor and a wavelength-dependent phase-modulation array has been applied to incoherent-light hologram sensing (Tahara et al., 2020). Full-color quantitative phase imaging of HE-stained mouse kidney cells using a computational coherent superposition (CCS) has also been demonstrated (Tahara et al., 2021). Super-resolution imaging with full-color incoherent imaging using Fresnel incoherent correlation holography (FINCH) was achieved (Rosen and Brooker, 2007a; Rosen et al., 2021).
We built a single-wavelength incoherent holography lattice light-sheet (IHLLS) (Potcoava et al., 2021a; Potcoava et al., 2021b; Rosen et al., 2021), at 488 nm, but here we combine IHLLS with multiwavelength information at 488 nm and 561 nm, termed incoherent color holography lattice light-sheet (ICHLLS), to provide quantitative monitoring of 3D cellular dynamics in live tissue. The system could be developed further for all four excitation laser lines (405, 488, 561, and 642 nm) of the existing LLS system by configuring a phase spatial light modulator placed in the incoherent detection arm of the instrument to actively control dual diffractive lens phase-shifting at all colors sequentially. The ICHLLS system is built as a new detection module on an existing LLS system.
This holographic technique gives us the possibility to access the complex amplitude of the object’s wavefront, which describes both the amplitude and phase of a light wave. Amplitude and phase measurements acquired with our new instrument provide intrinsic instrumental simplicity, larger scanning area, larger z-galvanometric mirror range, and higher resolution when compared to the original LLS schemes. Phase imaging provides quantitative information on the state and size of subcellular structures.
In this paper we focus on assessing the colocalization between dual-color excited structures and fluorescent molecules detected in incoherent holographic images, recorded using ICHLLS. The rest of the paper is structured as follows: in the next section the principle of the ICHLLS system is provided with a short theory on the colocalization approach. Section 3 covers the materials and methods. Section 4 covers a series of ICHLLS experiments using calibration beads and neuronal cells. Finally, Section 5 discussions and conclusion.
2 Principle
2.1 Instrument presentation and optical design
Various aspects of IHLLS system at only one excitation wavelength of 488 nm have been described in (Potcoava et al., 2021a; Potcoava et al., 2021b), Figures 1A, B, including the IHLLS with one (IHLLS—1L) lens, Figures 1C–F or two diffractive lenses (IHLLS-2L), Figures 1G–K. The imaging detection in ICHLLS still uses the Fresnel incoherent correlation holography (FINCH) (Rosen and Brooker, 2007b; Rosen et al., 2011; Katz et al., 2012; Rosen and Brooken, 2012; Siegel et al., 2012; Rosen and Kelner, 2014; Rosen et al., 2021) principle, but at two excitation wavelength, 488 nm and 561 nm. The emitted fluorescent light from a 3D object is split into two spherical beams with different radii of curvature by a phase spatial light modulator (SLM) to create a single channel on-axis interferometer, Figure 1A. The interference patterns created by the two beams at each excitation wavelength create Fresnel holograms. The beam splitter of an interferometer is replaced, in our case, by the phase SLM (Meadowlark Inc.; 1920 × 1,152 pixels, pixel pitch 6.5 μm). The SLM transparency for the two beams has the expression:
where
When
This case refers to the technique called ICHLLS 1L and it is used for calibration purposes. The z-scanning principle in ICHLLS 1L, same as in LLS, is that both the z-galvanometric mirror (z-galvo) and the detection objective (z-piezo), synchronize in motion to scan the sample in 3D, Figures 1D, E, but the axial resolution could be lower than the axial resolution in LLS due to the blurring effect of the constant phase lens added on the SLM that focusses to infinity.
In ICHLLS 2L technique,
The physical distances between each sequential optical component in Figure 1A, and the focal distances for the two excitation wavelengths were calculated using the OpticStudio (Zemax, LLC). First, we calculated the focal distances for the ICHLLS 1L, Figure 1F, for both excitation wavelength, with the condition that the transversal magnification in the new system has to match the transversal LLS magnification of 62.5. The focal lengths are
In both ICHLLS techniques, ICHLLS 1L and ICHLLS 2L, the two wavefronts, created by the two diffractive lenses uploaded on the SLM, interfere with each other at the camera plane to create Fresnel holograms. In ICHLLS 1L the 3D scan is achieved by moving simultaneously the z-galvo mirror and z-piezo objective controller for a range of 3
where:
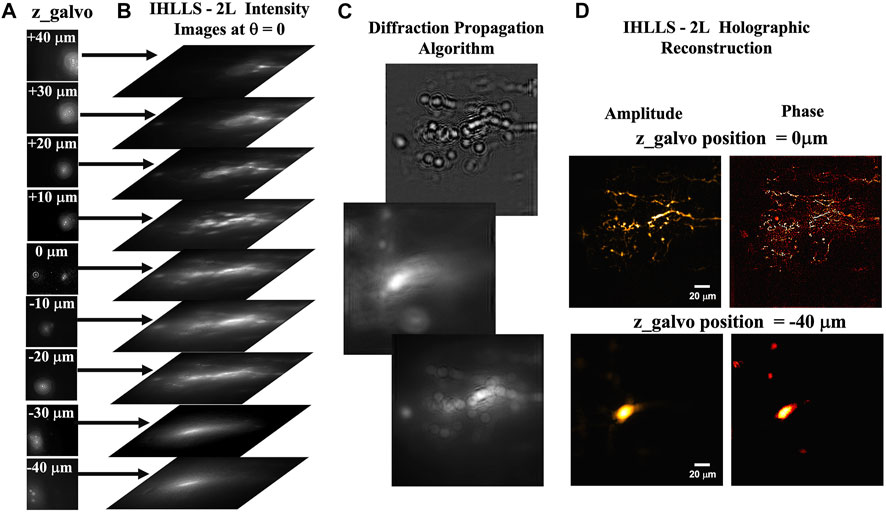
FIGURE 2. The ICHLLS system diffraction. (A) The 9 z-galvo position hologram intensity images:
The depth of the object points is encoded by the density of the rings in the Fresnel holograms, meaning that each plane in the image space reconstructed from the Fresnel hologram is in focus at a different axial distance. In this manuscript the phase data represent the object phase retrieved at certain axial position of z-galvo mirror. We intend to include extra variables for future work to obtain biomedically relevant information on the state of cells.
The spatio-temporal performance of a single-wavelength incoherent holography lattice light-sheet was already demonstrated in our previous work (Potcoava et al., 2021b). The technology provides the imaging resolution comparable or better than the conventional LLS’s resolution in dithering mode and with maximum detector FOV. The LLS resolution in the z-axis is limited by the light sheet illumination depth of about 400 nm, but LLS microscopy enables diffraction limited resolution in the x and y. The axial resolution in IHLLS 2L and ICHLLS 2L can be improved by recording and reconstructing images at multiple z-galvo steps and minimizing the hologram reconstruction increment, δz, to achieve better localization of the sample points.
2.2 Automatic colocalization
Pearson’s correlation coefficient (PCC), Manders’ overlap coefficient (MOC), and Manders’ colocalization coefficients (M1, M2) are all generally accepted methods to assess the spatial overlap of multi fluorescent labels recorded at different emission wavelengths when imaged at a particular spatial resolution (Manders et al., 1992; Manders et al., 1993; Costes et al., 2004; Li et al., 2004). These coefficients underline two aspects of the co-localization: correlation (PCC) and co-occurrence (MOC, M1, M2).
The correlation refers to the linear relationship of the pixel intensities in the spectral channels or what percentage of variability in one channel is caused by variability in the other channel, and the co-occurrence represents the degree of channel overlap (Adler et al., 2008). PCC can range from −1 to 1, with PCC = 1 meaning perfect positive correlation, PCC = −1 meaning perfect negative correlation or anticorrelation, and PCC = 0 no correlation. MOC ranges between 0 and 1 and it represent the percentage of the overlapped pixels in the spectral channels. The correlation-based interpretation of the MOC is that a value of 0 corresponds to negative correlations, 0.5 to no correlation, and 1 to positive correlation (Cordelieres and Bolte, 2014). The MOC was described as representing the true degree of colocalization with values from 0.6 to 1 values indicating positive colocalization (Zinchuk and Grossenbacher-Zinchuk, 2009).
The two MOC coefficients, M1 and M2, represent the fraction of co-localizing objects in each component of a dual-spectral channel image above threshold intensity values. As an example, for our excitation wavelengths,
This method is not intended for analyzing molecular interaction, which requires super-resolution techniques such as electron (Pastorek et al., 2016) or fluorescence resonance energy transfer microscopy (Day et al., 2001), but are useful first step to show that our IHLLS technique is capable of imaging biological samples in multiple spectral channels.
3 Materials and methods
3.1 Sample preparation
Fluorescent latex beads of 500 nm (
Lamprey motoneurons were imaged in live intact isolated spinal cords. Of larval lampreys (Petromyzon marinus). Twenty-four hours prior to isolation of the spinal cord, the animal was anesthetized with tricaine methanesulfonate (MS-222; 100 mg/L; Sigma, St. Louis, MO) in pH buffered cold saline. Under anesthesia the myotomal muscle wall (1–3 segments) was injected with 2 µL of 10 mM 10,000 MW dextran conjugated to each of Alexa 488 and Alexa 555. The animal was allowed to recover and maintained in an isolated aquarium at 10C for 24 h. The animals were again anesthetized with (MS-222; 100 mg/L), decapitated, and dissected in a cold saline solution (Ringer) of the following composition (in mM): 100 NaCl, 2.1 KCl, 2.6 CaCl2, 1.8 MgCl2 or 1.8 MgSO4, 4 glucose, 5 HEPES, adjusted to a pH of 7.60 with NaOH and to a final osmolarity of 270 ± 5 mOsm.
The spinal cord was isolated and placed ventral side up to expose the motoneurons closest to the imaging system in a cooled, small-volume chamber with a sylgard floor. The chamber and spinal cord were then transferred onto the customized stage of the LLS microscope. The recording chamber was continually superfused with cold, oxygenated Ringer (8°C–10°C) for the duration of the experiment while maintained under the dual lenses of the LLS system. The myotomal injection of dye allowed retrograde transport of dye throughout the axons, somata and dendritic fields of motoneurons in the spinal ventral horn, with labeling with both Alexa 488 and Alexa 555, allowing a demonstration of colocalized dye imaging of neurons in a complex 3D space.
3.2 Image acquisition and processing
The entire system was controlled by the original LLS software based on LabView platform (National Instruments) with the diffractive SLM (Meadowlark Inc.) synchronized with the ORCA camera for the IHLLS module. The diffractive lenses with different phase factor were generated in MATLAB (MathWorks, Inc.) for each of the two emission wavelengths, 520 nm and 575 nm.
Data acquisition is performed in two steps: a) move the z-galvo mirror to a specific z-galvo position (offset) and record four phase-shift holographic intensity images per z-galvo position, at z-galvo:
Usually, image processing steps are the same for most of the diffraction techniques. Each hologram processing can be sub-divided as follows: 1) Image pre-processing in which a background correction is performed by subtracting an average background level obtained by measuring the mean intensity of each stain outside the cells; 2) Hologram reconstruction in which the complex hologram is propagated and reconstructed at the best focal plane using a custom diffraction method routine in MATLAB (MathWorks, Inc.); and 3) Object feature extraction performed on the reconstructed amplitude and phase images using FIJI (ImageJ).
4 Experiment and results
4.1 Calibration
As a proof-of-concept, we performed color fluorescence imaging using conventional ICHLLS 1L then ICHLLS 2L in which we exploited coherent and incoherent holographic imaging at two excitation wavelengths, 488 nm and 561 nm. To calibrate the system, we demonstrated color detection of a mixture of 500 nm (488 nm) Figures 3A, C, E, G and 1 µm (561 nm) diameter fluorescent beads, Figures 3B, D, F, H. Emission during 488 nm excitation is centered at 520 nm and following 561 nm excitation is centered at 575 nm. Using the IHLLS 2L, we recorded four phase-shift images per z-galvo position at z-galvo
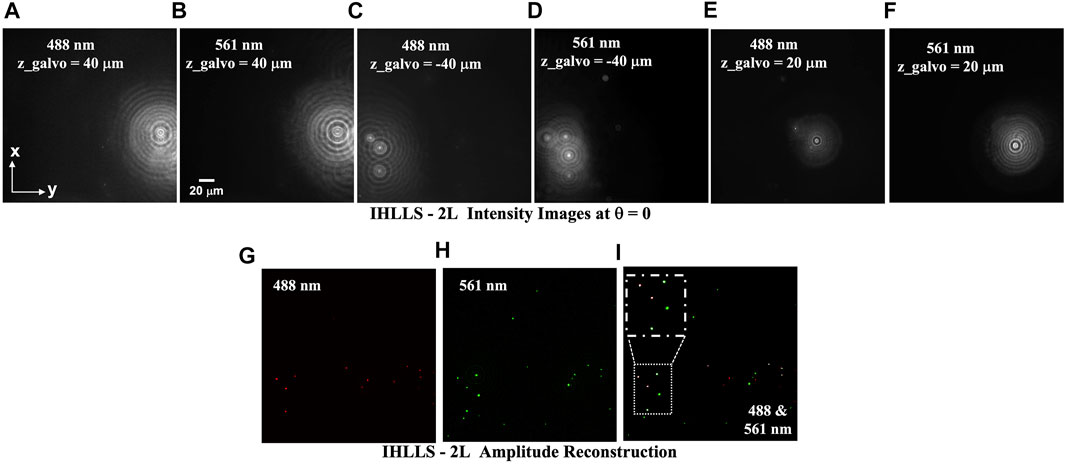
FIGURE 3. IHLLS 2L beads volume reconstruction of a mixture of fluorescent beads; (A,C,E,G) 500 nm (488 nm) diameter fluorescent beads, and (B,D,F,H) 1 µm (561 nm) diameter fluorescent beads z-galvo levels
When imaging individual beads with both wavelengths, shorter wavelength excitation, 488 nm, bleeds through when imaging 561 nm beads, Figure 3I. The superposition of the z-max projections of selected z-reconstructed planes for each of the two laser beams are shown in Figure 3G, H and the colocalization map of the beads at both wavelengths is shown in Figure 3I. We zoomed in an area of the colocalization map to show the 488 nm beads are superposed with the 561 nm beads, these beads are colored in white.
IHLLS phase images contain the depth dependent phase information derived from the IHLLS holograms and the reconstructed IHLLS images display the complex holograms propagated to the best focal plane. The max projections of the reconstructed volume of the 1 µm beads sample were obtained by changing the z-galvo levels to ±40 μm, ±30 μm, ±20 μm, ±10 μm, and 0 μm, Figures 3A–F. Thus, color 3D sensing of multiple beads and cells was performed.
4.2 Imaging neurons
To examine the effects of applying ICHLLS holography, neurons fluorescently labeled live in situ in the central nervous system (lamprey spinal ventral horn neurons), Figure 4, were used as test samples. Fluorescent dyes, Alexa Fluor™ 488 nm and 568 nm hydrazide, were injected by microinjection into the neuronal lamprey cell.
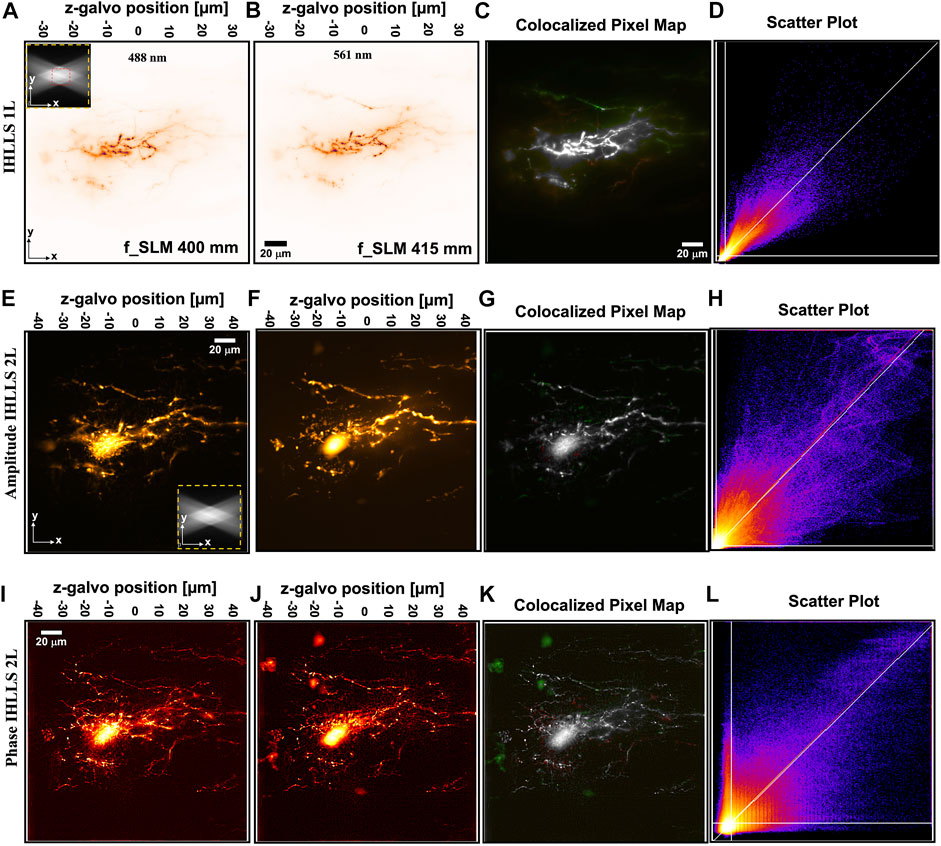
FIGURE 4. IHLLS-2L colocalization of two colors of dye Alexa 488 nm and 561 nm throughout the complex 3D space of the motoneuron dendritic trees; The xy volume map projection, FOV 208 μm2 × 208 μm2, in an ICHLLS 1L with only one diffractive lens of focal length 400 mm for 488 nm (A) and 415 mm for 561 nm (B), without deconvolution; The xy projections were built from 400 z-axis planes in the range −30
A goal of this study is to enable colocalization or separation of probes of separable fluorescent wavelength to be identified in the 3D structure of neurons during live cell recording in intact tissue in situ. Such recording presents challenges. Photodamage from excessive excitation will destroy the neurons, the tissue is dynamic and can move during extended periods of recording, and the tissue is complex and diffractive limiting the lattice beam penetration depth as well as the clarity of the emitted light.
To examine the effects of applying ICHLLS holography, neurons were fluorescently labeled live in situ in the central nervous system. We used well-characterized neurons in the intact spinal cord as a test example (Wallen et al., 1988). The lamprey spinal cord can be removed intact from the animal and maintained alive, in situ for up to 48 h without noticeable ultrastructural damage. The tissue used from larval animals (Petromyzon marinus) was approximately 200 µm deep and 750 µm wide. Within this structure motoneurons occupy most of half the spinal cord, projecting laterally and 350 µm and from the ventral surface of the spinal cord to a depth of approximately 80 µm. The dendritic tree is complex and receives input from ventro-medial (left of images) as well as lateral tracts (right side of images). The Soma is in the ventral horn and approximately 60–80 µm in the z-axis from the ventral surface (Buchanan et al., 2008). Therefore, to use as test samples, motoneurons were labeled as described in the methods section to cause the colocalization of two colors of dye Alexa 488 nm and 555 throughout the complex 3D space of the motoneuron dendritic trees, Figure 4. An example of a 3D LLS scan of the two colors is shown, Figure 4A, B in which the entire field of the camera (208 μm2 × 208 μm2) and depth of the scan (300 planes at 0.1 µm intervals) is shown by averaging all z-planes.
The first step in showing that the location of neurons in dual-channels are closely related is to overlay the dual-channel data, 488 nm in red and 561 nm in green, and then to state that anything that shows up as white shows colocalisation. The second step in the colocalization process is to use a scatter plot diagram of the pixel values of the dual-channel images against each other, to calculate the colocalization parameters. The data information of a given pixel in the 488 nm image is used as the y-coordinate of the scatter plot and the data information of the corresponding pixel in the 561 nm image as the x-coordinate. A pixel distribution along a straight line and a Pearson’s or Mander’s coefficients close to 1 means that both channel distributions are linked and colocalized.
The imaged neuron was labeled with dyes attached to identical molecular weight dextrans that are expected to label the neurons to the same extent. This is confirmed by imaging with IHLLS-1L similar to scanning with the original LLS, Figure 4(A–D) in which correlation and colocalization coefficients are high (Table 1). Degree of colocalization of the two dyes using IHLLS 1L is shown in green/red overlay, Figure 4C, and the scatter plot map in Figure 4D. The higher the MOC, the stronger M1, and M2 are, and the evidence for colocalization is high. Comparison between the IHLLS-1L reconstruction and from both amplitude and phase reconstructions using IHLLS-2L demonstrates that the IHLLS-2L approach enables accurate colocalized structures. Similar coefficients of colocalization are recorded from IHLLS-2L amplitude data, Figure 4(E–H). Colocalization coefficients in the phase data from IHLLS-2L demonstrates less colocalization. This reflects the very high sensitivity of this approach to z-plane offset and the fact that in live tissue small movements occur throughout the recording. The IHLLS-2L data, both amplitude and phase, also demonstrates the capability of this approach to detect faint data in the periphery of the recording. This indicates the possibility of extracting data from larger volumes of 3D structure.
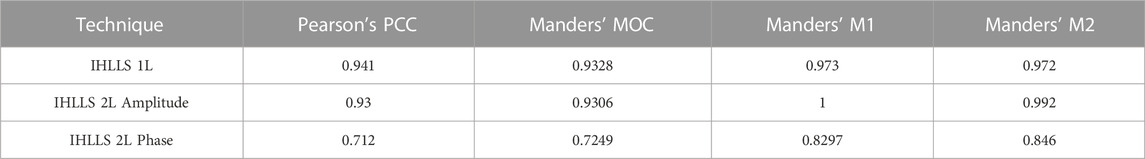
TABLE 1. Quantitative analysis of colocalization using all three imaging techniques, IHLLS 1L and IHLLS 2L reconstructed amplitude and phase, shown for the neuron in Figure 4.
5 Discussion and conclusion
We have demonstrated that 3D amplitude and phase information can be extracted from fluorescent samples scanned using a lattice light-sheet, and that this can be achieved at two or more wavelengths. This also enables an increase in resolution compared to the original LLS approach of moving the sample or the objective lens. For proof of principle, we have demonstrated that this can be achieved with 9 z-galvo positions of the ICHLLS 2L system compared to 300 z-galvo positions of the original LLS or IHLLS 1L.
In the present configuration single image frames can be obtained in between 50 and 100 ms. This will allow complete volumes of up to 100 μm2 × 100 μm2 × 80 µm with 9 z-galvo positions and 4 phase shifts to be obtained in as little as 1.8 s in single colors. With smaller volumes these rates can be improved even further. To image multiple colors adds complexity. Bandpass filters with multiple transmission notches can be used. However, emission bands must be narrow to prevent blurring of the hologram. If bands are too close in wavelength, then bleed-through from shorter wavelengths to longer is an issue. This can be prevented by sufficiently separated wavelengths. On our system with excitation lasers at 405, 488,561 and 642 nm, emission bands can be combined with centers at 520 and 660 nm and at 420 and 580 nm to ensure no bleed-through. If these two multiple bandpass filters are combined with two cameras, then switching of emission filters can be eliminated, and the Bessell beam excitation and emission SLMs can be coordinated allowing two color emission to be captured by a simple doubling of the time for each volume. Alternatively, a color camera with specific bandpass filters over the photosensitive elements would allow single camera detection. Another solution is to use a mechanical filter switcher with just one camera and the dual bandpass approach described above. Filter switching with a fast device would slow acquisition by about 100 ms for each two-color changes, once per volume acquisition.
Our goal is to enable automated and repetitive capture of similar volumes over time to achieve spatial and temporal resolutions to track dynamic movements of cellular structure in 3D over time. However, to enable very high-resolution phase and amplitude images we will need to automate 3D scanning and ICHLLS 2L imaging in up to all 4 colors of the original LLS system by sweeping excitation through hundreds of z-axis planes. Our approach will enable high temporal resolution of the spatial relationships between synaptic and cellular structures and retain both amplitude and phase information in the reconstructed images. Understanding colocalization of different labeled proteins and cellular elements and their interaction is crucial to understanding brain function and the low light excitation of LLS coupled with enhanced sensitivity of ICHLLS-2L will enable this.
Data availability statement
The original contributions presented in the study are included in the article/Supplementary Material, further inquiries can be directed to the corresponding author.
Ethics statement
The animal study was reviewed and approved by Animal Care and Use Committee (ACC), University of Illinois at Chicago.
Author contributions
Conceptualization, MP and SA; methodology, MP and SA; software, MP and CM; validation, MP, SA, JA, and CM; resources, SA, JA, and CM; data curation, MP, SA, and CM; writing—original draft preparation, MP and SA; writing—review and editing, MP, SA, JA, and CM; visualization, MP, SA, JA, and CM; supervision, SA and JA; project administration, SA and JA; funding acquisition, SA and JA. All authors have read and agreed to the published version of the manuscript.
Funding
This research was funded by the NIH RO1 NS111749 to SA and the NIH R21 DC017292 to JA.
Acknowledgments
The authors gratefully thank to Zack Zurawski and Kuei Tseng for very helpful discussions and recommendations.
Conflict of interest
The authors declare that the research was conducted in the absence of any commercial or financial relationships that could be construed as a potential conflict of interest.
Publisher’s note
All claims expressed in this article are solely those of the authors and do not necessarily represent those of their affiliated organizations, or those of the publisher, the editors and the reviewers. Any product that may be evaluated in this article, or claim that may be made by its manufacturer, is not guaranteed or endorsed by the publisher.
Supplementary material
The Supplementary Material for this article can be found online at: https://www.frontiersin.org/articles/10.3389/fphot.2023.1096294/full#supplementary-material
References
Adler, J., Pagakis, S. N., and Parmryd, I. (2008). Replicate-based noise corrected correlation for accurate measurements of colocalization. J. Microsc. 230 (1), 121–133. doi:10.1111/j.1365-2818.2008.01967.x
Belichenko, P. V., and Dahlstrom, A. (1995). Confocal laser scanning microscopy and 3-D reconstructions of neuronal structures in human brain cortex. Neuroimage 2 (3), 201–207. doi:10.1006/nimg.1995.1026
Buchanan, T., Buchanan, T. W., and Tranel, D. (2008). Stress and emotional memory retrieval: Effects of sex and cortisol response. Neurobiol. Learn. Mem. 89, 134–141. doi:10.1016/j.nlm.2007.07.003
Cordelieres, F. P., and Bolte, S. (2014). Experimenters' guide to colocalization studies: Finding a way through indicators and quantifiers, in practice. Methods Cell. Biol. 123, 395–408. doi:10.1016/B978-0-12-420138-5.00021-5
Costes, S. V., Daelemans, D., Cho, E. H., Dobbin, Z., Pavlakis, G., and Lockett, S. (2004). Automatic and quantitative measurement of protein-protein colocalization in live cells. Biophys. J. 86 (6), 3993–4003. doi:10.1529/biophysj.103.038422
Day, R. N., Periasamy, A., and Schaufele, F. (2001). Fluorescence resonance energy transfer microscopy of localized protein interactions in the living cell nucleus. Methods 25 (1), 4–18. doi:10.1006/meth.2001.1211
Denk, W., Strickler, J. H., and Webb, W. W. (1990). Two-photon laser scanning fluorescence microscopy. Science 248 (4951), 73–76. doi:10.1126/science.2321027
Fivaz, M., and Meyer, T. (2003). Specific localization and timing in neuronal signal transduction mediated by protein-lipid interactions. Neuron 40 (2), 319–330. doi:10.1016/s0896-6273(03)00634-2
Katz, B., Rosen, J., Kelner, R., and Brooker, G. (2012). Enhanced resolution and throughput of Fresnel incoherent correlation holography (FINCH) using dual diffractive lenses on a spatial light modulator (SLM). Opt. Express 20 (8), 9109–9121. doi:10.1364/oe.20.009109
Kim, M. K. (2010). Principles and techniques of digital holographic microscopy. SPIE Rev. 1 (1). doi:10.1117/6.0000006
Li, Q., Lau, A., Morris, T. J., Guo, L., Fordyce, C. B., and Stanley, E. F. (2004). A syntaxin 1, G o, and N-type calcium channel complex at a presynaptic nerve terminal: Analysis by quantitative immunocolocalization. J. Neurosci. official J. Soc. Neurosci. 24 (16), 4070–4081. doi:10.1523/jneurosci.0346-04.2004
Manders, E. M., Stap, J., Brakenhoff, G. J., van Driel, R., and Aten, J. A. (1992). Dynamics of three-dimensional replication patterns during the S-phase, analysed by double labelling of DNA and confocal microscopy. J. Cell. Sci. 103 (3), 857–862. doi:10.1242/jcs.103.3.857
Manders, E. M. M., Verbeek, F., and Aten, J. A. (1993). Measurement of co-localization of objects in dual-colour confocal images. J. Microsc. 169, 375–382. doi:10.1111/j.1365-2818.1993.tb03313.x
Pastorek, L., Sobol, M., and Hozák, P. (2016). Colocalization coefficients evaluating the distribution of molecular targets in microscopy methods based on pointed patterns. Histochem. Cell. Biol. 146 (4), 391–406. doi:10.1007/s00418-016-1467-y
Potcoava, M., Art, J., Alford, S., and Mann, C. (2021). Deformation measurements of neuronal excitability using incoherent holography lattice light-sheet microscopy (IHLLS). Photonics 8 (9), 383. doi:10.3390/photonics8090383
Potcoava, M., Mann, C., Art, J., and Alford, S. (2021). Spatio-temporal performance in an incoherent holography lattice light-sheet microscope (IHLLS). Opt. Express 29 (15), 23888–23901. doi:10.1364/oe.425069
Rosen, J., and Brooker, G. (2007). Fluorescence incoherent color holography. Opt. Express 15 (5), 2244–2250. doi:10.1364/oe.15.002244
Rosen, J., and Brooker, G. (2007). Digital spatially incoherent Fresnel holography. Opt. Lett. 32 (8), 912–914. doi:10.1364/ol.32.000912
Rosen, J., and Brooken, G. (2012). Fresnel incoherent correlation holography (FINCH): A review of research. Adv. Opt. Technol. 1 (3), 151–169. doi:10.1515/aot-2012-0014
Rosen, J., and Kelner, R. (2014). Modified Lagrange invariants and their role in determining transverse and axial imaging resolutions of self-interference incoherent holographic systems. Opt. Express 22 (23), 29048–29066. doi:10.1364/oe.22.029048
Rosen, J., Siegel, N., and Brooker, G. (2011). Theoretical and experimental demonstration of resolution beyond the Rayleigh limit by FINCH fluorescence microscopic imaging. Opt. Express 19 (27), 26249–26268. doi:10.1364/oe.19.026249
Rosen, J., Alford, S., Anand, V., Art, J., Bouchal, P., Bouchal, Z., et al. (2021). Roadmap on recent progress in FINCH technology. J. Imaging 7 (10), 197. doi:10.3390/jimaging7100197
Siegel, N., Rosen, J., and Brooker, G. (2012). Reconstruction of objects above and below the objective focal plane with dimensional fidelity by FINCH fluorescence microscopy. Opt. Express 20 (18), 19822–19835. doi:10.1364/oe.20.019822
Tahara, T., Ishii, A., Ito, T., Ichihashi, Y., and Oi, R. (2020). Single-shot wavelength-multiplexed digital holography for 3D fluorescent microscopy and other imaging modalities. Appl. Phys. Lett. 117 (3), 031102. doi:10.1063/5.0011075
Tahara, T., Koujin, T., Matsuda, A., Ishii, A., Ito, T., Ichihashi, Y., et al. (2021). Incoherent color digital holography with computational coherent superposition for fluorescence imaging [Invited]. Appl. Opt. 60 (4), A260–A7. doi:10.1364/ao.406068
Wallen, P., Carlsson, K., Liljeborg, A., and Grillner, S. (1988). Three-dimensional reconstruction of neurons in the lamprey spinal cord in whole-mount, using a confocal laser scanning microscope. J. Neurosci. Methods 24 (2), 91–100. doi:10.1016/0165-0270(88)90050-7
Keywords: Incoherent Color Holography Lattice Light-Sheet, digital holographic microscopy, phase-shifting interferometry, fluorescence microscopy, colocalization
Citation: Alford S, Mann C, Art J and Potcoava M (2023) Incoherent color holography lattice light-sheet for subcellular imaging of dynamic structures. Front. Photonics 4:1096294. doi: 10.3389/fphot.2023.1096294
Received: 11 November 2022; Accepted: 18 January 2023;
Published: 08 February 2023.
Edited by:
Ting-Chung Poon, Virginia Tech, United StatesReviewed by:
Myung Kim, University of South Florida, United StatesTaegeun Kim, Sejong University, Republic of Korea
Tatsuki Tahara, National Institute of Information and Communications Technology, Japan
Copyright © 2023 Alford, Mann, Art and Potcoava. This is an open-access article distributed under the terms of the Creative Commons Attribution License (CC BY). The use, distribution or reproduction in other forums is permitted, provided the original author(s) and the copyright owner(s) are credited and that the original publication in this journal is cited, in accordance with accepted academic practice. No use, distribution or reproduction is permitted which does not comply with these terms.
*Correspondence: Mariana Potcoava, mpotcoav@uic.edu