 Catherine Yourassowsky
 Jérôme Dohet-Eraly
 Frank Dubois
- Bio, Electro and Mechanical Systems, École polytechnique de Bruxelles, Université libre de Bruxelles, Brussels, Belgium
Large amounts of lipids are stored inside lipid droplets by some microalgae. Since these lipids can be used to produce nutraceuticals and biodiesel in a sustainable way, research is developing on fast non-destructive methods to quantify and monitor the amount of lipids within microalgal cultures. In this paper, we have developed with digital holographic microscopy a fast quantitative method to assess the evolution of the lipid content inside the diatom Phaeodactylum tricornutum living cells. The method uses a specific processing of recorded hologram sequences based on the refocusing capability in digital holographic microscopy. In representative samples of the culture, inside living cells, each lipid droplet volume is evaluated. In those experiments, for each sample, more than one thousand lipid droplets are automatically analysed from a sequence of one hundred recorded holograms. We have validated the method thanks to correlative quantitative phase contrast–fluorescence imaging and extrapolated it to larger calibrated spherical refractive particles, to demonstrate the flexibility of the method.
1 Introduction
Research is increasing on microalgal lipids for nutraceutical products and for a sustainable biodiesel production (Cooper et al., 2010; Mata et al., 2010; Branco-Vieira et al., 2017; Rodolfi et al., 2017; Chia et al., 2018; Patel et al., 2019; Morales et al., 2021). Microalgae store high neutral lipid content in lipid bodies, also called lipid droplets (LDs), which can be transformed into biodiesel. Some microalgae like the diatom Phaeodactylum tricornutum are easy to culture, fast growing and have a fatty acid composition appropriate for biodiesel production (He et al., 2014; Branco-Vieira et al., 2017; Rodolfi et al., 2017).
In this field, having fast non-destructive methods to quantify and monitor the amount of lipids in microalgal cultures is therefore highly important. It is particularly significant for the analysis of the best culture conditions, for the best strain selection, and for the determination of the optimal day of harvest.
The quantification of the microalgal lipid content is routinely performed by solvent extraction, gravimetric estimation, and lipid profiling with chromatography. However, these processes are destructive and the results can be distorted by a loss of lipid quantity. Moreover, they need large samples and are time-consuming (Patel et al., 2019). Fluorescent techniques like fluorescence microscopy (Mou et al., 2012; He et al., 2014; Rumin et al., 2015; Sandmann et al., 2018) or laser scanning confocal microscopy (Wang et al., 2009; Wong and Franz, 2013) work with reduced sample amount, and allow single-cell analysis to study LDs in detail, but they are invasive by the need to stain the lipids of the cells with specific lipophilic fluorescent dyes. Moreover, those dyes present some limitations like photobleaching and variable penetration inside the cells due to the cell wall (Patel et al., 2019). Raman microscopy (He et al., 2012; Chiu et al., 2017; Patel et al., 2019) was used to perform non-destructive, label-free quantification of the lipid accumulation in microalgal cultures thanks to the detection of lipid-specific Raman spectral peaks. However, this technique is slow and invasive, as it needs a high-powered light source. The coherent anti-Stokes Raman scattering (CARS) microscopy was successfully used to visualize and quantify the microalgal LDs (He et al., 2012; Cavonius et al., 2015; Jaeger et al., 2016; Patel et al., 2019). Moreover, it allows to separate the lipid-specific signals from the excited chlorophyll fluorescence and to analyze LD formation (Jaeger et al., 2016). It is a label-free microscopy technique but it requires multiple laser sources that may affect the cell physiology, making this technique invasive (Sandmann et al., 2018).
In order to improve the monitoring of the evolution of microalgal LDs, quantitative phase contrast imaging can be performed with digital holographic microscopy (DHM), a non-invasive method that was used to assess the LDs in murine macrophage cultures (Sauvage et al., 2014). Campos et al. (2018) used DHM to perform the monitoring of adipocyte differentiation during the culture. The quantification of the lipids was monitored in the cultures thanks to the evolution of the optical path difference. Kim et al. (2016a) developed the optical diffraction tomography (ODT), able to establish the three-dimensional (3D) refractive index distribution of an individual cell from multiple two-dimensional (2D) holographic images recorded with different angles of illumination. This non-invasive method was used to perform the quantification of lipid content in hepatocytes (Kim et al., 2016b) and in individual microalgal cells (Jung et al., 2018). However, to get the information in a small field of view, it is necessary to sequentially record large amounts of holograms (usually larger than 100) having different angles of illumination. It is therefore difficult to perform the high-throughput analysis of a microalgal culture. In addition to the need of the device to create the multi-angle illumination, the observed object must remain static during the whole sequence of acquisitions, otherwise the measurements can be altered or impossible. Guo et al. (2017) developed the time-stretch quantitative phase microscopy to classify microalgal cells cultivated in two different conditions in a high-throughput way. The optical set-up is relatively complex and individual LDs are not identified.
In this paper, we develop a fast quantitative method to assess the lipid content inside the diatom Phaeodactylum tricornutum living cells, thanks to a specific processing of hologram sequences recorded with a DHM. This method is partly based on a previous method that we developed in 2012 with DHM to characterize spheroid transparent objects thanks to their capacity to concentrate the light, providing an intensity peak like a usual converging lens (Dubois and Yourassowsky, 2012). It is linked to the specific DHM post-recording capability of numerical refocusing, which allows the in-depth scanning of the light intensity distribution. This method was already applied to cells in order to determine different cell features allowing, for example, the classification of living and dead cells within cultures (Dubois and Yourassowsky, 2012). Based on this method, Pirone et al. (2022) were able to detect, with a holographic flow cytometer, the alteration of the focusing property of human non-adherent cell lines due to the presence of LDs. This allowed them to distinguish a lymphocyte cell line, with a small amount of LDs, from an ovarian cancer cell line, with a high amount of LDs.
As the intracellular microalgal LDs are usually spheroid and with a higher refractive index than the external medium, we have developed the present method for the detection and the size evaluation of the LDs inside the living cells of microalgal cultures. It allows the assessment, in a non-invasive way, of the amount of lipid inside many individual living cells. This provides statistically representative data on the lipid content of the culture. We have applied it to cultures of the diatom Phaeodactylum tricornutum.
2 Material and methods
2.1 Optical set-up
A multimode reduced spatial coherence digital holographic microscope (DHM) is implemented to estimate the volume of LDs inside microalgal cells. As described in our patent (Dubois and Yourassowsky, 2003) and publications (Dubois et al., 2004; Dubois et al., 2011), the instrument combines the DHM with the fluorescence mode. The complete holographic information and the fluorescence signals emitted by the sample are recorded sequentially with the same camera. This multimode DHM allows to perform correlative quantitative phase contrast–fluorescence microscopy. The overlay of the quantitative phase contrast images and the fluorescent images is a powerful tool to identify specific cells or cellular elements. In this study, it is used to identify and localize inside the algal cells the fluorescent LDs, stained with BODIPY 505/515, in the corresponding phase image and to validate the method.
The multimode DHM is schematized in Figure 1. In this instrument, the DHM is based on a Mach–Zehnder interferometer working in transmission with a partially spatially coherent illumination that is described in Dubois et al. (2006a). Thanks to this illumination the raw holograms can be directly visualized on the computer screen. Indeed, with fully coherent illumination, the direct image is usually too noisy to be interpreted by a direct viewing (Dubois et al., 1999; Dohet-Eraly et al., 2016). The spatial coherence width of the illumination, in the sample plane, was estimated at 40 ± 5 µm. It corresponds to the average size of the speckle grains observable when the ground glass (GG in Figure 1) is immobile. This size is assessed by measuring the width at half maximum of the autocorrelation of several different speckle fields.
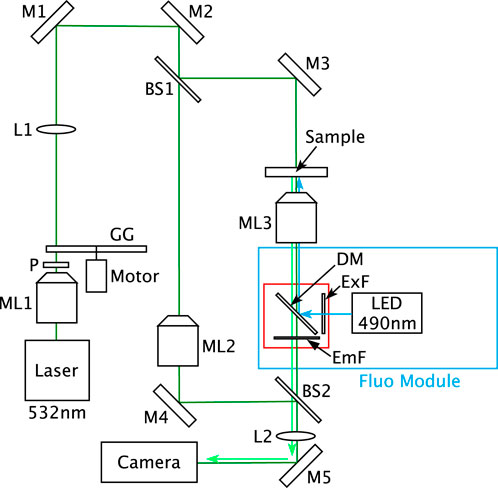
FIGURE 1. Optical set-up of the multimode DHM. BS1–BS2, beam splitters; DM, dichroic mirror; EmF, emission filter; ExF, excitation filter; GG, rotating ground glass; L1–L2, lenses; M1–M5, mirrors; ML1–ML3, microscope lenses; and P, polarizer.
For the DHM mode, the laser source is a Cobolt Samba™ CW 532 nm DPSSL. The microscope lenses ML2 and ML3 are oil immersion Leica 100
2.2 Holograms and fluorescence signals recorded with the multimode DHM
The Phaeodactylum tricornutum unlabelled culture samples were injected into the micro-channel of an ibidi µ-Slide I 0.2 Luer (ibidi®) and placed on the DHM stage. Sequences of one hundred digital holograms were recorded during the translation of the DHM stage, perpendicularly to the optical axis.
For the fluorescence imaging of stained LDs, the laser source was switched off. The LED source at 490 nm was switched on for the BODIPY 505/515 fluorescence excitation and the fluorescence signals were recorded by the CCD camera. The corresponding holograms were recorded with the same camera, using the partially spatially coherent source at 532 nm while the LED source was switched off.
2.3 Culture conditions
The Phaeodactylum tricornutum strain (UTEX 646) was obtained from the Culture Collection of Algae at the University of Texas at Austin and was grown at 15 °C in 250 mL flasks containing 100 mL sterilized filtered seawater with 90 µL of f/2 medium (Guillard, 1975) with the salinity of 34 ppt. The cultures were illuminated with a fluorescent lamp at 100 µmol photons
2.4 Sample preparation for fluorescence imaging
The LDs of Phaeodactylum tricornutum living cells were stained with the lipophilic fluorescence dye BODIPY 505/515 (Invitrogen) following the protocol described in He et al. (2014). The BODIPY 505/515 was diluted in anhydrous dimethyl sulfoxide (DMSO) to obtain a final concentration of 100 mM. 10 μL of this solution was mixed with 1 mL of the Phaeodactylum tricornutum culture, kept in a dark place and let settle during 5 min at room temperature (25 °C) to ensure the fluorescent labelling. The samples were injected into the micro-channel of an ibidi µ-Slide I 0.2 Luer and placed on the DHM stage.
2.5 Calibrated particles for the method validation and extrapolation
To validate the holographic method and to extrapolate it up to larger LDs as found inside adipocytes, we also tested it on calibrated monodisperse spherical silica particles of 7.82 µm diameter with a standard deviation (SD) of 0.31 µm (micro particles GmbH). As those particles are significantly larger than the LDs of Phaeodactylum tricornutum, we implemented in the DHM microscope objectives Leica 40
2.6 Processing to compute the LD size inside the microalgal cells
In order to compute the size of the LDs inside the cells, different processing steps were applied to the recorded holograms of the culture samples. These are described in the following points.
2.6.1 Extraction of the digital holographic information
This step is achieved using the usual Fourier transform method in off-axis holography that consists in computing the discrete 2D Fourier transformation of the hologram
2.6.2 Elimination of the phase and amplitude modulus artifacts
We recorded, for each sample, 100 images of the experimental slide with different lateral translation positions, in order to record representative sets of microalgal culture. Those sequences of holograms were also processed to remove the phase background and the permanent amplitude modulus defects in the images by performing averaging computations over all the recorded sequences (Yourassowsky and Dubois, 2014). After those processes, sequences of corrected complex amplitudes
2.6.3 Propagation up to the focal planes
The holograms are not necessarily recorded in the best focus plane of the microalgal cells in the sample. Therefore, it is necessary to propagate
where s’,t’
with
According to the refocusing criteria Dubois et al. (2006b), and as the microalgal cells are mainly phase objects, the best focus distances are found by searching, for each image m, the propagation distance d for which the quantity
is maximum.
In general, it is necessary to individually apply the refocusing criteria for each microalgal cell isolated within a region of interest in the complex amplitude images
As we used for the LDs 100
2.6.4 LD detection and diameter assessment by digital holographic propagation
The procedure for detecting and measuring individual LDs is illustrated in Figure 2, where Figure 2A shows an example of a recorded hologram. It is based on the fact that every LD may be seen as a lens, hence focusing light in a forward plane.
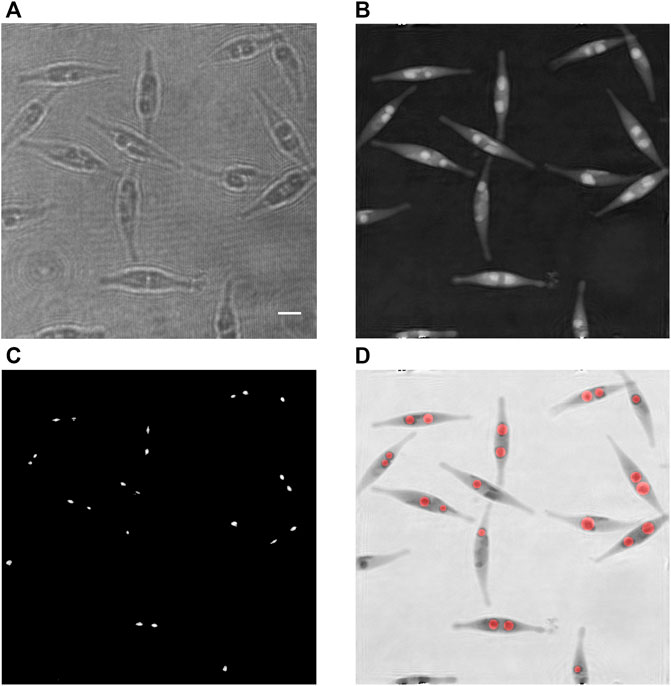
FIGURE 2. Detection and size assessment of LDs inside cells of a Phaeodactylum tricornutum culture at 24 days. (A) Recorded hologram; (B) corresponding refocused phase image; (C) zones of highest intensities while reconstructing over a range of 6 µm along the optical axis; each zone corresponds to one detected lipid droplet; and (D) superimposition of the inverted phase [in (B)] with the computed disks representing the assessed lipid droplets, in red; the radii of the red disks are computed according to the presented method. Scale bar = 5 µm.
We assume that the refractive indices n1 and n2, respectively within a droplet and outside the cell (i.e., the culture medium) are close to each other, in such a way that the paraxial approximation can be used. Indeed, in this experiment, n1 is approximately 1.47, as vegetable oils (Jung et al., 2018), and n2 is about 1.34 (sea water). The optical effect of the cytoplasm, which consists in a thin layer located between the LDs and the cell membrane, is weak and may therefore be ignored. Under these hypotheses, we can consider that the LD introduces a quadratic phase factor, as a usual thin lens, to an incident plane wave, which is given by Nazarathy and Shamir (1980):
where r is the light focusing distance, i.e., the focal length of the LD lens, and (x,y) are the position coordinates in the plane of the thin lens, with (0,0) in the centre of the lens. Moreover, the optical path difference emerging out of the droplet, between the centre and the border of the droplet, is
thus
Consequently, the light focusing distance with respect to the LD focus plane, r, is proportional to its diameter D divided by the refractive index difference.
As the exact refractive index difference is not necessarily simple to determine in practice, it can be assumed that, for a given experimental situation, it is constant. It should also be pointed out that the influence of the cytoplasm is weak. Therefore, one can model
where b is a constant that is experimentally determined, as explained below.
As described in 2.6.3, the complex amplitude has been first computed in the focus plane of the LDs. Then, the light focusing zone corresponding to each droplet is searched and detected by performing incremental digital reconstructions with Eq. 1. For that purpose, 120 reconstructions by steps of 0.05 µm are performed to detect the maximal local intensities. Rigorously, for every pixel, the maximal value of the intensity, among all the 120 reconstructed images, is kept. This reconstruction range and the requested sensitivity were determined after a preliminary check. In particular, the reconstruction step value has to be selected as smaller than the classical depth of focus, in such a way that no significant change appears between the successive reconstructions. The depth of focus in vacuum is assessed by
This process provides an image with the highest intensities while reconstructing by 6 µm along the optical axis. For each pixel, the reconstruction distance corresponding to the kept value of the intensity is stored. As the droplets are focusing the light, the intensities of each focused spot are locally significantly larger than the average intensity of the reconstructed image. Therefore, applying a threshold process to the computed image of the highest intensities allows the individual identification and segmentation of the droplets. In practice, the average image intensity and the threshold are, respectively, set to the grey levels 32 and 150 for every image (on a 256-level grey scale). The threshold operation creates small areas around the maximal focusing intensities. However, the smallest ones are not relevant as they are due to perturbations that may happen. To eliminate them, a connectivity surface analysis is performed to reject the zones having an area lesser than 20 pixels. It results a collection of the zones of interest covering the individual focusing spots generated by the LDs (Figure 2C). It has to be emphasized that the detection of the focused spots isolated by a threshold provides an efficient way to segment the droplets, whereas the segmentation could be much more complicated in the focus plane of the LDs where they might be in contact with each other. The next step consists in searching in each zone of interest the maximal value of the intensity and to read the corresponding reconstructing distance, which gives an estimation of the light focusing distance r of the LD. Thanks to the relationship of Eq. 7, the diameter D of each LD is subsequently assessed.
In comparison with usual methods using images in the focal plane of LDs, this approach provides the huge advantage that LDs in contact give well-separated focusing spots. This is inherent to the method and largely simplifies the segmentation process of the LDs.
After this step, we dispose of a set of well-separated segmented spots, individually identifying the LDs and the corresponding diameters. An image with disks centred in each focused zone and having the computed diameters, superimposed on the respective phase image, is created to illustrate the efficiency of the developed method (Figure 2D). The aforementioned phase background correction is particularly important for this purpose, since a non-flat phase background would induce a lateral bias in the determination of the position of the LDs.
2.6.5 Parameter calibration
The determination of the b parameter of Eq. 7 is illustrated in Figure 3 and made as follows. This calibration is specific for the sample type and is therefore kept for all the analyses of the same kind of samples. In a first step, we consider phase images like Figure 2B in which well-defined LDs are selected as, for instance, those in Figures 3A–C. A threshold is applied to these phase images in order to determine the areas belonging to the LDs (blue areas in Figures 3D–F). As in the correction processing described in 2.6.2 all the phase images are corrected to achieve a stable phase background, the threshold operation is very efficient. In our processing, we selected as threshold value the 150th grey level within the range of 0–255 that corresponds to the phase range 0–2π. The next step consists in computing the surface area S of each selected LD and the corresponding diameter
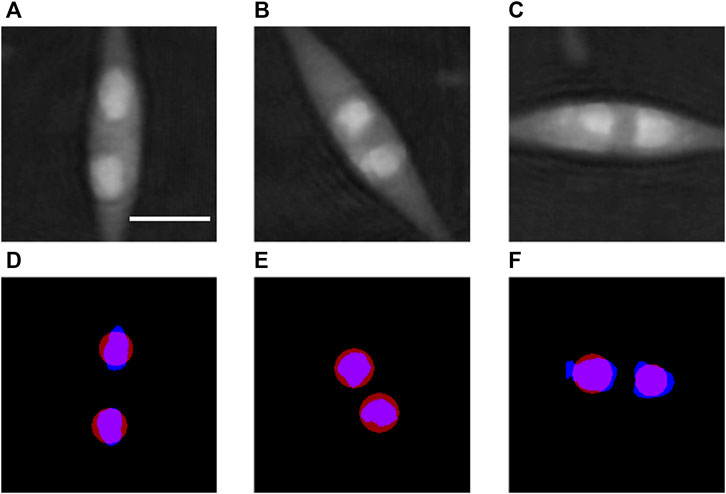
FIGURE 3. Calibration of the b parameter defined in Eq. 7. (A–C) show examples of cells from Figure 2B used for the assessment of the b parameter, with well-separated lipid droplets. (D–F) represent in blue the areas segmented with a threshold applied to the optical phase images (A–C), respectively, from which the diameter D in Eq. 7 is estimated for each droplet. The position and size of the corresponding lipid droplets obtained by the proposed method with the calibrated value of the b parameter are shown in red in (D–F). Scale bar = 5 µm.
As described in 2.6.4, the light focusing distance r is then computed for each selected LD. The b parameter is then assessed for each LD from Eq. 7:
2.6.6 Resolution limit of the method
An important aspect to determine is the smallest size of the detectable droplets. This limit finds its origin in the lateral resolution limit, which is given by
where
(1) D set to 3 µm and decreasing NA to get q = 3; we obtained NA = 0.6, which gives a ratio between D and the resolution of 5.5; and
(2) NA set to 1.3 and decreasing D to get q = 3; we obtained D = 1.2 µm, which gives a ratio between D and the resolution of 4.8.
It can be concluded that the minimum size of a detected droplet is about 5 times the resolution limit. With our set-up for the LDs, that corresponds to D = 1.25 µm.
3 Results
3.1 Measurements
The results obtained on 4 series of different cultures at 24 days are given in Table 1. The number of detected LDs is relatively large that makes the method ideal for monitoring living cell cultures by a statistically significant way. We observe that the mean values of the LD volume are in the range 4.85–6.28 μm3 at 24 culture days that is in good agreement with the value of 5.1 µm3 obtained by Wong and Franz (2013) with a laser scanning confocal microscope. The standard deviations are relatively important, which is also observed by Wong and Franz. It means that LD size distribution is widespread.
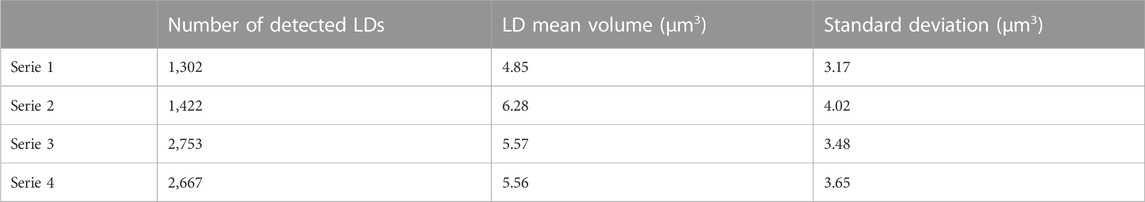
TABLE 1. Assessment of individual LD size inside cells of 4 series of Phaeodactylum tricornutum cultures at 24 days.
3.2 Validation of the method by correlative quantitative phase contrast–fluorescence imaging
The fluorescence channel of the multimode DHM allowed to validate the identification of the LDs in the phase images and the formation of the intensity peak by each LD. Figure 4 shows an example of results on a culture at 24 days.
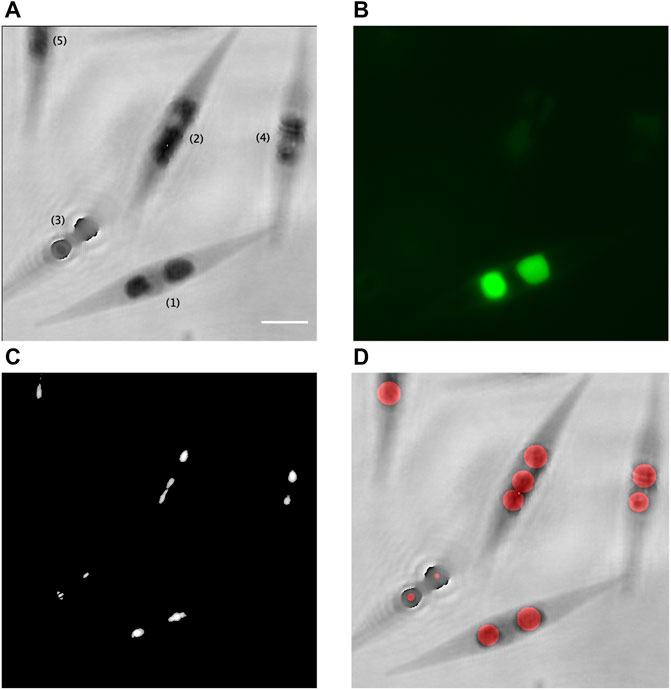
FIGURE 4. Validation of the proposed method with correlative quantitative phase contrast–fluorescence imaging. (A) Inverted phase of the recorded hologram [(1), focused cell; (2), (4), and (5), slightly out-of-focus cells; and (3), largely out-of-focus cell]; (B) corresponding fluorescence image of the LDs stained with BODIPY 505/515; (C) accumulation of the zones of maximal intensities, which correspond to the intensity peaks created by the LDs; and (D) superimposition of the inverted phase of (A) with the computed disks, in red, which represent the assessed LDs. Scale bar = 5 µm.
The size of the LDs is assessed independently with the developed method, described in 2.6, and from the fluorescence images. For the latter one, a threshold was applied to well-contrasted fluorescence images with a level of 127 with respect to the full range 0–255 to distinguish the areas belonging to the LDs from the background. Each area is then measured. The diameter of the disk having the same area is finally computed.
In Figures 4A, B, it can be seen that two in-focus fluorescent LDs stained with BODIPY 505/515 inside the cell (1) are clearly identified in the corresponding phase image. Figure 4C shows the formation of the intensity peaks by these two LDs, thanks to the numerical post-recording reconstruction in depth of the corresponding hologram. With the developed method, the computed diameter of these two LDs are estimated at 2.1 µm and 2.8 µm, as represented in red in Figure 4D, while an estimation performed on the fluorescent image gives, respectively, 2.4 µm and 3.2 µm.
In Figure 4A, the 3 cells numbered (2), (4), and (5) are slightly out of focus, which makes the LD fluorescent emission very weak. Nevertheless, we still obtained the LD focalized intensity peaks for those cells, as seen in Figure 4C, and their diameter can be evaluated with our method (Figure 4D). For the LDs inside the cell (2), we obtained three disks, possibly due to the elongated form of one of the two LDs. It provides however a good approximation of the LD total volume for this cell.
For the largely out-of-focus cell (3) in Figure 4A, the fluorescence emission is too weak to be recorded (Figure 4B). We obtained the focalized intensity peaks for this cell (Figure 4C) but the LD diameter evaluation is disturbed by their unfocused positions in the hologram, as seen in Figure 4D. An individual refocusing of cells with the criterion in Eq. 3, as efficiently demonstrated in Yourassowsky and Dubois (2014), would allow a proper evaluation in this case.
We observed that the fluorescent emission of the BODIPY 505/515 suffers from very fast fading. Therefore, for labelled samples, it was experimentally not possible to accurately focus each fluorescent LD, record the fluorescence image, and the corresponding hologram. A few other images of fluorescent LDs are shown in Figures 5D–F. Table 2 gives a comparison of the size of the different LDs in Figure 5 measured by both holographic and fluorescent methods.
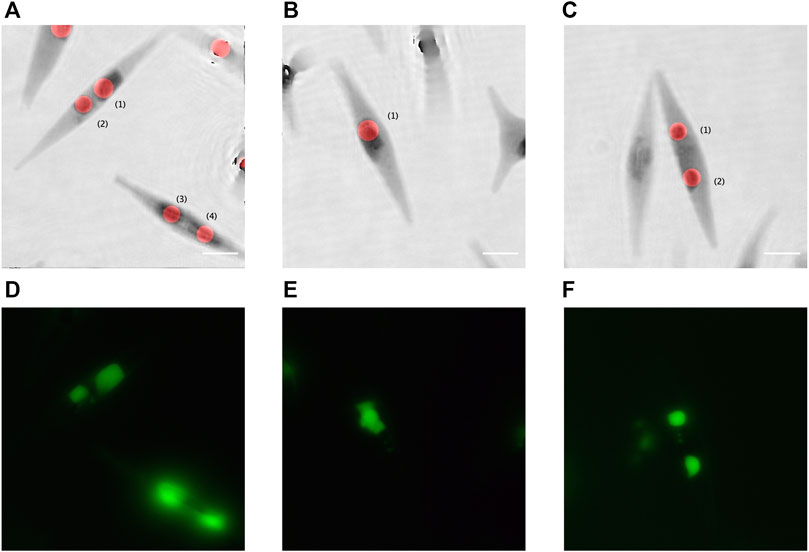
FIGURE 5. Quantitative phase contrast images, extracted from DHM, compared to the fluorescence imaging. (A–C) Inverted quantitative phase images superimposed with the red disks computed using the proposed method; and (D–F) the corresponding fluorescent images with the LDs stained with BODIPY 505/515. Scale bar = 5 µm.
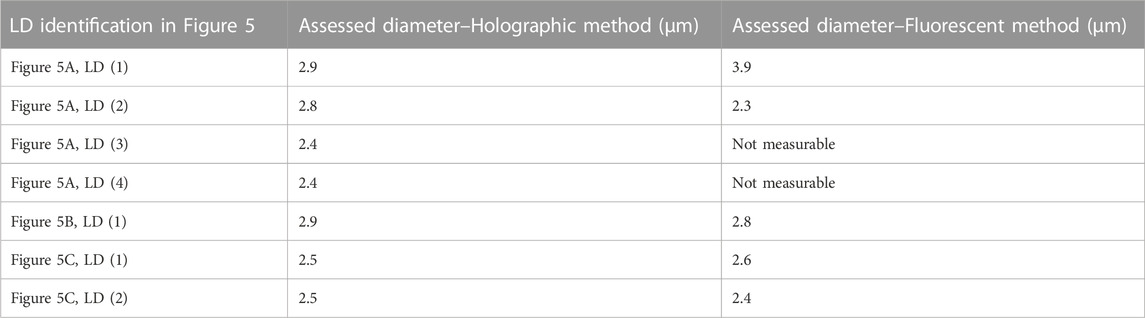
TABLE 2. Comparison of the measured LD sizes with the proposed holographic and the fluorescent methods.
In Table 2, except for Figure 5A, LD(1), we can observe that the differences between the mean diameters obtained by the holographic and fluorescent methods are weak. Indeed, we have to compare the obtained values with the resolution limit equal to
In conclusion, the results obtained for the in-focus fluorescent LDs confirm a correct evaluation of the LD sizes obtained with the proposed holographic method.
3.3 Validation of the method on calibrated particles
In order to validate our method for both detection and size assessment, we applied it to monodisperse silica particles having a mean diameter of 7.82 µm (standard deviation = 0.31 µm). Monitoring such larger particles is useful as this size can be reached for bigger LDs in other cell types such as adipocytes.
To perform the test, we prepared a suspension of these particles in water injected into an ibidi chamber. We then placed the ibidi slide in the DHM equipped with 40
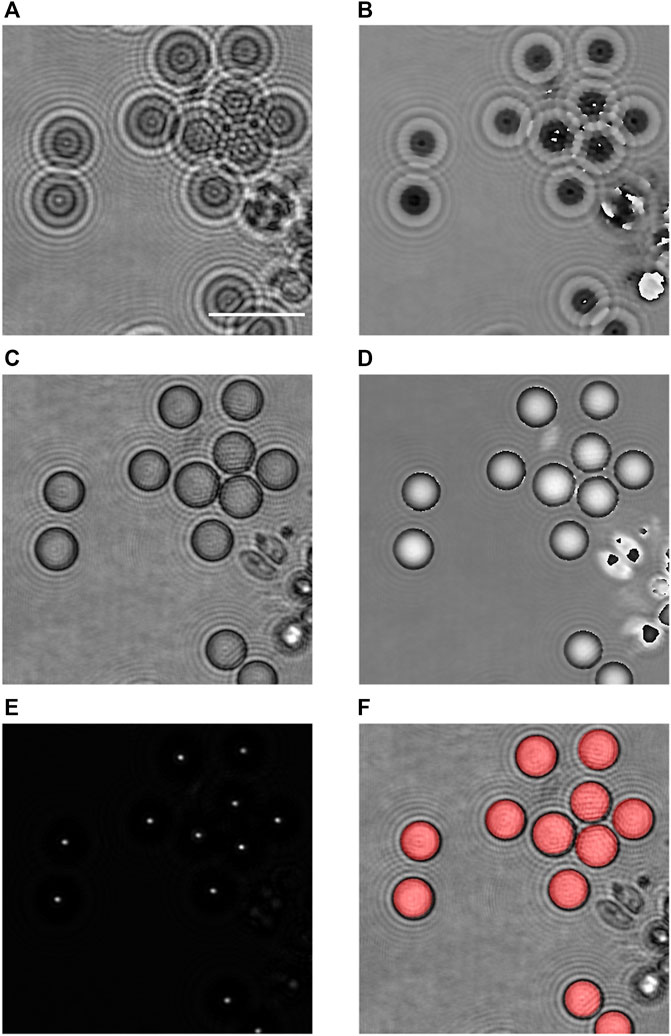
FIGURE 6. Validation of the proposed method on larger particles. (A) Amplitude modulus and (B) optical phase images of monodisperse calibrated silica particles, in the recorded plane; (C) refocused amplitude modulus and (D) optical phase; (E) reconstruction by digital holography and selection of the maximal intensities over a distance of 15.5 µm to show the intensity peaks created by silica particles; and (F) superimposition on (C) of the disks computed according to the proposed method, in red. Scale bar = 20 µm.
The holographic complex amplitude reconstruction is applied by steps of 0.5 µm to obtain the refocused image by using Eqs 1–3, as shown in Figures 6C, D (reconstruction at −9.5 µm). As the particles are sedimented, the refocusing criterion can be applied to the full hologram field.
According to our method, the digital holographic reconstruction can then be applied in order to search and detect the maximum peak intensities of each particle (Figure 6E). As these tests are performed with 40
Knowing the light focusing distance r with respect to the focus plane, and measuring the diameter D in Figure 6D for several particles, it is then possible to assess the b parameter. Finally, the size of all the particles in the sequence is computed according to their own light focusing distance r, using Eq. 7 with this value of b. Figure 6F shows the superimposition on the in-focus particles, in grey, of the computed ones, in red, according to the described method. We observe that it is well superimposed.
With the proposed method, we obtained that the average diameter is 8.33 µm with a standard deviation of 0.60 µm. With the NA 0.60, the resolution limit is 0.54 µm. The difference between the supplier data and our result is 0.51 µm, which is lesser than the resolution limit. Therefore, we can conclude that our results are in good agreement with the data of the particle supplier.
It is important to outline in this example that the proposed method allows to discriminate particles that are in contact, as we can observe in Figure 6. Indeed, the focused spots by application of the digital holographic propagation (Figure 6E) are well separated, giving rise to the right identification of the particles without having to use further segmentation processes.
It is interesting to note that the method also allows the addition of complementary criteria to select the elements we want to measure. For example, it is possible to reject too small intensity peaks or to eliminate peaks that are too far with respect to the focus plane.
4 Discussion and conclusion
Thanks to DHM, we have developed a non-destructive method that allows to assess the lipid content of Phaeodactylum tricornutum living cell cultures in a non-invasive and fast way. As detailed in 3.1, the evaluation of the mean value of LD volume is similar to the measurement made by Wong and Franz (2013) with a laser scanning confocal microscope on Phaeodactylum tricornutum in the same culture conditions.
The developed method was cross-validated thanks to the LD staining with the fluorochrome BODIPY 505/515 and the use of a multimode DHM that allows to perform correlative quantitative phase contrast–fluorescence microscopy. The method was also validated on calibrated and larger silica particles. This is meaningful as larger LDs can be found inside other cell types, as, for example, adipocytes.
Our method is validated for spherical LDs. This assumption seems acceptable, as we know that LDs tend to be spheroid objects. However, more accurate shape measurements request more sophisticated and constraining instrumentations and processes as optical diffraction tomography (Jung et al., 2018), or CARS microscopy (Cavonius et al., 2015; Jaeger et al., 2016) that make the analysis of a large number of cells more difficult. Fluorescence microscopy (Mou et al., 2012; He et al., 2014; Rumin et al., 2015; Sandmann et al., 2018) and laser scanning confocal microscopy (Wang et al., 2009; Wong and Franz, 2013) are inherently invasive and slow as there is a need to stain and to scan the sample to accurately focus each LD. Moreover there is the critical fading phenomenon for some fluorochromes as BODIPY 505/515. The proposed technique does not have such constraints and allows a non-invasive and non-destructive analysis of a large number of LDs, leading to a statistical data analysis of evolving cultures more rapidly and efficiently. This aspect is crucial with respect to the actual needs to monitor the microalgal cultures.
The method can be applied for the quantification of LDs of other microalgal species such as Chlamydomonas sp., Monoraphidium neglectum, or Tetraselmis suecica, for example, for which the LDs are spheroid. Even in the case of different LDs partially overlapping in the cell, the method should allow to identify the 3D localization of individual LDs inside the cell and to estimate their volume.
The method is quite effective with a short sedimentation step of the culture samples, in such a way that the refocusing of the cells can be performed in full-field images. However, it can also be used for non-sedimented and unfocused microalgal cells. In this case, each LD can be individually refocused, by using for instance the efficient method described in Yourassowsky and Dubois (2014).
In order to increase the analysis speed of the lipid microalgal cultures with the developed method, the sample can be laterally translated with a motorized stage and the holograms can be recorded with a faster camera. The microalgal culture samples could also be analysed for the lipid content in a high throughput way by the DHM that we already developed for the in-flow analysis of plankton microorganisms (Yourassowsky and Dubois, 2014). In this case, as with the proposed configuration, a full hologram is obtained for every snap shot; the hologram can be recorded very fast, with a short exposure time. In a routine configuration, one can expect an exposure time te of 10 µs. It is then possible to analyse flux with an acceptable maximum speed equal to the resolution (
Data availability statement
The original contributions presented in the study are included in the article, further inquiries can be directed to the corresponding author.
Author contributions
CY: Conceptualization, Data curation, Formal Analysis, Investigation, Methodology, Supervision, Validation, Visualization, Writing–original draft, Writing–review and editing. RT: Data curation, Investigation, Methodology, Validation, Writing–review and editing. JD-E: Conceptualization, Data curation, Formal Analysis, Funding acquisition, Investigation, Methodology, Software, Supervision, Validation, Visualization, Writing–original draft, Writing–review and editing. FD: Conceptualization, Data curation, Formal Analysis, Funding acquisition, Investigation, Methodology, Software, Supervision, Validation, Visualization, Writing–original draft, Writing–review and editing.
Funding
The authors declare financial support was received for the research, authorship, and/or publication of this article. During this study, JD-E was first a Postdoctoral Research Fellow of the Fondation Philippe Wiener–Maurice Anspach and then Chargé de Recherches du Fonds de la Recherche Scientifique–FNRS.
Acknowledgments
The authors acknowledge Nathalie Gypens, Boris Wittek, and Colin Royer of the Laboratoire d’Écologie des Systèmes aquatiques de l’Université libre de Bruxelles for their support for the Phaeodactylum tricornutum culture.
Conflict of interest
The authors declare that the research was conducted in the absence of any commercial or financial relationships that could be construed as a potential conflict of interest.
Publisher’s note
All claims expressed in this article are solely those of the authors and do not necessarily represent those of their affiliated organizations, or those of the publisher, the editors and the reviewers. Any product that may be evaluated in this article, or claim that may be made by its manufacturer, is not guaranteed or endorsed by the publisher.
References
Branco-Vieira, M., San Martin, S., Agurto, C., Santos, M. A., Freitas, M. A. V., and Caetano, N. S. (2017). Analyzing Phaeodactylum tricornutum lipid profile for biodiesel production. Energy Procedia 136, 369–373. doi:10.1016/j.egypro.2017.10.251
Campos, V., Rappaz, B., Kuttler, F., Turcatti, G., and Naveiras, O. (2018). High-throughput, nonperturbing quantification of lipid droplets with digital holographic microscopy. J. Lipid Res. 59, 1301–1310. doi:10.1194/jlr.D085217
Cavonius, L., Fink, H., Kiskis, J., Albers, E., Undeland, I., and Enejder, A. (2015). Imaging of lipids in microalgae with coherent anti-Stokes Raman scattering microscopy. Plant Physiol. 167, 603–616. doi:10.1104/pp.114.252197
Chia, S. R., Ong, H. C., Chew, K. W., Show, P. L., Phang, S.-M., Ling, T. C., et al. (2018). Sustainable approaches for algae utilisation in bioenergy production. Renew. Energy 129, 838–852. doi:10.1016/j.renene.2017.04.001
Chiu, L.-d., Ho, S.-H., Shimada, R., Ren, N.-Q., and Ozawa, T. (2017). Rapid in vivo lipid/carbohydrate quantification of single microalgal cell by Raman spectral imaging to reveal salinity-induced starch-to-lipid shift. Biotechnol. Biofuels 10, 9. doi:10.1186/s13068-016-0691-y
Cooper, M. S., Hardin, W. R., Petersen, T. W., and Cattolico, R. A. (2010). Visualizing “green oil” in live algal cells. J. Biosci. Bioeng. 109, 198–201. doi:10.1016/j.jbiosc.2009.08.004
Dohet-Eraly, J., Yourassowsky, C., El Mallahi, A., and Dubois, F. (2016). Quantitative assessment of noise reduction with partial spatial coherence illumination in digital holographic microscopy. Opt. Lett. 41, 111–114. doi:10.1364/OL.41.000111
Dubois, F., Callens, N., Yourassowsky, C., Hoyos, M., Kurowski, P., and Monnom, O. (2006a). Digital holographic microscopy with reduced spatial coherence for three-dimensional particle flow analysis. Appl. Opt. 45, 864–871. doi:10.1364/ao.45.000864
Dubois, F., Joannes, L., and Legros, J.-C. (1999). Improved three-dimensional imaging with a digital holography microscope with a source of partial spatial coherence. Appl. Opt. 38, 7085–7094. doi:10.1364/AO.38.007085
Dubois, F., Schockaert, C., Callens, N., and Yourassowsky, C. (2006b). Focus plane detection criteria in digital holography microscopy by amplitude analysis. Opt. Express 14, 5895–5908. doi:10.1364/OE.14.005895
Dubois, F., and Yourassowsky, C. (2003). Method and device for obtaining a sample with three-dimensional microscopy. U.S. Patent No 7,009,700 B2.
Dubois, F., and Yourassowsky, C. (2012). Optical method for characterizing transparent particles. WO 2012/062805 A1, U.S. Patent No 9,476,694 B2.
Dubois, F., Yourassowsky, C., Callens, N., Minetti, C., Queeckers, P., Podgorski, T., et al. (2011). “Digital holographic microscopy working with a partially spatial coherent source,” in Coherent light microscopy, imaging and quantitative phase analysis. Editors P. Ferraro, A. Wax, and Z. Zalevsky (Berlin, Germany: Springer), 31–59. doi:10.1007/978-3-642-15813-1
Dubois, F., Yourassowsky, C., and Monnom, O. (2004). “Microscopie en holographie digitale avec une source partiellement cohérente,” in Imagerie et Photonique pour les Sciences du Vivant et de la Médecine. Editors M. Faupel, P. Smigielski, and R. Grzymala (Lüdenscheid, Nordrhein-Westfalen: Fontis Media), 287–302.
Guillard, R. R. L. (1975). “Culture of phytoplankton for feeding marine invertebrates,” in Culture of marine invertebrates animals. Editors W. L. Smith, and M. H. Chanley (New York: Plenum Press), 29–60. doi:10.1007/978-1-4615-8714-9-3
Guo, B., Lei, C., Kobayashi, H., Ito, T., Yalikun, Y., Jiang, Y., et al. (2017). High-throughput, label-free, single-cell, microalgal lipid screening by machine-learning-equipped optofluidic time-stretch quantitative phase microscopy. Cytom. A 91, 494–502. doi:10.1002/cyto.a.23084
He, L., Han, X., and Yu, Z. (2014). A rare Phaeodactylum tricornutum cruciform morphotype: culture conditions, transformation and unique fatty acid characteristics. PLoS One 9, e93922. doi:10.1371/journal.pone.0093922
He, X. N., Allen, J., Black, P. N., Baldacchini, T., Huang, X., Huang, H., et al. (2012). Coherent anti-Stokes Raman scattering and spontaneous Raman spectroscopy and microscopy of microalgae with nitrogen depletion. Biomed. Opt. Express 3, 2896–2906. doi:10.1364/BOE.3.002896
Jaeger, D., Pilger, C., Hachmeister, H., Oberländer, E., Wördenweber, R., Wichmann, J., et al. (2016). Label-free in vivo analysis of intracellular lipid droplets in the oleaginous microalga Monoraphidium neglectum by coherent Raman scattering microscopy. Sci. Rep. 6, 35340. doi:10.1038/srep35340
Jung, J., Hong, S.-J., Kim, H.-B., Kim, G., Lee, M., Shin, S., et al. (2018). Label-free non-invasive quantitative measurement of lipid contents in individual microalgal cells using refractive index tomography. Sci. Rep. 8, 6524. doi:10.1038/s41598-018-24393-0
Kim, K., Lee, S., Yoon, J., Heo, J., Choi, C., and Park, Y. (2016b). Three-dimensional label-free imaging and quantification of lipid droplets in live hepatocytes. Sci. Rep. 6, 36815. doi:10.1038/srep36815
Kim, K., Yoon, J., Shin, S., Lee, S., Yang, S.-A., and Park, Y. (2016a). Optical diffraction tomography techniques for the study of cell pathophysiology. J. Biomed. Photonics Eng. 2, 020201-1–020201-16. doi:10.18287/JBPE16.02.020201
Mata, T. M., Martins, A. A., and Caetano, N. S. (2010). Microalgae for biodiesel production and other applications: a review. Renew. Sustain. Energy Rev. 14, 217–232. doi:10.1016/j.rser.2009.07.020
Morales, M., Aflalo, C., and Bernard, O. (2021). Microalgal lipids: a review of lipids potential and quantification for 95 phytoplankton species. Biomass Bioenergy 150, 106108. doi:10.1016/j.biombioe.2021.106108
Mou, S., Xu, D., Ye, N., Zhang, X., Liang, C., Liang, Q., et al. (2012). Rapid estimation of lipid content in an Antarctic ice alga (Chlamydomonas sp.) using the lipophilic fluorescent dye BODIPY505/515. J. Appl. Phycol. 24, 1169–1176. doi:10.1007/s10811-011-9746-4
Nazarathy, M., and Shamir, J. (1980). Fourier optics described by operator algebra. J. Opt. Soc. Am. 70, 150–159. doi:10.1364/JOSA.70.000150
Patel, A., Antonopoulou, I., Enman, J., Rova, U., Christakopoulos, P., and Matsakas, L. (2019). Lipids detection and quantification in oleaginous microorganisms: an overview of the current state of the art. BMC Chem. Eng. 1, 13. doi:10.1186/s42480-019-0013-9
Pirone, D., Sirico, D. G., Mugnano, M., Del Giudice, D., Kurelac, I., Cavina, B., et al. (2022). Finding intracellular lipid droplets from the single-cell biolens’ signature in a holographic flow-cytometry assay. Biomed. Opt. Express 13, 5585–5598. doi:10.1364/BOE.460204
Rodolfi, L., Biondi, N., Guccione, A., Bassi, N., D’Ottavio, M., Arganaraz, G., et al. (2017). Oil and eicosapentaenoic acid production by the diatom Phaeodactylum tricornutum cultivated outdoors in green wall panel (GWP®) reactors. Biotechnol. Bioeng. 114, 2204–2210. doi:10.1002/bit.26353
Rumin, J., Bonnefond, H., Saint-Jean, B., Rouxel, C., Sciandra, A., Bernard, O., et al. (2015). The use of fluorescent Nile red and BODIPY for lipid measurement in microalgae. Biotechnol. Biofuels 8, 42. doi:10.1186/s13068-015-0220-4
Sandmann, M., Schafberg, M., Lippold, M., and Rohn, S. (2018). Analysis of population structures of the microalga Acutodesmus obliquus during lipid production using multi-dimensional single-cell analysis. Sci. Rep. 8, 6242. doi:10.1038/s41598-018-24638-y
Sauvage, A., Dubois, F., Haumont, D., Pireaux, V., El Mallahi, A., Yourassowsky, C., et al. (2014). “Evaluation of lipid loading in macrophages using Digital Holographic Microscopy (DHM): a new non-invasive and quantitative technology,” in Proceedings of the Presented at the 28th annual conference of the European Macrophage and Dendritic Cell Society, Vienna, Austria, October 2014, 2–4.
Wang, Z. T., Ullrich, N., Joo, S., Waffenschmidt, S., and Goodenough, U. (2009). Algal lipid bodies: stress induction, purification, and biochemical characterization in wild-type and starchless Chlamydomonas reinhardtii. Eukaryot. Cell 8, 1856–1868. doi:10.1128/EC.00272-09
Wong, D. M., and Franz, A. K. (2013). A comparison of lipid storage in Phaeodactylum tricornutum and Tetraselmis suecica using laser scanning confocal microscopy. J. Microbiol. Methods 95, 122–128. doi:10.1016/j.mimet.2013.07.026
Keywords: digital holography, microscopy, hologram processing, microalgae, lipid droplet, lipid quantification
Citation: Yourassowsky C, Theunissen R, Dohet-Eraly J and Dubois F (2024) Lipid quantification in living microalgal cultures with digital holographic microscopy. Front. Photonics 4:1301708. doi: 10.3389/fphot.2023.1301708
Received: 25 September 2023; Accepted: 12 December 2023;
Published: 05 January 2024.
Edited by:
Mostafa Agour, Aswan University, EgyptReviewed by:
Nirmal Mazumder, Manipal Academy of Higher Education, IndiaAlexander Khmaladze, University at Albany, United States
Claas Falldorf, Bremer Institut für angewandte Strahltechnik, Germany
André F. Müller, Bremer Institut für angewandte Strahltechnik, Germany, in collaboration with reviewer CF
Copyright © 2024 Yourassowsky, Theunissen, Dohet-Eraly and Dubois. This is an open-access article distributed under the terms of the Creative Commons Attribution License (CC BY). The use, distribution or reproduction in other forums is permitted, provided the original author(s) and the copyright owner(s) are credited and that the original publication in this journal is cited, in accordance with accepted academic practice. No use, distribution or reproduction is permitted which does not comply with these terms.
*Correspondence: Frank Dubois, ZnJhbmsuZHVib2lzQHVsYi5iZQ==