Impact of tissue atrophy on high-pass filtered MRI signal phase-based assessment in large-scale group-comparison studies: a simulation study
- 1Medical Physics Group, Institute of Diagnostic and Interventional Radiology I, Jena University Hospital - Friedrich Schiller University Jena, Jena, Germany
- 2Department of Neurology, Buffalo Neuroimaging Analysis Center, School of Medicine and Biomedical Sciences, University at Buffalo, State University of New York, Buffalo, NY, USA
- 3MR Imaging Clinical Translational Research Center, School of Medicine and Biomedical Sciences, University at Buffalo, State University of New York, Buffalo, NY, USA
The assessment of abnormal accumulation of tissue iron in the basal ganglia nuclei and in white matter (WM) plaques using the gradient echo magnetic resonance signal phase has become a research focus in many neurodegenerative diseases such as multiple sclerosis (MS) or Parkinson's disease. A common and natural approach is to calculate the mean high-pass-filtered phase of previously delineated brain structures. Unfortunately, the interpretation of such an analysis requires caution: in this paper we demonstrate that regional gray matter (GM) atrophy, which is concomitant with many neurodegenerative diseases, may itself directly result in a phase shift seemingly indicative of increased iron concentration even without any real change in the tissue iron concentration. Although this effect is relatively small results of large-scale group comparisons may be driven by anatomical changes rather than by changes of the iron concentration.
Introduction
The assessment of abnormal accumulation of tissue iron in the basal ganglia nuclei and in white matter (WM) plaques has become a research focus in many neurodegenerative diseases (15), such as multiple sclerosis (MS) (24) and Parkinson's disease (10). While a decade ago tissue mineralization was detected in vivo only based on qualitative signal abnormalities on T1- and T2-weighted images (5, 6), more quantitative techniques such as MRI relaxometry (1, 19, 33, 52, 53) and magnetic field measurements (2, 12, 14, 26, 37, 47, 48, 52, 54) have recently emerged. Applying these techniques in group comparison studies with normal controls may potentially reveal even very subtle tissue abnormalities and promises to provide a deeper understanding of the underlying tissue pathology.
Among the quantitative techniques, phase imaging has received much interest due to its theoretically high sensitivity to even small amounts of iron. The non-local phase behavior of the complex-valued gradient echo (GRE) MR signal reflects the perturbation of the homogeneous main magnetic field due to the inhomogeneous distribution of magnetic susceptibility in the tissue and, consequently, represents an indirect measure of the tissue magnetic properties (34). The tissue magnetic susceptibility is supposedly proportional to the iron concentration of the tissue, and therefore a promising biomarker for abnormal iron accumulation (23).
Unfortunately, though, the relation between the magnetic susceptibility distribution and the phase is non-local, meaning that the local contrast on phase images does not directly reflect the underlying tissue anatomy in general. For example, the susceptibility distribution of the iron-laden globus pallidus (GP) also affects the phase signal in adjacent regions, such as the putamen (42, 46). A similar effect has also recently been demonstrated in the thalamus (Tha) (4). Furthermore, background field effects often completely dwarf the actual field effects of interest. A very recent deconvolution-based post-processing technique, also referred to as quantitative susceptibility mapping (QSM) (28, 42, 45, 49), allows overcoming the non-local nature of the phase, revealing the underlying susceptibility distribution. Applying this technique, Langkammer et al. (23) have recently confirmed the linearity of the bulk tissue magnetic susceptibility of deep gray matter (GM) and the tissue iron concentration post mortem.
However, since QSM is still in a research stage with currently limited robustness and availability, many researchers prefer analyzing high-pass filtered phase images instead of quantitative susceptibility maps. High-pass filtering diminishes non-local contributions (particularly low spatial frequency background effects) in phase images and has been shown to provide reasonable correlation with the underlying susceptibility distribution (42) and, thus, iron concentration (21). It is also associated with clinical outcomes in patients with MS (17).
However, the interpretation of high-pass filtered phase images requires caution: first, even the filtered phase images still depend by their very nature in a non-local way on the underlying tissue properties. Second, and even more important for the interpretation of group differences, the high-pass filter itself may introduce image artifacts that directly depend on the underlying tissue anatomy (46). For example, high-pass filtering of a larger, more or less homogeneous structure, such as the GP or the Tha, naturally results in a mean phase value inside that structure closer to zero (46, 54). Consequently, group-comparison studies that, for example, aim to find subtle changes in iron concentration between normal controls and patients based on high-pass filtered phase may be seriously biased by anatomical differences between the two groups, like pathology-related brain atrophy. Thus, atrophy-induced shape and volume changes of GM regions induce changes in the high-pass filtered phase even when the actual voxel-wise tissue iron concentration remains perfectly constant. In practice, this effect may result in spurious group differences with respect to the measured iron concentration that are solely caused by atrophy.
Here we demonstrate using numerical models that GM atrophy, which is often concomitant with many neurodegenerative diseases, may result in phase shifts indicative of increased iron concentration even without any true change in the tissue iron concentration, and that these effects can be mitigated by applying QSM.
Materials and Methods
Numerical Models
We investigated the effect of volume changes in deep GM on the high-pass filtered phase and calculated magnetic susceptibility based on numerical models of isolated human Tha and GP. In particular, the Tha is a rather interesting structure as it is supposed to play a central role in MS (31) where it was reported to be the most atrophic deep GM region from the very early onset of disease (16, 18, 54). Compared to using a realistic human whole brain model as in similar studies by, e.g., Schäfer et al. (39) or Grabner et al. (9), the single-nuclei models employed in the present work allow an isolated analysis of volume-related artifacts by avoiding interference of additional non-local phase contributions from other brain structures or background fields (46). In particular, when atrophy of other brain structures or of the whole brain is present additional phase changes may, naturally, occur. However, these additional contributions are beyond the scope of the present manuscript.
The numerical models of the two investigated nuclei were created by manually segmenting Tha and GP in both hemispheres of a 3D quantitative susceptibility map of a healthy human volunteer [data from Ref. (42); voxel size 0.6 × 0.6 × 0.6 mm3] with freeview (FreeSurfer, Athinoula A. Martinos Center for Biomedical Imaging, Massachusetts General Hospital, Charlestown, MA, USA). To eliminate unrealistic discontinuities resulting from the slice-wise segmentation the created binary models (background tissue: zero, nucleus: one) were filtered with a 3D Gaussian kernel (spatial domain standard deviation = 1.8 mm) and subsequently again converted to binary models by thresholding the image intensity at 0.5. These models were then linearly interpolated (Freesurfer mri_convert) to volumes of 10 ml for Tha and 2 ml for GP at an in-plane resolution of 0.5 × 0.5 mm2, typical for SWI (11, 34–36), followed, again, by thresholding the image intensities at 0.5 to eliminate partial volume effects. To avoid field simulation artifacts due to unrealistic sharp edges and staircase effects, the binary models were slightly blurred with a 3D Gaussian filter with 0.6 mm standard deviation. The resulting binary models were converted to susceptibility models by multiplying with 0.02 and 0.2 ppm (SI-units) for Tha and GP, respectively, mimicking the susceptibility difference of these nuclei with respect to surrounding WM (42). The models were zero-padded to an in-plane matrix size of 512 × 512, which is typical for SWI acquisitions (11, 35, 36). The magnetic field perturbation induced by these susceptibility models in a homogeneous main magnetic field (B0) of 3 Tesla in z-direction was simulated by first fast-forward field computation (20, 22, 30, 38) and then converted to GRE phase at an echo time (TE) of 22 ms (phase wrapping neglected at this point) by multiplication with −γ · B0 · TE (γ is the proton gyromagnetic ratio). Finally, for each nucleus progressively smaller phase models were created by spatially resampling the phase models (using Freesurfer's mri_convert) to volumes between 5 and 10 ml for the Tha and 0.5 and 2 ml for the GP (91 uniformly spaced volumes each). These ranges of volumes were taken from recent studies by Cherubini et al. (3) and Zivadinov et al. (54) on age-related atrophy. The resampling was performed on the phase models instead of on the susceptibility models to reduce contributions caused by unrealistic boundary effects in the simulated field for smaller nuclei. This processing order substantially reduced scatter of mean values measured in the nuclei (see Results and Discussion).
Magnitude signal models were created by resampling the susceptibility models analogously to the phase models, multiplying their voxel values with 106 and subtracting these models from a homogeneous image with intensity equal to one to mimic T*2 decay related to magnetic susceptibility. This resulted in image intensities of 0.98 and 0.8 in the Tha and GP, respectively, and 1 outside of the nuclei. No noise was added because noise was assumed to be irrelevant for the subsequent analyses. Figure 1 illustrates the susceptibility and the phase models of the nuclei for both hemispheres.
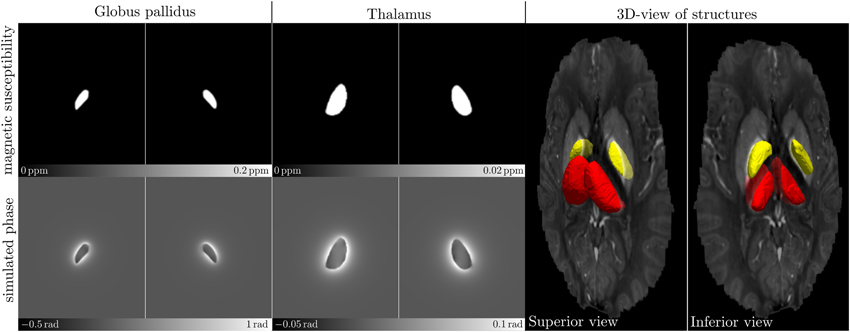
Figure 1. Numerical models of the human GP (left-most images) and Tha (middle images) in both hemispheres, respectively. The images in the top row show axial center slices of the 3D susceptibility models, the bottom row shows the simulated phase images. The images show the numerical models as used in the simulation, including the large background area (not cropped). The 3D surface-rendering (right-most images) of the GP (yellow) and the Tha (red) illustrates their spatial shape and location in the in vivo susceptibility map that served as a basis for creating the models (transparent; from black to white: −0.1 to 0.2 ppm).
High-Pass Filtering
To obtain high-pass homodyne-filtered phase images (32), complex-valued images were generated from the down-sampled magnitude and phase images and high-pass filtered by slice-wise multiplication with a two-dimensional Hanning window in the Fourier domain. Hanning filters with widths of 32 × 32 and 64 × 64 were applied; these filter widths are common for typical high-pass filtered phase images (11, 35). Figure 2 illustrates the filtered phase models.
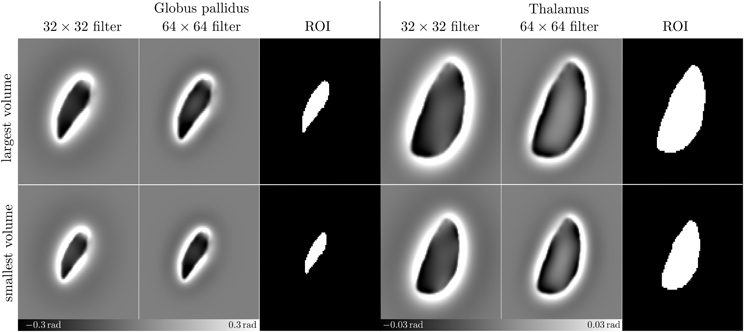
Figure 2. High pass filtered phase images. This figure presents enlarged (cropped) images resulting from high-pass filtering the phase images (Figure 1-bottom) with 32 × 32 and 64 × 64 Hanning windows, respectively, and the ROIs used for assessing the mean phase values. Top and bottom rows show phase images and ROIs resulting from the largest and the smallest models, respectively.
Quantitative Susceptibility Mapping
To compare the results of the high-pass filtering experiment (High-Pass Filtering) to the more sophisticated QSM technique, thresholded k-space division (TKD) (45) was applied to all non-filtered down-sampled phase images. TKD was chosen because this is the most simple inversion algorithm for QSM and, consequently, represents a worst-case QSM scenario. In short, TKD converts properly unwrapped and background corrected phase images to the source magnetic susceptibility distribution by dividing the Fourier spectrum of the phase image with the Fourier domain unit dipole response (45). During this division noise amplification is moderated by thresholding small values in the unit dipole response (regularization).
To investigate the effect of regularization on the mean susceptibility values in the nuclei, the simulation was successively repeated with threshold values of 0.1, 0.2, and 0.3.
Analysis
The mean of the voxel values was measured in the two differently filtered phase models, in the original field model (Figure 1, bottom row) and in the susceptibility maps resulting from TKD using regions-of-interest (ROI; Figure 2) inside of the nuclei defined by thresholding the magnitude models at the value that corresponded to the average of the minimum and the maximum magnitude intensity, i.e., (1 + 0.98)/2 = 0.99 and (1 + 0.8)/2 = 0.9 for Tha and GP, respectively. To illustrate the relative change, mean values were divided by the mean value measured in the model with the largest volume. Linear least squares regression was performed for all relative mean values against the volume of the model, Pearson's correlation coefficients were calculated and t-statistics was used to test the null hypothesis that no linear relationship exists between phase or susceptibility and volume. The null hypothesis was rejected when p < 0.01.
Results
Figure 3 shows the relative mean phase change over the volume of the Tha (A) and GP (B). Table 1 lists corresponding fitting coefficients and statistical measures. The mean phase values of the original, non-filtered phase models was not significantly dependent on the volume (black circles; p ≥ 0.3). For the phase images filtered with a 64 × 64 window (blue circles and line; strong filtering), a significant increase of the relative change of mean phase values (mean phase becoming more negative) with decreasing nucleus volume (atrophy) was observed (p < 10−5). For the phase images filtered with a 32 × 32 window (green circles and line; weak filtering), the opposite effect, i.e., a significant decrease of the relative change of mean phase values (mean phase becoming less negative) with decreasing nucleus volume was observed (p < 0.01). Table 1 also lists the absolute phase changes corresponding to the relative phase changes, i.e., the relative phase changes multiplied by the average mean phase in the largest nucleus. Note that the actual susceptibility and, consequently, the simulated iron concentration of the model was the same for all data points (so the true slope should be zero). The measured linear phase changes are, thus, solely due to the interaction between the size of a nucleus (volume) and the applied homodyne filter.
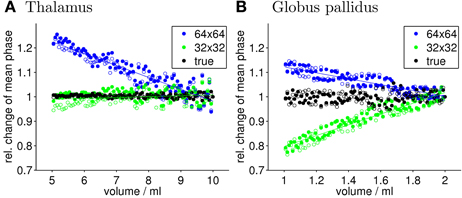
Figure 3. Quantitative evaluation of the mean phase values. Shown is the relative change of the mean phase inside of Tha (A) and GP (B), respectively, as a function of the nucleus size for the original phase image (true) and the high-pass filtering with 32 × 32 and 64 × 64 kernel size. Values of left and right hemisphere nuclei are represented by filled and open marks, respectively. Straight lines represent linear least-squares regression (see Table 1 for details). Note that the susceptibility of the input model and, thus, the iron concentration was kept constant for all data points in this figure.
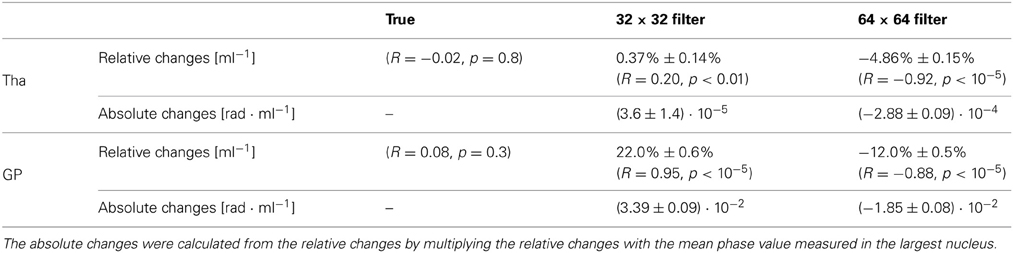
Table 1. Slopes of the relative and absolute mean-phase changes of a nucleus as a function of its volume for different filter widths.
Figure 4 presents a more detailed analysis of the filter-induced artifacts. Compared to the original Tha phase model (Figure 4A-left), the phase distributions after filtering (Figure 4A-middle/right) show a considerably altered phase distribution throughout the nucleus with a relatively flat phase value distribution in the center of the nucleus (normal straight arrows) and increased phase values close to the edges of the nucleus (dot-ended straight arrows). This effect may be explained by the high-pass filter property of the Hanning window that (with increasing filter window) suppresses subtle low-frequency field variations inside of large nuclei. In the GP (Figure 4C), which is considerably smaller than the Tha, the filtering mostly induced an overall shift toward lower values but did not considerably affect the phase value distribution in the nucleus. These observations are also quantitatively confirmed by the profile-line analyses in Figures 4B,D, which demonstrate that the phase values inside the Tha in the 64 × 64 filtered image are almost zero at the center of the nucleus.
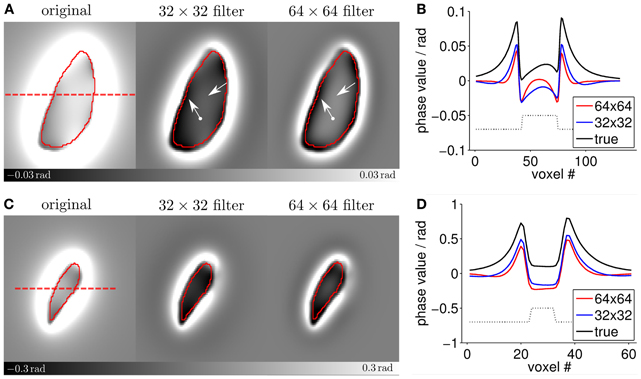
Figure 4. Detailed analysis of the filter-induced artifacts. Panels (A,C) show enlarged images of the largest Tha and GP models (cf. Figures 1, 2). The ROIs are outlined in red. The dashed red line indicates the location of the profile line measurements shown in panels (B,D). The straight arrows point to different phase variations in the center of the Tha model while the dot-ended arrows point to different signal characteristics at the edges of the nucleus. In panels (B,D) the dotted black lines indicate the location of the ROIs.
Figure 5 shows, analogously to Figure 3, the relative changes of the mean magnetic susceptibility as a function of volume for both Tha (A) and GP (B) that were calculated from the non-filtered phase images. Table 2 lists corresponding fitting coefficients and statistical measures. Similar to the results obtained with high-pass filtered phase, correlations between the mean susceptibility values and the volume of the nuclei were significant for all regularization parameters (p < 0.01). However, relative changes of the measured susceptibility values were about one (32 × 32 window) to two (64 × 64 window) orders of magnitude smaller compared to the high-pass filtered phase (compare Tables 1, 2 or ordinate-ranges in Figures 3, 5). Two exemplary susceptibility maps calculated with a TKD thresholding parameter of 0.1 are shown in Figure 5C. The susceptibility distributions were relatively homogeneous inside the nuclei, in agreement with the input susceptibility models (Figure 1). The underestimation of the susceptibility values (same image contrast in Figures 1, 5C) and the reconstruction artifacts outside of the nuclei are associated with the simple TKD inversion algorithm (43, 45, 49).
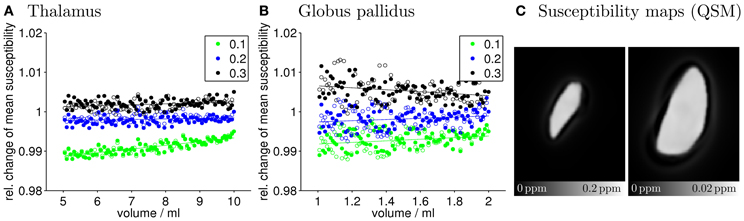
Figure 5. Quantitative evaluation of the mean susceptibility values. Shown is the relative change of the mean susceptibility inside of Tha (A) and GP (B), respectively, as a function of the nucleus size for different TKD regularization parameters. Values of left and right hemisphere nuclei are represented by filled and open marks, respectively. Straight lines represent linear least-squares regression (see Table 2 for details). For ease of visualization data points corresponding to TKD thresholds of 0.1 and 0.3 were shifted by −0.01 and +0.01, respectively. Note that the ordinate spans a much smaller range of values compared to Figure 3, demonstrating the substantially higher insensitivity to volume changes of calculated mean susceptibility values compared to mean high-pass filtered phase values. (C) Shows exemplary susceptibility maps of the largest models of GP (left) and Tha (right) calculated with a thresholding parameter of 0.1.
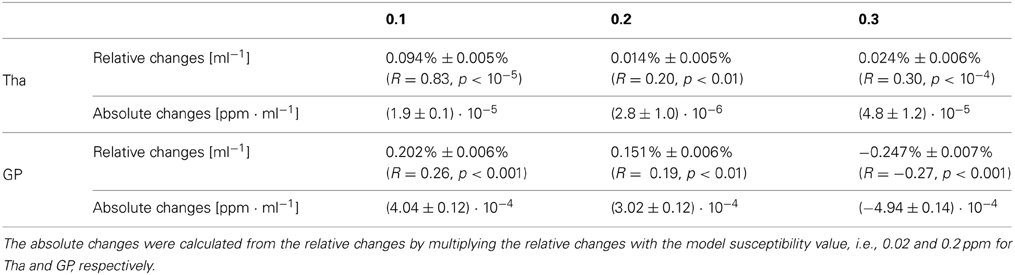
Table 2. Slopes of the relative and absolute mean-susceptibility changes of a nucleus as a function of its volume for different regularization parameters.
The phase and susceptibility values in Figures 3, 5, respectively, scatter substantially around the regression lines. In the most extreme case (see the 32 × 32 filtered phase in the Tha in Figure 3A) the volume change of the nucleus could only explain 4% (R2; Table 1) of the variation. The scatter may be attributed to both interpolation effects due to the resampling of the models and the binarization of the ROIs. Due to the strong signal variations close to the surface of the nuclei (cf. Figure 4) the simulated phase values in these regions are particularly affected by partial volume effects. In addition, these effects inherently hamper the definition of the nucleus surface and, thus, the creation of binary ROIs. Since the creation of binary ROIs from the resampled magnitude models is a discrete process it is particularly prone to the small signal variations at the surface of the models due to interpolation effects. This also explains why substantially less scattering was observed for the susceptibility values. Mean value calculation in the susceptibility maps was generally less affected by the ROI definition because susceptibility maps were more homogeneous inside the nuclei (Figure 5C) compared to the phase images. However, while the scatter emphasizes the need for exact and reproducible ROI definition in real-world scenarios, it does not introduce a bias to group comparison studies, compared to the observed linear changes of the mean values with volume.
Discussion
It is well-known that high-pass filtering of phase images can introduce substantial artifacts that could erroneously be interpreted as varying susceptibility, such as ring-like structures in the vicinity of tissue interfaces (39). Furthermore, the correlation between mean values of high-pass filtered phase and underlying mean susceptibility has been shown to substantially depend on the shape and orientation of structures with respect to the main magnetic field as well as on the chosen filter kernel (39, 42).
In this paper we demonstrated a direct consequence of the filter-related artifacts that has not been discussed so far and has implications for group comparison studies based on high-pass filtered phase images. Based on numerical simulations we demonstrated that mean values of high pass filtered phase are influenced by volume changes mimicking atrophy. These dependencies alone, in the absence of any real iron changes, may result in apparent group differences in mean phase values solely due to anatomical differences between the groups (Figure 3). This implies that different phase values may be measured even if the biophysical tissue composition, including the iron concentration, is the same.
Zivadinov et al. (54) recently reported substantial pathologic volume decreases of deep GM in patients with MS (Table 4 in that publication; volumes converted to single hemisphere by dividing with 2): the average Tha volume was (7.65 ± 1.7) ml in normal controls compared to (6.45 ± 1.9) ml in secondary progressive (SP) MS patients (ΔV = −1.2 ml) and (1.8 ± 0.4) ml in the GP compared to (1.51 ± 0.5) ml in SP–MS (ΔV = −0.29 ml). Using the slopes in Table 1, these volume changes explain a systematic bias of the mean high-pass filtered phase (64 × 64 window) toward more negative values of approximately 5.8% in Tha and 3.5% in GP (ΔV · sloperelative). Considering the average model-phase value φ corresponding to the normal controls' volume of Tha and GP of 6.7 · 10−3 rad and 0.16 rad, respectively, the absolute phase changes Δφ due to atrophy are approximately 4 · 10−4 rad and 6 · 10−3 rad (Δφ ·slopeabsolute). These values are small compared to the inter-subject variation of mean phase observed in recent studies, which were, depending on the region, in the range of 10−2 to 10−1 rad (14, 51). It may, thus, be concluded that the phase changes due to the interaction of filtering and volume are small compared to intrinsic variations of the mean phase values in real-world scenarios and that the results of most group-comparison studies using high-pass filtered phase were most likely not biased by this effect. However, when studies are performed with large cohorts of several hundred subjects (17, 54) the effect may become significant. Assuming a mean volume difference of 0.27 ml in GP, as observed between normal controls and MS patients (40) (weighted average; right hemisphere; male subjects; Table 2 in that publication) the current work predicts a relative change of mean high-pass filtered (32 × 32) phase values of 0.22 ml−1 · 0.27 ml = 5.9 % (Table 1). Considering a mean filtered phase value in this region of (−0.0955 ± 0.029) rad in normal controls (51) yields an absolute phase change of −0.0057 rad, i.e., an effect size of d = 0.0057/0.029 = 0.196. A rudimentary power estimation reveals a chance of finding a significant group difference of, e.g., 10% with 24 subjects and 50% with 478 subjects per group [G*Power software (7, 8)].
The strong linearity of the relation between phase and volume found in the present study (Figure 3) suggests that it may be possible to estimate the volume-related change of the filtered phase, ξ = (φ 1−φ2)/φ1, based on the measured absolute volume change |ΔV| = |V1 − V2|: ξ ~ s · | Δ V|, where s is the nucleus- and filter-dependent slope in Table 1 and φ1 and φ2 are the mean phase values corresponding to the volumes V1 and V2. Such estimation may improve interpreting phase changes in the presence of atrophy. For example, if the relative phase change ξ is substantially higher than predicted by the simulation, changes in tissue composition may potentially be present. However, the slope s depends on the shape of the nucleus and the particular post-processing, which is reflected by the different values in Table 1. Consequently, the results presented in this study may only serve as rough estimates of the volume-related phase changes. In clinical studies, specific simulations may be required to rule out whether a detected volume change can fully explain the observed phase change between two groups. A general formula for estimating the filter-related bias would require different factors such as filter size, kernel geometry, and surface-to-volume ratio.
Recently, novel phase correction methods were introduced that, compared to the heuristic nature of high-pass filtering, are physically motivated and therefore do not compromise the integrity of the brain-related phase information (27, 42). While these techniques are supposed to reveal the true brain-related phase they are even more inappropriate for direct assessment of the underlying tissue composition than the high-pass filtering technique (42): first, the phase will still depend on the geometry and orientation of the underlying susceptibility distribution (39), e.g., the shape of a nucleus, and, second, in practical situations the phase is heavily influenced by non-local contributions from adjacent structures, which may even reduce the correlation of ROI-mean values with the underlying magnetic susceptibility compared to the homodyne-technique (42).
The effect discussed in the current work, of course, does not affect the interpretation of inter-group phase changes without volume changes. More complex approaches of assessing phase changes, e.g., characterizing local abnormal phase changes by thresholding (54), may be less sensitive to the anatomical situation and, consequently, less affected by the high-pass filtering artifact discussed here. In the present study the dependence of mean voxel values on the structure volume could be reduced by one to two orders of magnitude by applying the very recent post-processing technique QSM to the original phase images. However, the dependence could not be eliminated completely (Figure 5 and Table 2), which may be attributed to the Fourier-domain nature of the employed susceptibility mapping algorithm TKD. This algorithm regularizes the field-to-susceptibility inversion by damping the magnitude of ill-conditioned Fourier coefficients in the susceptibility distribution. Since this operation, similar to the high pass filtering, acts on the Fourier spectrum of the susceptibility distribution its result is naturally also dependent on size and shape. Since TKD is the simplest QSM algorithm with a straightforward regularization in the Fourier domain it may be speculated that also the found volume-dependence represents a worst case. However, any QSM algorithm needs to address the ill-conditioned Fourier components of the field-to-source by regularization strategies so that this effect may also exist, probably to a lower degree, in more sophisticated inversion schemes (13, 25, 29, 41, 43, 44, 50). While a thorough analysis of the volume-dependence for the various types of QSM algorithms is beyond the scope of this work, it should be noted that in this worst-case scenario the absolute change of the mean susceptibility was below 5 · 10−4 ppm/ml for all cases (Table 2), with higher values for the GP and lower values for the Tha. Although this value is below the detection limit of QSM (~10−3 ppm) for atrophic volume changes (~1 ml) the interaction between volume and calculated mean susceptibility value should be considered when susceptibility values of structures with different size are quantitatively compared.
In conclusion, high-pass filtered phase depends not only on the tissue magnetic susceptibility, and thus indirectly on the tissue iron concentration, but also on the tissue structure. In the presence of clinically realistic tissue atrophy, which is associated with many neurological diseases, results of group comparisons including large numbers of subjects may be affected or even driven by volume changes rather than by changes of the iron concentration. We therefore, recommend assessing tissue volume and refrain from interpreting group mean differences of high-pass filtered phase when tissue atrophy is present or suspected. If available, QSM should be preferred over high-pass filtering of phase images.
Conflict of Interest Statement
The authors declare that the research was conducted in the absence of any commercial or financial relationships that could be construed as a potential conflict of interest.
Acknowledgments
This research was funded by a research grant by the German Research Foundation (DFG, RE 1123/9-2), a seed grant awarded to Andreas Deistung by the Interdisciplinary Center for Clinical Research (IZKF) in Jena, and seed grants awarded to Ferdinand Schweser by the International Society for Magnetic Resonance in Medicine (ISMRM) and the Friedrich Schiller University Jena. We are grateful to Marie Mende (BSc) for support with the numerical simulations.
References
1. Bartzokis G, Aravagiri M, Oldendorf WH, Mintz J, Marder SR. Field dependent transverse relaxation rate increase may be a specific measure of tissue iron stores. Magn Reson Med. (1993) 29:459–64. doi: 10.1002/mrm.1910290406
2. Chen X, Zeng C, Luo T, Ouyang Y, Lv F, Rumzan R, et al. Iron deposition of the deep grey matter in patients with multiple sclerosis and neuromyelitis optica: a control quantitative study by 3D-enhanced susceptibility-weighted angiography (ESWAN). Eur J Radiol. (2012) 81:e633–9. doi: 10.1016/j.ejrad.2012.01.003
3. Cherubini A, Péran P, Caltagirone C, Sabatini U, Spalletta G. Aging of subcortical nuclei: microstructural, mineralization and atrophy modifications measured in vivo using MRI. Neuroimage (2009) 48:29–36. doi: 10.1016/j.neuroimage.2009.06.035
4. Deistung A, Schäfer A, Schweser F, Biedermann U, Turner R, Reichenbach JR. Toward in vivo histology: a comparison of quantitative susceptibility mapping (QSM) with magnitude-, phase-, and R2*-imaging at ultra-high magnetic field strength. Neuroimage (2013) 65:299–314. doi: 10.1016/j.neuroimage.2012.09.055
5. Drayer BP, Burger P, Hurwitz B, Dawson D, Cain J. Reduced signal intensity on MR images of thalamus and putamen in multiple sclerosis: increased iron content? Am J Roentgenol. (1987) 149:357–63. doi: 10.2214/ajr.149.2.357
6. Drayer BP., Burger P, Hurwitz B, Dawson D, Cain J, Leong J, et al. Magnetic resonance imaging in multiple sclerosis: decreased signal in thalamus and putamen. Ann Neurol. (1987) 22:546–50. doi: 10.1002/ana.410220418
7. Faul F, Erdfelder E, Lang AG, Buchner A. G*Power 3, a flexible statistical power analysis program for the social, behavioral, and biomedical sciences. Behav Res Methods (2009) 39:175–91. doi: 10.3758/BF03193146
8. Faul F, Erdfelder E, Buchner A, Lang AG. Statistical power analyses using G*Power 3.1, tests for correlation and regression analyses. Behav Res Methods (2007) 41:1149–60. doi: 10.3758/BRM.41.4.1149
9. Grabner G, Trattnig S, Barth M. Filtered deconvolution of a simulated and an in vivo phase model of the human brain. J Magn Reson Imaging (2010) 32:289–97. doi: 10.1002/jmri.22246
10. Griffiths PD, Dobson BR, Jones GR, Clarke DT. Iron in the basal ganglia in Parkinson's disease. An in vitro study using extended X-ray absorption fine structure and cryo-electron microscopy. Brain (1999) 122:667–73. doi: 10.1093/brain/122.4.667
11. Haacke EM, Ayaz M, Khan A, Manova ES, Krishnamurthy B, Gollapalli L, et al. Establishing a baseline phase behavior in magnetic resonance imaging to determine normal vs. abnormal iron content in the brain. J Magn Reson Imaging (2007) 26:256–64. doi: 10.1002/jmri.22987
12. Haacke EM, Cheng NYC, House MJ, Liu Q, Neelavalli J, Ogg RJ, et al. Imaging iron stores in the brain using magnetic resonance imaging. Magn Reson Imaging (2005) 23:1–5. doi: 10.1016/j.mri.2004.10.001
13. Haacke EM, Tang J, Neelavalli J. Susceptibility mapping as a means to visualize veins and quantify oxygen saturation. J Magn Reson Imaging (2010) 676:663–76. doi: 10.1002/jmri.22276
14. Hagemeier J, Dwyer MG, Bergsland N, Schweser F, Magnano CR, Heininen-Brown M, et al. Effect of age on mri phase behavior in the subcortical deep gray matter of healthy individuals. Am J Neuroradiol. (2013). doi: 10.3174/ajnr.A3569. [Epub ahead of print].
15. Hagemeier J, Geurts JJG, Zivadinov R. Brain iron accumulation in aging and neurodegenerative disorders. Expert Rev Neurother. (2012) 12:1467–80. doi: 10.1586/ern.12.128
16. Hagemeier J, Weinstock-Guttman B, Bergsland N, Heininen-Brown M, Carl E, Kennedy C, et al. Iron deposition on SWI-filtered phase in the subcortical deep gray matter of patients with clinically isolated syndrome may precede structure-specific atrophy. Am J Neuroradiol. (2012) 33:1596–601. doi: 10.3174/ajnr.A3030
17. Hagemeier J, Weinstock-Guttman B, Heininen-Brown M, Poloni GU, Bergsland N, Schirda C, et al. Gray matter SWI-filtered phase and atrophy are linked to disability in MS. Front Biosci. (2013) 5:525–32. doi: 10.2741/E634
18. Hagemeier J, Yeh EA, Brown MH, Bergsland N, Dwyer MG, Carl E, et al. Iron content of the pulvinar nucleus of the thalamus is increased in adolescent multiple sclerosis. Mult Scler. (2012). 19:567–576. doi: 10.1177/1352458512459289
19. Hikita T, Abe K, Sakoda S, Tanaka H, Murase K, Fujita N. Determination of transverse relaxation rate for estimating iron deposits in central nervous system. Neurosci Res. (2005) 51:67–71. doi: 10.1016/j.neures.2004.09.006
20. Holt RW, Diaz PJ, Duerk JL, Bellon EM. MR susceptometry: an external-phantom method for measuring bulk susceptibility from field-echo phase reconstruction maps. J Magn Reson Imaging (1994) 4:809–18. doi: 10.1002/jmri.1880040612
21. Hopp KM, Popescu BFG, McCrea RPE, Harder SL., Robinson CA, Haacke EM, et al. Brain iron detected by SWI high pass filtered phase calibrated with synchrotron X-ray fluorescence. J Magn Reson Imaging (2010) 31:1346–54. doi: 10.1002/jmri.22201
22. Koch KM, Papademetris X, Rothman DL, de Graaf RA. Rapid calculations of susceptibility-induced magnetostatic field perturbations for in vivo magnetic resonance. Phys Med Biol. (2006) 51:6381–402. doi: 10.1088/0031-9155/51/24/007
23. Langkammer C, Schweser F, Krebs N, Deistung A, Goessler W, Scheurer E, et al. Quantitative susceptibility mapping (QSM) as a means to measure brain iron? A post mortem validation study. Neuroimage (2012) 62:1593–99. doi: 10.1016/j.neuroimage.2012.05.049
24. LeVine SM. Iron deposits in multiple sclerosis and Alzheimer's disease brains. Brain Res. (1997) 760:298–303. doi: 10.1016/S0006-8993(97)00470-8
25. Li W, Wu B, Liu C. Quantitative susceptibility mapping of human brain reflects spatial variation in tissue composition. Neuroimage (2011) 55:1645–56. doi: 10.1016/j.neuroimage.2010.11.088
26. Liem MK, Lesnik Oberstein SA, Versluis MJ, Maat-Schieman MLC, Haan J, Webb AG, et al. 7T MRI reveals diffuse iron deposition in putamen and caudate nucleus in CADASI L. J Neurol Neurosurg Psychiatry (2012) 83:1180–5. doi: 10.1136/jnnp-2012-302545
27. Liu T, Khalidov I, de Rochefort L, Spincemaille P, Liu J, Tsiouris AJ, et al. A novel background field removal method for MRI using projection onto dipole fields (PDF). NMR Biomed. (2011) 24:1129–36. doi: 10.1002/nbm.1670
28. Liu T, Spincemaille P, de Rochefort L, Kressler B, Wang Y. Calculation of susceptibility through multiple orientation sampling (COSMOS): a method for conditioning the inverse problem from measured magnetic field map to susceptibility source image in MRI. Magn Reson Med. (2009) 61:196–204. doi: 10.1002/mrm.21828
29. Liu T, Wisnieff C, Lou M, Chen W, Spincemaille P, Wang Y. Nonlinear formulation of the magnetic field to source relationship for robust quantitative susceptibility mapping. Magn Reson Med. (2013) 69:467–76. doi: 10.1002/mrm.24272
30. Marques JP, Bowtell RW. Application of a Fourier-based method for rapid calculation of field inhomogeneity due to spatial variation of magnetic susceptibility. Concepts Magn Reson B Magn Reson Eng. (2005) 25B:65–78. doi: 10.1002/cmr.b.20034
31. Minagar A, Barnett MH, Benedict RHB, Pelletier D, Pirko I, Sahraian MA, et al. The thalamus and multiple sclerosis: modern views on pathologic, imaging, and clinical aspects. Neurology (2013) 80:210–9. doi: 10.1212/WNL.0b013e31827b910b
32. Noll DC, Nishimura DG, Makovski A. Homodyne detection in magnetic resonance imaging. IEEE Trans Med Imaging (1991) 10:154–63. doi: 10.1109/42.79473
33. Péran P, Hagberg GE, Luccichenti G, Cherubini A, Brainovich V, Celsis P, et al. Voxel-based analysis of R2* maps in the healthy human brain. J Magn Reson Imaging (2007) 26:1413–20. doi: 10.1002/jmri.21204
34. Rauscher A, Sedlacik J, Barth M, Mentzel HJ, Reichenbach, JR. Magnetic susceptibility-weighted MR phase imaging of the human brain. Am J Neuroradiol. (2005) 26:736–42.
35. Reichenbach JR, Barth M, Haacke EM, Klarhöfer M, Kaiser WA, Moser E. High-resolution MR venography at 3.0 Tesla. J Comp Assist Tomogr. (2000) 24:949–57. doi: 10.1097/00004728-200011000-00023
36. Reichenbach JR, Venkatesan R, Schillinger D, Kido DK, Haacke EM. Small vessels in the human brain: MR-venography with deoxyhemoglobin as an intrinsic contrast agent. Radiology (1997) 204:272–77.
37. Rumzan R, Wang JJ, Zeng C, Chen X, Li Y, Luo T, et al. Iron deposition in the precentral grey matter in patients with multiple sclerosis: a quantitative study using susceptibility-weighted imaging. Eur J Radiol. (2013) 82:e95–9. doi: 10.1016/j.ejrad.2012.09.006
38. Salomir R, de Senneville BD, Moonen CTW. A fast calculation method for magnetic field inhomogeneity due to an arbitrary distribution of bulk susceptibility. Concepts Magn Reson B Magn Reson Eng. (2003) 19B:26–34. doi: 10.1002/cmr.b.10083
39. Schäfer A, Wharton SJ, Gowland P, Bowtell RW. Using magnetic field simulation to study susceptibility-related phase contrast in gradient echo MRI. Neuroimage (2009) 48:126–37. doi: 10.1016/j.neuroimage.2009.05.093
40. Schoonheim MM, Popescu V, Rueda Lopes FC, Wiebenga OT, Vrenken H, Douw L, et al. Subcortical atrophy and cognition: sex effects in multiple sclerosis. Neurology (2012) 79:1754–61. doi: 10.1212/WNL.0b013e3182703f46
41. Schweser F, Deistung A, Lehr BW, Reichenbach JR. Differentiation between diamagnetic and paramagnetic cerebral lesions based on magnetic susceptibility mapping. Med Phys. (2010) 37:5165–78. doi: 10.1118/1.3481505
42. Schweser F, Deistung A, Lehr BW, Reichenbach JR. Quantitative imaging of intrinsic magnetic tissue properties using MRI signal phase: an approach to in vivo brain iron metabolism? Neuroimage (2011) 54:2789–807. doi: 10.1016/j.neuroimage.2010.10.070
43. Schweser F, Deistung A, Sommer K, Reichenbach JR. Toward online reconstruction of quantitative susceptibility maps: superfast dipole inversion. Magn Reson Med. (2013) 69:1581–93. doi: 10.1002/mrm.24405
44. Schweser F, Sommer K, Deistung A, Reichenbach JR. Quantitative susceptibility mapping for investigating subtle susceptibility variations in the human brain. Neuroimage (2012) 62:2083–2100. doi: 10.1016/j.neuroimage.2012.05.067
45. Shmueli K, de Zwart JA, van Gelderen P, Li TQ, Dodd SJ, Duyn JH. Magnetic susceptibility mapping of brain tissue in vivo using MRI phase data. Magn Reson Med. (2009) 62:1510–22. doi: 10.1002/mrm.22135
46. Walsh AJ, Wilman AH. Susceptibility phase imaging with comparison to R2 mapping of iron-rich deep grey matter. Neuroimage (2011) 57:452–61. doi: 10.1016/j.neuroimage.2011.04.017
47. Wang D, Li WB, Wei XE, Li, YH, Dai YM. An investigation of age-related iron deposition using susceptibility weighted imaging. PLoS ONE (2012) 7:e50706. doi: 10.1371/journal.pone.0050706
48. Wang Y, Butros SR, Shuai X, Dai Y, Chen C, Liu M, et al. Different iron-deposition patterns of multiple system atrophy with predominant parkinsonism and idiopathetic Parkinson diseases demonstrated by phase-corrected susceptibility-weighted imaging. Am J Neuroradiol. (2012) 33:266–73. doi: 10.3174/ajnr.A2765
49. Wharton SJ, Schäfer A, Bowtell RW. Susceptibility mapping in the human brain using threshold-based k-space division. Magn Reson Med. (2010) 63:1292–304. doi: 10.1002/mrm.22334
50. Wu B, Li W, Guidon A, Liu C. Whole brain susceptibility mapping using compressed sensing. Magn Reson Med. (2011) 24:1129–36. doi: 10.1002/mrm.23000
51. Xu X, Wang Q, Zhang M. Age, gender, and hemispheric differences in iron deposition in the human brain: an in vivo MRI study. Neuroimage (2008) 40:35–42. doi: 10.1016/j.neuroimage.2007.11.017
52. Yan SQ, Sun JZ, Yan YQ, Wang H, Lou M. Evaluation of brain iron content based on magnetic resonance imaging (MRI): comparison among phase value, R2* and magnitude signal intensity. PLoS ONE (2012) 7:e31748. doi: 10.1371/journal.pone.0031748
53. Yao B, Li TQ, Gelderen PV, Shmueli K, de Zwart JA, Duyn JH. Susceptibility contrast in high field MRI of human brain as a function of tissue iron content. Neuroimage (2009) 44:1259–66. doi: 10.1016/j.neuroimage.2008.10.029
54. Zivadinov R, Heininen-Brown M, Schirda CV, Poloni GU, Bergsland N, Magnano CR, et al. Abnormal subcortical deep-gray matter susceptibility-weighted imaging filtered phase measurements in patients with multiple sclerosis: a case-control study. Neuroimage (2012) 59:331–9. doi: 10.1016/j.neuroimage.2011.07.045
Keywords: atrophy, phase imaging, magnetic susceptibility, tissue iron, artifacts, high pass filtering, group comparison
Citation: Schweser F, Dwyer MG, Deistung A, Reichenbach JR and Zivadinov R (2013) Impact of tissue atrophy on high-pass filtered MRI signal phase-based assessment in large-scale group-comparison studies: a simulation study. Front. Physics 1:14. doi: 10.3389/fphy.2013.00014
Received: 29 May 2013; Accepted: 07 September 2013;
Published online: 02 October 2013.
Edited by:
Zhen Cheng, Stanford University, USAReviewed by:
Markus Barth, Radboud University Nijmegen, NetherlandsAlexander Rauscher, University of British Columbia, Canada
Copyright © 2013 Schweser, Dwyer, Deistung, Reichenbach and Zivadinov. This is an open-access article distributed under the terms of the Creative Commons Attribution License (CC BY). The use, distribution or reproduction in other forums is permitted, provided the original author(s) or licensor are credited and that the original publication in this journal is cited, in accordance with accepted academic practice. No use, distribution or reproduction is permitted which does not comply with these terms.
*Correspondence: Jürgen R. Reichenbach, Medical Physics Group, Institute of Diagnostic and Interventional Radiology I, Jena University Hospital, Friedrich Schiller University Jena, Philosophenweg 3, Building 5, MRT, 07743 Jena, Germany e-mail: juergen.reichenbach@med.uni-jena.de
†These authors have contributed equally to this work.