Integration of fluorescence differential path-length spectroscopy to photodynamic therapy of the head and neck tumors is useful in monitoring clinical outcome
 Baris Karakullukcu1 Stephen C. Kanick2 Jan B. Aans1,2 Henricus J. C. M. Sterenborg2 I. Bing Tan1 Arjen Amelink2
  Dominic J. Robinson3*
- 1Department of Head and Neck Oncology and Surgery, The Netherlands Cancer Institute, Antoni van Leeuwenhoek Hospital, Amsterdam, Netherlands
- 2Department of Radiation Oncology, Center for Optical Diagnostics and Therapy, Erasmus University Medical Center, Rotterdam, Netherlands
- 3Department of Otolaryngology and Head and Neck Surgery, Center for Optical Diagnostics and Therapy, Erasmus University Medical Center, Rotterdam, Netherlands
Background: The use of fluorescence differential pathlength spectroscopy (FDPS) has the potential to provide real-time information on photosensitiser pharmacokinetics, vascular physiology, and photosensitizer photobleaching based dosimetry of tumors in the oral cavity receiving m-tetrahydroxyphenylchlorin (mTHPC) photodynamic therapy (PDT). Reflectance spectra can be used provide quantitative values of oxygen saturation, blood volume fraction (DVF), blood vessel diameter, and to determine the local optical properties that can be used to correct raw fluorescence for tissue absorption.
Patients and methods: Twenty-seven lesions in the oral cavity, either dysplasias or cancer were interrogated using FDPS, before and immediately after the therapeutic illumination.
Results: The average tumor center (TC) to normal mucosa (NM) ratio of fluorescence was 1.50 ± 0.66. mTHPC photobleaching was observed in 24 of the lesions treated. The average extent of photobleaching was 81 ± 17%. Information from FDPS spectroscopy coupled with the clinical results of the treatment identified three types of correctable errors in the application of mTHPC-PDT: Two patients exhibited very low concentrations of photosensitizer in TC, indicating an ineffective i.v. injection of photosensitiser or an erroneous systemic distribution of mTHPC. In one in tumor we observed no photobleaching accompanied by a high DVF in the illuminated tissue, suggesting that the presence of blood prevented therapeutic light reaching the target tissue. All three of the these lesions had no clinical response to PDT. In four patients we observed less than 50% photobleaching in the tumor margins, suggesting a possible geographic miss of the oncological safety margin. One patient in this group had a recurrence within 2 months after PDT even though the initial response was good.
Conclusion: The integration of FDPS to clinical PDT of head and neck tumors yields data on tissue physiology, photosensitiser content, and photobleaching that can help identify treatment errors that can potentially be corrected.
Introduction
Photodynamic therapy (PDT) is a therapeutic modality that involves the administration of visible light and a photo-active drug, or photosensitizer, that results in localized tissue destruction without systemic toxicity. Upon activation of the photosensitizer is activated; light energy is transferred to molecular oxygen, which leads to the formation of reactive oxygen species (ROS), notably singlet oxygen. Subsequently these ROS interact with critical biomolecules, oxidizing them. This leads to the destruction of the illuminated tissue through a range of mechanisms that include apoptosis, necrosis, destruction of tumor vasculature and an immune response against tumor cells [1–3].
Several articles have been published outlining the clinical results of meta-tetrahydroxyphenylchlorin (mTHPC) mediated PDT of the head and neck tumors [4–12]. While many report early experiences, a number of these publications report clinical complete responses around 69–95% of carefully selected patients with early stage oral cavity cancer [5–12]. However, despite the use of rigorous patient and lesion selection criteria and the standardize delivery of light, a small but significant number of tumors show incomplete response or do not respond to therapy. There are numerous factors that can cause these failures. Treatment related factors, in other words sub-optimal PDT could play a role that can be improved with better techniques. In this manuscript we have aimed to attempt to unravel some of these treatment-related factors.
The local therapeutic effect of PDT is driven by the production of ROS and depends on the presence of three components: light, photosensitizer, and oxygen [1, 13, 14]. Previous investigations have shown significant inter- and intra-subject variations in parameters such as photosensitizer concentration and pharmacodynamics, the optical properties of tissue and concomitant differences in the effective fluence and fluence rate, and the ability of the tissue vasculature to supply sufficient oxygen during PDT [15–18]. Each of these parameters can be different for individual lesions and patients. They can be interdependent and change dynamically during therapy [19, 20]. Differences in these interrelated parameters can lead to variations in the photodynamic dose that is delivered to the treatment volume and to the surrounding normal tissues. These differences may be the source of inadequate therapeutic response.
Better understanding of these variations and interrelationships can help us analyze treatment failures on individual treatment basis. Optical spectroscopy is a non-invasive method of monitoring these PDT related variables [13–25]. Reflectance spectroscopy utilizes the dominant absorption bands of oxy- and de-oxyhemoglobin in tissue to determine parameters that characterize the local vascular physiology [13, 14, 21]. Fluorescence spectroscopy can be used to determine the presence of the photosensitiser and may be used to monitor the photosensitizer concentration and photosensitiser photobleaching during PDT [16–18]. The combination of monitoring reflectance spectroscopy and fluorescence spectroscopy in the same tissue volume may also provide complimentary information on the relationship between photobleaching and the presence of oxygen during therapy.
Over the past decade our group has developed various optical spectroscopic techniques including the use of differential path-length spectroscopy (DPS) [22, 23] and the associated technique florescence differential path-length spectroscopy (FDPS) [25] for monitoring PDT. FDPS utilizes two optical fibers one for delivery of light (white light for DPS and 652 nm excitation light for FDPS), and both for collecting light reflected (or emitted) from tissue. The difference between the two collected signals limits the contribution from long path-length photons. This enables the optical sampling of a small volume of tissue immediately beneath the fiber-probe. FDPS can accommodate large variations in background absorption using a simple correction algorithm. This makes it particularly valuable for photosensitizer fluorescence spectroscopy in-vivo, during PDT, when the background absorption can change dramatically. Another advantage of FDPS is that the collection volume can be adjusted to match the relevant dimensions of the application. For fluorescence measurements of photosensitizers, it is critical to selectively interrogate a relevant tissue volume to avoid averaging photosensitiser concentrations over a volume that is either deeper or shallower than the intended sampling volume. It is noteworthy that while FDPS remains dependant on the scattering coefficient of tissue, this is expected to have a relatively small influence on the signals collected particularly in tissues of the same type [23, 25].
We have applied FDPS to the clinical setting and to healthy volunteers and reported the initial feasibility data in our previous publication [25]. The results of this pilot study indicated that FDPS could be effectively incorporated in a clinical setting and that FDPS correctly estimated the absence of mTHPC in control patients and detected mTHPC photobleaching in tissue volumes that received treatment light following PDT. Given these initial results we have utilized FDPS to analyze optical characteristics of oral cavity tumors being routinely treated with PDT in our institute. The clinical treatment protocol was kept standard to allow evaluation of treatment failures. This manuscript reports the reflectance and fluorescence spectroscopic analysis of these patients and attempt to explain treatment failures based on spectroscopic measurements.
Materials and Methods
Patient Population and Clinical Methods
The patients undergoing PDT for the treatment of oral cavity cancers were included in the project. The study was approved by the Medical Ethics Review Board of the NKI/AvL Hospital (PTC 10.1975/N10OPT) and was conducted in accordance with local guidelines for the treatment of head and neck cancer. Both superficial and deep-seated tumors were included. These deep-seated tumors, that were treated using interstitial PDT, were analyzed separately and will be presented in a separate report. All of the patients reported in this manuscript had squamous cell carcinoma (SCC) or carcinoma in situ (CIS) of the oral mucosa, without regional or distant metastasis and not deeper than 5 mm as measured by ultrasound (T1N0M0 or TisN0M0 by AJCC staging system). Primary tumors, second primary tumors and recurrences of earlier treated tumors were included. The photosensitizer Foscan® (m-tetrahydroxyphenylchlorin, m-THPC) was injected intravenously in a proximal vein in the arm at a dose of 0.15 mg/kg. The surface illumination procedure took place 4 days after the photosensitizer injection. Depending on the location of the tumor the procedure was either performed under general anesthesia or local anesthesia. FDPS measurements were acquired from three locations at the tumor center (TC), three locations on adjacent normal appearing mucosa which had been illuminated in the oncological safety margin (TM) and three locations distant from the tumor, in normal mucosa (NM) in the oral cavity, located under shielding (and therefore receiving no therapeutic light) (NM), immediately before and immediately after the PDT procedure. Therapy was performed with light from diode laser 652 nm (Biolitec, Germany), using a microlens diffuser, with a minimum margin of 5 mm around the visible tumor, using a fluence rate of 100 mWcm−2 to a fluence of 20 Jcm−2.
Fluorescence Differential Path-Length Spectroscopy
The clinical application of fluorescence differential pathlength spectroscopy (FDPS) performed in the present study has been described in detail previously [25]. The outline of the method is described briefly for the readers in this manuscript. For a full description of the technical aspects of the measurement, the filter sets used, the quantification of system artifacts and the incorporation of spectroscopy in to the clinical workflow please refer to our previous publication [25]. Figure 1 is a schematic representation of the device setup. The system uses two 800 μm diameter optical fibers located adjacent to each other and encased in a rigid probe (the probe); one fiber is used for the delivery and collection of light (dc) and the adjacent fiber is used for only for light collection (c). The dc fiber is connected to a white light source, a diode laser delivering 652 nm light and the spectrometer, while the c fiber is connected to the spectrometer. Broad band white light and 652 nm light from a diode laser are sequentially delivered to the tissue and enable the collection of a white light reflectance spectrum and the excitation and collection of mTHPC fluorescence. Before light is led to the spectrometer, both fibers pass through a notch filter; this filters the light from the laser source, thus preventing saturation of the fluorescence spectroscopy system. This results in a small wavelength band over which reflectance spectra are associated with significant levels of noise. Each sequence of measurements is combined with an appropriate calibration procedure such that differential reflectance (DR) and differential fluorescence (DF) spectra are recorded from the tissue of interest.
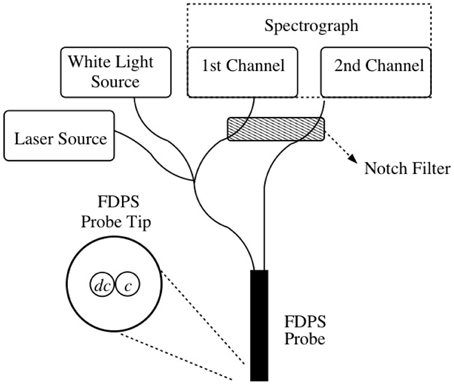
Figure 1. Setup of the FDPS system. The dc (delivery/collection) fiber in the probe excites the tissue with white light and laser light sequentially while both the dc and c (collection) fibers collect and transfer light to the spectrometer.
Data Analysis
The DR is fitted to an empirical model that incorporates the presence of a background scattering model that is appropriate for tissue, and quantifies the influence of absorption on the collected DR. The wavelength dependent absorption coefficient of tissue of the oral cavity is described by components that are related to various absorbers such as oxy- and de-oxyhemoglobin and bilirubin. By accounting for the non-homogeneous distribution of blood in tissue, these components are appropriately combined to yield various physiological parameters: the blood volume fraction (BVF); the microvascular oxygen saturation; the average microvasculature blood vessel diameter and the concentration of bilirubin. A least squares fitting procedure is performed that provides estimated mean values and confidence intervals for each of these parameters.
The calibrated DF (expressed in units of photon counts/ms/mW) is corrected for the effects of absorption by multiplying the DF by the ratio of the DR at the excitation wavelength (652 nm) with and without absorbers present. The value of DR in the presence of absorption is calculated from the fit of data to the empirical model described above while the DR in the absence of absorption is estimated from the background scattering model. This corrected DF is then analyzed as a linear combination of basis spectra that comprise the autofluorescence of the oral mucosa, mTHPC fluorescence, and a small signal attributable to the background fluorescence from the optical components of the system. Basis spectra for each of these components were determined from the average of 5 DF measurements in the oral cavity with and without the presence of mTHPC.
High quality fitting of mTHPC fluorescence and physiological parameters were achieved in the majority of acquisitions even in the presence of low blood volumes. Figure 2 shows a representative example of DR and DF spectra and their components. Individual spectra are excluded based on the presence of observable features in the residual between the model fit and the data as shown in Figure 2, and are not used in the calculation of mean fluorescence.
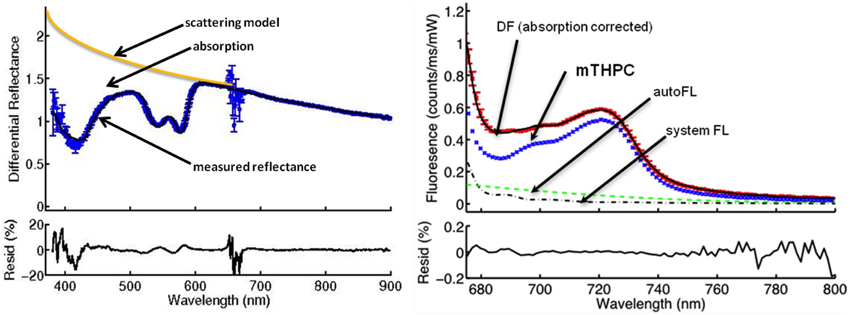
Figure 2. The DPS (left) and FDPS (right) spectra from a center of the tumor before PDT. The absorption of light by the tissue as seen by the difference between the scattering model and the measured reflectance (DR) is used to calculate oxygen saturation, blood volume fraction, and vessel diameter and to correct the measured fluorescence for absorption. The noise at around 652 nm is due to the notch filter. The components of the measured fluorescence (DF) are autofluorescence of the tissue (autoFL), fluorescence of the FDPS system used (system FL) and fluorescence attributable to mTHPC (mTHPC). The effect of the filter is not visible on the FDPS spectrum, because the spectrum is a plot of around 675 nm and longer wavelengths. The “residual” plot underneath the spectra represents the residual between the model fit and the collected data. Residuals between 0.2 and -0.2 are assumed as acceptable.
The DF attributable to the photosensitizer (mTHPC) (this value is expressed as “fluorescence” in the rest of the text), was acquired in three sequential measurements by placing, removing, and replacing the FDPS probe from three different sites of the TC, margins of the tumor located in the illumination field as safety margin [tumor margin (TM)], and normal non-illuminated mucosa (NM). Measurements at each site are averaged to yield one value and a standard deviation. The photobleaching of mTHPC was quantified by the percentage decrease in mTHPC fluorescence calculated using the average values immediately before and after illumination for each site separately. If the BVF in any single DR measurement was high (>50%) fluorescence measurements were repeated after removing excess blood from the measurement area and the probe tip. The reflectance measurements were considered feasible for analysis if the DVF was between 0.3 and 50%. The interpretation of individual combinations of sequential co-localized reflectance and fluorescence spectroscopy are discussed further in the Results Section.
Patients were followed at least 1 year to detect any partial response or recurrence of the tumor at the treated site. The treatment failures (if any detected) were coupled to the measured spectra in an effort to explain the reason(s) of the failure.
Statistical Analysis
The significance of differences in mean fluorescence intensity and physiological parameters were assessed using an unpaired Student's t-test (with an α = 0.05).
Results
Twenty-four patients with 27 oral cavity lesions were included in the study. Seventy eight percent of the spectra obtained were suitable for analysis using the criteria described in the methods.
Variability in mTHPC Fluorescence and Tumor Selectivity
The fluorescence measured at the TC before PDT ranged from 3.02 to 0.09 photon counts/ms/mw with a mean of 1.33 ± 0.77. The mean fluorescence measured at TM was similar to mean fluorescence at TC before PDT [1.27 ± 0.49 vs. 1.33 ± 0.77, respectively (p = 0.84)], whereas the mean fluorescence measured at NM (0.95 ± 0.47) was lower but not statistically significantly lower (p = 0.25). It is evident from high standard deviations that there is considerable variation inter-subject. When average fluorescence of TC, TM, and NM are plotted per patient/lesion (Figure 3), the mean TC/NM ratio of fluorescence was 1.50 ± 0.66. It can be seen from Figure 3 that, although true for the majority, not in all cases the TC contain more photosensitizer than NM. There is no observable difference between TC and TM with a TC/TM ratio of 1.18 ± 0.53. Two lesions (no. 12 and 13) showed very low fluorescence in all measured locations before PDT (Figure 3) (p < 0.05).
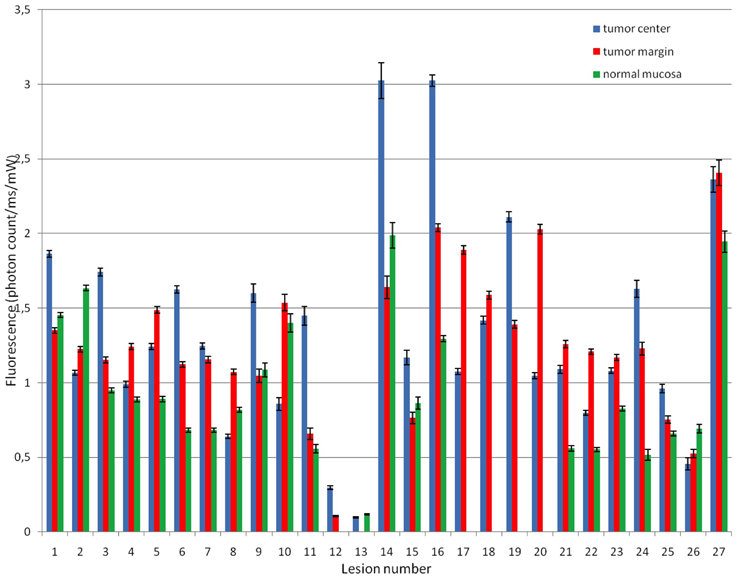
Figure 3. Fluorescence attributable to mTHPC at tumor center, margin, and normal mucosa before PDT in all measured lesions. TC had average 1.50 times more fluorescence than NM but with a high standard deviation (0.66). It can be seen that in some cases NM has more fluorescence than TC.
Photobleaching of mTHPC
The hypothesized reaction is a decrease in fluorescence as a result of PDT (Figure 4), referred to as photobleaching. The fluorescence after PDT at the TC ranged from 0.74 to 0.02. Taking into account the large range of fluorescence observed, we have decided to compare the fluorescence decrease (photobleaching) as a unit of percentage decrease calculated for each individual case. The mean photobleaching was 81 ± 17% with a range of 99 to 7% at TC (Figure 5). Twenty four lesions have shown the hypothesized pattern of photobleaching with decrease in fluorescence due to PDT. In addition to two lesions with very low fluorescence, one lesion has shown almost no photobleaching, with only 7% decrease in fluorescence due to PDT. The mean photobleaching of the 24 lesions with the hypothesized reaction is 85 ± 10% with a range of 99 to 66%.
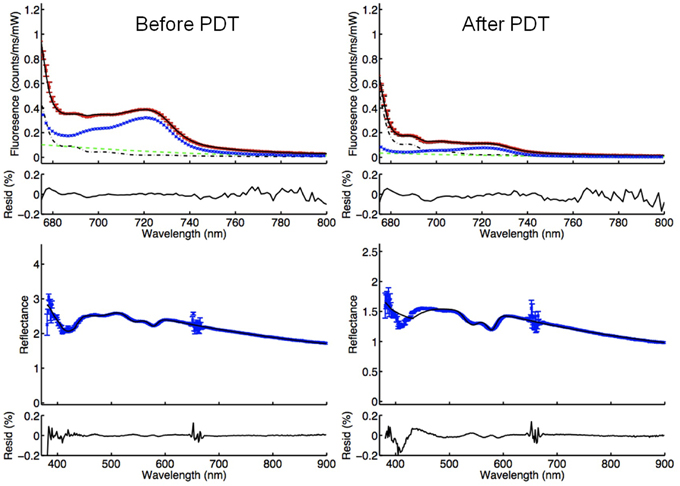
Figure 4. FDPS (above) and DPS (below) spectra measured before and after PDT, demonstrating the anticipated photobleaching. The blue line in the fluorescence spectra (above) represents the fluorescence attributable to mTHPC. It can be observed that the fluorescence peak between 700 and 740 nm wavelength decreases due to breakdown of mTHPC during PDT.
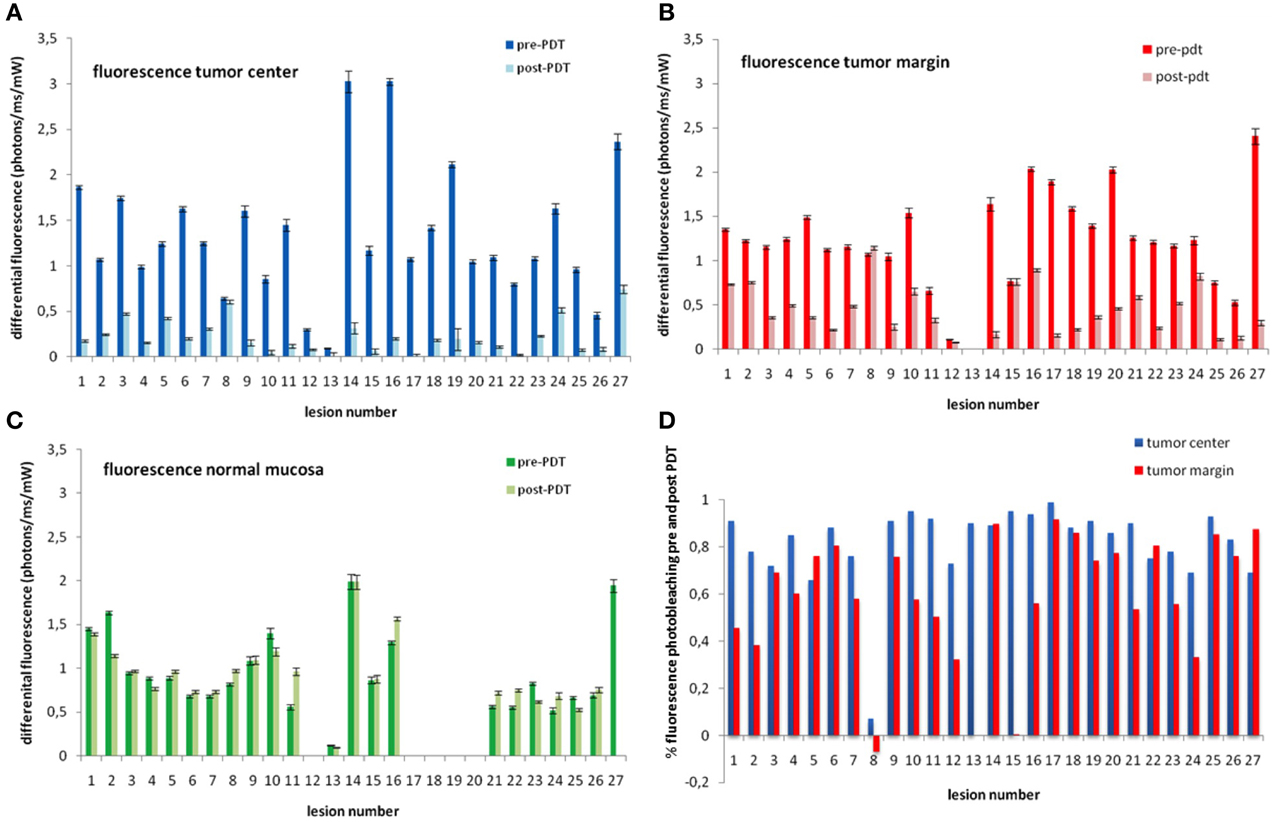
Figure 5. Average mTHPC fluorescence measured in the TC (blue bars; panel A), TM (red bars, panel B), and NM (green bars; panel C). Panel D show the percentage of mTHPC fluorescence photobleached before and after illumination at the TC (blue bars) and TM red bars. Lesions number 12 and 13 show very low fluorescence indicating low concentrations of mTHPC. Lesion number 8 shows no photobleaching (difference before and after PDT). Lesions 1, 2, 8, 15, and 24 show less than 50% photobleaching at tumor margins suggesting a geographic miss. There is no evident photobleaching in normal mucosa that did not receive PDT (panel C). Missing or data that could not be evaluated are left blank. The numbers in all three graphs correspond to the same lesion/patient.
There was somewhat less photobleaching at the TM following PDT (this was not statistically significant, p = 0.42. The mean photobleaching was 61% ± 25% with a range of 91% to -6%. The photobleaching of -6% is seen along the margins of the tumor that showed negligible photobleaching at the TC mentioned in the paragraph above (lesion 8). There are four additional photobleaching below 50% at TM (lesions 1, 2, 15, and 24) (Figure 5). There was no significant photobleaching of mTHPC observed in NM that was not illuminated. The average difference before and after PDT was −5% ± 23 at NM (Figure 5).
Differential Path-Length Spectroscopy
The weighted mean oxygen saturation was slightly lower at TC than NM, and the vessel diameter was slightly greater in TC than NM (Table 1). However, these values are not significant due to the large standard deviations. There was no detectable difference in oxygen saturation, BVF and vessel diameter before and after PDT in any of the measurement sites.
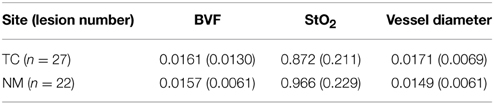
Table 1. Weighted mean (and standard deviation) blood volume fraction (BVF), oxygen saturation (StO2), and Dv blood vessel diameter of TC and NM before.
Correlation of Spectroscopic Measurements with Clinical Results
Out of 27 treated tumors eight had incomplete response or early recurrence (lesions 1, 8, 12, 13, 22, 23, 25, 27). When the spectroscopy data was analyzed three types of possible reasons of failure were identified for four of the lesions treated (lesions 1, 8, 12, 13).
(a) Insufficient photosensitizer content in the tumor: Significantly low fluorescence was measured in two treated lesions. Lesion number 12 had fluorescence of 0.29 and lesion number 13 had fluorescence of 0.09 compared to mean fluorescence of 1.33 before PDT at TC. Such low values suggest absence of the photosensitizer in the treated lesions. Both tumors (in two patients) had no response to PDT (Figure 5). In Figure 6, examples of DPS and FDPS spectra of lesion 12, before and after PDT can be seen. There was no detectable difference in the fluorescence peaks before and after PDT.
(b) Insufficient photobleaching: Lesion number 8 showed no change in fluorescence before and after PDT (0.64 vs. 0.60) at TC (Figure 5). This patient had bleeding and hematoma formation during PDT which was also detectable with some reflectance spectra with a very high BVF. Figure 7 shows DPS and FDPS spectra before and after PDT. It can be seen that the fluorescence peaks does not change as a result of PDT. The absorption bands of hemoglobin are deep indicating considerable blood content in the interrogated tissue. Hemoglobin can absorb treatment light, acting as a filter, preventing light to reach the tumor (Figure 7).
(c) Geographical miss/insufficient treatment to margins: Lesion number 1, 2, 8, 15, and 24 showed less than 50% decrease in fluorescence in the treatment margins (TM) with PDT. Of these lesions number 8 had also insufficient photobleaching at the center of the lesion (Figure 5). The others had good photobleaching at TC. Lesion number 1 had good response to PDT but local recurrence within 2 months after treatment. The other lesions had complete sustainable response to PDT.
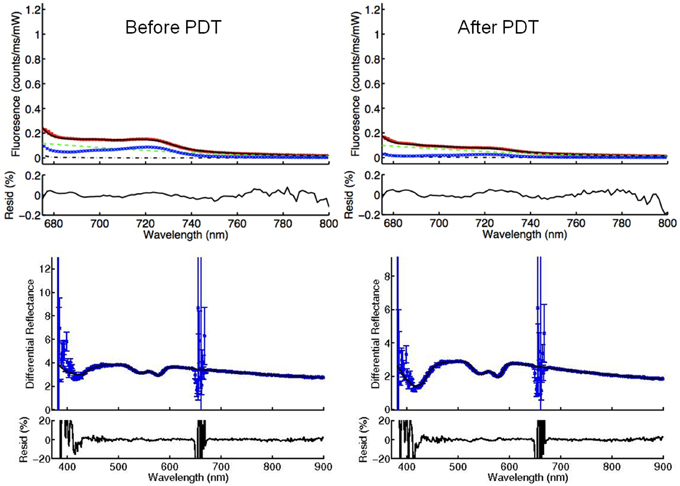
Figure 6. FDPS (above) and DPS (below) spectra of lesion 12 before and after PDT. The blue lines in FDPS spectra are almost flat, indicating very small concentrations of mTHPC in the TC, both before and after PDT.
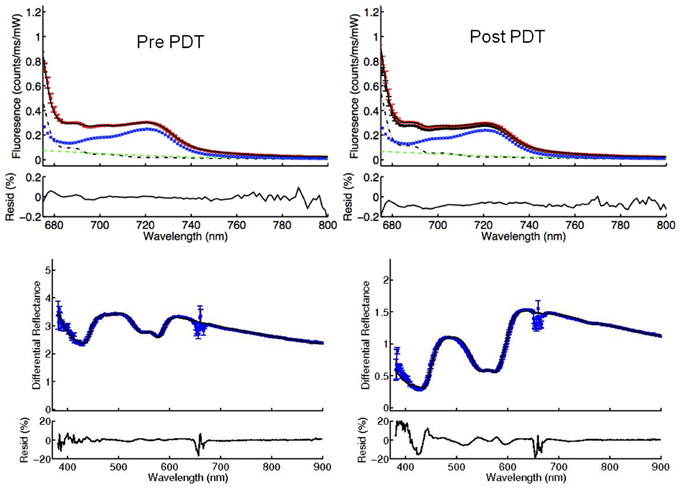
Figure 7. FDPS (above) and DPS (below) spectra of lesion 8, before and after PDT, demonstrating nsufficient (absent) photobleaching. As evident in the FDPS spectra (above), there is no decrease in fluorescence attributable to mTHPC (blue lines), after PDT. This can be explained by the filtering effect of excessive blood in the treated tissue. The presence of excessive blood can be observed in the reflectance spectrum post PDT (below). The absorbance peaks of hemoglobin between 500 and 650 nm post PDT are much deeper compared to pre PDT.
Collating fluorescence and blood physiology data from all lesion sites (TC and TM) we were unable to find any correlation between the physiological parameters (DVF and blood saturation) and the extent of mTHPC photobleaching induced by the treatment. Apart from dramatic increase in the optical properties of the illuminated volume in example b, described above, we did not find any correlation between BVF and StO2 and lesion response. It is important to note that four lesions (22, 23, 25, 27) showed an incomplete response for reasons that we were unable to determine using superficial FDPS as it was applied in the present study. Potential reasons for the lack of complete correlation between optical parameters and in-complete response are presented in our discussion.
Discussion
The results of our study showed that it was possible to incorporate optical measurements without compromising the clinical flow of PDT in the oral cavity. FDPS spectra were successfully acquired in 78% of measurements. In the remaining subset of measurements spectra were not able to be analyzed due to improper contact between the probe and the lesion or the contralateral NM. This kind of aberrant data are easily recognizable by inspecting the residual between the component basis spectra and the data. Measurements with a very low BVF (below 0.03%) were excluded from reflectance analysis and the determination of physiological parameters, because they introduced large errors, in particular to the determination of the blood saturation and vessel diameter. However, these reflectance measurements were retained for the determination of absorption corrected fluorescence and were included in our analysis of fluorescence. Measurements with an excessively high blood volume (above 50%) were not included in our fluorescence analysis because this BVF is only possible in the presence of free blood. In this case reflectance measurements were used to either inform the repetition of FDPS measurements after the removal of free blood or to note the presence of blood that may have shielded the therapeutic illumination volume. The fluorescence attributable to mTHPC showed a (very) large patient to patient variation. However, the measured values were comparable and consistent among the measurements performed in the same patient/lesion. We therefore conclude that these large variations are due to real variations in photosensitizer concentration in individual patients. Measurement of consistent values of fluorescence in unilluminated NM before and after PDT supported this observation. These variations in mTHPC fluorescence present in the target tissue, immediately prior to the therapeutic illumination, are in spite of the fact that the administered mTHPc dose and drug light interval are the same for each patient. This variability could be caused by variations in drug metabolism and pharmacokinetics from patient to patient. Kiesslich et al have reported variations in mTHPC uptake in a series of colangiocarcinoma cell-lines [26] and the variations that we observe in the present clinical study may be influenced by the cell biology of the lesions under investigation, with some tumor cell populations taking-up and retaining more mTHPC than others. Indeed Mitra et al. have previously reported heterogenous distribution of mTHPC in murine cancer models [27]. We did not observe significant spatial variations in our measurements which were repeated at the center or margin of superficial tumors. It is probable that the size of our optical probe was large enough to average out the micro-/mesoscopic variations in mTHPC distribution. Given the wide variation in measured mTHPC concentration it is remarkable that we observed almost no uptake of mTHPC in the TC, TM or in the contralateral NM in two patients. These measurements could have been the lower range of the variation observed in fluorescence. However, both of the lesions exhibited none of the usual responses immediately following PDT, such as edema, pain, or sloughing of the mucosa. These tumors were unaffected by the therapeutic illumination. Taken in isolation it is rather speculative to use FDPS data from the tumor and NM to explain what is a concerning important clinical phenomenon. Even though each patient had the Foscan injection according to the same protocol, mTHPC failed to reach the target tissue. In addition both of the patients had second degree burns around the injection site and along the arm vein injected in the direction of the shoulder. This strongly suggests that there might have been either a leak from the vessel walls, or mTHPC was injected in the soft tissue rather than the vein. It is obviously not possible to determine the threshold lesion/NM mTHPC concentration range at which these types of practical clinical considerations should be considered. It is however clear that there is a need for additional studies to determine if problems associated with the improper injection of Foscan can be measured, preferably, prior to the patient being admitted to hospital and undergoing PDT treatment planning. Preliminary measurements, data not shown, suggest that an optical measurement at the injection site and/or in the normal oral mucosa some-time after the injection of Foscan but before the patient is admitted could be a useful tool. At the very least the clinical team should be planning for possible additional treatments such as surgery, radiotherapy or repeat PDT when this is applicable. If PDT is to be repeated the photosensitizer should not be injected at the previous injection site. Since there is probably residual extravasated photosensitizer at this site any additional injection would only increase the risk of serious adverse events.
Neglecting patients with very low systemic concentrations of mTHPC, on average, the TC contained 1.5 times more mTHPC than NM. Even in our small data set it is not evident that malignant tissue always contains more mTHPC than NM. In some patients NM contained more photosensitizer than the TC. This is despite the fact that earlier animal studies have shown higher tumor/muscle and tumor/skin concentration ratios of mTHPC [28]. This tumor selectivity is not evident when clinical tumors are compared to mucosa. Blant et al. reported have previously reported no difference in mTHPC concentration between early stage SCC and NM [29]. They were able to detect slightly higher mTHPC concentration in advanced stage SCC. Clearly it should be kept in mind that animal models do not correlate well with the distribution of mTHPC in humans [30, 31]. While the lack of tumor to normal tissue selectivity is not a limiting factor for the treatment of superficial oral lesions, where normal tissue is protected by optical shielding, the treatment of interstitial tumors surrounded by normal tissue [32] using Foscan is a well-known concern.
While the average values of the vascular parameters observed in the present study are consistent with a previous study in the oral cavity using DPS [33, 34] the variation in our parameter measurements is somewhat lager. It may be that the thickness of the avascular keratin layers is different in different patient populations. We found no specific trend of increase or decrease observed in any of the blood related parameters before and after PDT. It should be kept in mind that the data presented in this manuscript are collected from superficial tumors with excellent blood supply as opposed to tumors with larger volumes with aberrant neo-vascularization and necrotic centers. The blood supply is probably rapidly replenished after the end of the therapeutic illumination making the vascular effects of PDT undetectable.
As we have shown the incorporation of FDPS into the clinical workflow also made it possible to detect the presence of insufficient photobleaching. In one lesion almost no difference in fluorescence was observed before and after PDT. In this case there was diffuse bleeding from the lesion on the day of the illumination. Pressure with gauze was applied to stop the bleeding. When the bleeding was at manageable levels the illumination took place with frequent cleaning of the treatment surface with vacuum suction. However, this procedure was clearly insufficient. Reflectance spectroscopy detected a very large DVF, even though there appeared to be no visible blood pooling. There was probably a thin film of blood either on the surface or immediately under the mucosa. The lack of photobleaching suggests that even such an invisible layer of blood is capable of blocking the treatment light. In this patient this conclusion was also confirmed by lack of clinical response to PDT. This problem can be easily corrected during the clinical procedure. If photobleaching is not observed the therapeutic illumination can be repeated until the photobleaching is evident. Obviously while this is a clinically relevant problem, the lack of photobleaching due to optical shielding is a rather extreme cause of impaired photobleaching. It is very likely that there are important underlying photobiological reasons for a reduced rate of photobleaching and these effects need to be investigated in the larger group of patients before definitive conclusions can be drawn. An additional consideration is the potential to use fluorescence measurements to investigate the potential for a geographic miss at the safety margins leaving potentially leaving untreated extensions of the tumor that are invisible to the naked eye. It is common practice with conventional methods, such as surgery and radiation therapy, is to treat at least 5–10 mm safety margins around the visible lesion to prevent missing these extensions. Tumor recurrence is thought to be dependent on the presence or absence of malignant cells in the untreated tissue. In the small data set we have investigated in the present study one out of four lesions showed less photobleaching in the TM and exhibited a recurrence within 2 months, possibly indicating that an extension of the tumor was missed. Using optical spectroscopy it might be possible to investigate the margins for photobleaching and administer repeat illuminations if insufficient photobleaching is detected.
It was not possible for us to explain all of the PDT failures in this cohort using FDPS. A group of lesions showed incomplete response or recurrence even though substantial photobleaching was observed both at the TC and the safety margins. It is important to recognize that while FDPS represents an effective technique for correcting fluorescence for the influence of differences in optical absorption (μa) it does not fully correct for the influence of differences in scattering coefficient of tissue. Here more robust correction algorithms and approaches to quantitative spectroscopy may be more appropriate [35, 36] before a full determination of the usefulness of optical spectroscopy for monitoring PDT can be made. The present study clearly shows the potential for the incorporation of optical spectroscopy in clinical practice and that is fact that it can help the clinician overcome some preventable problems that seem to occur with concerning frequency.
Conclusions
Reflectance (DPS) and fluorescence (FDPS) spectroscopy provide an insight into the working mechanism underlying PDT, by providing data on physiology related parameters and the measurement of photosensitizer fluorescence. By incorporating FDPS into clinic it might be possible to detect clinical problems, such as insufficient photosensitizer concentration or lack of photobleaching in the target tissues. Furthermore, FDPS can be used to investigate the treatment volume for sub-optimally treated areas. The present study clearly shows the potential for the incorporation of optical spectroscopy in clinical practice and that it can help the clinician overcome the challenges during treatment planning.
Conflict of Interest Statement
The authors declare that the research was conducted in the absence of any commercial or financial relationships that could be construed as a potential conflict of interest.
References
1. Henderson BW Dougherty TJ. How does photodynamic therapy work? Photochem Photobiol. (1992) 55:145–57. doi: 10.1111/j.1751-1097.1992.tb04222.x
PubMed Abstract | Full Text | CrossRef Full Text | Google Scholar
2. Mroz P, Hashmi JT, Huang YY, Lange N, Hamblin MR. Stimulation of anti-tumor immunity by photodynamic therapy. Expert Rev Clin Immunol. (2011) 7:75–91. doi: 10.1586/eci.10.81
PubMed Abstract | Full Text | CrossRef Full Text | Google Scholar
3. Garg AD, Nowis D, Golab J Agostinis P. Photodynamic therapy: illuminating the road from cell death towards anti-tumour immunity. Apoptosis (2010) 15:1050–71. doi: 10.1007/s10495-010-0479-7
PubMed Abstract | Full Text | CrossRef Full Text | Google Scholar
4. Fan KF, Hopper C, Speight PM, Buonaccorsi GA, Bown SG. Photodynamic therapy using mTHPC for malignant disease in the oral cavity. Int J Cancer (1997) 73:25–32. doi: 10.1002/(SICI)1097-0215(19970926)73:1<25::AID-IJC5>3.0.CO;2-3
PubMed Abstract | Full Text | CrossRef Full Text | Google Scholar
5. Kubler AC, de Carpentier J, Hopper C, Leonard AG, Putnam G. Treatment of squamous cell carcinoma of the lip using Foscan-mediated photodynamic therapy. Int J Oral Maxillofac Surg. (2001) 30:504–9. doi: 10.1054/ijom.2001.0160
PubMed Abstract | Full Text | CrossRef Full Text | Google Scholar
6. Copper MP, Tan IB, Oppelaar H, Ruevekamp MC, Stewart FA. Meta-tetra(hydroxyphenyl)chlorin photodynamic therapy in early-stage squamous cell carcinoma of the head and neck. Arch Otolaryngol Head Neck Surg. (2003) 129:709–11. doi: 10.1001/archotol.129.7.709
PubMed Abstract | Full Text | CrossRef Full Text | Google Scholar
7. Jerjes W, Upile T, Hamdoon Z, Alexander Mosse C, Morcos M, Hopper C. Photodynamic therapy outcome for T1/T2 N0 oral squamous cell carcinoma. Lasers Surg Med. (2011) 43:463–9. doi: 10.1002/lsm.21071
PubMed Abstract | Full Text | CrossRef Full Text | Google Scholar
8. Hopper C, Kubler A, Lewis H, Tan IB, Putnam G. mTHPC-mediated photodynamic therapy for early oral squamous cell carcinoma. Int J Cancer (2004) 111:138–46. doi: 10.1002/ijc.20209
PubMed Abstract | Full Text | CrossRef Full Text | Google Scholar
9. D'Cruz AK, Robinson MH, Biel MA. mTHPC-mediated photodynamic therapy in patients with advanced, incurable head and neck cancer: a multicenter study of 128 patients. Head Neck (2004) 26:232–40. doi: 10.1002/hed.10372
PubMed Abstract | Full Text | CrossRef Full Text | Google Scholar
10. Lorenz KJ, Maier H. Photodynamic therapy with meta-tetrahydroxyphenylchlorin (Foscan®)in the management of squamous cell carcinoma of the head and neck: experience with 35 patients. Eur Arch Otorhinolaryngol. (2009) 266:1937–44. doi: 10.1007/s00405-009-0947-2
PubMed Abstract | Full Text | CrossRef Full Text | Google Scholar
11. Karakullukcu B, van Oudenaarde K, Copper MP, Klop WM van Veen R, Wildeman M, et al. Photodynamic therapy of early stage oral cavity and oropharynx neoplasms: an outcome analysis of 170 patients. Eur Arch Otorhinolaryngol. (2011) 268:281–8. doi: 10.1007/s00405-010-1361-5
PubMed Abstract | Full Text | CrossRef Full Text | Google Scholar
12. Tan IB, Dolivet G, Ceruse P, Vander Poorten V, Roest G, Rauschning W. Temoporfin-mediated photodynamic therapy in patients with advanced, incurable head and neck cancer: a multicenter study. Head Neck (2010) 32:1597–604. doi: 10.1002/hed.21368
PubMed Abstract | Full Text | CrossRef Full Text | Google Scholar
13. Foote CS. Definition of type I and type II photosensitized oxidation. Photochem Photobiol. (1991) 54:659. doi: 10.1111/j.1751-1097.1991.tb02071.x
PubMed Abstract | Full Text | CrossRef Full Text | Google Scholar
14. Dysart JS, Patterson MS. Characterization of Photofrin photobleaching for singlet oxygen dose estimation during photodynamic therapy of MLL cells in vitro. Phys Med Biol. (2005) 50:2597–616. doi: 10.1088/0031-9155/50/11/011
PubMed Abstract | Full Text | CrossRef Full Text | Google Scholar
15. Glanzmann T, Hadjur C, Zellweger M, Grosiean P, Forrer M, Ballini JP, et al. Pharmacokinetics of tetra(m-hydroxyphenyl)chlorin in human plasma and individualized light dosimetry in photodynamic therapy. Photochem Photobiol. (1998) 67:596–602. doi: 10.1111/j.1751-1097.1998.tb09099.x
PubMed Abstract | Full Text | CrossRef Full Text | Google Scholar
16. Amelink A, van den Heuvel A, de Wolf WJ, Robinson DJ, Sterenborg HJCM. Monitoring PDT by means of superficial reflectance spectroscopy. J. Photochem. Photobiol. B (2005) 79:243–51. doi: 10.1016/j.jphotobiol.2005.01.006
PubMed Abstract | Full Text | CrossRef Full Text | Google Scholar
17. Zhu TC, Dimofte A, Finlay JC, Stripp D, Busch T, Miles J, et al. Optical properties of human prostate at 732 nm measured in mediated photodynamic therapy. Photochem Photobiol. (2005) 81:96–105. doi: 10.1562/2004-06-25-RA-216.1
PubMed Abstract | Full Text | CrossRef Full Text | Google Scholar
18. Busch TM. Local physiological changes during photodynamic therapy. Lasers Surg Med. (2006) 38:494–9. doi: 10.1002/lsm.20355
PubMed Abstract | Full Text | CrossRef Full Text | Google Scholar
19. Dysart JS, Patterson MS, Farrell TJ, Singh G. Relationship between mTHPC fluorescence photobleaching and cell viability during in vitro photodynamic treatment of DP16 cells. Photochem Photobiol. (2002) 75:289–95. doi: 10.1562/0031-8655(2002)075<0289:RBMFPA>2.0.CO;2
PubMed Abstract | Full Text | CrossRef Full Text | Google Scholar
20. Finlay JC, Mitra S, Foster TH. In-vivo mTHPC photobleaching in normal rat skin exhibits unique irradiance-dependent features. Photochem Photobiol. (2002) 75:282–8. doi: 10.1562/0031-8655(2002)075<0282:IVMPIN>2.0.CO;2
PubMed Abstract | Full Text | CrossRef Full Text | Google Scholar
21. Robinson DJ, de Bruijn HS, van der Veen N, Stringer MR, Brown SB, Star WM. Fluorescence photobleaching of ALA induced protoporphyrin IX during photodynamic therapy of normal hairless mouse skin: the effect of light dose and irradiance and the resulting biological effect. Photochem Photobiol. (1998) 67:141–9. doi: 10.1111/j.1751-1097.1998.tb05177.x
PubMed Abstract | Full Text | CrossRef Full Text | Google Scholar
22. Amelink A, Sterenborg HJCM. Measurement of the local optical properties of turbid media using differential pathlength spectroscopy. Appl Opt. (2004) 43:3048–54. doi: 10.1364/AO.43.003048
PubMed Abstract | Full Text | CrossRef Full Text | Google Scholar
23. Amelink A, Kruijt B, Robinson DJ, Sterenborg HJ. Quantitative fluorescence spectroscopy in turbid media using fluorescence differential path length spectroscopy. J Biomed Opt. (2008) 13:51–4. doi: 10.1117/1.2992132
PubMed Abstract | Full Text | CrossRef Full Text | Google Scholar
24. Woodhams JH, Macrobert AJ, Bown SG. The role of oxygen monitoring during photodynamic therapy and its potential for treatment dosimetry. Photochem Photobiol Sci. (2007) 6:1246–56. doi: 10.1039/b709644e
PubMed Abstract | Full Text | CrossRef Full Text | Google Scholar
25. Karakullukcu B, Kanick SC, Aans JB, Sterenborg HJ, Tan IB, Amelink A, et al. Clinical feasibility of monitoring m-THPC mediated photodynamic therapy by means of fluorescence differential path-length spectroscopy. J Biophotonics (2011) 4:740–51. doi: 10.1002/jbio.201100051
PubMed Abstract | Full Text | CrossRef Full Text | Google Scholar
26. Kiesslich T, Neureiter D, Alinger B, Jansky GL, Berlanda J, Mkrtchyan V, et al. Uptake and phototoxicity of meso-tetrahydroxyphenyl chlorine are highly variable in human biliary tract cancer cell lines and correlate with markers of differentiation and proliferation. Photochem Photobiol Sci. (2010) 9:734–43. doi: 10.1039/b9pp00201d
PubMed Abstract | Full Text | CrossRef Full Text | Google Scholar
27. Mitra S, Maugain E, Bolotine L, Guillemin F, Foster TH. Temporally and spatially heterogeneous distribution of mTHPC in a murine tumor observed by two-color confocal fluorescence imaging and spectroscopy in a whole-mount model. Photochem Photobiol. (2005) 81:1123–30. doi: 10.1562/2005-03-24-RA-471
PubMed Abstract | Full Text | CrossRef Full Text | Google Scholar
28. Jones HJ, Vernon DI, Brown SB. Photodynamic therapy effect of m-THPC (Foscan) in vivo: correlation with pharmacokinetics. Br J Cancer (2003) 89:398–404. doi: 10.1038/sj.bjc.6601101
PubMed Abstract | Full Text | CrossRef Full Text | Google Scholar
29. Blant SA, Glanzmann TM, Ballini JP, Wagnières G, van den Bergh H, Monnier P. Uptake and localisation of mTHPC (Foscan) and its 14C-labelled form in normal and tumour tissues of the hamster squamous cell carcinoma model: a comparative study. Br J Cancer (2002) 87:1470–8. doi: 10.1038/sj.bjc.6600651
PubMed Abstract | Full Text | CrossRef Full Text | Google Scholar
30. Ronn AM, Batti J, Lee CJ, Yoo D, Siegel ME, Nouri M, et al. Comparative biodistribution of meta-Tetra(Hydroxyphenyl) chlorin in multiple species: clinical implications for photodynamic therapy. Lasers Surg Med. (1997) 20:437–42. doi: 10.1002/(SICI)1096-9101(1997)20:4<437::AID-LSM10>3.0.CO;2-8
PubMed Abstract | Full Text | CrossRef Full Text | Google Scholar
31. Glanzmann T, Forrer M, Blant SA, Woodtli A, Grosjean P, Braichotte D, et al. Pharmacokinetics and pharmacodynamics of tetra(m-hydroxyphenyl)chlorin in the hamster cheek pouch tumor model: comparison with clinical measurements. J Photochem Photobiol B (2000) 57:22–32. doi: 10.1016/S1011-1344(00)00069-5
PubMed Abstract | Full Text | CrossRef Full Text | Google Scholar
32. Karakullukcu B, van Veen RL, Aans JB, Hamming-Vrieze O, Navran A, Teertstra HJ, et al. MR and CT based treatment planning for mTHPC mediated interstitial photodynamic therapy of head and neck cancer: description of the method. Lasers Surg Med. (2013) 45:517–23. doi: 10.1002/lsm.22174
PubMed Abstract | Full Text | CrossRef Full Text | Google Scholar
33. Amelink A, Sterenborg HJ, Roodenburg JL, Witjes MJ. Non-invasive measurement of the microvascular properties of non-dysplastic and dysplastic oral leukoplakias by use of optical spectroscopy. Oral Oncol. (2011) 47:1165–70. doi: 10.1016/j.oraloncology.2011.08.014
PubMed Abstract | Full Text | CrossRef Full Text | Google Scholar
34. Amelink A, Kaspers OP, Sterenborg HJCM, van der Wal JE, Roodenburg JLN, Witjes MJH. Non-invasive measurement of the morphology and physiology of oral mucosa by use of optical spectroscopy. Oral Oncol. (2008) 44:65–71. doi: 10.1016/j.oraloncology.2006.12.011
PubMed Abstract | Full Text | CrossRef Full Text | Google Scholar
35. Gamm UA, Hoy CL, van Leeuwen-van Zaane F, Sterenborg HJ, Kanick SC, Robinson DJ, et al. Extraction of intrinsic fluorescence from single fiber fluorescence measurements on a turbid medium: experimental validation. Biomed Opt Express (2014) 5:1913–25. doi: 10.1364/BOE.5.001913
PubMed Abstract | Full Text | CrossRef Full Text | Google Scholar
36. van Leeuwen-van Zaane F, Gamm UA, van Driel PB, Snoeks TJ, de Bruijn HS, van der Ploeg-van den Heuvel A, et al. Intrinsic photosensitizer fluorescence measured using multi-diameter single-fiber spectroscopy in vivo. J Biomed Opt. (2014) 19:15010. doi: 10.1117/1.JBO.19.1.015010
PubMed Abstract | Full Text | CrossRef Full Text | Google Scholar
Keywords: doismetry, meta-tetrahydroxyphenylchlorin, optics, pharmacokinetics, personaliszed
Citation: Karakullukcu B, Kanick SC, Aans JB, Sterenborg HJCM, Tan IB, Amelink A and Robinson DJ (2015) Integration of fluorescence differential path-length spectroscopy to photodynamic therapy of the head and neck tumors is useful in monitoring clinical outcome. Front. Phys. 3:20. doi: 10.3389/fphy.2015.00020
Received: 07 November 2014; Accepted: 14 March 2015;
Published: 01 April 2015.
Edited by:
Ulas Sunar, University at Buffalo, USAReviewed by:
Banghe Zhu, University of Texas Health Science Center at Houston, USANarasimhan Rajaram, University of Arkansas, USA
Copyright © 2015 Karakullukcu, Kanick, Aans, Sterenborg, Tan, Amelink and Robinson. This is an open-access article distributed under the terms of the Creative Commons Attribution License (CC BY). The use, distribution or reproduction in other forums is permitted, provided the original author(s) or licensor are credited and that the original publication in this journal is cited, in accordance with accepted academic practice. No use, distribution or reproduction is permitted which does not comply with these terms.
*Correspondence: Dominic J. Robinson, Department of Otolaryngology and Head and Neck Surgery, Center for Optical Diagnostics and Therapy, Erasmus University Medical Center, PO Box 2040, 3000 CA, Rotterdam, Netherlands d.robinson@erasmusmc.nl