The Electronic Behavior of Zinc-Finger Protein Binding Sites in the Context of the DNA Extended Ladder Model
 Nestor N. Oiwa
 Claudette E. Cordeiro
 Dieter W. Heermann
- 1Department of Basic Science, Universidade Federal Fluminense, Nova Friburgo, Brazil
- 2Institute for Theoretical Physics, Heidelberg University, Heidelberg, Germany
- 3Department of Physics, Universidade Federal Fluminense, Niterói, Brazil
Instead of ATCG letter alignments, typically used in bioinformatics, we propose a new alignment method using the probability distribution function of the bottom of the occupied molecular orbital (BOMO), highest occupied molecular orbital (HOMO), and lowest unoccupied orbital (LUMO). We apply the technique to transcription factors with Cys2His2 zinc fingers. These transcription factors search for binding sites, probing for the electronic patterns at the minor and major DNA groves. The eukaryotic Cys2His2 zinc finger proteins bind to DNA ubiquitously at highly conserved domains. They are responsible for gene regulation and the spatial organization of DNA. To study and understand these zinc finger DNA-protein interactions, we use the extended ladder in the DNA model proposed by Zhu et al. [1]. Considering one single spinless electron in each nucleotide π-orbital along a double DNA chain (dDNA), we find a typical pattern for the bottom of BOMO, HOMO, and LUMO along the binding sites. We specifically looked at two members of zinc finger protein family: specificity protein 1 (SP1) and early grown response 1 transcription factors (EGR1). When the valence band is filled, we find electrons in the purines along the nucleotide sequence, compatible with the electric charges of the binding amino acids in SP1 and EGR1 zinc finger.
Introduction
Nucleotide alignments are the standard method for spotting the DNA-protein binding sites along the genome. However, transcription factors do not identify nucleotides, but probe the dDNA surface, searching for the π-orbital electronic patterns. In this work, we develop the concept of the electronic alignment using one of the major eukaryotic DNA-protein binding motifs, which are those related to zinc fingers (ZF). ZFs form a key protein family for the chromatin condensation as well as the gene regulation. There are around one thousand ZF encoding genes [2] and ten thousands highly conserved putative ZF binding sites along the human genome [3, 4]. The majority of ZF proteins assist transcription factors, acting as repressors, activators and regulators [2, 5]. They are responsible for the genome special structure in the DNA loops too, exposing or hiding the genes, and work as an insulator, avoiding the spread of heterochromatin [6]. These ZF proteins could mediate long-range chromosomal interactions in eukaryotic cells, >100 thousand base pair (bp) [7–10]. However, the exact relation between the long-ranged correlation in genomic scale nucleotide sequences (>20 thousand bp) and the chromosomal three-dimensional organization is still not clear [10–15] and subject to intense research. Furthermore, since transcription factors spot specific sequences without the opening of the double helix, we expect some biological mechanism for probing nucleotide based on local properties [16]. To understand this there are two basic approaches: a polymeric description and by electric charges. The most common polymeric description considers DNA as a single one-dimensional strand, explaining the DNA denaturation semi-analytically [17–19]. The literature also report the mechanical properties of chromosomal fibers and the long-range nucleotide interaction due to DNA loops, histones and zinc finger proteins, using Monte Carlo simulation [10, 20–22]. Since electrons play a crucial role in the DNA-protein interaction, we must consider the DNA from the electric charge distribution too. The electronic nature of DNA is still under debate. The double helices behave as insulators or conductors under silver deposition [23], material contaminants [24, 25] and others environmental conditions [26]. However, when the conductivity is measured in atmosphere, low vacuum or Tris-HCl buffers, DNA has semiconductor features with the typical gap between the valence and conductor band in the electronic density of states (DOS) [26–31]. In order to describe this behavior, ionization models (also known as ballistic, polaron, or wire-like charge transport) have been proposed [32–36]. The parameters in the ionization models are easily measured, since one just needs to evaluate the loss of energy when we take one electron in a neutral molecule. The lost electron is usually in the highest occupied molecular orbital valence band (HOMO) and it may easily jump to the lowest unoccupied molecular orbital in the conductor band (LUMO). But, the literature also suggests electronic affinity models, where the energy is described by the gain of electrons in neutral molecules [37–41]. These theoretical results usually combine density functional theory and molecular dynamic simulation.
In 2007 Zhu et al. joined both molecular ionization and affinity approaches [1]. This adaptation of the Peyra-Bishop DNA melting model [17] describes the nucleotide sequence from their semi-conductor features, avoiding the heavy computational cost of ab initio molecular dynamical simulations. Their work allowed to spot electronic local density of states (LDOS) in one viral P5 promoter sequence, connecting LDOS with one specific biological function [1, 16]. Unfortunately, they did not search methodically for patterns in many sequences. Neither they did look for the gap between HOMO and LUMO in (C)n as one expects from the experimental data [30, 42].
Our work begins at this point. We fix the problem of the HOMO-LUMO gap in the model of Zhu et al. introducing the extended ladder in the model as suggested by Senthilkumar et al. [36, 43–45]. We consider the π-orbital of the nucleotide in our model instead of the interstrand hydrogen bond between base pair as Zhu et al. [1]. We also analyze systematically the DNA-protein binding sites for two transcription factor proteins: the human specificity protein transcription factor 1 (SP1) [46] and early grown response factor (EGR1, aka Zif268) [47], both localized in the promoter of a great variety of genes and characterized by a molecular structure called Cys2His2 zinc finger (ZF). The descriptions of ZFs as well as SP1 and EGR1 are in the Appendix of Supplementary Material. Finally, we report an electronic distribution pattern for SP1 and EGR1 binding sites. The reported motifs do not use scores, weighting the nucleotide sequence similarity as in bioinformatics [48], but they present the resemblance of the electronic cloud position between the nucleotide sequences.
The paper is organized as follows. First, we discuss the selection criteria of GenBank files and procedure for nucleotide alignments in the section material. Then, we describe the extended ladder model as a method for computing the electronic clouds associated with nucleotides. We test the model, studying the electronic behavior of (C)n and (T)n sequences. After this, we analyze systematically the SP1 and EGR1 binding sequences and report strand dependence and independence (see Section Results and Discussion).
Materials
We use the DNA sequence from the human reference map, annotation release 106 (build GRCh38/hg38) [49]. The criteria for selecting the binding sites in this work are as follows. The binding sites must have experimental confirmation in vitro. We remark that we usually observe many single nucleotide polymorphisms (SNPs) between the reference map and the reported experimental samples, because the reference map is basically a consensus sequence from nine individuals [50] while the samples in experimental binding site data belongs to one individual. Nested binding sites are a common occurrence, but we try to avoid overlapped binding sites in order to simplify the search for an electronic motif. The binding site of the transcription factors is in the promoter, a region between 500 and 2000 bp distant from the beginning of the gene. We spot similar SP1 and EGR1 binding sites, TATA box and other structures reported in individual samples in the GenBank reference map as well as in databanks as in the Eukaryotic Promoter Database for SP1 and EGR1 [51–53]. Finally, we use the nucleotides sequences in FASTA and GenBank flat file format, since the nucleotides are just nucleotides with the phosphate group.
We select 16 binding sites in 10 different genes, see Table 2. Details about the selected files are in the Appendix of Supplementary Material.
The Method: The Extended Ladder DNA Model
In this paper, we consider one double DNA chain with n base pairs, totaling 2n nucleotides, Figure 1D. In reality our model does not consider nucleotides, but nucleosides, i.e., the nucleotide with the phosphate group. However, we call nucleosides nucleotides in this work in order to simplify the nomenclature. The electronic behavior of the spinless free electron of the π-orbital of the nucleotide is given by the same Hamiltonian as in Zhu et al. [1],
This Hamiltonian combines elements from the Peyra-Bishop DNA melting [17] and charge transport models [32–36]. The first term in Equation (1) is given by,
where and Ci are the electron creation and annihilation operators at site i, ϵi is the on-site ionization energy, n is the number of nucleotides and tij is the electron hopping rate between nucleotides i and j. Here, we are using the extended ladder, where we duplicate the one dimensional lattice in Zhu et al. [1] and include the interstrand hopping, Table 1 [36, 43, 45]. The structure of the ladder considers the long-distance charge and hole transport along dDNA [43, 54–56] The second term in Equation (1) represents the coupling between the free electron and the nucleotide displacement field,
where yi is the displacement (dark dotted line) of the electronic cloud from the equilibrium in the nucleotide (light dotted line), Figure 1D. The last term Hb represents the interaction of the electron with the nucleotide:
where Di and ai are parameters of the Morse potential, kv is the spring constant of the anharmonic interaction between two contiguous base-pairs. ρ and α are the parameters for modifying kv in order to evaluate long-range cooperative electronic behavior [1].
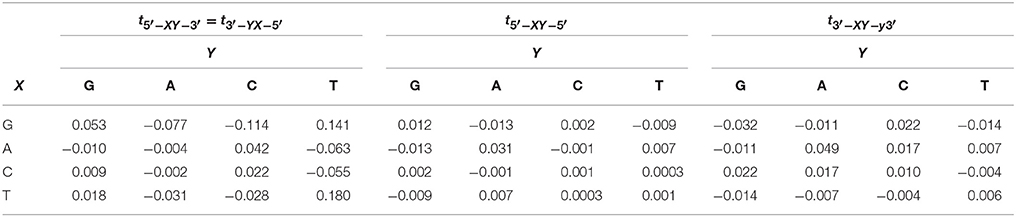
Table 1. Hopping rates in eV for the extended ladder model reported in Sarmento et al. [36], Senthilkumar et al. [43], Zilly et al. [45].
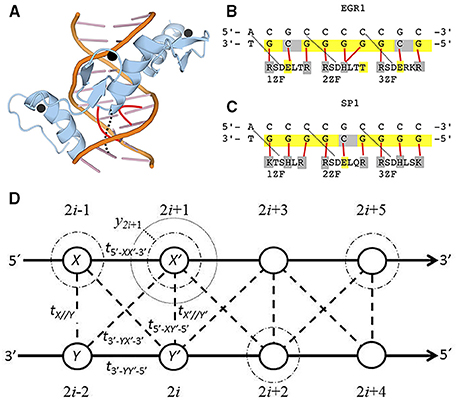
Figure 1. (A) Spatial structure of the three zinc fingers of EGR1 (blue) embracing the DNA major grove (orange). The zinc ions are in black and the DNA-protein bindings of the second zinc finger are in red. (B,C) are the DNA binding sites and amino acid sequence for the three zinc fingers of EGR1 [67] and SP1 [5] (1ZF to 3ZF). Solid red lines indicate the binding between one particular nucleotide and its correspondent amino acid. The dotted black lines in (A–C) are hydrogen bonds that stabilize the first G-R or G-K bonds in each zinc finger. When the valence band is filled, ne = n, the nucleotides in yellow are those with 100 % probability of electronic presence, while the holes are in gray. The negative charged amino acids with weak (threonine, T) or strong acid property (glutamic acid, E) are indicated in yellow too. The positive charged basic argine (R), histidine (H), and lysine (K) as well as protein-binding cytosines are indicated in gray. (D) The diagram for the DNA extended ladder model. The light dotted line is the electronic equilibrium radius for the Morse potential. The dark dotted lines is the field displacement yi. The dashed-dotted are the purines (adenine and guanine) electronic clouds with ni = 1.0 and ne = n. The dashed lines are the interstrand electronic hopping. The solid lines are the sugar phosphate backbones.
We study the electronic part He and Heb of the Hamiltonian in Equation (1) computing the eigenvalue Ek and eigenvectors , i, k = 1, …, 2n, of the matrix
This matrix is similar to the one suggested in Sarmento et al. [36, 45], except for the electron base component Heb.
In order to estimate yi, we consider the self-consistency condition, given by
where < … > represent the average over the free electrons in the system. The iteration method for solving Equations (5) and (6) is described in Zhu et al. [1], and it consists of the follow procedure. Given a initial condition for {yi}, we diagonalize the matrix in Equation (7) in order to compute the electronic occupation in each site < ni>, where and ne is the number of electrons in the system. This set of < ni > will be used in the Langevin equation calculated from Equation (6). We update the values of {yi}, using fourth-order Runger-Kutta method for the Langevin equation. The new {yi} set is inserted again in the matrix of Equation (5). We repeat the iteration until we achieve the minimum local adiabatic electronic and structural configuration. The computations were done using R with the package deSolve for the Runger-Kutta algorithm [57]. The choices of the model parameters are in the Appendix of Supplementary Material.
In this work, we estimate the spatial distribution of electrons, energy level and displacement field only considering ne = n. Thus, the valence band is always filled with electrons and the conductor band is empty. Our model does not have periodic boundary condition. Hence, the selected regions for our analysis must be large in order to avoid boundary effects. We analyze only nucleotide sequences with a distance of at least 10 bp from the beginning to the end of the sample.
We apply the proposed model in poly(C)-poly(G) and poly(T)-poly(A) sequences with 63 base pairs in order to understand the behavior of the electrons dispersed along the DNA chain.
According to Mehrez and Anantram [36, 44, 45, 58], we do expect a gap in the energy band in the test sequences (C)63 and (T)63 as can be seen in Figure 2A. Although we do not show in this work, our reproduction of the Zhu et al. computation confirms the gap for (T)63 sequence [1]. But, we do not find the gap in (C)63 applying their approach. The gap in (C)63 is absent in their model, because they consider the interstrand hydrogen bonds instead of π-orbitals. Returning to our results, the gap between the valence and conductor band in (T)63 is narrower than in (C)63. Furthermore, the gap of the pure (C)63 sequence can be modulated, when we introduce one single T in the position 32. One HOMO and LUMO appear in the gap of the energy band, marked as H and L in Figure 2D. Moreover, the HOMO and LUMO electronic cloud, dispersed in pure (C)63, black lines in Figures 2B,E), becomes localized in the introduced T (red lines in Figures 2B,E). We notice that the electronic cloud of HOMO is dispersed in a pure (C)63. Thus, thymines and adenines are related with LUMOs and cytosine and guanin are linked with the localization of the bottom of occupied molecular orbital (BOMO).
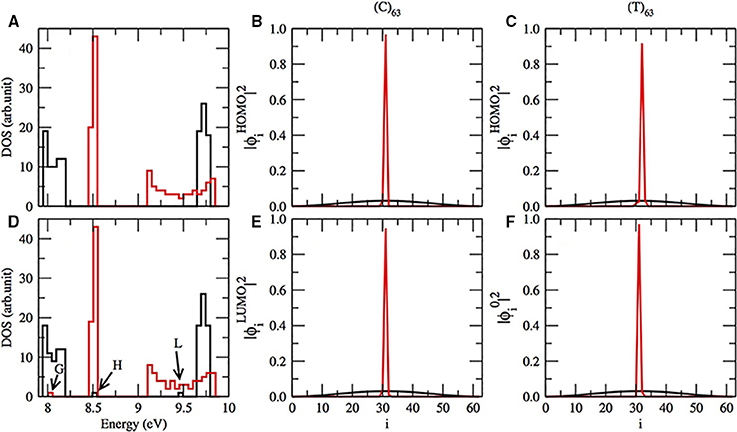
Figure 2. (A) The electronic density of states (DOS) for (C)63 in black lines and (T)63 in red lines. (D) Same as in (A), except that the sequence has one C or T in i = 32. In (D) BOMO for (T)63 with one replaced C in the position 32 is pointed as G, and the HOMO and LUMO energetic level for (C)63 with T in i = 32 are respectively indicated by H and L. The electronic cloud for HOMO (B) and LUMO (E) for (C)63 (black lines) and the same sequence with T in i = 32 (red lines). The electronic cloud for HOMO (C) and BOMO (F) for (T)63 (black lines) and the same sequence with C in position 32 (red lines).
On the other hand, when we substitute one thymine by cytosine in a (T)63, the HOMO electronic cloud will be localized in the replaced nucleotide, Figure 2C. Moreover, the eigenvalue related to this electronic state remains in the valence band with values 8.05 ± 0.01 eV, G in Figure 2D. Furthermore, the electronic distribution of BOMO will be positioned over the cytosine too, Figure 2F. The CG rich domains are usually related to BOMO. We do not observe any alterations in the conductor band for a (T)63 with and without the replacement.
Results and Discussions
The Electronic Density of State in SP1 and EGR1 Transcription Factor
We apply the procedure described in the previous section and we estimate the eigenvalues Ek and eigenvectors of the total Hamiltonian in Equation (1) for the sequences in Table 2. The criteria for the sequence selection as well as the method for nucleotide alignments are described in the Appendix of Supplementary Material. The alignments in Table 2 are in agreement with the consensus sequence in the literature: 5′-ggggcgggg-3′ [5, 59–64] and 5′-gcgggggcg-3′ [59, 60, 65–67] for SP1 and EGR1, respectively.
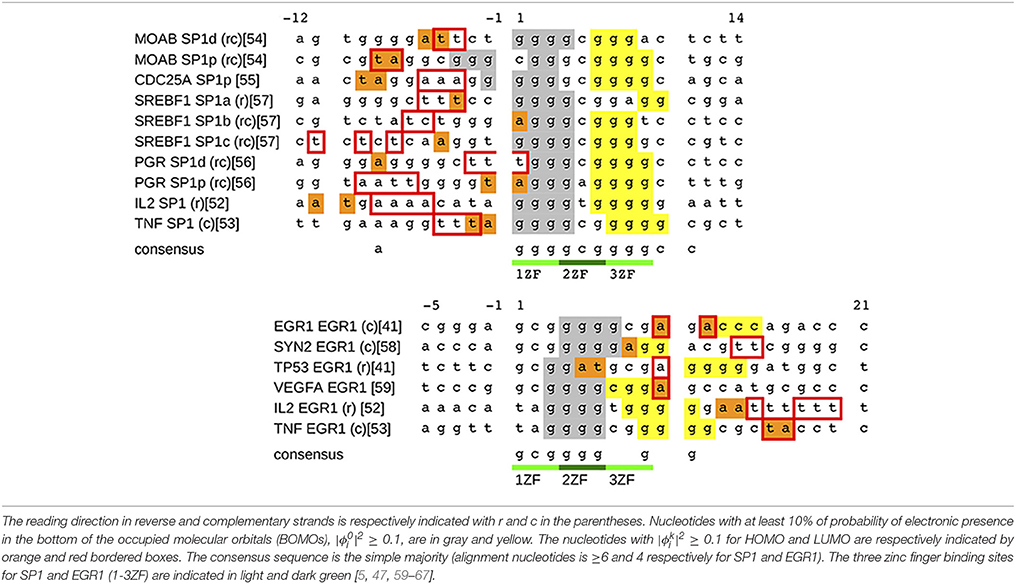
Table 2. Nucleotide alignment for SP1 and EGR1.
Figure 3 shows a typical set of results for the SP1 binding site of the gene MOAB and EGR1 binding site of the gene EGR1. The nucleotide sequence of MOAB SP1 is in reverse complementary reading direction and EGR1 is in complementary strand, Figure 3G.
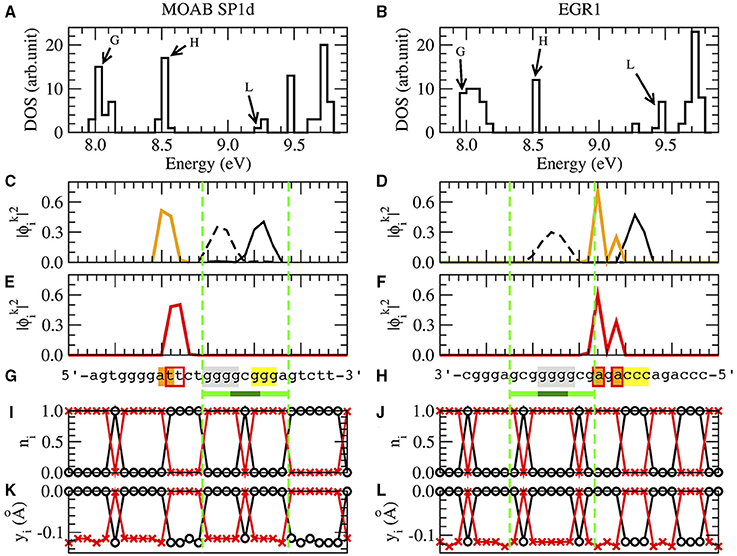
Figure 3. The results of SP1d and EGR1 binding sites for MOAB [61] and EGR1 genes [47] are respectively in the left and right columns. We remark that the EGR1 transcription factor can bind in the promoter of his own gene [47]. (A,B) are the density of states (DOS), where BOMO, HOMO, and LUMO energy levels of the zinc finger binding site are indicated by G, H and L. (C,D) are the probability of BOMO (dashed and solid black lines) and HOMO electrons (orange line). BOMO E0 in the valence band is degenerated with values corresponding to 8.00±0.01eV and 7.98±0.02 eV for SP1d and EGR1. EHOMO are 8.52±0.01eV in both (C,D). The electronic clouds of LUMO in the conductor band are in (E) with ELUMO = 9.28±0.01eV and (F) with ELUMO = 9.45±0.01eV. The nucleotide sequences are given in (G,H), where we underline the 1-3ZF binding consensus sequence in light and dark green lines [5, 47, 59–67]. We remark that the MOAB SP1d is in reverse complementary direction, the EGR1 reading sequence is in the complementary strand. The nucleotides with at least 10% probability of finding BOMO electrons are in gray and yellow. The HOMO and LUMO nucleotides with are in orange and marked with red bordered boxes, respectively. (I,J) are the probability for the electronic presence in the direct strand (black) and the complementary strand (red), when the valence band is completely filled, ne = n. (K,L) are the field displacements yi in the Morse potential with ne = n for the direct strand (black) and for the complementary strand (red).
Although we have 2n eigenvalues and eigenvectors, each one related with one of 2n nucleotides of the system, the relevant electrons for the binding sites are those linked with BOMO, HOMO, and LUMO, respectively noted as G, H, and L in the density of states Figures 3A,B.
We start with the analysis of the position of BOMOs looking for the values of with k close to 1. When we consider n = 50 as in MOAB and EGR1, the analysis of the first eight eigenvectors are usually sufficient to identify the relevant ones. The electronic cloud ni, 0 ≤ ni ≤ 1, Equation (1), is strand dependent, but we do not observe any strand related pattern for individual electrons. Thus, we sum the probabilities of the direct and the complementary strands to find the local electronic cloud. BOMOs could be degenerated in many electrons along the nucleotide sequence, but we should focus just in those around the binding sites, yellow and black lines in the valence band , Figures 3C,D. Note that the sum of these two degenerated BOMOs will result in the LDOS of the binding site, which is proportional to the differential tunneling conductance [1]. At low temperature, this quantity could be measured by scanning tunneling microscope (STM) [42]. The zinc fingers of SP1 and EGR1 transcription factors act as tips of an STM, scanning binding sites along the DNA chain. Finally, we mark the nucleotides with at least 10% probability of electronic presence in gray and yellow in Figures 3G,H.
The procedure for localizing the electronic cloud associated with HOMO and LUMO is very similar to identify BOMO probability distributions, except that k of HOMO and LUMO are close to n. In order to find the electronic clouds, we need to consider k from 46 to 50 for HOMO and 51–54 for LUMO, when n = 50. The electronic cloud associated with LUMO is always close to the HOMO, with a maximum of ±6 bp distance. Since the probability of finding one HOMO or LUMO electrons are strand independent, we add both direct and complementary strand in Figures 3C–F). The orange lines in Figures 3C,D and the red lines in Figures 3E,F) are HOMO and LUMO, respectively. We can also measure the LDOS of HOMO and LUMO with STM, using the same approach for BOMOs. The nucleotides with at least 10% of probability of electronic presence are denoted by orange and red boxes in Figures 3G,H).
Now we return to Table 2, where all BOMOs are marked in gray and yellow as well as the HOMO and LUMO electrons are in orange and red boxes. Looking at Table 2, the electronic distribution patterns for the binding sites for SP1 and EGR1 transcription factors are clear.
In the case of SP1, BOMO clouds are over the first (5′-ggg-3′) and third triplets (5′-ggg-3′) of the consensus sequence, light green in Table 2. These triplets identify the first and third ZF binding positions of SP1. Moreover, the first BOMO electronic cloud has values from 4 to 5 bp, while the second ranges from 2 to 4 bp. The eigenvalue of these BOMOs are 7.98±0.05 eV. The energy level of HOMO electrons are fixed at 8.52±0.02 eV and the electronic cloud size spans between 1 and 2 bp. We observe some fluctuation in the eigenvalue in LUMO for SP1, which values 9.3±0.1 eV. The LUMO electrons envelop 2–5 base pairs. The positions of HOMO and LUMO associated electrons are always before the first electron and these electrons are placed from −12 to 1.
For the EGR1 the first BOMO spans from the position 3 to 7 over the second triplet (5′-ggg-3′), and the probability in finding this particular electron spans over 2 or 4 bp. The second triplet is the binding site of the second ZF of the early grown response protein 1. The second electron is after the second triplet and is dispersed between the nucleotide positions 7–15, covering the third triplet. The electronic cloud size ranges from 2 to 4 bp. All BOMO energies in Table 2 value 7.99±0.03 eV. The HOMO and LUMO electronic cloud is over the second electron. All EHOMO in Table 2 value 8.52±0.01 eV and the HOMO related electronic clouds have a length of 1 or 2 base pair. The LUMO energies fluctuate with an average value of 9.4±0.1 eV. The LUMO electronic cloud size varies from 1 to 6 bp and they are in position from 10 to 20.
Considering the HOMO and LUMO distributions, we believe that they may play some role in SP1 and EGR1 binding. These proteins bind DNA, embracing the major grove of the double helix as guide. In the case of SP1, the head may interact with nucleotides between positions −11 and −1. The behavior for EGR1 is more elusive because HOMO and LUMO are completely dispersed over the nucleotides 5–20. Despite the description emphasizing the similarity between the ZF and nucleotide interaction in the literature over the consensus nucleotides [5], the mechanisms of protein attachment in EGR 1 and SP1 are not the same [67, 68].
The HOMO and LUMO electronic clouds frequently overlap. Furthermore, the electrons of HOMO and LUMO are always in adenine and thymine rich sequences. The main reason is as the follows. The electrons from the HOMO in the valence band should move to the nearby lowest unoccupied molecular orbital in the conductor band, when the system is disturbed. And the easiest way for this movement is placing the electron in regions with higher excitability, i.e., AT rich domains. We may conjecture that this jump of the electron in the HOMO to the LUMO has an unknown role in the transcription factor SP1 and EGR1.
On the other hand, the less mobile electrons are those in the CG rich domain, since they are at the bottom of the DOS. So, we expect to identify BOMOs in CG rich-sequences instead of AT rich-regions as we see for (T)63 with one C in the position 32, described previously. Furthermore, these BOMOs are degenerated, i.e., all electrons are at the same energy level. Thus, these cytosine and guanine rich-regions, typical in promoters, are ideal landmarks for SP1 and EGR1 binding sites. The absence of excitation in the lowest states is vital for ZF transcription factors, because nucleotides with mobile electrons may change the position of the beginning of the gene reading, altering the gene expression. For the eigenvalues between BOMO and HOMO we do not find any obvious pattern associated with SP1 and EGR1.
We never observe the BOMO electronic cloud and the overlapped LUMO-HOMOs together using the criteria of a minimum 10% of the localization probability of one particular electron at the samples in Table 2.
Unfortunately the findings in this section cannot be compared with accurate quantum chemistry calculations, because the literature reports results just for few nucleotides [37–41]. Systematic analysis at least 26 nucleotides is usually avoided, because this demands huge processing time to include hydrogen bonds and sugar residues for the description of DNA-protein interactions. On the other hand, the ionization model literature also does not study methodically particular nucleotide sequences, just indicating the viability of the computation in artificial sequences and few contiguous sequences (contigs) [1, 32–36].
The Collective Electronic Behavior
The electronic probabilities of individual electrons, discussed in the previous section, are strand independent. However, the collective electronic probabilities ni and the field displacement yi depend of the strand.
When we have ne = n electrons, we fill only the valence band and usually observe in all analyzed sequences, Table 2, 100% of probability of electronic presence in purine (adenine or guanine) and the absence of an electron (hole) in pyrimidines (thymine or cytosine) in agreement with the DFT analysis [41]. Figures 3I,J are the probabilities ni associated with finding one electron in one nucleotide for the MAOB SP1d and EGR1 binding site sequences. The electronic presence in each purine gives us a new biological interpretation for Peng et al. contributions [11, 12]. Using exon and intron rich segments of the eukaryotic genome, they construct a DNA walk using purine and pyrimidine as criteria for steps. Then they report a self-affine fractal in the walk, showing long-ranged correlation in the purine and pyrimidine distribution. When we look to Figures 3I,J, purines and pyrimidines reflect the electronic distribution along the DNA chain. This electronic distribution is related to BOMO, HOMO, and LUMO distributions, which work as ZF binding sites, for example. It is important to stress that they report a self-affine fractal, but not a self-similar fractal. The self-similarity is related to the palindromic sequences, connected with DNA-loop structures as tRNA and rRNA [69, 70], while self-affinity is related to introns [11]. Furthermore, the evidence of polynomial long-ranged nucleotide interaction is also supported by Oiwa and Goldman [13, 14]. In this work the long contiguous sequences are represented by a sequence of 0 and 1 for noncoding and coding nucleotides, where noncoding nucleotides are intergenic regions and introns and coding nucleotides are genes and regions for metabolic controls. We made an auto-correlation analysis over the binary sequence and report correlation between two coding nucleotides at least 20 thousand bp apart.
The existence of long-ranged correlations has another consequence in the model. The second term in Equation (4), the stacking interaction between adjacent base pair, mimics the bending of DNA as polymer. But, we will see that the short-ranged term in Equation (4) does not contribute to the electronic behavior. This term has an energetic value of the order of 10−4 eV, when we consider typical values for the parameters: yi ~ − 0.1Å, ρ ~ 10 and α ~ 0.35Å. On the other hand, the Morse potential is of the order of 10−2eV. The stacking interaction will be relevant only if we consider ρ > 100, but such high experimental values for ρ are unlikely. This short-ranged element of the model comes from the DNA melting problem, where the interstrands binding of the double helix may open [17]. In this case, the short-ranged element is important, since it is easier to open the dDNA when the neighbor bp is already open. Moreover, yi represent the displacement field of the electronic cloud of the hydrogen bonds between nucleotides in the DNA melting model. But, we change the concept of yi to the π-orbital of the nucleotide. So, the short-ranged part in Equation (4) is no longer relevant. In order to simplify the model, one may eliminate the harmonic oscillator too in Equation (4). However, the harmonic oscillator is important for describing the stacking interaction in the Langevin equation, Equation (6). On the other hand, the bending and the torsion of the double chain have influence over the DNA chain [71], but this behavior cannot be explained by Equation (4), because we have just short-range exponential interactions and a harmonic oscillator between two neighbor base pairs. The missing long-range element in Equation (4) is object of further research. Finally, we do not observe the presence of the electron in purine sequences with one replaced pyrimidine or vice versa: (T)63 with one C in i = 32 or (C)63 with one T in i = 32. The presences or absences of electrons depend on neighbor base pairs.
The presence of electrons in purines has a profound impact on the ZF binding. We show the consensus nucleotide sequence and the core zinc finger binding amino acids in Figures 1B,C for EGR1 and SP1, respectively.
The EGR1 amino acid sequence is available in the Universal Protein Resource databank (UniProt) with the accession code P18146 [72]. The three zinc fingers of the human EGR1 are positioned between position 338–362, 368–390, and 396–418 of the 543 long amino acid sequence [72]. The dotted lines in Figure 1B are the hydrogen bonds between aspartic acid (Figure 1D) and adenine or cytosine, which stabilize the first guanine-argine(R) hydrogen bond of ZF. The positive charged basic argine (R), histidine (H), and lysine (K) responsible for the DNA-protein are highlighted in gray, while the negative charged weak acid threonine (T) and strong acid glutamine (E) are in yellow. Each red line in Figure 1B is the binding of one particular nucleotide with its respective opposite charged amino acid of the core zinc finger segment of the EGR1 [67].
The 785 amino acid long SP1 transcription factor, UniProt accession code P08047, has three tandem ZFs between 626 to 650, 656 to 680, and 686 to 708 [46, 72]. The dotted lines are the hydrogen bonds that stabilize the first ZF guanine-argine(R) or guanine-lysine(K) bonds. The binding between core ZF amino acids and the correspondent nucleotides are indicated by red lines in Figure 1C [5]. Again, each nucleotide is connected with opposite charged amino acid.
Concerning the electrical charges of the SP1 zinc finger tips, the middle amino acid that bonds with the middle nucleotide of the triplet, there is one motif associated with the position of BOMOs, described in the previous section. The pattern of positive and negative charges along the nucleotide sequence coincides with the position of the three ZF tips. Since BOMOs are the most stable electrons, they guide the fingers as holder for fixing SP1 to the dDNA. We observe the same phenomenon for the EGR1.
When we compare the strand independence analysis of the previous section with the electronic strand dependence, one may suggest a contradiction between the presences of BOMO in the complementary strand 3′-ccc-5′ at EGR1 in Figure 3H. Actually BOMO in this case is at the direct strand 5′-ggg-3′. We have the impression that BOMO is in the 3′-ccc-5′, since we sum the electronic cloud of direct and complementary strand in the previous section, seeking the electronic motif of BOMO.
The collective probabilities ni are not the unique strand dependent variable in SP1 and EGR1. The field displacement yi of the Morse potential is also strand dependent. Hence the electronic cloud yi, given by the Morse potential in Equation (4), usually contract when ni = 1. i.e., in the presence of purines. The contraction of the electronic cloud is more intense in adenine (yi = −0.125±0.001) than guanine (yi = −0.114±0.001). The simultaneous measurement of the size of the electronic cloud of the direct and complementary strands yi mirror the nucleotide order and may lead to a new sequencing method.
The consensus sequences, the light and dark green lines in Figures 3G,H, are reflected in yi and ni, Figures 3I–L. We usually observe the absence of the electronic cloud in the middle cytosine of the direct strand of the SP1 and EGR1 binding sites, black lines with circle in Figures 3I,K, as well as the opposite behavior in the complementary strand, red lines with plus in Figures 3I,K. But, we should be cautious, because this is not true for the purine sequences with one replaced pyrimidine or vice versa in the same way of ni, as mentioned before.
Conclusion
Since zinc-fingers (ZFs) interact at the π-orbitals of nucleotides, we do not expect that hydrogen bonds have a relevant role in ZF-DNA bindings as proposed by Zhu et al. [1]. We extend their model allowing the electronic movement along the nucleotides as in charge transport theory [32–36] and introducing the gap in the (C)63 sequence as we expect from the experiments [30, 42]. Furthermore, we identified a typical motif for the probability distribution function of BOMO, HOMO, and LUMO for the nucleotide π-orbital along a dDNA at the binding sites of SP1 and EGR1. BOMO, HOMO, and LUMO show an electronic motif for SP1 and EGR1 binding sites, compatible with the consensus multiple alignments. Thus, the extended ladder model may replace the nucleotide alignment methods based on scores [48]. In the case of SP1, there is one BOMO in the first and another in the third zinc finger binding site, and the HOMO and LUMO positions are before the consensus sequence. The first BOMO is distributed for EGR1 over the second zinc finger binding position and the second BOMO is after the consensus sequence. The HOMO and LUMO are over the second BOMO. BOMOs are degenerated with 7.98±0.05 and 7.99±0.03 eV for SP1 and EGR1, respectively. The HOMO eigenvalues are 8.52±0.02 eV (SP1) and 8.52±0.01 eV (EGR1). The LUMO energy levels are 9.3±0.1 eV (SP1) and 9.4±0.1 eV (EGR1).
When the valence band is filled, we observe a 100% probability in electronic presence in purines (adenine and guanine) and its absence in pyrimidines (thynine and cytosine). Furthermore, the sequence of electrons and holes coincide with the basicity and acidity of the DNA-protein binding animo acids in the zinc fingers. In particular, the sequence of positive and negative charges of the tips of SP1 and EGR1 coincide with BOMO cloud distribution. The collective electronic behavior for the filled valence band DNA chain will result in a sequence of electronic clouds around purine π-orbitals (dashed-dotted lines in Figure 1D).
The Morse potential is the key components for the electronic behavior in the double helix DNA chain in the extended ladder model proposed here. But, the stacking interaction between adjacent base pairs in the Zhu et al. [1] has limited influence on the results, since this interaction is short-ranged.
The method described in this paper simplifies the search of the DNA-protein binding sites, because it does not require any score weighting system as in traditional bioinformatics for nucleotide alignment. So we do not need to worry about gaps in the nucleotide alignment, since we are not looking for the letters A, T, C, and G, but for the presence of the electrons or holes as in the charge transport. In this paper, we study the application of the method to SP1 and EGR1, but the technique is suitable for any nucleotide sequence, e.g., TATA boxes, CCCTC transcription factor, etc.
Author Contributions
All authors listed, have made substantial, direct and intellectual contribution to the work, and approved it for publication.
Conflict of Interest Statement
The authors declare that the research was conducted in the absence of any commercial or financial relationships that could be construed as a potential conflict of interest.
Acknowledgments
The authors thank Lei Liu for the discussions about zinc fingers and for kindly providing us with Figure 1A. This work is supported by the Conselho Nacional de Desenvolvimento Científico e Tecnológico (CNPq), process number 248589/2013, Brazil.
Supplementary Material
The Supplementary Material for this article can be found online at: https://www.frontiersin.org/article/10.3389/fphy.2016.00013
References
1. Zhu J-X, Rasmussen KØ, Balatsky AV, Bishop AR. Local electronic structure in the Peyrard-Bishop-Holstein model. J Phys Condens Matter (2007) 19:136203. doi: 10.1088/0953-8984/19/13/136203
2. Razin SV, Borunova VV, Maksimenko OG, Kantidze OL. Cys2His2 zinc finger protein family: classification, functions, and major members. Biochemistry (2012) 77:217–26. doi: 10.1134/s0006297912030017
3. Kim TH, Abdullaev ZK, Smith AD, Ching KA, Loukinov DI, Green RD, et al. Analysis of the vertebrate insulator protein CTCF-binding sites in the human genome. Cell (2007) 128:1231–45. doi: 10.1016/j.cell.2006.12.048
4. Chen H, Tian Y, Shu W, Bo X, Wang S. Comprehensive identification and annotation of Cell Type-Specific and Ubiquitous CTCF-binding sites in the human genome. PLoS One (2012) 7:e41374. doi: 10.1371/journal.pone.0041374
5. Klug A. The discovery of zinc fingers and their applications in gene regulation and genome manipulation. Ann Rev Biochem. (2010) 79:213–31. doi: 10.1146/annurev-biochem-010909-095056
6. Ong C-T, Corces VG. CTCF: an architectural protein bridging genome topology and function. Nat Rev Genet. (2014) 15:234–46. doi: 10.1038/nrg3663
7. Ling JQ, Li T, Hu JF, Vu TH, Chen HL, Qiu XW, et al. CTCF mediates interchromosomal colocalization between Igf2/H19 and Wsb1/Nf1. Science (2006) 312:269–72. doi: 10.1126/science.1123191
8. Yusufzai TM, Tagami H, Nakatani Y, Felsenfeld G. CTCF tethers an insulator to subnuclear sites, suggesting shared insulator mechanisms across species. Mol Cell (2004) 13:291–8. doi: 10.1016/S1097-2765(04)00029-2
9. Kurukuti S, Tiwari VK, Tavoosidana G, Pugacheva E, Murrell A, Zhao Z, et al. CTCF binding at the H19 imprinting control region mediates maternally inherited higher-order chromatin conformation to restrict enhancer access to Igf2. Proc Natl Acad Sci USA. (2006) 103:10684–9. doi: 10.1073/pnas.0600326103
10. Feinauer CJ, Hofmann A, Goldt S, Liu L, Máté G, Heermann DW. Zinc finger proteins and the 3D organization of chromosomes. Adv Protein Chem Struct Biol. (2013) 90:67–117. doi: 10.1016/B978-0-12-410523-2.00003-1
11. Peng C-K, Buldyrev SV, Goldberger AL, Havlin S, Sciortino F, Simons M, et al. Long-range correlations in nucleotide sequences. Nature (1992) 356:168–70. doi: 10.1038/356168a0
12. Peng C-K, Buldyrev SV, Havlin S, Simons M, Stanley HE, Goldberger AL. Mosaic organization of DNA nucleotides. Phys Rev E (1994) 49:1685. doi: 10.1103/PhysRevE.49.1685
13. Oiwa NN, Goldman C. Phylogenetic study of the spatial distribution of protein-coding and control segments in DNA chains. Phys Rev Lett. (2000) 85:2396. doi: 10.1103/PhysRevLett.85.2396
14. Oiwa NN, Goldman C. On the analysis of large-scale genomic structures. Cell Biochem Biophys. (2005) 42:145–65. doi: 10.1385/CBB:42:2:145
15. Heermann DW. Physical nuclear organization: loops and entropy. Curr Opin Cell Biol. (2011) 23:332–7. doi: 10.1016/j.ceb.2011.03.010
16. Oiwa NN. The nucleotide sequence and the local electronic structure. J Phys Condens Matter (2007) 19:181001. doi: 10.1088/0953-8984/19/18/181001
17. Peyrard M, Bishop AR. Statistical mechanics of a nonlinear model for DNA denaturation. Phys Rev Lett. (1989) 62:2755.
18. Maciá E. Electrical conductance in duplex DNA: helical effects and low-frequency vibrational coupling. Phys Rev B (2007) 76:245123. doi: 10.1103/PhysRevB.76.245123
19. Weber G. Mesoscopic model parametrization of hydrogen bonds and stacking interactions of RNA from melting temperatures. Nucleic Acids Res. (2013) 41:e30. doi: 10.1093/nar/gks964
20. Langowski J, Heermann DW. Computational modeling of the chromatin fiber. Semin. Cell Dev Biol. (2007) 18:659–67. doi: 10.1016/j.semcdb.2007.08.011
21. Bohn M, Heermann DW, van Driel R. Random loop model for long polymers. Phys Rev E (2007) 76:051805. doi: 10.1103/PhysRevE.76.051805
22. Liu L, Heermann DW. The interaction of DNA with multi-Cys2His2 zinc finger proteins. J Phys Condens Matter (2015) 27:064107. doi: 10.1088/0953-8984/27/6/064107
23. Braun E, Eichen Y, Sivan U, Ben-Yoseph G. DNA-templated assembly and electrode attachment of a conducting silver wire. Nature (1998) 391:775–8.
24. Fink H-W, Schönenberger C. Electrical conduction through DNA molecules. Nature (1999) 398:407–10.
25. de Pablo PJ, Moreno-Herrero F, Colchero J, Gómez Herrero J, Herrero P, Baró AM, et al. Absence of dc-Conductivity in λ-DNA. Phys Rev Lett. (2000) 85:4992. doi: 10.1103/PhysRevLett.85.4992
27. Tran P, Alavi B, Gruner G. Charge transport along the λ-DNA double helix. Phys Rev Lett. (2000) 85:1564. doi: 10.1103/PhysRevLett.85.1564
28. Cai L, Tabata H, Kawai T. Self-assembled DNA networks and their electrical conductivity. Appl Phys Lett. (2000) 77:3105. doi: 10.1063/1.1323546
29. Porath D, Bezryadin A, de Vries S, Dekker C. Direct measurement of electrical transport through DNA molecules. Nature (2000) 403:635–8. doi: 10.1038/35001029
30. Yoo K-H, Ha DH, Lee J-O, Park JW, Kim J, Kim JJ, et al. Electrical conduction through Poly(dA)-Poly(dT) and Poly(dG)-Poly(dC) DNA molecules. Phys Rev Lett. (2001) 87:198102. doi: 10.1103/PhysRevLett.87.198102
31. Lee H-Y, Tanaka H, Otsuka Y, Yoo K-H, Lee J-O, Kawai T. Control of electrical conduction in DNA using oxygen hole doping. Appl Phys Lett. (2002) 80:1670–2. doi: 10.1063/1.1456972
32. Yamada H. Electronic localization properties of a double strand of DNA: a simple model with long-range correlated hopping disorder. Int J Mod Phys B (2004) 18:1697. doi: 10.1142/S0217979204024884
33. de Oliveira BPW, Albuquerque EL, Vasconcelos MS. Electronic density of states in sequence dependent DNA molecules. Surf Sci. (2006) 600:3770–4. doi: 10.1016/j.susc.2006.01.081
34. Sarmento RG, Albuquerque EL, Sesion Jr PD, Fulco UL, de Oliveira BPW. Electronic transport in double-strand poly(dG)-poly(dC) DNA segments. Phys Lett A (2009) 373:1486–91. doi: 10.1016/j.physleta.2009.02.043
35. Venkatramani R, Keinan S, Balaeff A, Beratan DN. Nucleic acid charge transfer: black, white and gray. Coord Chem Rev. (2011) 255:635–48. doi: 10.1016/j.ccr.2010.12.010
36. Sarmento RG, Mendes GA, Albuquerque EL, Fulco UL, Vanconcelos MS, Ujsághy O, et al. The DNA electronic specific heat at low temperature: the role of aperiodicity. Phys Lett A (2012) 376:2413–7. doi: 10.1016/j.physleta.2012.05.058
37. Lu G, Maragakis P, Kaxira E. Carbon nanotube interaction with DNA. Nano Lett. (2005) 5:897–900. doi: 10.1021/nl050354u
38. Chen ECM, Chen ES. Thermal electrons and watson crick AT(−). Chem Phys Lett. (2007) 435:331–5. doi: 10.1016/j.cplett.2006.12.064
39. Chen ES, Chen ECM. The role of spin in biological processes: O2, NO, nucleobases, nucleosides, nucleotides and Watson-Crick base pairs. Mol Simul. (2009) 35:719–24. doi: 10.1080/08927020902865931
40. Richardson NA, Gu J, Wang S, Xie Y, Schaefer HF III. DNA nucleosides and their radical anions: molecular structures and electron affinities. J Am Chem Soc. (2004) 126:4404–11. doi: 10.1021/ja030487m
41. Gu J, Leszczynski J, Schaefer HF III. Interactions of electrons with bare and hydrated biomolecules: from nucleic acid bases to DNA segments. Chem Rev. (2012) 112:5603–40. doi: 10.1021/cr3000219
42. Shapir E, Cohen H, Calzolari A, Cavazzoni C, Ryndyk DA, Cuniberti G, et al. Electronic structure of single DNA molecules resolved by transverse scanning tunnelling spectroscopy. Nat Mater. (2008) 7:68–74. doi: 10.1038/nmat2060
43. Senthilkumar K, Grozema FC, Guerra CF, Bickelhaupt FM, Lewis FD, Berlin YA, et al. Absolute rates of hole transfer in DNA. J Am Chem Soc. (2005) 127:14894–903. doi: 10.1021/ja054257e
44. Mehrez H, Anantram MP. Interbase electronic coupling for transport through DNA. Phys Rev B (2005) 71:115405. doi: 10.1103/PhysRevB.71.115405
45. Zilly M, Ujsaghy O, Wolf DE. Conductance of DNA molecules: effects of decoherence and bonding. Phys Rev B (2010) 82:125125. doi: 10.1103/PhysRevB.82.125125
46. Kaczynski J, Cook T, Urrutia R. Sp1- and Krüppel-like transcription factors. Genome Biol. (2003) 4:206. doi: 10.1186/gb-2003-4-2-206
47. Thiel G, Cibelli G. Regulation of life and death by the zinc finger transcription factor Egr-1. J Cell Physiol. (2002) 193:287–92. doi: 10.1002/jcp.10178
48. McWilliam H, Li W, Uludag M, Squizzato S, Park YM, Buso N, et al. Analysis tool web services from the EMBL-EBI. Nucleic Acids Res. (2013) 41:W597–W600. doi: 10.1093/nar/gkt376
49. Benson DA, Clark K, Karsch-Mizrachi I, Lipman DJ, Ostell J, Sayers EW. Gen- Bank. Nucleic Acids Res. (2014) 42:D32–7. doi: 10.1093/nar/gkt1030
50. Lander ES, Linton LM, Birren B, Nusbaum C, Zody MC, Baldwin J, et al. Initial sequencing and analysis of the human genome. Nature (2001) 409:860–921. doi: 10.1038/35057062
51. Périer RC, Junier T, Bucher P. The Eukaryotic Promoter Database EPD. Nucleic Acids Res. (1998) 26:353–7. doi: 10.1093/nar/26.1.353
52. Praz V, Périer R, Bonnard C, Bucher P. The Eukaryotic Promoter Database, EPD: new entry types and links to gene expression data. Nucleic Acids Res. (2002) 30:322–4. doi: 10.1093/nar/30.1.322
53. Dreos R, Ambrosini G, Périer RC, Bucher P. EPD and EPDnew, high-quality promoter resources in the next-generation sequencing era. Nucleic Acids Res. (2013) 41:D157–64. doi: 10.1093/nar/gks1233
54. Jortner J, Bixon M, Langenbacher T, Michel-Beyerle ME. Charge transfer and transport in DNA. Proc Natl Acad Sci USA. (1998) 95:12759–65.
55. Giese B. Long-distance charge transport in DNA: the hopping mechanism. Acc Chem Res. (2000) 33:631–6. doi: 10.1021/ar990040b
56. Bixon M, Jortner J. Long-range and very long-range charge transport in DNA. Chem Phys. (2002) 281:393–408. doi: 10.1016/S0301-0104(02)00495-0
57. Soetaert K, Petzoldt T, Setzer RW. Solving differential equations in R: Package deSolve. J Stat Softw. (2010) 33:1–25. doi: 10.18637/jss.v033.i09
58. Wang H, Lewis JP, Sankey OF. Band-gap tunneling states in DNA. Phys Rev Lett. (2004) 93:016401. doi: 10.1103/PhysRevLett.93.016401
59. Skerka C, Decker EL, Zipfel PF. A regulatory element in the human interleukin 2 gene promoter is a binding site for the zinc finger proteins Sp1 and EGR-1. J Biol Chem. (1995) 270:22500–6.
60. Yao J, Mackman N, Edgington TS, Fan S-T. Lipopolysaccharide induction of the tumor necrosis factor-alpha promoter in human monocytic cells. Regulation by Egr-1, c-Jun, and NF-kappaB transcription factors. J Biol Chem. (1997) 272:17795–801.
61. Wong WK, Chen K, Shih JC. Regulation of human monoamine oxidase B gene by Sp1 and Sp3. Mol Pharmacol. (2001) 59:852–9. doi: 10.1124/mol.59.4.852
62. Iavarone A, Massagué J. E2F and histone deacetylase mediate transforming growth factor beta repression of cdc25A during keratinocyte cell cycle arrest. Mol Cell Biol. (1999) 19:916–22.
63. Schultz JR, Petz LN, Nardulli AM. Estrogen receptor alpha and Sp1 regulate progesterone receptor gene expression. Mol Cell Endocrinol. (2003) 201:165–75. doi: 10.1016/S0303-7207(02)00415-X
64. Zhang C, Shin D-J, Osborne TF. A simple promoter containing two Sp1 sites controls the expression of sterol-regulatory-element-binding protein 1a (SREBP-1a). Biochem J. (2005) 386:161–8. doi: 10.1042/BJ20041514
65. Petersohn D, Schoch S, Brinkmann DR, Thiel G. The human synapsin II gene promoter. Possible role for the transcription factor zif268/egr-1, polyoma enhancer activator 3, and AP2. J Biol Chem. (1995) 270:24361–9.
66. Mechtcheriakova D, Wlachos A, Holzmüller H, Binder BR, Hofer E. Vascular endothelial cell growth factor-induced tissue factor expression in endothelial cells is mediated by EGR-1. (1999) Blood 93:3811–23.
67. Wolfe SA, Nekludova L, Pabo CO. DNA recognition by Cys2His2 zinc finger proteins. Annu Rev Biophys Biomol Struct. (1999) 3:183–212.
68. Nolte RT, Conlin RM, Harrison SC, Brown RS. Differing roles for zinc fingers in DNA recognition: structure of a six-finger transcription factor IIIA complex. Proc Natl Acad Sci USA. (1998) 95:2938–43.
69. Oiwa NN, Glazier JA. The fractal structure of the mitochondrial genomes. Phys A (2002) 331:221–30. doi: 10.1016/S0378-4371(02)00807-5
70. Oiwa NN, Glazier JA. Self-similar mitochondrial DNA. Cell Biochem Biophys. (2004) 41:41–62. doi: 10.1385/CBB:41:1:041
71. Dauxois T, Peyrard M, Bishop AR. Dynamics and thermodynamics of a nonlinear model for DNA denaturation. Phys Rev E (1993) 47:684. doi: 10.1103/PhysRevE.47.684
72. The UniProt Consortium. Activities at the Universal Protein Resource (UniProt). Nucleic Acids Res. (2014) 42:D191–8. doi: 10.1093/nar/gkt1140
73. Pavletich NP, Pabo CO. Zinc finger-DNA recognition: crystal structure of a Zif268-DNA complex at 2.1 A. (1991) Science 252:809–17.
74. Elrod-Erickson M, Rould MA, Nekludova L, Pabo CO. Zif268 protein-DNA complex refined at 1.6 A: a model system for understanding zinc finger-DNA interactions. Structure (1996) 4:1171–80.
75. Ghomi M, Letellier R, Liquier J, Taillandier E. Interpretation of DNA vibrational spectra by normal coordinate analysis. Int J Biochem. (1990) 22:691–9.
76. Charif D, Lobry JR. SeqinR 1.0–2: a contributed packaged to the R project for statistical computing devoted to biological sequences retrieval and analysis. In: Bastolla U, Porto M, Roman HE, Vendruscolo, M, editors. Structural Approaches to Sequence Evolution: Molecules, Networks, Populations (New York, NY: Springer Verlag) (2007). pp. 207–32.
77. Pagès H, Aboyoun P, Gentleman R, DebRoy S. Biostrings: String Objects Representing Biological Sequences, and Matching Algorithms. Biostrings, version 2.34.1 (2015). Available online at: https://bioconductor.org/packages/release/bioc/html/Biostrings.html
Keywords: SP1, EGR1, Cys2His2 zinc finger, extended ladder model, electronic structure
Citation: Oiwa NN, Cordeiro CE and Heermann DW (2016) The Electronic Behavior of Zinc-Finger Protein Binding Sites in the Context of the DNA Extended Ladder Model. Front. Phys. 4:13. doi: 10.3389/fphy.2016.00013
Received: 17 August 2015; Accepted: 05 April 2016;
Published: 11 May 2016.
Edited by:
Mario Nicodemi, Universita' di Napoli “Federico II,” ItalyReviewed by:
Litao Sun, The Scripps Research Institute, USAKhoi Tan Nguyen, Vietnam National University of HCMC, Vietnam
Copyright © 2016 Oiwa, Cordeiro and Heermann. This is an open-access article distributed under the terms of the Creative Commons Attribution License (CC BY). The use, distribution or reproduction in other forums is permitted, provided the original author(s) or licensor are credited and that the original publication in this journal is cited, in accordance with accepted academic practice. No use, distribution or reproduction is permitted which does not comply with these terms.
*Correspondence: Nestor N. Oiwa, nestoroiwa@vm.uff.br