Recent Developments in Fast Kurtosis Imaging
 Brian Hansen
 Sune N. Jespersen
- 1Center of Functionally Integrative Neuroscience and MINDLab, Department of Clinical Medicine, Aarhus University, Aarhus, Denmark
- 2Department of Physics and Astronomy, Aarhus University, Aarhus, Denmark
Diffusion kurtosis imaging (DKI) is an extension of the popular diffusion tensor imaging (DTI) technique. DKI takes into account leading deviations from Gaussian diffusion stemming from a number of effects related to the microarchitecture and compartmentalization in biological tissues. DKI therefore offers increased sensitivity to subtle microstructural alterations over conventional diffusion imaging such as DTI, as has been demonstrated in numerous reports. For this reason, interest in routine clinical application of DKI is growing rapidly. In an effort to facilitate more widespread use of DKI, recent work by our group has focused on developing experimentally fast and robust estimates of DKI metrics. A significant increase in speed is made possible by a reduction in data demand achieved through rigorous analysis of the relation between the DKI signal and the kurtosis tensor based metrics. The fast DKI methods therefore need only 13 or 19 images for DKI parameter estimation compared to more than 60 for the most modest DKI protocols applied today. Closed form solutions also ensure rapid calculation of most DKI metrics. Some parameters can even be reconstructed in real time, which may be valuable in the clinic. The fast techniques are based on conventional diffusion sequences and are therefore easily implemented on almost any clinical system, in contrast to a range of other recently proposed advanced diffusion techniques. In addition to its general applicability, this also ensures that any acceleration achieved in conventional DKI through sequence or hardware optimization will also translate directly to fast DKI acquisitions. In this review, we recapitulate the theoretical basis for the fast kurtosis techniques and their relation to conventional DKI. We then discuss the currently available variants of the fast kurtosis techniques, their strengths and weaknesses, as well as their respective realms of application. These range from whole body applications to methods mostly suited for spinal cord or peripheral nerve, and analysis specific to brain white matter. Having covered these technical aspects, we proceed to review the fast kurtosis literature including validation studies, organ specific optimization studies and results from clinical applications.
Introduction
Microstructural sensitivity in MRI is most often obtained by sensitizing the signal to the diffusion of water. In combination with modeling, such data can yield specific microstructural markers, but the data required to support such modeling is often prohibitive in particular in a clinical context. A less data intense strategy to obtain microstructural sensitivity in diffusion MRI (dMRI) is the diffusion kurtosis imaging (DKI) framework [1] which quantifies the leading deviation from Gaussian diffusion in each image point. This deviation arises from the influence of tissue microstructure on the water diffusion profile and is easily visualized by plotting the log signal as function of b-value. This is done in Figure 1 using data acquired along one direction in a white matter region in normal human brain (circles). Here the familiar log-linear signal decay is seen up to b ≈ 1 ms/μm2, below which a diffusion tensor fit (solid red line) approximates the signal very well. Extrapolation of this fit beyond b ≈ 1 ms/μm2 (dashed red line), however, clearly does not match the observed signal. Conversely, the DKI fit (solid green line) is seen to approximate the measured signal over the entire b-value range shown, although it will diverge at sufficiently high b-values. DKI thus allows quantification of the deviation from log-linear signal decay caused by tissue microarchitecture and compartmentalization. This deviation thereby indirectly provides information about these tissue properties.
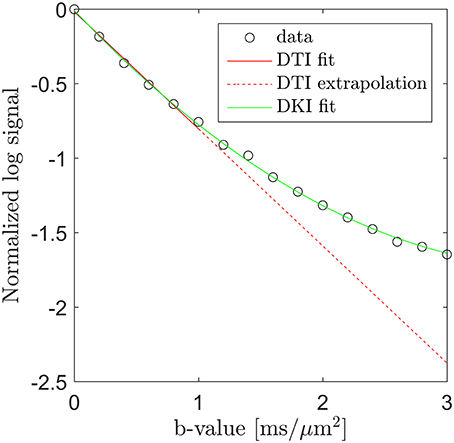
Figure 1. Diffusion MRI data (circles) from a white matter region in human brain acquired along one direction over the b-value range from 0 to 3 ms/μm2. Fits obtained with DTI (solid red line, b = 0–1 ms/μm2) and DKI (green line, all b-values) are shown. The signal deviation from the DTI signal prediction is illustrated by extrapolating the DTI fit (the dashed red line) into the DKI regime (b > 1 ms/μm2). Conversely, the DKI fit is seen to approximate the signal very well.
Compared to most other advanced dMRI techniques, DKI is easily implemented. For this reason, and because of its increased sensitivity to tissue microstructure compared to diffusion tensor imaging (DTI), DKI has grown to be a popular dMRI method. Nevertheless, DKI is not experimentally inexpensive, as typical protocols consist of a few unweighted images for normalization and two 30-direction shells at two non-zero b-values (typically 1.0 ms/μm2 and 2.0–2.5 ms/μm2) thus totaling 60–70 images [2]. This is current standard, although more data intense protocols are not uncommon [3]. While most DKI protocols are too lengthy for everyday clinical use, high quality data can be acquired in a time frame considered reasonable for many clinical and preclinical studies. Even so, the time required for post-processing of DKI is significant, and both acquisition time and data processing time limit its clinical application, especially in patients with time sensitive ailments (e.g., stroke or trauma), or patients with difficulties lying still, e.g., children.
The DKI method yields a wealth of parameters that can be mapped on a voxel by voxel basis. Several of these DKI metrics have been shown to detect subtle changes in brain tissue structure. To briefly summarize, studies have shown DKI to have potential in diagnostics of a number of diseases such as stroke [4, 5], Alzheimer's disease [6], multiple sclerosis [7], gliomas [8, 9], and head trauma [10–12] (see also the review of this area in Ostergaard et al. [13]). DKI is not only of clinical interest but is also a valuable tool in basic neuroscience, and the method has for example been employed in studies of natural alteration of brain microstructure e.g., in the context of development and aging [14, 15].
DKI is sensitive to microstructure generally, and therefore in brain it can be used to study both gray matter (GM) and white matter (WM). However, in WM, DKI can be combined with modeling to obtain some of the biophysical specificity of more advanced dMRI modeling frameworks. One important example of this is the white matter tract integrity (WMTI) technique [2] which on the basis of a DKI data set provides detailed information about microstructure of highly aligned fiber bundles, such as intra- and extra-axonal diffusivities, axonal water fraction (AWF), and the tortuosity, α, of the extra-axonal space.
Like DKI, WMTI has also been used to study the brain in a wide range of contexts: normal brain development and aging [16, 17], Alzheimer's disease [18, 19], mild head trauma [20], multiple sclerosis [21], autism [22], and stroke [4]. Validation studies comparing WMTI indices to histology and electron microscopy [23–26] have largely confirmed the ability of WMTI to detect microstructural changes in WM. While other frameworks for DKI-based estimation of tissue model parameters have been proposed [27, 28], a recent comparative study showed WMTI to be the most widely applicable [27].
While WMTI was developed specifically for analysis of WM, the DKI framework itself is almost without assumptions and its applications are therefore not limited to brain imaging. Consequently, interest in DKI for body imaging is growing [29] with demonstrated applications in imaging of liver [30, 31], kidney [32, 33], and prostate [34–36].
This short survey of the DKI literature documents the high potential of DKI as a method to obtain sensitive markers suitable for basic research (e.g., for the study of brain plasticity), diagnostics and treatment monitoring. However, widespread clinical application of DKI and WMTI has yet to emerge. Two major limitations that are most likely responsible for DKI not being routinely used in the clinic have already been identified: acquisition time and post-processing time. Lowering both of these barriers has therefore been an important goal as methods for fast DKI and WMTI would not only increase the clinical applicability of DKI and WMTI, but also make possible more widespread, routine exploration of DKI metrics by allowing inclusion of DKI, at little additional cost, as a component of any protocol for imaging of the brain or other organs. Furthermore, such methods would facilitate high resolution preclinical studies for characterization of animal models of disease or for validation studies.
Here we review recent developments enabling fast kurtosis imaging based on small data sets (13 or 19 images) and with near-instant post-processing [37–42]. The review is structured such that first the theoretical foundation of DKI and WMTI is recapitulated briefly. For a more in-depth review of conventional DKI we refer to Jensen and Helpern [43], Wu and Cheung [44]. On this basis we then introduce the rapidly obtainable DKI metrics used in fast kurtosis and discuss their relation to conventional DKI definitions. Since a few variants of fast kurtosis have been introduced we cover all of them and their various area of application. Having covered the methodological background we review the literature of fast DKI application studies and discuss current efforts for method refinement and potential future applications. All data shown was reused from the cited papers from our group. The presented non-human data was acquired at 9.4T (except from Figure 8, acquired at 16.4T) while human brain data was acquired in normal volunteers at 3T. We refer to the original publications for details on data acquisition and analysis.
Diffusion Kurtosis Imaging Variants
Conventional DKI
The standard expression for the DKI signal is [1]:
Here S0 = S(b = 0) is the unweighted signal used for normalization and b is the diffusion weighting applied along a direction . The normalized signal is denoted S from here on. Throughout, subscripts label Cartesian components (e.g., i = x,y,z) and summation over repeated indices is assumed. D is the diffusion tensor [45], and the kurtosis tensor W and the apparent excess kurtosis are defined as in Jensen et al. [1]. Overbar denotes mean value over diffusion directions, i.e., is the mean diffusivity (Tr is the trace).
In the DKI analysis, the tensors D and W are estimated by fitting Equation (2.1.1) to data acquired as described above (with b-values sufficiently low so that the O(b3) terms can be neglected and satisfying [46] so that the DKI signal model Equation (2.1.1) does not diverge). From these tensors, a wealth of metrics is available. For the diffusion tensor, the most important metrics are , fractional anisotropy (FA) and radial and axial diffusivities. To obtain these, the diffusion tensor is diagonalized to yield three pairs of eigenvectors and eigenvalues λi (i = 1, 2, 3). The eigenvalues (diffusivities) are sorted by size so that the primary eigenvector () indicates the direction of highest diffusivity (λ1), etc. The axial diffusivity is then D|| = λ1 and radial diffusivity is D⊥ = (λ2 + λ3)/2. The anisotropy of D is summarized by the FA due to Basser and Pierpaoli [47]:
where the double vertical bars ||·|| denote the Frobenius norm and 𝕀 is the rank-2 identity matrix. From the kurtosis tensor, summary metrics can also be derived, the most important parameter being the mean kurtosis (MK, ) [1]:
Other meaningful parameters can be extracted from the kurtosis tensor. Similar to the directional diffusivities, the kurtoses observed along (||) and orthogonal (⊥) to the primary eigenvector direction have been introduced [3, 43, 48, 49]:
where S2 is the sphere. These are known respectively as (conventional) radial and axial kurtosis. Note that in contrast to their diffusion tensor counterparts, they are not strictly rotationally invariant. The reason for this behavior is that in orthogonal fiber bundle crossings the diffusion eigenvalues may be degenerate (i.e., for such a 3D fiber arrangement there is no primary fiber direction and the diffusion tensor is isotropic) while the apparent kurtosis can differ among the fiber directions due to microstructural differences in the bundles [42]. Consequently, in this thought-experiment noise will determine which eigenvector will be deemed the primary direction thus causing the estimated directional kurtosis values to vary between measurements. While such fiber configurations are most likely rare this property should nevertheless be kept in mind when employing directional kurtosis metrics. Other definitions have been proposed and the fast DKI counterparts rely on other definitions than those presented in Equations (2.1.3) and (2.1.4). These will be discussed in Sections “Fast estimation of mean diffusivity and mean kurtosis”, “Fast kurtosis estimation with increased experimental robustness” and, “Axisymmetric DKI”.
In addition to the raw tensor metrics, D and W can also provide metrics of white matter tract integrity (WMTI) based on modeling described in Fieremans et al. [2]. The assumptions and modeling choices that make estimation of these WM metrics possible are covered in the following section.
White Matter Tract Integrity from DKI
WMTI uses the estimated tensors D and W to estimate the (MR detectable) axonal water fraction, and several compartmental diffusivities. This analysis exploits the relation between the tensors D and W and the WMTI parameters found by the cumulant expansion of the expression for the dMRI signal from a two-compartment system consisting of the extra-axonal space (EAS) and an intra-axonal space (IAS) described as sticks with an effective radius of zero, which is valid for the gradients employed in acquiring typical clinical diffusion data. Diffusion in both the EAS and the IAS is approximated with anisotropic Gaussian diffusion, and because of the latter, the analysis is restricted to areas of highly aligned WM. Water exchange is assumed to be negligible over the experimental time window, and myelin water is assumed not to contribute because of its large value of TE/T2. A limited amount of dispersion of axons within the WM bundle does not violate the Gaussian intra-axonal assumption, but implies that the intra-axonal diffusion tensor has three non-vanishing eigenvalues [2]. With these assumptions, the signal expression for this two-compartment system becomes:
where f is the axonal water fraction (AWF from here on), Da and De are the diffusion tensors belonging to the IAS and EAS respectively. The form of these tensors is:
where subscript numbers label the eigenvalues by magnitude in descending order, implying that here the primary direction is ẑ. From the cumulant expansion of this model, the measured diffusion and kurtosis tensors D and W can be expressed in terms of the model parameters. In this manner, the otherwise unspecific DKI parameters yield approximations for specific biophysical parameters: the AWF, IAS diffusivity (Da = Tr(Da)), parallel and radial EAS diffusivities (De, || = De, 1 and De,⊥ = (De2 + De3)/2), and the EAS tortuosity (α = De, ||/De,⊥). Notably, the estimates are only approximate, as the diffusion and kurtosis tensors in principle do not supply sufficient information to estimate all diffusivities and the axonal volume fraction because of the confounding factors of axonal dispersion [50]. Additionally, kurtosis based estimation of compartmental diffusivities yields two solutions. This arises because the kurtosis is related to the variance (“mean of square minus square of mean”) over diffusivities [43] causing the square root to enter the analysis. For this reason, WMTI furthermore relies on the assumption that intra-axonal diffusivity Da1 is smaller than extra-axonal diffusivity De1 as argued in Fieremans et al. [2]. Figure 2 shows a schematic of this representation of a WM bundle and the biophysical properties that may be estimated from WMTI analysis. For further details on derivations and modeling assumptions, the reader is referred to the original WMTI papers [2, 51].
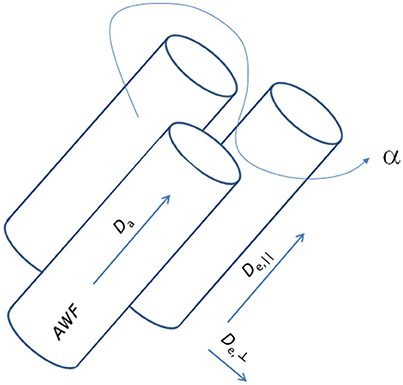
Figure 2. Schematic representation of a white matter fiber bundle and its biophysical properties accessible with the WMTI analysis framework.
Fast Estimation of Mean Diffusivity and Mean Kurtosis
The ability to rapidly estimate mean diffusivity and mean kurtosis from only 13 images was presented in Hansen et al. [39, 40]. In order to achieve this, a mean kurtosis definition was introduced () which differs from the definition in Equation (2.1.3), namely:
This definition differs from the conventional MK definition in Equation (2.1.3) in that it is based on the spherical average of the apparent tensor kurtosis :
instead of . For this reason we also refer to as the mean of the kurtosis tensor (MKT). This definition is compactly written as one fifth of the trace (Tr) of the kurtosis tensor W. The factor of one fifth stems from the spherical average [52]:
where 𝕀 is the fully symmetric isotropic rank 4 tensor [53]. Hence, represents the isotropic part of the kurtosis tensor [39]. The advantage of this mean kurtosis definition is apparent from the last line in Equation (2.3.1) which states that is proportional to a linear combination of six tensor elements, and this linear combination can be obtained from measurements without fitting to the data. For the measurements, the “pure” tensor elements (Wiiii) can be probed directly, whereas the mixed elements (Wiijj, i ≠ j) requires the combination of two directions for each to cancel cross terms, see Hansen et al. [39] for details. Therefore, a total of nine directions is needed to calculate . These directions are illustrated in Figure 3, where it is readily seen that this encoding scheme does not sample the sphere very efficiently; the high estimation quality obtained with this scheme rests entirely on the relations introduced shortly. The directions are also listed in Table 1 which also defines the notation used in the following equations.
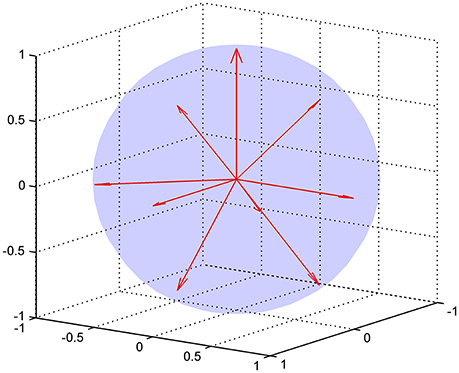
Figure 3. The nine encoding directions required for fast DKI illustrated as unit vectors. The directions are listed explicitly in Table 1.
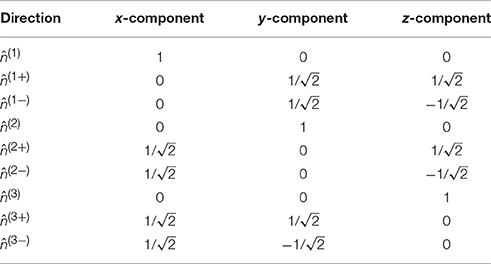
Table 1. The nine directions in the compact notation (leftmost column) used in the manuscript and stated as normalized vectors.
For data acquired along these directions (i = 1,2,3) the following holds [39]:
With an independent estimate of , Equation (2.3.4) allows estimation of without data fitting, thus eliminating both the time consuming post-processing and the pitfalls associated with it [54–56]. The mean diffusivity can be estimated from data acquired along three orthogonal directions at a single b-value (and b = 0), but is improved by taking into account the kurtosis term in the analysis [57], which can be done if the 3 directions are acquired also at a second higher b-value shell. In this manner a closed form solution for [58] is obtained taking into account the directional kurtosis for high fidelity estimation [57]. The strategy proposed in Hansen et al. [39] thus implements the estimation of based on data acquired at an intermediate b-value along the three main directions, , and , which are already contained in the nine directions in Table 1. Thus, the “1-3-9 approach” for fast estimation of and is to acquire one b = 0 image, 3 images at b1 = 1.0 ms/ μm2 along the x,y,z directions (, i = 1,2,3), and nine images acquired at b2 = 2.5 ms/μm2 along the directions listed in Table 1.
The scaling factor of in Equation (2.3.2) generally depends on direction and as such will affect the spherical average so that only for isotropic systems. From the definitions therefore, and are expected to deviate the most in highly anisotropic tissue. It is natural therefore to evaluate whether the rapidly obtainable tensor based mean kurtosis () offers similar contrast to the conventional MK. This is illustrated in Figure 4 which shows typical DTI and DKI parameters mapped in fixed rat brain at an in-plane resolution of 100 μm x 100 μm to allow contrast comparison in specific brain regions such as the subfields of the hippocampus. Overall, the parameters can be seen to provide vastly different contrast, except for and which are seen to be almost indistinguishable although a few blank pixels are seen in the map due to noise (see also comments on preprocessing below). The level of agreement between and presented in Figure 4 has been quantified (linear correlations exceed 0.9 in most cases but will depend on the data foundation) and demonstrated in both fixed and live brain in a number of studies [59–61] and also in fixed kidney [62]. In the diseased brain, the 1-3-9 method has been validated in an animal model of stroke [63, 64] and was found to yield diffusion and kurtosis lesions in good agreement with conventional DKI. Similarly, strong correlations between the diffusion-kurtosis stroke lesion mismatch obtained from 1-3-9 and conventional DKI was shown [63]. Additionally, was found to be the most sensitive parameter for revealing acute ischemic injury in an analysis also including axial and radial kurtosis [64]. This is important because can be reconstructed almost instantly once acquisition is complete, making this most sensitive parameter immediately available e.g., for clinical decision making. In the same study [64], the contrast to noise ratio (CNR) of estimated from fast DKI was found to be significantly higher than for conventional DKI. Importantly, the fast DKI CNR efficiency (CNR per unit scan time) was shown to be twice that of conventional DKI. The authors conclude that the fast kurtosis method captures heterogeneous diffusion and kurtosis lesions in acute ischemic stroke, and thus is suitable for translational applications. The rapidly obtainable is therefore by now established as a biomarker offering the same information as the conventional in normal tissue and stroked brain. Strictly speaking, the methods await similar validation in other pathologies but is now recognized as an independent marker and not merely a rapidly obtainable surrogate for . Recent clinical studies have employed the 1-3-9 method for glioma grading [65], for studying the effect of crack cocaine addiction [66], and in mild traumatic brain injury patients [12]. Preliminary results in stroke patients was presented in Li et al. [67] obtained using a combination of the 1-3-9 technique and the simultaneous multislice imaging (SMS) technique [68].
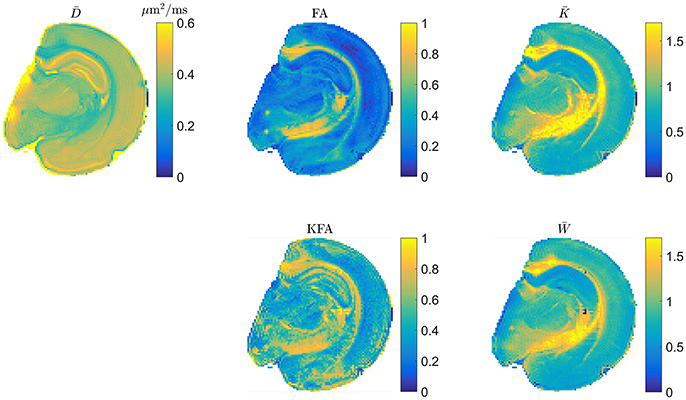
Figure 4. Example maps of typical DTI and DKI parameters in fixed rat brain. The two mean kurtosis definitions are shown and seen to provide similar contrast. Figure adapted from Hansen and Jespersen [37] with permission.
Fast Kurtosis Estimation with Increased Experimental Robustness
The 1-3-9 method relies heavily on the nine direction scheme being precisely met. Encoding may, however, be imperfect causing deviations from the encoding scheme required for Equation (2.3.4) to hold. Such encoding errors may have a number of causes such as gradient non-linearities, eddy currents, contributions from gradient cross-terms and coregistration due to subject movement. While not explored initially, subsequent analysis of these effects showed the 1-3-9 scheme to be quite sensitive to severe encoding deviations. A simple remedy was demonstrated in Hansen et al. [41] where the 1-3-9 scheme was extended so that all of the nine directions in Table 1 are acquired at the two non-zero b-values, b1 and b2. This so-called 1-9-9 version of fast DKI achieves increased experimental robustness by forming Equation (2.3.4) at two distinct b-values, b1 and b2:
producing a set of two equations with two unknowns, and , for which closed for solutions are readily obtained so that the 1-9-9 estimate for is:
and for :
For precise encoding, i.e., when effective b-values are constant among directions on each encoding shell and encoding directions follow the prescribed directions, the 1-3-9 and 1-9-9 schemes produce very similar appearing maps as shown in Figure 5, where estimates of and from a full DKI data set can be compared to estimates obtained with 1-3-9 and 1-9-9 in the same normal human brain. The effect of the 1-9-9 method's increased data foundation is apparent when comparing the schemes' robustness to experimental imperfections: numerical analysis reveals that the 1-9-9 scheme has precision similar to nonlinear least squares (NLS) fitting to large data sets, vastly outperforming the 1-3-9 scheme [41]. The effects of imperfect encoding was also addressed in a series of simulations showing that the 1-9-9 estimation quality (evaluated as the %-error compared to the ground truth value) remains below 10% even when b-values vary by as much as 10% among directions and the within-shell encoding directions deviate up to 10° from the prescribed directions. For the 1-3-9 scheme, these conditions cause estimates to deviate on the order of 15%. These results indicate that the 1-9-9 method is robust to most real-world encoding imperfections and even to effects from subject movement, where coregistration will cause b-matrices to require rotation. Nevertheless, a post-hoc correction scheme was also proposed and demonstrated to repair effects of even severe encoding faults [41].
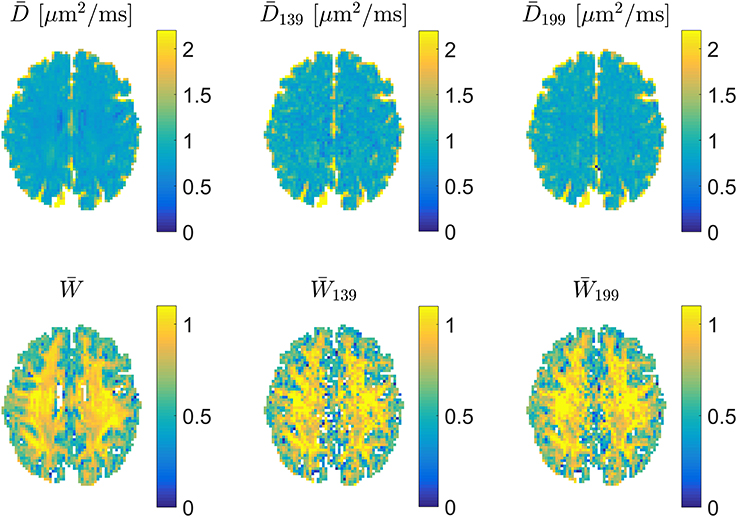
Figure 5. Examples of estimates of mean diffusivity (Top) and (Bottom). In each row estimates were obtained (left to right) from a large DKI data set, a 1-3-9 acquisition, and a 1-9-9 data set. Figure adapted from Hansen et al. [41] with permission.
Recommended b-values for both the 1-3-9 and 1-9-9 schemes are b1 ≈ 1 ms/μm2 and b2 ≈ 2.5 ms/μm2, but the experimental and numerical b-value optimization in Hansen et al. [41] showed that precise matching to these two b-values was not critical. These values are achievable on most if not all gradient systems while also keeping the echo time sufficiently short to retain good SNR even at b2. The analysis in Hansen et al. [41] showed that the recommended b-values are (perhaps surprisingly) suitable for both in vivo (37°C) and ex vivo (21°C) work. These b-values were used with the 1-9-9 method in an animal model of stroke, where a relaxation-based normalization method was introduced to enable automatic segmentation of kurtosis lesions [69]. Nevertheless, optimal b-values may vary between brain regions, and example data sets for region specific b-value optimization are freely available as described in Hansen et al. [70].
Increasing the number of data points from 13 (1-3-9) to 19 (1-9-9) also makes possible estimation of the full diffusion tensor (with fitting) from which all DTI metrics can then be calculated. As a rapid alternative, FA estimation from 1-9-9 data was also proposed based on the variance (var) of over the 9 sampling directions (the expression is exactly FA for complete sampling of the sphere):
Here the values over the nine directions are calculated using both non-zero b-values as in Jensen et al. [58] so that the directional kurtosis is included to improve estimation [57]. FA maps obtained in this manner were found to correlate strongly (average correlation was 0.77 ± 0.04 across three subjects) with ground truth FA from a large data set. Code enabling automatic parameter map calculation from 1-3-9 and 1-9-9 data during image reconstruction on Siemens systems is available as described in Hansen et al. [41]. The data examples shown in Figures 4, 5 were produced from non-preprocessed data and so the maps in Figure 5 illustrate the map quality one might expect to achieve with online parameter calculation. For offline dMRI data preprocessing and analysis (including DKI and WMTI) a number of toolboxes are available e.g., Diffusion Kurtosis Estimator (DKE: http://academicdepartments.musc.edu/cbi/dki/dke.html), the Dipy library in python [71] (http://nipy.org/dipy/), MRTrix (http://www.mrtrix.org), some of which also include estimation of and kurtosis fractional anisotropy (KFA, see Equation (2.5.5) and the related text).
Recent work on efficient experimental designs for estimating the isotropic part of higher-order tensors [72], suggests that the 9 directions of the 1-3-9 and 1-9-9 designs can be reduced to 7 for an even more economical version of fast mean kurtosis imaging.
Axisymmetric DKI
As mentioned in the introduction, DKI parameters other than mean kurtosis are available, e.g., the kurtosis along the primary eigenvector (axial kurtosis) and perpendicular to it (radial kurtosis). Furthermore, modeling based WM characterization such as WMTI provides other valuable markers, but requires knowledge of the full diffusion and kurtosis tensors. It is therefore desirable to be able to estimate these valuable markers from fast protocols. Since the number of free parameters in the conventional DKI signal equation amounts to 22 (Equation 2.1.1), the 1-9-9 protocol does not provide enough data points to support estimation of D and W from fitting. For estimation of D and W from reduced data sets (say a 1-9-9 acquisition, but in principle it could be other low angular resolution DKI acquisitions), a substantial reduction of parameters in the DKI signal expression would be needed. An effective strategy to achieve such a reduction was proposed in Hansen et al. [42], and builds on the observation that if the system is assumed to possess axial symmetry, the apparent kurtosis can be expressed by only three independent parameters: letting ẑ be parallel to the symmetry axis, is characterized by , W|| = W(ẑ) (axial kurtosis), and W⊥ (radial kurtosis). Stated in terms of the diffusion tensor eigenvectors ( in decreasing order of the eigenvalues as above), the tensor-based directional kurtosis parameters are defined to be:
Comparing these definitions to the conventional directional kurtosis parameter definitions in Equation (2.1.4) shows so that only for isotropic media K|| = W||. Rescaling of the axial and radial tensor kurtosis is convenient and causes the axial kurtosis definitions to become identical but radial kurtosis as defined in Equation (2.5.1) is in general different from the convention in Equation (2.1.4), unless there is axial symmetry [42].
The assumption of axial symmetry requires the axis of symmetry to be specified with respect to the lab frame, which adds two angles, resulting in a total of only 5 parameters needed to fully describe an axisymmetric kurtosis tensor. Under axisymmetry, D and W share their symmetry axis so that D only adds two parameters. Finally, signal normalization adds one parameter, producing a total of eight free parameters for axisymmetric DKI [42]. Even in regions where axial symmetry is unlikely to hold in reality, the simplified DKI signal expression thus obtained yields reliable estimates of mean and directional kurtosis and diffusion metrics [42]. Not only does this open the possibility of estimation of all DTI and DKI metrics from small DKI data sets such as those acquired with the 1-9-9 scheme, the axisymmetric DKI framework also allows direct (no fitting) estimation of tensor-based directional kurtosis parameters in regions with a well-defined axis of symmetry (i.e., known pricipal axis) such as large peripheral nerves and spinal cord. This is readily seen in Equation (2.5.1) for W|| = W(ẑ) and from the rightmost expression for W⊥. Software for axisymmetric DKI analysis is freely available on our group homepage: http://cfin.au.dk/cfinmindlab-labs-research-groups/neurophysics/software.
Fast Estimation of White Matter Biomarkers Using Axisymmetic DKI
Axisymmetric DKI makes it possible to estimate D and W from small data sets. A natural next step is to use this framework to provide a fast variant of the technique for assessment of WM tract integrity metrics (WMTI) proposed in Fieremans et al. [2, 51]. In its original form, WMTI adds an analysis step so that in addition to the data acquisition and data processing related to conventional DKI, WMTI also requires a rather time-consuming pixel-by-pixel estimation procedure including numerical optimization. With the assumption of axial symmetry and fully aligned axons, both the data requirement and computational load can be reduced significantly. This is achieved by establishing closed form solutions for all WMTI parameters based on the axisymmetric DKI parameters directly. In this manner, only one optimization procedure is needed for the WMTI analysis, the initial fitting to Equation (2.1.1) or its axisymmetric counterpart. The expressions for the biophysical parameters that describe the axonal system are obtained from this relationship for 2-compartment Gaussian systems [43]:
When evaluated along the radial and axial directions and with averaging over all directions, these general expressions yield directional diffusivities and kurtoses from which expressions for AWF = f, Da, De,⊥, and De,|| can be derived [38]:
where it was used that Da⊥ = 0 for parallel sticks. It is readily seen that the left-hand sides of Equation (2.5.3) can be determined using parameters obtained directly from an axially symmetric DKI fit as well as from a general DKI fit.
Of the five equations in Equation (2.5.3), only 4 of the equations are actually independent (i.e., they have only four unknowns due to the assumption of parallel axons with radius zero), so that one equation can be omitted. In Hansen et al. [42] was found to be more robustly estimated from 1-9-9 than W||. We therefore advice to omit Equation (2.5.3d) which contains the slightly noisier W||. In this way, closed form expressions for the WMTI parameters can be established based on Equations (2.5.3a,b,c,e):
These expressions clearly show the existence of a sign ambiguity which affects the estimates of De,|| (and consequently α) and Da [2]. Determining which of these two “branches” yields physically correct parameter estimates has been subject of some debate [38, 73, 74] and is not yet fully resolved. In Hansen et al. [38] affected parameters are reported for both branches. The solutions for the two branches are much more obvious than in conventional WMTI, where the sign choice is only known to be stable over diffusion encoding directions for the branch defined by Da ≤ De,|| [2]. WMTI analysis based on modest data makes it feasible to experimentally investigate the unresolved branch duality—e.g., using data acquisitions employing varying diffusion times as in Jespersen et al. [73] which would have been prohibitively time consuming with conventional WMTI. Similarly, the increase in acquisition speed facilitates high resolution data acquisitions for validation purposes or for in vivo applications. High resolution in vivo WMTI based on the 1-9-9 fast DKI protocol is demonstrated in Figure 6 using one of four rats analyzed in Hansen et al. [38]. The advantage of the fast WMTI techniques is evident as the low data requirement allows whole brain coverage at an isotropic resolution of 300 μm to be acquired in 1 h. For ex vivo studies, e.g., for validation studies with subsequent histological analysis, the fast axisymmetric WMTI method enables studies at even higher resolution with high SNR with substantially shorter acquisition times than required for conventional WMTI.
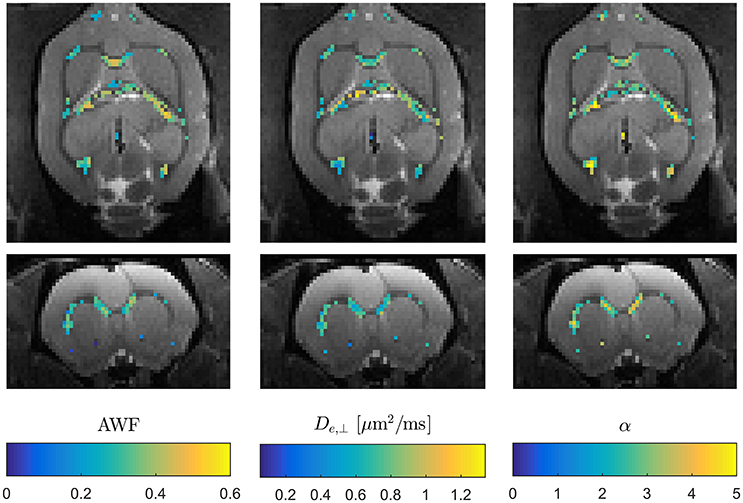
Figure 6. Example of three WMTI parameters mapped in an in vivo rat brain using axisymmetric WMTI analysis of a 1-9-9 data set. Parameters are shown mapped onto b = 0 data in two orthogonal slice orientations. Data was acquired at 300 μm isotropic resolution.
When abandoning the assumption of fully parallel axons, the relationships between the measured diffusion and kurtosis metrics and the microstructural parameters will also involve parameters characterizing the orientation distribution of the axons (fODF) [75]. For axially symmetric systems specifically, these are p2 and p4, the two lowest nontrivial Legendre expansion coefficients of the fODF [73]. Hence in general, there are more unknowns than equations. However, if a one parameter fODF, such as the Watson distribution, can be assumed, p2 and p4 become interdependent and the number of unknowns equals the number of equations, facilitating fast axisymmetric WMTI in the presence of dispersion [73]. Figure 7A (upper row) shows estimates of the time-dependent dispersion [Watson concentration parameter κ (kappa)] of both branches (labeled + and −, shown on the left and right, respectively) measured using such an approach with data acquired from a stimulated echo diffusion-weighted sequence in four regions of interest (ROIs) in in pig spinal cord white matter. The data is from Jespersen et al. [73] with ROI labels matching that work. Figure 7B (lower row) plots time dependence of intra-axonal diffusivity of both branches (again + branch on the left and − branch on the right). As argued in Jespersen et al. [73], these results indicate the most likely choice to be the plus branch Da > De,|| for this data set. In this manner, the framework allows analysis of time dependence of microstructural parameters in both branches in white matter providing further insight into the branch choice.
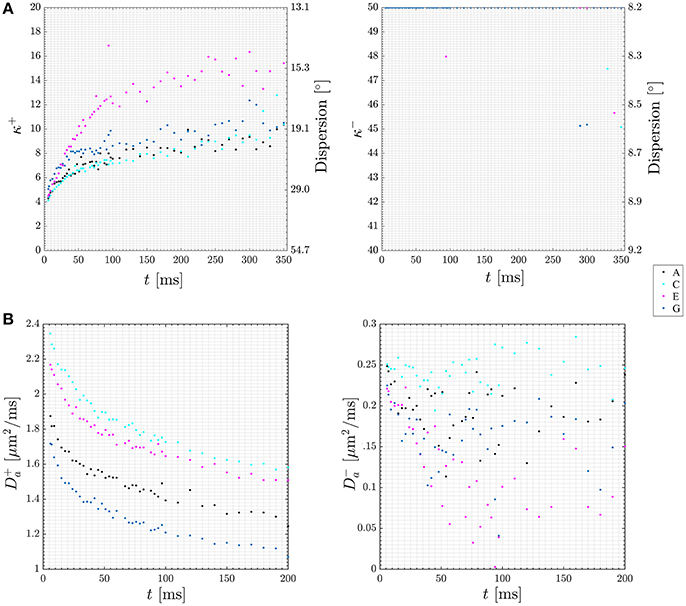
Figure 7. Plots of diffusion time dependence for dispersion (A) and intra-axonal diffusivity (Da, B) in both of the two WMTI solution branches (labeled + and −). Data points are color coded to four ROIs in the pig spinal cord used for this experiment. The ROIs are labeled A, C, E, G in keeping with Jespersen et al. [73] where the data was first presented. Figure adapted from Jespersen et al. [73] with permission.
Other metrics suitable for WM characterization are available from DKI, e.g., the kurtosis fractional anisotropy (KFA) introduced in Hansen et al. [39] and Jespersen [76] in complete analogy to FA (Equation 2.1.2):
where double bars ||·|| signify the Frobenius norm of the tensor and 𝕀 is the fully symmetric isotropic tensor. This metric describes the ratio of the size of the anisotropic part of W to the Frobenius norm of the full W and thus assumes values in the range 0–1 without the need for rescaling to this range as done for FA (Equation 2.1.2). KFA can be estimated in any region but is likely to be of most interest in anisotropic tissues and in regions where more than one dominant fiber orientation exists. KFA was investigated using simulations and human brain data in Hansen and Jespersen [37] and Glenn et al. [61] and found to provide contrast in regions where complex WM fiber composition causes the FA to vanish, manifesting as dark bands in the FA maps in Figure 8. This is because D cannot resolve more than one primary direction and is related to the well-known crossing fiber problem in DTI. Since KFA does not vanish when 2 or 3 fiber bundles cross, KFA may aid in identifying regions where low FA is due to fiber complexity. The maps from normal human brain shown in Figure 8 allow comparison of FA and KFA contrast in three consecutive slices. Evidently, KFA provides a different contrast than FA. Such additional information from W may be used to increase the robustness of diffusion tensor tractography in complex fiber arrangements. In Hansen and Jespersen [37] KFA was explored further using data from various model systems and KFA estimation by proxy was tested. With sufficient SNR, the proxy was found to agree very well with true KFA even for estimates based on a 1-9-9 data set. However, the SNR required (>100) for this strategy is unrealistic for practical purposes. A strategy for KFA estimation from small data sets based on an axisymmetric W was evaluated in Hansen et al. [38], but here KFA contrast deteriorates due to the symmetry imposed on W. At present, therefore, KFA can only be reliably estimated based on conventional DKI acquisitions and post-processing yielding the full W tensor with no symmetry constraints.
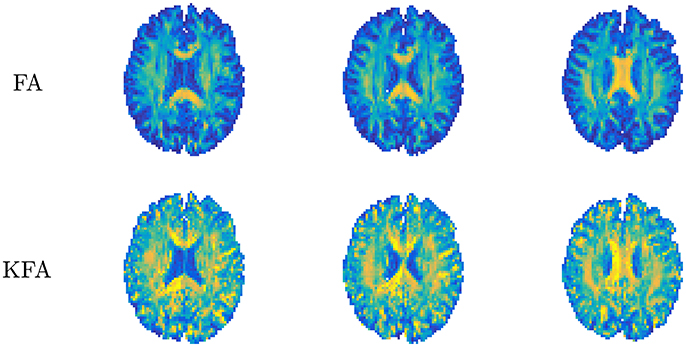
Figure 8. Comparison of diffusion tensor derived fractional anisotropy (FA, upper row) and kurtosis fractional anisotropy (KFA). Contrast differences are evident with FA being uninformative in certain white matter regions (dark bands). Conversely, KFA remains informative in these regions. Figure adapted from Hansen and Jespersen [37] with permission.
Summary of Parameter Definitions
In addition to allowing fast estimation, the tensor-based kurtosis metrics covered above also bring DKI metrics onto a form more analogous to their DTI counterparts. This feature is evident in Table 2 which summarizes the definitions for each of the corresponding parameters derived from D and W. Note that the different ranks of D and W cause some definitions to differ by a scaling factor, nevertheless the analogy is obvious in most cases with the notable exception being radial kurtosis in the principal diffusion tensor frame, which cannot be formed from the two non-primary axis directions alone but also contains a crossterm (Wxxyy). For completeness, we also note that other mean kurtosis definitions than those shown in Table 2 have been proposed such as the generalized kurtosis (GK) and the generalized kurtosis of the norm (GKN) [77] which reflect the kurtosis of the diffusion propagator obtained from q-space data based on concepts from multivariate statistics [78].
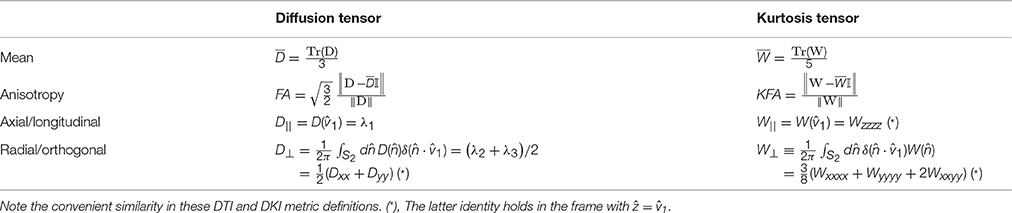
Table 2. Summary of the fast kurtosis metrics definitions and their DTI counterparts.
Future Directions for the Fast Kurtosis Techniques
Imaging of tissue microstructure has been a strong motivation for diffusion MRI research since the technique was introduced. Since then, studies aimed at improving our ability to image tissue microstructure have focused on understanding cellular-level diffusion properties by MR microscopy in an effort to inform modeling [79–85], and modeling aimed at extracting specific cytoarchitectural measures [86, 87]. A common limitation of these methods is the requirement for strong gradients. In contrast, DKI yields valuable reporters of tissue microstructure (although most frequently unspecific) while remaining feasible on clinical systems, even those with modest gradient capability. However, acquisition and post-processing time are often limiting factors for clinical imaging and therefore may impede routine clinical application of DKI. Therefore, rapid DKI acquisitions with fast post-processing are important for further clinical adaptation of DKI. Preclinically, the mentioned time constraints are perhaps not as severe. However, the low data requirement of the 1-3-9/1-9-9 protocols enables higher spatial resolution or higher SNR in the same (or less) scan time as conventional DKI acquisitions, which is certainly a significant benefit for all areas of DKI related research. Furthermore, fast DKI may become increasingly valuable in preclinical studies as imaging of awake animals becomes more widely used to avoid physiological perturbations caused by either inhaled or injected anesthesia [88, 89]. Here, methods with modest data demand are preferable to reduce animal stress and to afford data acquisition with gating or even reacquisition if data is affected by movement.
Despite its sensitivity, DKI is microstructurally unspecific, causing studies with comparison of DKI metrics to histology to be needed to understand how disease related microstructural alterations are reflected in DKI (regardless of metric definitions and acquisition methods). Such studies have been carried out for experimental stroke [5, 90], stress and depression [60, 91], and kidney fibrosis [62] to name a few. Furthermore, studies have been performed to elucidate the relation between DKI metrics and tissue magnetic susceptibility [92, 93] with results suggesting a susceptibility contribution in DKI metrics warranting further investigation. Similarly, studies have been performed to optimize diffusion sampling schemes for DKI [3] and to assess the DKI metric reproducibility across field strengths [94]. Field strength dependence was found to be most pronounced for KFA which is known to be more SNR dependent than the remaining DKI metrics [37, 61]. In validation studies, high resolution is often desirable in order to identify specific regions or sub-regions, since varying response is sometimes seen in sub-regions as for example in the hippocampus in relation to stress [60, 95]. In such cases, the fast DKI methods are convenient to ensure reasonable scan time for high resolution data acquisitions.
The fast kurtosis methods are already used for imaging of experimental stroke [63, 64] and with the developments in Hansen et al. [38, 42], axial and radial kurtosis can also be investigated from fast DKI data along with WMTI parameters, e.g., for detection of axonal beading [96]. Fast kurtosis imaging is also convenient for studies of the diffusion time dependence of DKI and WMTI parameters. Such experiments are expected to provide a deeper understanding of the WMTI branch ambiguity explored in Hansen et al. [38] by making use of the theoretically expected diffusion time dependence [73].
An intriguing prospect of the fast DKI methods is the combination with SNR-efficient, rapid imaging techniques such as simultaneous multislice imaging (SMS) [68]. Combined with slice dithered enhanced resolution (gSlider), SMS can in principle be used to acquire diffusion MRI with sub-millimeter resolution on clinical systems, although so far demonstrations have used non-standard, high-performance gradient sets [97]. The combination of these fast imaging techniques and fast kurtosis methods would make it feasible to acquire high resolution DKI and WMTI data sets in clinically feasible acquisition times and might even be used for acquisition of time series data so that 1-9-9 data sets can be acquired with high (sub-minute) sliding window temporal resolution. Such data sets may then form the basis for analysis with the presented techniques, yielding time series data of DKI metrics (e.g., mean, radial and axial kurtosis for use in the study of GM plasticity 98) and WM biomarkers for high sensitivity studies of WM plasticity [99, 100]. Other future applications might include combination of the 1-9-9 framework with diffusion weighted spectroscopy. With such data sets from cell-specific reporter molecules, such as NAA for neurons or myo-inositol for glia, the intra-cellular environment could be selectively probed to non-invasively assess cellular mechanisms in a number of neurological diseases, e.g., stroke as done in Shemesh et al. [101].
In conclusion, DKI is a non-invasive imaging technique with high sensitivity to microstructural alterations in biological tissue and has demonstrated value in a number of neuroscientific and clinical contexts. Methods now exist which enable rapid estimation of the full range of DKI parameters facilitating routine clinical use of DKI and WMTI.
Author Contributions
BH and SNJ developed fast kurtosis methods, BH wrote the paper, BH and SNJ edited the paper.
Funding
The authors were supported by the Danish Ministry of Science, Technology and Innovation's University Investment Grant (MINDLab, Grant no. 0601-01354B). The authors acknowledge support from NIH 1R01EB012874-01 (BH), Lundbeck Foundation R83-A7548 (SNJ) and the Augustinus Foundation (BH). The 9.4T lab was funded by the Danish Research Council's Infrastructure program, the Velux Foundations, and the Department of Clinical Medicine, AU. The 3T Magnetom Tim Trio was funded by a grant from the Danish Agency for Science, Technology and Innovation.
Conflict of Interest Statement
The authors declare that the research was conducted in the absence of any commercial or financial relationships that could be construed as a potential conflict of interest.
Acknowledgments
The authors are grateful for assistance and input from all our coauthors in the development of the fast kurtosis techniques. Reviewers also provided valuable suggestions in the publication process of all studies.
References
1. Jensen JH, Helpern JA, Ramani A, Lu H, Kaczynski K. Diffusional kurtosis imaging: the quantification of non-gaussian water diffusion by means of magnetic resonance imaging. Magn Reson Med. (2005) 53:1432–40. doi: 10.1002/mrm.20508
2. Fieremans E, Jensen JH, Helpern JA. White matter characterization with diffusional kurtosis imaging. Neuroimage (2011) 58:177–88. doi: 10.1016/j.neuroimage.2011.06.006
3. Poot DH, den Dekker AJ, Achten E, Verhoye M, Sijbers J. Optimal experimental design for diffusion kurtosis imaging. IEEE Trans Med Imaging. (2010) 29:819–29. doi: 10.1109/TMI.2009.2037915
4. Hui ES, Fieremans E, Jensen JH, Tabesh A, Feng W, Bonilha L, et al. Stroke assessment with diffusional kurtosis imaging. Stroke (2012) 43:2968–73. doi: 10.1161/STROKEAHA.112.657742
5. Weber RA, Hui ES, Jensen JH, Nie X, Falangola MF, Helpern JA, et al. Diffusional kurtosis and diffusion tensor imaging reveal different time-sensitive stroke-induced microstructural changes. Stroke (2015) 46:545–50. doi: 10.1161/STROKEAHA.114.006782
6. Falangola MF, Jensen JH, Tabesh A, Hu C, Deardorff RL, Babb JS, et al. Non-Gaussian diffusion MRI assessment of brain microstructure in mild cognitive impairment and Alzheimer's disease. Magn Reson Imaging. (2013) 31:840–6. doi: 10.1016/j.mri.2013.02.008
7. Inglese M, Bester M. Diffusion imaging in multiple sclerosis: research and clinical implications. NMR Biomed. (2010) 23:865–72. doi: 10.1002/nbm.1515
8. Van Cauter S, Veraart J, Sijbers J, Peeters RR, Himmelreich U, De Keyzer F, et al. Gliomas: diffusion kurtosis MR imaging in grading. Radiology (2012) 263:492–501. doi: 10.1148/radiol.12110927
9. Bai Y, Lin Y, Tian J, Shi D, Cheng J, Haacke EM, et al. Grading of Gliomas by Using Monoexponential, Biexponential, and Stretched Exponential Diffusion-weighted MR Imaging and Diffusion Kurtosis MR Imaging. Radiology (2016) 278:496–504. doi: 10.1148/radiol.2015142173
10. Grossman EJ, Ge Y, Jensen JH, Babb JS, Miles L, Reaume J, et al. Thalamus and cognitive impairment in mild traumatic brain injury: a diffusional kurtosis imaging study. J Neurotrauma. (2012) 29:2318–27. doi: 10.1089/neu.2011.1763
11. Grossman EJ, Jensen JH, Babb JS, Chen Q, Tabesh A, Fieremans E, et al. Cognitive impairment in mild traumatic brain injury: a longitudinal diffusional kurtosis and perfusion imaging study. AJNR Am J Neuroradiol. (2013) 34:951–7. doi: 10.3174/ajnr.A3358
12. Næss-Schmidt E, Blicher JU, Eskildsen SF, Tietze A, Østergaard L, Stubbs P, et al. Microstructural changes in the thalamus after mild traumatic brain injury – a longitudinal diffusion and mean kurtosis tensor MRI study. Brain Injury. (2016) 31:230–6. doi: 10.1080/02699052.2016.1229034
13. Ostergaard L, Engedal TS, Aamand R, Mikkelsen R, Iversen NK, Anzabi M, et al. Capillary transit time heterogeneity and flow-metabolism coupling after traumatic brain injury. J Cereb Blood Flow Metab. (2014) 34:1585–98. doi: 10.1038/jcbfm.2014.131
14. Falangola MF, Jensen JH, Babb JS, Hu C, Castellanos FX, Di Martino A, et al. Age-related non-Gaussian diffusion patterns in the prefrontal brain. J Magn Reson Imaging (2008) 28:1345–50. doi: 10.1002/jmri.21604
15. Paydar A, Fieremans E, Nwankwo JI, Lazar M, Sheth HD, Adisetiyo V, et al. Diffusional kurtosis imaging of the developing brain. AJNR Am J Neuroradiol. (2014) 35:808–14. doi: 10.3174/ajnr.A3764
16. Gong NJ, Wong CS, Chan CC, Leung LM, Chu YC. Aging in deep gray matter and white matter revealed by diffusional kurtosis imaging. Neurobiol Aging. (2014) 35:2203–16. doi: 10.1016/j.neurobiolaging.2014.03.011
17. Jelescu IO, Veraart J, Adisetiyo V, Milla SS, Novikov DS, Fieremans E. One diffusion acquisition and different white matter models: how does microstructure change in human early development based on WMTI and NODDI? NeuroImage (2015) 107:242–56. doi: 10.1016/j.neuroimage.2014.12.009
18. Fieremans E, Benitez A, Jensen JH, Falangola MF, Tabesh A, Deardorff RL, et al. Novel white matter tract integrity metrics sensitive to Alzheimer disease progression. AJNR Am J Neuroradiol. (2013) 34:2105–12. doi: 10.3174/ajnr.A3553
19. Benitez A, Fieremans E, Jensen JH, Falangola MF, Tabesh A, Ferris SH, et al. White matter tract integrity metrics reflect the vulnerability of late-myelinating tracts in Alzheimer's disease. Neuroimage Clin. (2014) 4:64–71. doi: 10.1016/j.nicl.2013.11.001
20. Davenport EM, Apkarian K, Whitlow CT, Urban JE, Jensen JH, Szuch E, et al. Abnormalities in Diffusional Kurtosis Metrics Related to Head Impact Exposure in a Season of High School Varsity Football. J Neurotrauma. (2016) 33:2133–46. doi: 10.1089/neu.2015.4267
21. de Kouchkovsky I, Fieremans E, Fleysher L, Herbert J, Grossman RI, Inglese M. Quantification of normal-appearing white matter tract integrity in multiple sclerosis: a diffusion kurtosis imaging study. J Neurol. (2016) 263:1146–55. doi: 10.1007/s00415-016-8118-z
22. Lazar M, Miles LM, Babb JS, Donaldson JB. Axonal deficits in young adults with High Functioning Autism and their impact on processing speed. Neuroimage Clin. (2014) 4:417–25. doi: 10.1016/j.nicl.2014.01.014
23. Guglielmetti C, Veraart J, Roelant E, Mai Z, Daans J, Van Audekerke J, et al. Diffusion kurtosis imaging probes cortical alterations and white matter pathology following cuprizone induced demyelination and spontaneous remyelination. Neuroimage (2016) 125:363–77. doi: 10.1016/j.neuroimage.2015.10.052
24. Jelescu IO, Zurek M, Winters KV, Veraart J, Rajaratnam A, Kim NS, et al. In vivo quantification of demyelination and recovery using compartment-specific diffusion MRI metrics validated by electron microscopy. Neuroimage (2016) 132:104–14. doi: 10.1016/j.neuroimage.2016.02.004
25. Falangola MF, Guilfoyle DN, Tabesh A, Hui ES, Nie X, Jensen JH, et al. Histological correlation of diffusional kurtosis and white matter modeling metrics in cuprizone-induced corpus callosum demyelination. NMR Biomed. (2014) 27:948–57. doi: 10.1002/nbm.3140
26. Kelm ND, West KL, Carson RP, Gochberg DF, Ess KC, Does MD. Evaluation of diffusion kurtosis imaging in ex vivo hypomyelinated mouse brains. Neuroimage (2016) 124(Pt A):612–26. doi: 10.1016/j.neuroimage.2015.09.028
27. Jensen JH, McKinnon ET, Russell Glenn G, Helpern JA. Evaluating kurtosis-based diffusion MRI tissue models for white matter with fiber ball imaging. NMR Biomed. (2017) 30:e3689. doi: 10.1002/nbm.3689
28. Hui ES, Russell Glenn G, Helpern JA, Jensen JH. Kurtosis analysis of neural diffusion organization. Neuroimage (2015) 106:391–403. doi: 10.1016/j.neuroimage.2014.11.015
29. Rosenkrantz AB, Padhani AR, Chenevert TL, Koh DM, De Keyzer F, Taouli B, et al. Body diffusion kurtosis imaging: Basic principles, applications, and considerations for clinical practice. J Magn Reson Imaging. (2015) 42:1190–202. doi: 10.1002/jmri.24985
30. Sheng RF, Wang HQ, Yang L, Jin KP, Xie YH, Chen CZ, et al. Diffusion kurtosis imaging and diffusion-weighted imaging in assessment of liver fibrosis stage and necroinflammatory activity. Abdom Radiol (NY). (2017) 42:1176–82. doi: 10.1007/s00261-016-0984-4
31. Budjan J, Sauter EA, Zoellner FG, Lemke A, Wambsganss J, Schoenberg SO, et al. Diffusion kurtosis imaging of the liver at 3 Tesla: in vivo comparison to standard diffusion-weighted imaging. Acta Radiol. (2017). doi: 10.1177/0284185117706608. [Epub ahead of print].
32. Pentang G, Lanzman RS, Heusch P, Muller-Lutz A, Blondin D, Antoch G, et al. Diffusion kurtosis imaging of the human kidney: a feasibility study. Magn Reson Imaging (2014) 32:413–20. doi: 10.1016/j.mri.2014.01.006
33. Huang Y, Chen X, Zhang Z, Yan L, Pan D, Liang C, et al. MRI quantification of non-Gaussian water diffusion in normal human kidney: a diffusional kurtosis imaging study. NMR Biomed. (2015) 28:154–61. doi: 10.1002/nbm.3235
34. Suo S, Chen X, Wu L, Zhang X, Yao Q, Fan Y, et al. Non-Gaussian water diffusion kurtosis imaging of prostate cancer. Magn Reson Imaging (2014) 32:421–7. doi: 10.1016/j.mri.2014.01.015
35. Tamura C, Shinmoto H, Soga S, Okamura T, Sato H, Okuaki T, et al. Diffusion kurtosis imaging study of prostate cancer: preliminary findings. J Magn Reson Imaging (2014) 40:723–9. doi: 10.1002/jmri.24379
36. Roethke MC, Kuder TA, Kuru TH, Fenchel M, Hadaschik BA, Laun FB, et al. Evaluation of Diffusion Kurtosis Imaging Versus Standard Diffusion Imaging for Detection and Grading of Peripheral Zone Prostate Cancer. Invest Radiol. (2015) 50:483–9. doi: 10.1097/RLI.0000000000000155
37. Hansen B, Jespersen SN. Kurtosis fractional anisotropy, its contrast and estimation by proxy. Sci Rep. (2016) 6:23999. doi: 10.1038/srep23999
38. Hansen B, Khan AR, Shemesh N, Lund TE, Sangill R, Eskildsen SF, et al. White matter biomarkers from fast protocols using axially symmetric diffusion kurtosis imaging. NMR Biomed. (2017) 30:e3741. doi: 10.1002/nbm.3741
39. Hansen B, Lund TE, Sangill R, Jespersen SN. Experimentally and computationally fast method for estimation of a mean kurtosis. Magn Reson Med. (2013) 69:1754–60. doi: 10.1002/mrm.24743
40. Hansen B, Lund TE, Sangill R, Jespersen SN. Erratum: Hansen, Lund, Sangill, and Jespersen. Experimentally and Computationally Fast Method for Estimation of a Mean Kurtosis. Magn Reson Med. (2013) 69:1754–60. Magn Reson Med. (2014) 71:2250. doi: 10.1002/mrm.25090
41. Hansen B, Lund TE, Sangill R, Stubbe E, Finsterbusch J, Jespersen SN. Experimental considerations for fast kurtosis imaging. Magn Reson Med. (2015) 76:1455–68. doi: 10.1002/mrm.26055
42. Hansen B, Shemesh N, Jespersen SN. Fast imaging of mean, axial and radial diffusion kurtosis. NeuroImage (2016) 142:381–93. doi: 10.1016/j.neuroimage.2016.08.022
43. Jensen JH, Helpern JA. MRI quantification of non-Gaussian water diffusion by kurtosis analysis. NMR Biomed. (2010) 23:698–710. doi: 10.1002/nbm.1518
44. Wu EX, Cheung MM. MR diffusion kurtosis imaging for neural tissue characterization. Nmr Biomed. (2010) 23:836–48. doi: 10.1002/nbm.1506
45. Basser PJ, Mattiello J, LeBihan D. Estimation of the effective self-diffusion tensor from the NMR spin echo. J Magn Reson B. (1994) 103:247–54. doi: 10.1006/jmrb.1994.1037
46. Lazar M, Jensen JH, Xuan L, Helpern JA. Estimation of the Orientation Distribution Function from diffusional kurtosis imaging. Magn Reson Med. (2008) 60:774–81. doi: 10.1002/mrm.21725
47. Basser PJ, Pierpaoli C. Microstructural and physiological features of tissues elucidated by quantitative-diffusion-tensor MRI. J Magn Reson B. (1996) 111:209–19. doi: 10.1006/jmrb.1996.0086
48. Hui ES, Cheung MM, Qi LQ, Wu EX. Advanced MR Diffusion characterization of neural tissue using directional diffusion kurtosis analysis. IEEE Eng Med Bio. (2008) 2008:3941–4. doi: 10.1109/IEMBS.2008.4650072
49. Hui ES, Cheung MM, Qi LQ, Wu EX. Towards better MR characterization of neural tissues using directional diffusion kurtosis analysis. Neuroimage (2008) 42:122–34. doi: 10.1016/j.neuroimage.2008.04.237
50. Novikov DS, Veraart J, Jelescu IO, Fieremans E. Mapping orientational and microstructural metrics of neuronal integrity with in vivo diffusion MRI. ArXiv preprint. (2016) arXiv:1609.09144v1 [physics.bio-ph]
51. Fieremans E, Novikov DS, Jensen JH, Helpern JA. Monte Carlo study of a two-compartment exchange model of diffusion. NMR Biomed. (2010) 23:711–24. doi: 10.1002/nbm.1577
52. Moakher M. Fourth-order cartesian tensors: Old and new facts, notions and applications. Q J Mech Appl Math. (2008) 61:181–203. doi: 10.1093/qjmam/hbm027
54. Chuhutin A, Khan AR, Hansen B, Jespersen SN. The Mean Kurtosis Evaluation Measurements Show a Considerable Disparity from the Analytically Evaluated Ones for a Clinically Used Range of B-Values. Toronto, ON: Proceedings of the ISMRM (2015).
55. Chuhutin A, Shemesh N, Hansen B, Jespersen SN, editors. The Importance of B-Values Selection and the Precision of Diffusion Kurtosis Estimation by the Conventional Schemes. Singapore: ISMRM 2016 (2016).
56. Chuhutin A, Hansen B, Jespersen SN. Precision and accuracy of diffusion kurtosis estimation and the influence of b-value selection. NMR Biomed. (2017). doi: 10.1002/nbm.3777. [Epub ahead of print].
57. Veraart J, Poot DHJ, Van Hecke W, Blockx I, Van der Linden A, Verhoye M, et al. More Accurate Estimation of Diffusion Tensor Parameters Using Diffusion Kurtosis Imaging. Magn Reson Med. (2011) 65:138–45. doi: 10.1002/mrm.22603
58. Jensen JH, Hu C, Helpern JA, editors. Rapid data acquisition and postprocessing for diffusional kurtosis imaging. In: Proceedings of the 17th Annual Meeting of ISMRM. Honolulu, Hawaii (2009).
59. Hansen MB, Jespersen SN, Leigland LA, Kroenke CD. Using diffusion anisotropy to characterize neuronal morphology in gray matter: the orientation distribution of axons and dendrites in the NeuroMorpho.org database. Front Integr Neurosci. (2013) 7:31. doi: 10.3389/fnint.2013.00031
60. Khan AR, Chuhutin A, Wiborg O, Kroenke CD, Nyengaard JR, Hansen B, et al. Biophysical modeling of high field diffusion MRI demonstrates microstructural aberration in chronic mild stress rat brain. Neuroimage (2016) 142:421–30. doi: 10.1016/j.neuroimage.2016.07.001
61. Glenn GR, Helpern JA, Tabesh A, Jensen JH. Quantitative assessment of diffusional kurtosis anisotropy. NMR Biomed. (2015) 28:448–59. doi: 10.1002/nbm.3271
62. Kjolby BF, Khan AR, Chuhutin A, Pedersen L, Jensen JB, Jakobsen S, et al. Fast diffusion kurtosis imaging of fibrotic mouse kidneys. NMR Biomed. (2016) 29:1709–19. doi: 10.1002/nbm.3623
63. Sun PZ, Wang Y, Mandeville E, Chan ST, Lo EH, Ji XM. Validation of fast diffusion kurtosis MRI for imaging acute ischemia in a rodent model of stroke. Nmr Biomed. (2014) 27:1413–8. doi: 10.1002/nbm.3188
64. Wu Y, Kim J, Chan ST, Zhou IY, Guo Y, Igarashi T, et al. Comparison of image sensitivity between conventional tensor-based and fast diffusion kurtosis imaging protocols in a rodent model of acute ischemic stroke. NMR Biomed. (2016) 29:625–30. doi: 10.1002/nbm.3506
65. Tietze A, Hansen MB, Ostergaard L, Jespersen SN, Sangill R, Lund TE, et al. Mean Diffusional Kurtosis in Patients with Glioma: Initial Results with a Fast Imaging Method in a Clinical Setting. AJNR Am J Neuroradiol. (2015) 36:1472–8. doi: 10.3174/ajnr.A4311
66. Garza-Villarreal EA, Chakravarty MM, Hansen B, Eskildsen SF, Devenyi GA, Castillo-Padilla D, et al. The effect of crack cocaine addiction and age on the microstructure and morphology of the human striatum and thalamus using shape analysis and fast diffusion kurtosis imaging. Transl Psychiat. (2017) 7:e1122. doi: 10.1038/tp.2017.92
67. Li C, Qian T, Kim J, Sun PZ, Lu J, Li K. Evaluation of acute cerebral infarction Using a fast kurtosis diffusion imaging protocol. Proc. Intl. Soc. Mag. Reson. Med. (2016) 24:3493.
68. Feinberg DA, Setsompop K. Ultra-fast MRI of the human brain with simultaneous multi-slice imaging. J Magn Reson. (2013) 229:90–100. doi: 10.1016/j.jmr.2013.02.002
69. Zhou IY, Guo Y, Igarashi T, Wang Y, Mandeville E, Chan ST, et al. Fast diffusion kurtosis imaging (DKI) with Inherent COrrelation-based Normalization (ICON) enhances automatic segmentation of heterogeneous diffusion MRI lesion in acute stroke. NMR Biomed. (2016) 29:1670–7. doi: 10.1002/nbm.3617
70. Hansen B, Jespersen SN. Data for evaluation of fast kurtosis strategies, b-value optimization and exploration of diffusion MRI contrast. Sci Data. (2016) 3:160072. doi: 10.1038/sdata.2016.72
71. Garyfallidis E, Brett M, Amirbekian B, Rokem A, van der Walt S, Descoteaux M, et al. Dipy, a library for the analysis of diffusion MRI data. Front Neuroinform. (2014) 8:8. doi: 10.3389/fninf.2014.00008
72. Avram AV, Sarlls JE, Hutchinson E, Basser PJ. Efficient experimental designs for isotropic generalized diffusion tensor MRI (IGDTI). Magn Reson Med. (2017). doi: 10.1002/mrm.26656
73. Jespersen SN, Olesen JL, Hansen B, Shemesh N. Diffusion time dependence of microstructural parameters in fixed spinal cord. Neuroimage (2017). doi: 10.1016/j.neuroimage.2017.08.039. [Epub ahead of print].
74. Jelescu IO, Veraart J, Fieremans E, Novikov DS. Degeneracy in model parameter estimation for multi-compartmental diffusion in neuronal tissue. NMR Biomed. (2016) 29:33–47. doi: 10.1002/nbm.3450
75. Jespersen SN, Leigland LA, Cornea A, Kroenke CD. Determination of axonal and dendritic orientation distributions within the developing cerebral cortex by diffusion tensor imaging. IEEE Trans Med Imaging. (2012) 31:16–32. doi: 10.1109/TMI.2011.2162099
76. Jespersen SN. Equivalence of double and single wave vector diffusion contrast at low diffusion weighting. NMR Biomed. (2012) 25:813–8. doi: 10.1002/nbm.1808
77. Ning L, Westin CF, Rathi Y. Estimating diffusion propagator and its moments using directional radial basis functions. IEEE Trans Med Imaging. (2015) 34:2058–78. doi: 10.1109/TMI.2015.2418674
78. Mardia KV. Measures of Multivariate Skewness and Kurtosis with Applications. Biometrika (1970) 57:519–30. doi: 10.1093/biomet/57.3.519
79. Grant SC, Buckley DL, Gibbs S, Webb AG, Blackband SJ. MR microscopy of multicomponent diffusion in single neurons. Magn Reson Med. (2001) 46:1107–12. doi: 10.1002/mrm.1306
80. Flint JJ, Lee CH, Hansen B, Fey M, Schmidig D, Bui JD, et al. Magnetic resonance microscopy of mammalian neurons. Neuroimage (2009) 46:1037–40. doi: 10.1016/j.neuroimage.2009.03.009
81. Flint JJ, Hansen B, Fey M, Schmidig D, King MA, Vestergaard-Poulsen P, et al. Cellular-level diffusion tensor microscopy and fiber tracking in mammalian nervous tissue with direct histological correlation. Neuroimage (2010) 52:556–61. doi: 10.1016/j.neuroimage.2010.04.031
82. Hansen B, Flint JJ, Heon-Lee C, Fey M, Vincent F, King MA, et al. Diffusion tensor microscopy in human nervous tissue with quantitative correlation based on direct histological comparison. Neuroimage (2011) 57:1458–65. doi: 10.1016/j.neuroimage.2011.04.052
83. Flint JJ, Hansen B, Portnoy S, Lee CH, King MA, Fey M, et al. Magnetic resonance microscopy of human and porcine neurons and cellular processes. Neuroimage (2012) 60:1404–11. doi: 10.1016/j.neuroimage.2012.01.050
84. Lee CH, Flint JJ, Hansen B, Blackband SJ. Investigation of the subcellular architecture of L7 neurons of Aplysia californica using magnetic resonance microscopy (MRM) at 7.8 microns. Sci Rep. (2015) 5:11147. doi: 10.1038/srep11147
85. Flint JJ, Hansen B, Blackband SJ. Diffusion tensor microscopy data (15.6 μm in-plane) of white matter tracts in the human, pig, and rat spinal cord with corresponding tissue histology. Data Brief. (2016) 9:271–4. doi: 10.1016/j.dib.2016.08.020
86. Jespersen SN, Kroenke CD, Ostergaard L, Ackerman JJ, Yablonskiy DA. Modeling dendrite density from magnetic resonance diffusion measurements. Neuroimage (2007) 34:1473–86. doi: 10.1016/j.neuroimage.2006.10.037
87. Jespersen SN, Bjarkam CR, Nyengaard JR, Chakravarty MM, Hansen B, Vosegaard T, et al. Neurite density from magnetic resonance diffusion measurements at ultrahigh field: comparison with light microscopy and electron microscopy. Neuroimage (2010) 49:205–16. doi: 10.1016/j.neuroimage.2009.08.053
88. Ferris CF, Smerkers B, Kulkarni P, Caffrey M, Afacan O, Toddes S, et al. Functional magnetic resonance imaging in awake animals. Rev Neurosci. (2011) 22:665–74. doi: 10.1515/RNS.2011.050
89. Yoshida K, Mimura Y, Ishihara R, Nishida H, Komaki Y, Minakuchi T, et al. Physiological effects of a habituation procedure for functional MRI in awake mice using a cryogenic radiofrequency probe. J Neurosci Meth. (2016) 274:38–48. doi: 10.1016/j.jneumeth.2016.09.013
90. Weber RA, Chan CH, Nie X, Maggioncalda E, Valiulis G, Lauer A, et al. Sensitivity of diffusion MRI to perilesional reactive astrogliosis in focal ischemia. NMR Biomed. (2017) 30:e3717. doi: 10.1002/nbm.3717
91. Khan AR, Chuhutin A, Wiborg O, Kroenke CD, Nyengaard JR, Hansen B, et al. Summary of high field diffusion MRI and microscopy data demonstrate microstructural aberration in chronic mild stress rat brain. Data Brief. (2016) 8:934–7. doi: 10.1016/j.dib.2016.06.061
92. Palombo M, Gentili S, Bozzali M, Macaluso E, Capuani S. New insight into the contrast in diffusional kurtosis images: does it depend on magnetic susceptibility? Magn Reson Med. (2015) 73:2015–24. doi: 10.1002/mrm.25308
93. Farrher E, Lindemeyer J, Grinberg F, Oros-Peusquens AM, Shah NJ. Concerning the matching of magnetic susceptibility differences for the compensation of background gradients in anisotropic diffusion fibre phantoms. PLoS ONE (2017) 12:e0176192. doi: 10.1371/journal.pone.0176192
94. Shaw CB, Jensen JH, Deardorff RL, Spampinato MV, Helpern JA. Comparison of Diffusion Metrics Obtained at 1.5T and 3T in Human Brain With Diffusional Kurtosis Imaging. J Magn Reson Imag (2017) 45:673–80. doi: 10.1002/jmri.25380
95. Vestergaard-Poulsen P, Wegener G, Hansen B, Bjarkam CR, Blackband SJ, Nielsen NC, et al. Diffusion-weighted MRI and quantitative biophysical modeling of hippocampal neurite loss in chronic stress. PLoS ONE (2011) 6:e20653. doi: 10.1371/journal.pone.0020653
96. Budde MD, Frank JA. Neurite beading is sufficient to decrease the apparent diffusion coefficient after ischemic stroke. Proc Natl Acad Sci U S A. (2010) 107:14472–7. doi: 10.1073/pnas.1004841107
97. Setsompop K, Fan Q, Stockmann J, Bilgic B, Huang S, Cauley SF, et al. High-resolution in vivo diffusion imaging of the human brain with generalized slice dithered enhanced resolution: Simultaneous multislice (gSlider-SMS). Magn Reson Med. (2017). doi: 10.1002/mrm.26653. [Epub ahead of print].
98. Sagi Y, Tavor I, Hofstetter S, Tzur-Moryosef S, Blumenfeld-Katzir T, Assaf Y. Learning in the Fast Lane: New Insights into Neuroplasticity. Neuron (2012) 73:1195–203. doi: 10.1016/j.neuron.2012.01.025
99. Hofstetter S, Tavor I, Tzur Moryosef S, Assaf Y. Short-term learning induces white matter plasticity in the fornix. J Neurosci. (2013) 33:12844–50. doi: 10.1523/JNEUROSCI.4520-12.2013
100. Metzler-Baddeley C, Foley S, de Santis S, Charron C, Hampshire A, Caeyenberghs K, et al. Dynamics of white matter plasticity underlying working memory training: multimodal evidence from diffusion MRI and T2 relaxometry. J Cogn Neurosci. (2017)29:1509–20. doi: 10.1162/jocn_a_01127
Keywords: MRI, diffusion, kurtosis, higher-order tensors, orientational sampling, WMTI
Citation: Hansen B and Jespersen SN (2017) Recent Developments in Fast Kurtosis Imaging. Front. Phys. 5:40. doi: 10.3389/fphy.2017.00040
Received: 12 July 2017; Accepted: 30 August 2017;
Published: 15 September 2017.
Edited by:
Federico Giove, Centro Fermi, ItalyReviewed by:
Lipeng Ning, Brigham and Women's Hospital, United StatesMarco Palombo, University College London, United Kingdom
Copyright © 2017 Hansen and Jespersen. This is an open-access article distributed under the terms of the Creative Commons Attribution License (CC BY). The use, distribution or reproduction in other forums is permitted, provided the original author(s) or licensor are credited and that the original publication in this journal is cited, in accordance with accepted academic practice. No use, distribution or reproduction is permitted which does not comply with these terms.
*Correspondence: Brian Hansen, brian@cfin.au.dk
Sune N. Jespersen, sune@cfin.au.dk