Radiotherapy Risk Estimation Based on Expert Group Survey
- 1Department of Physics, University of South Florida, Tampa, FL, United States
- 2Department of Radiation Oncology, Kyung Hee University Medical Center, Seoul, South Korea
- 3Proton Therapy Center, National Cancer Center Korea, Goyang, South Korea
- 4Department of Radiation Oncology, Hallym University College of Medicine, Seoul, South Korea
- 5Department of Radiation Oncology, Myongji Hospital, Goyang, South Korea
- 6Department of Radiation Oncology, Chungnam National University Hospital, Daejeon, South Korea
- 7Department of Radiation Oncology, Yonsei Cancer Center, Yonsei University College of Medicine, Seoul, South Korea
Although current quality assurance systems such as Task Group 142 of the American Association of Physicists in Medicine and other methods used for radiotherapy have greatly contributed to decreasing radiotherapy incidents, there is still scope for improvement. In this study, we attempted to evaluate the reliability of the risk priority number, which was suggested by the AAPM Task Group 100, when it was calculated by an expert group in Korea. By doing this, we aimed at providing preliminary data for applying Failure Modes and Effect Analysis (FMEA), a systematic approach to identify potential failures in Korea. For this purpose, 1,163 incidents data in the Radiation Oncology Safety Information System (ROSIS) database were used. The incident data were categorized into 144 items to create a questionnaire. The expert group consisted of 19 physicists who evaluated the occurrence (O), severity (S), and detectability (D) of each item on a scale from 1 to 10 according to the AAPM Task Group 100. Among these three factors, the values of “O × D” were compared with ROSIS data. When comparing the O × D value between the items ranked in the top 10 of the survey and ROSIS data, no items were duplicated, and “simulation” and “treatment” were most frequent among, in total, eight processes. The average difference of O × D between the survey and ROSIS data was 0.8 ± 1.5, and this difference barely followed a Gaussian distribution. The results of this work indicates that FMEA is a good predictor, but that there were still deviations between actual risk and expectations in some cases, because actual incidents are multifactorial rather than simply proportional to D and O. Further research on radiotherapy risk estimation is needed.
Introduction
Advances in radiotherapy techniques have enabled high-precision radiotherapy, which minimizes the unnecessary irradiation of unaffected tissue surrounding the target volume [1, 2]. However, advanced technology has not only brought clinical advantages, but also come with the needs for more precise, unfailing delivery. Therefore, an incident prevention program is necessary in radiotherapy, as in other high technology applications, because a small incident in such an industry can cause fatal results [3, 4]. There is no doubt that a quality assurance system such as the International Atomic Energy Agency's “A Handbook for Teachers and Students,” European Radiation Protection Agency Report # 91 (RP-91), and the American Association of Physicists in Medicine TG-142 have greatly contributed to reducing the radiation therapy accidents. Furthermore, several international external quality audit program are running to improve the safety culture in radiotherapy, too [5–7]. Furthermore, several international external quality audit program are running to improve the safety culture in radiotherapy [8–11]. However, there still exist potential risks in the radiotherapy process, requiring improvement in the radiotherapy-related risk management. [12]. First, QA systems mainly check hardware problems, and therefore it is difficult to prevent non-hardware problems such as systemic error or human error, which are the leading causes of incidents [13, 14]. The radiotherapy procedure consists of several steps, each of which uses complex technology involving multidisciplinary members (medical doctor, nurse, radiation therapist, medical physicist, dosimetrist, etc.,). Thus, it is difficult to ensure safety and quality of treatment when only technical problems are checked. Second, current QA protocols are laborious and time-consuming, as they contain too many items to be checked on a routine basis. Therefore, a different QA method is necessary to thoroughly and effectively reduce the possibility of radiotherapy incidents.
Changing the working environment and workflow through a process-oriented incident cause analysis can minimize the frequency of incidents and maximize the possibility of incident detection. The demand for a process-oriented incident prevention system has led to the research on failure modes and effect analysis (FMEA) [15–17], a prospective risk analysis approach routinely employed in several manufacturing sectors. FMEA is now being actively carried out in radiotherapy to reduce incidents [18]. In FMEA, an expert group is to determine possible failure modes and evaluate their “occurrence” (O), “severity” (S), and “detection” (D) on a scale of 1–10 to assess risk priority by listing the failure modes in descending order of the risk priority number (RPN = O × S × D).
Even though an expert group consists of qualified experts, it is still necessary to confirm the reliability of their scoring because FMEA is based on the RPN score, which is a result of expert group scoring. The aim of the study is to assess the reliability of the risk priority number determined by an expert group and to provide preliminary data for FMEA application in Korea. Therefore, we evaluated the reliability of the expert group scoring by comparing the expert group survey results to the Radiation Oncology Safety Information System (ROSIS) database.
Materials and Methods
ROSIS Data Classification and Expert Group Survey
To confirm the validity of an expert group survey results, we performed a comparison with actual radiotherapy incident data reported in ROSIS (1,163 radiotherapy incidents for a duration of 11 years: 2003–2013) [19]. To create a questionnaire, the ROSIS incident data were divided into 144 items. As the survey target was medical physicists who work in Korea, some incident types in the ROSIS data that did not apply to current radiotherapy techniques in Korea were filtered out. The items were classified into intensity-modulated radiation therapy (IMRT), brachytherapy, and mechanical failure, and further subdivided into IMRT procedures (consulting, simulation, dose prescription, radiotherapy planning, patient QA, and treatment) and brachytherapy procedures (prescription and treatment planning, treatment preparation, placement of the brachytherapy source applicators, and treatment delivery). Respondents were requested to evaluate O, S, and D of each item on a scale from 1 to 10 according to the proposed AAPM Task Group-100 rating scales. Higher O and S indicate a higher probability of occurrence and higher severity, whereas higher D indicates a lower probability of detection. In total, 19 medical physicists from 19 different organizations in Korea participated in the survey as respondents.
Comparison of ROSIS and Expert Survey
To compare the expert group survey data with ROSIS data, its items should be sorted according to the number of incidents for each item. Because there were too many ROSIS items that had only one incident (28.8%), the frequency was not evenly distributed enough to be classified into 10 grades. Therefore, a scale of 1–5 was chosen instead of 1–10, and each ROSIS item was re-classified into the 1–5 grades. A lower grade indicates higher detectability. The survey result was also fit to the 1–5 scales. The differences between the survey results and ROSIS data for each item were rounded. Among the three factors (O, S, D) that determine RPN, D, and D × O were compared because detection and occurrence were clear, and the number of incidents per item is a complex measure of several factors, including the difficulty of detection and the probability of occurrence.
Results
Expert Group Survey Results
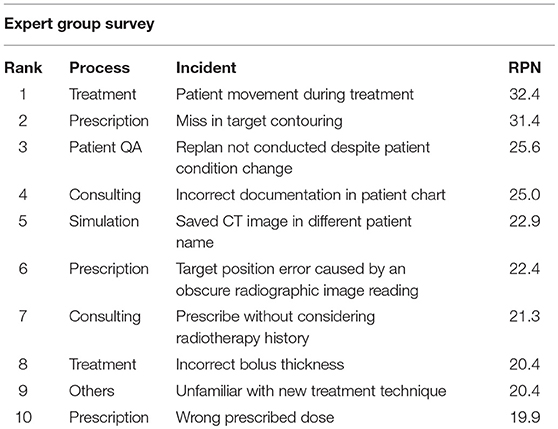
The items that scored the highest O, S, and D in the survey were “starting treatment before patient QA was performed” in the patient QA process, “multi-leaf collimator (MLC) information was not sent to the treatment machine” in the treatment process, and “target contouring error” in the dose prescription process, respectively. The highest RPN was 32.4 and the lowest was 3.5. The item with the highest RPN score was “patient movement during treatment” in the treatment process (O = 2.84, S = 4.42, D = 2.58) and the item with the lowest RPN score was “perform computed tomography simulation (CT-Sim) again as information was not stored” in the simulation process (O = 1.63, S = 1.37, D = 1.58). The mean (± standard deviation) of O, S, and D was 1.77 ± 0.75 for O, 3.50 ± 1.01 for S, and 2.13 ± 1.30 for D. Compared to the distributions of O and D shown in Figure 1, the distribution of S was relatively high, indicating that the expert group felt that most incidents do not occur on a daily basis; however, once an incident occurs, it can lead to serious results (Figure 1). Three out of four items in the dose prescription process were ranked in the top 10 highest RPN items, and the fourth one was ranked at No. 21 (Table 1). For those three items, the mean of O was close to the overall mean of O, but the means of S and D were far above the overall means of S and D, indicating that incidents in the dose prescription process can be serious and difficult to detect.
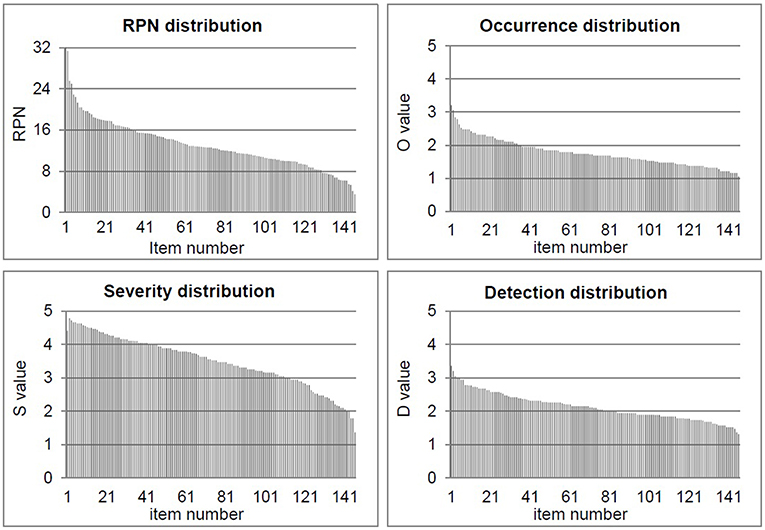
Figure 1. Evaluation of the “occurrence (O),” “severity (S),” “detectability (D),” and “risk priority number (RPN)” for 144 items on a scale from 1 to 10 according to the proposed AAPM TG-100 rating scales.
Comparison of Survey Results With ROSIS Data
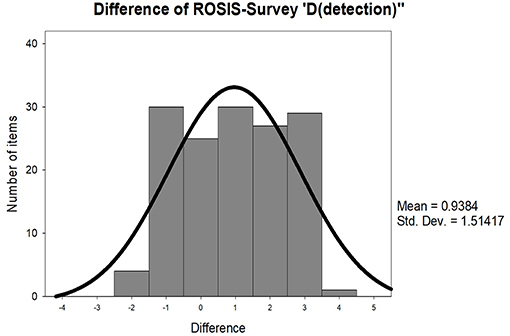
Although the ROSIS grade is a complex measure of several factors including detectability and occurrence, we first compared the D value itself to verify if there was a correlation. The difference in D values between the expert survey and ROSIS data was 0.94 ± 1.51 per item, on an average. In total, 25 items had no difference, 85 items had a deviation below 1, and 30 items had a deviation above 3 (Figure 2). The expectation of the expert group and actual D was identical in 79.2% of the items. However, D was tangential to the ROSIS data in 20.8% of the items, indicating that the number of incidents per item is multifactorial rather than simply proportional to detectability.
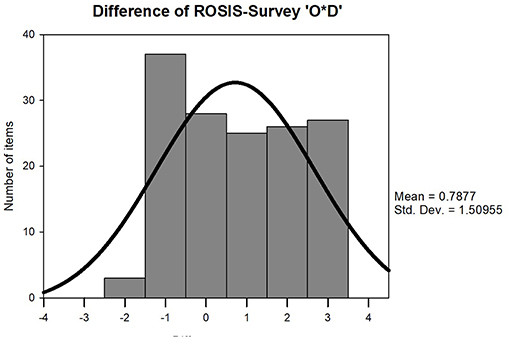
Therefore, O × D was compared between the survey results and ROSIS data, additionally considering the occurrence (O) factor. For this comparison, the grades of D and ROSIS were reversed so that higher grades would indicate higher frequencies. The mean (± Standard Deviation) difference between O × D and ROSIS grade was 0.79 ± 1.51. As occurrence and detectability were both reflected, the difference decreased, but still showed very low similarity in some items (Figure 3). The average D values of the expert group scoring and ROSIS results according to the radiotherapy procedure are demonstrated in Figure 4. The p-values of each process were 0.265 for “consulting,” 0.327 for “simulation,” 0.238 for “prescription,” 0.085 for “planning,” 0.238 for “patient QA,” and 0.276 for “treatment.” Among the radiotherapy processes, “consulting,” “simulation,” and “planning” had the most similar D value (difference = 0.3) between the survey results and ROSIS data, while the “treatment” process had the least similar D value (difference = 1.2). The relatively larger differences in the treatment process may be due to lack of diversity in the professionals who participated in the survey and differences in treatment circumstance between Europe and Korea. The survey group in this study may be more biased than multidisciplinary group since it consisted of medical physicists in Korea only. In other hands, the larger differences in the treatment process may be due to differences in treatment procedures between Europe and Korea. The highest similarity in the “consulting,” “prescription,” and “planning” processes can be explained in the same way because these processes are reviewed during “chart check,” which is a duty of the medical physicist before starting treatment. O × D of “consulting” and “prescription” deviated from the ROSIS data, but “planning” values in the survey results closely resembled those in the ROSIS data. When comparing the O × D values for the items ranked in the top 10 in each the expert group survey results and ROSIS data, “simulation” and “treatment” were the most frequently ranked radiotherapy processes in both the survey and ROSIS data. Five out of the top 10 items belonged to the simulation process in the survey, and 7 out of the top 10 belonged to the treatment process in ROSIS (Table 2). It is likely that the “treatment” process was the most frequently ranked process in ROSIS data because it is repeated 20–30 times to finish one whole cycle, therefore, resulting in 20–30 times higher possibility of incident occurrence. Furthermore, 56% of the ROSIS incidents were found by the therapist (treatment unit) [19]. Out of the 10 items in each process, none were duplicated. As the respondents of the survey in this study were Korean nationals and the ROSIS database mainly consisted of incidents in European countries, the differences in the data could arise from procedural or environmental differences [19]. For instance, “patient name was written differently from part to part,” which is ranked second in the expert group survey results, was caused by person-to-person variability in converting patient names from Korean to English. The standard language of most software programs used in radiotherapy procedures such as treatment planning system is English, which is not a native language in Korea. Because there is no specific rule on how to spell Korean names in English, there is a chance of such incidents when staff members write the patient names in phonetic script.
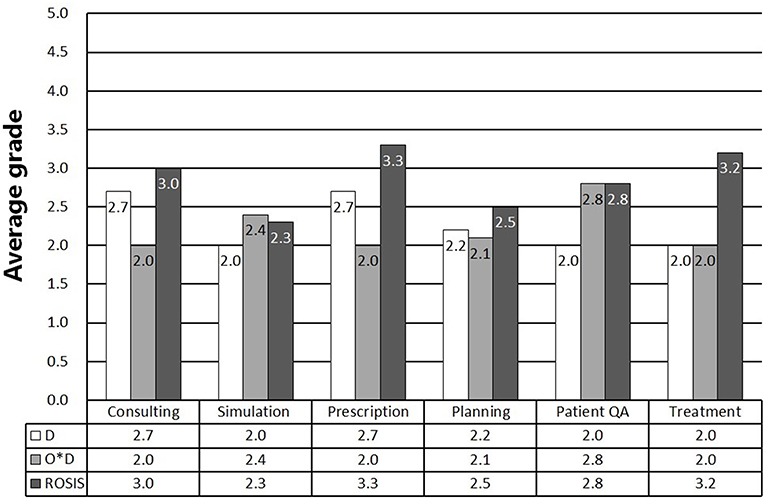
Figure 4. Demonstration of the average D values of the expert group scoring and ROSIS results according to the radiotherapy procedure.
Discussion
The above results indicate that FMEA is a good predictor in general, which has been useful in risk assessment and industrial quality control and is now being introduced in specific areas such as radiology. However, there were discrepancies between the ROSIS data and expert group expectation in some cases. This is because the number of actual incidents is likely to be multifactorial, rather than simply proportional to “detectability” and “occurrence.”
The composition of the expert group could be one of the factors. Diversity in the professions of the expert group was quite limited in this research although each of the multiple steps in radiotherapy requires professionals with different specialties. Due to a closed atmosphere regarding medical accidents in Korea, the formation of an expert group from diverse professional fields is rather difficult. If experts from various fields could have been involved in the survey, expectations would likely have been more accurate, and accurate expectations bring about successful risk management through FMEA. Therefore, to successfully adapt FMEA, radiologists, physicists, therapists, dosimetrists, engineers, and nurses should participate. Moreover, the selection of a comparison group could have mitigated against the conformity of the survey to the ROSIS data. All respondents were Korean, whereas the ROSIS database mainly consists of incidents in European countries. There should have been an inequality such as a frequent incident type, working environment, or minute details in treatment procedure. Therefore, it is necessary to use a radiotherapy incident database from the same organization or the same country to achieve higher accuracy.
In addition, there is an error-inducing factor in the ROSIS data itself because the database completely relies on voluntary reports from organizations. This implies that all incidents were not reported. Therefore, the actual frequency of incidents could differ from what can be achieved from the ROSIS data.
Conclusion
In conclusion, the expert group survey results had discrepancies with the ROSIS data. There were several error-inducing factors, such as the composition of the expert group, the environmental differences between the countries, and the voluntary nature of the ROSIS data. As medical environments differ by country, medical environment-specific risk management is necessary in addition to institution-specific risk management. FMEA is an advanced prevention method which requires for an expert group to have preliminary knowledge of possible incident types. Therefore, although foreign radiotherapy incident reports or databases could be a good reference to establish a risk management system, this research demonstrates that anticipating the risk of incidents based on foreign data might not be appropriate for a specific institution. Thus, further research on radiotherapy risk estimation is necessary.
Data Availability
The raw data supporting the conclusions of this manuscript will be made available by the authors, without undue reservation, to any qualified researcher.
Author Contributions
JK, DS, YL, SP, JR, UH, and DK contributed conception and design of the study. JK, DS, YL, and SP organized the database. JR, UH, and DK performed the statistical analysis. JK and DK wrote the first draft of the manuscript. DS, YL, SP, JR, and UH wrote sections of the manuscript. All authors contributed to manuscript revision and read and approved the submitted version.
Funding
This work was supported by the Basic Science Research Program through the National Research Foundation of Korea (NRF) funded by the Ministry of Education (Grant No. NRF- 2018R1D1A1B07050217), South Korea.
Conflict of Interest Statement
The authors declare that the research was conducted in the absence of any commercial or financial relationships that could be construed as a potential conflict of interest.
References
1. Cho H, Lee S, Shon Y, Nam K. Proton beam irradiation suppresses metastatic capabilities of human cancer cells. J Kor Phys Soc. (2013) 63:1461–5. doi: 10.3938/jkps.63.1461
2. Oh Y, Shin D, Kong M, Shin D, Chung W, Kim D. In-vivo dosimetry for small animal irradiation: a preliminary study. J. Kor Phys Soc. (2019) 74:399–404. doi: 10.3938/jkps.74.399
3. World Health Organization. Radiotherapy Risk Profile. (2008). Available online at: http://www.who.int/patientsafety/activities/technical/radiotherapy_risk_profile.pdf
4. Cox J, Stetz J, Pajak T. Toxicity criteria of the radiation therapy oncology group (rtog) and the european organization for research and treatment of cancer (eortc). Int J Radiat Oncol Biol Phys. (1995) 31:1341–6. doi: 10.1016/0360-3016(95)00060-C
5. International Atomic Energy Agency. Radiation Oncology Physics: A Handbook for Teachers and Students. (2005). Available online at: https://www-pub.iaea.org/mtcd/publications/pdf/pub1196_web.pdf
6. European Radiation Protection Agency. Radiation Protection 91. European Commission Criteria for Acceptability of Radiological (Including Radiotherapy) and Nuclear Medicine Installations (1997).
7. Klein E, Hanley J, Yin FF, Simon W, Dresser S, Serago C, et al. Task group 142 report: quality assurance of medical accelerators. Med Phys. (2009) 36:4197–212. doi: 10.1118/1.3190392
8. Wazir M, Asad U, Khalid M, Matiullah. Assessment of national dosimetry quality audits results for tele-therapy machines from 1989 to 2015. J Appl Clin Med Phys. (2016) 17:145–52. doi: 10.1120/jacmp.v17i2.5984
9. Thwaites DI. The Significance and Impact of Dosimetry Audits in Radiotherapy. SSDL Newsletter 58. Vienna: IAEA (2010).
10. Izewska J, Dutreix A, Followill DS, Nisbet A, Novotny J, Sipila P, et al. Standardized Quality Audit Procedures for On-site Dosimetry Visits to Radiotherapy Hospitals. Report of the IAEA consultants' meeting, IAEA, Vienna, SSDL Newsletter 46. Vienna: IAEA (2002).
11. International Commission on Radiological Protection. Prevention of Accidental Exposures to Patients Undergoing Radiation Therapy. ICRP Publication 86. Annals of the ICRP (2000).
12. Lee H, Jeong S, Jo Y, Yoon M. Study of quality assurance regulations for linear accelerators in Korea: a comparison study between the current status in Korea and the international guidelines. J. Kor Phys Soc. (2015) 67:17–25. doi: 10.3938/jkps.67.17
13. Bissonnette J, Medlam G. Trend analysis of radiation therapy incidents over seven years. Radiother Oncol. (2010) 96:139–44. doi: 10.1016/j.radonc.2010.05.002
14. Koo J, Yoon M, Chung W, Kim D. Radiotherapy incidents analysis based on rosis: tendency and frequency. Prog. Med. Phys. (2014) 25:298–303. doi: 10.14316/pmp.2014.25.4.298
15. Denny D, Allen D, Worthington N, Gupta D. The use of failure mode and effect analysis in a radiation oncology setting: the cancer treatment centers of America experience. J Healthc Qual. (2014) 36:18–28. doi: 10.1111/j.1945-1474.2011.00199.x
16. Perks J, Stanic S, Stern L, Henk B, Nelson M, Harse R, et al. Failure mode and effect analysis for delivery of lung stereotactic body radiation therapy. Int J Radiat Oncol Biol Phys. (2012) 83:1324–9. doi: 10.1016/j.ijrobp.2011.09.019
17. Ford E, Gaudette R, Myers L, Vanderver B, Engineer L, Zellars R, et al. Evaluation of safety in a radiation oncology setting using failure mode and effects analysis. Int J Radiat Oncol Biol Phys. (2009) 74:852–8. doi: 10.1016/j.ijrobp.2008.10.038
18. Broggi S, Cantone M, Chiara A, Muzio N, Longobardi B, Mangili P, et al. Application of failure mode and effects analysis (fmea) to pretreatment phases in tomotherapy. J Appl Clin Med Phys. (2013) 15:265–77. doi: 10.1120/jacmp.v14i5.4329
Keywords: radiotherapy, risk analysis, quality assurance, risk estimates, ROSIS, FMEA, TG-100
Citation: Koo J, Shin DO, Lim YK, Park S, Rah JE, Hwang UJ and Kim DW (2019) Radiotherapy Risk Estimation Based on Expert Group Survey. Front. Phys. 7:118. doi: 10.3389/fphy.2019.00118
Received: 25 March 2019; Accepted: 07 August 2019;
Published: 21 August 2019.
Edited by:
Zhen Cheng, Stanford University, United StatesReviewed by:
Wazir Muhammad, Yale University, United StatesPaul Cumming, University of Bern, Switzerland
Copyright © 2019 Koo, Shin, Lim, Park, Rah, Hwang and Kim. This is an open-access article distributed under the terms of the Creative Commons Attribution License (CC BY). The use, distribution or reproduction in other forums is permitted, provided the original author(s) and the copyright owner(s) are credited and that the original publication in this journal is cited, in accordance with accepted academic practice. No use, distribution or reproduction is permitted which does not comply with these terms.
*Correspondence: Dong Wook Kim, joocheck@gmail.com; kdw1026@yuhs.ac
 Jihye Koo1
  Dong Wook Kim