Measuring Bot and Human Behavioral Dynamics
 Iacopo Pozzana
 Emilio Ferrara
- 1Department of Computer Science and Information Systems, Birkbeck - University of London, London, United Kingdom
- 2Information Sciences Institute, University of Southern California, Los Angeles, CA, United States
Bots, social media accounts controlled by software rather than by humans, have recently been under the spotlight for their association with various forms of online manipulation. To date, much work has focused on social bot detection, but little attention has been devoted to the characterization and measurement of the behavior and activity of bots, as opposed to humans'. Over the course of the years, bots have become more sophisticated, and to some extent capable of emulating the short-term behavior of human users. The goal of this paper is to study the behavioral dynamics that bots exhibit over the course of an activity session, and highlight if and how these differ from human activity signatures. By using a large Twitter dataset associated with recent political events, we first separate bots and humans, then isolate their activity sessions. We compile a list of quantities to be measured, such as the propensity of users to engage in social interactions or to produce content. Our analysis highlights the presence of short-term behavioral trends in humans, which can be associated with a cognitive origin, that are absent in bots, intuitively due to the automated nature of their activity. These findings are finally codified to create and evaluate a machine learning algorithm to detect activity sessions produced by bots and humans, to allow for more nuanced bot detection strategies.
1. Introduction
Social bots are all those social media accounts that are controlled by artificial, as opposed to human, intelligence. Their purposes can be many: news aggregators collect and relay pieces of news from different sources; chatbots can be used as automated customer assistants; however, as a by now large number of studies has shown, the vast majority of bots are employed as part of large-scale efforts to manipulate public opinion or sentiment on social media, such as for viral marketing or electoral campaigns, often with quantifiable effects [1–3].
Scholars' efforts to investigate social bots can roughly be grouped in two categories. On one side, many studies have focused on the theme of bot detection, i.e., on how to identify bot accounts [4–6]. A second line of research deals instead with the impact of bots on society, for example via information spreading and sentiment manipulation [7–9].
The characterization of bot behavior is thus a topic that can yield actionable insights, especially when considered in comparison with the human equivalent. The present work adds to the existing literature in this field by studying the short-term behavioral dynamics, i.e., the temporal evolution of behavioral patterns over the course of an activity session of the two types of accounts. Prior studies have examined the performance of human users when engaging in continuous online interactions, finding measurable changes, for example, in the amount of reactions to other users' post, or in the quality (in terms of grammatical correctness and readability) of the produced content [10, 11].
We hypothesize that such human behavioral changes, if at all present, should be starkly different in the case of bot accounts. To investigate the matter, we analyse two Twitter datasets: a collection of posts from the discussion preceding the 2017 French presidential election—a previous study considered the role played by bot accounts in that context, finding evidence of the presence of a large number of such actors [12]; and a dataset, previously presented in Cresci et al. [13], of hand-labeled tweets from three groups of bots active in as many viral campaigns and one group of human users.
2. Contributions of This Work
Over the course of single activity sessions, we measure different quantities capturing user behavior, e.g., propensity to engage in social interactions, or amount of produced content, and finally contrast results between bots and humans.
The present study advances our understanding of bots and human user behavior in the following ways:
• We reveal the presence of short-term behavioral trends among humans that are instead absent in the case of bots. Such trends may be explained by a deterioration of human user's performance (in terms of quality and quantity of content produced), and by an increasing engagement in social interactions over the course of an online session; in both cases, we would not expect bots to be affected, and indeed we find no significant evidence in that respect.
• In the spirit of the research line on bot detection, we codify our findings in a set of highly predictive features capable of separating human and bot activity sessions, and design and evaluate the performance of a machine learning framework that leverages these features. This can prove extremely desirable when trying to detect so-called cyborgs, users that are in part controlled by humans and in part bots. Our classification system yields an accuracy of up to 97% AUC (Area Under the ROC curve), with the addition of the features identified by our analysis yielding an average improvement over the baseline of up to 14% AUC.
3. Background
3.1. What Is a Bot
A bot (short for robot, a.k.a., social bot, social media bot, social spam bot, or sybil account) is a social media account controlled, predominantly or completely, by a piece of software (a more or less sophisticated artificial intelligence), in contrast with accounts controlled by human users [14]. Next, we describe some techniques to create and detect bots.
3.2. How to Create a Bot
Early social media bots, in the 2000s, were created to tackle simple tasks, such as automatically retweeting content posted by a set of sources, or finding and posting news from the Web [14].
Today, the capabilities of bots have significantly improved: bots rely on the fast-paced advancements of Artificial Intelligence, especially in the area of natural language generation, and use pre-trained multilingual models like OpenAI's GPT-2[15] to generate human-like content. This framework allows the creation of bots that generate genuine-looking short texts on platforms like Twitter, making it harder to distinguish between human and automated accounts [16].
The barriers to bot creation and deployment, as well as the required resources to create large bot networks, have also significantly decreased: for example, it is now possible to rely upon bot-as-a-service (BaaS), to create and distribute large-scale bot networks using pre-existing capabilities provided by companies like ChatBots.io, and run them in cloud infrastructures like Amazon Web Services or Heroku, to make their detection more challenging[17]. For a recent survey of readily-available Twitter bot-making tools (see [2, 12]).
3.3. How to Detect Bots
Historically, bot detection techniques have been pioneered by groups at Indiana University, University of Southern California, and University of Maryland, in the context of a program sponsored by DARPA (the U.S. Defense Advanced Research Projects Agency) aimed at detecting bots used for anti-science misinformation [18]. More recently, large bot networks (botnets) have been discovered on Twitter by various academic groups [19, 20].
The literature on bot detection has become very extensive [13, 14, 21, 22]. In Ferrara et al. [14], we proposed a simple taxonomy to divide bot detection approaches into three classes: (i) systems based on social network information; (ii) systems based on crowd-sourcing and the leveraging of human intelligence; (iii) machine learning methods based on the identification of highly-predictive features that discriminate between bots and humans.
Some openly-accessible tools exist to detect bots on platforms like Twitter: (i) Botometer1 is a bot detection tool developed at Indiana University [6], also used here; (ii) BotSlayer2 is an application for the detection and tracking of potential manipulation of information on Twitter; (iii) the Bot Repository3 is a centralized database to share annotated datasets of Twitter bots. Finally, various models have been proposed to detect bots using sophisticated machine learning techniques, such as deep learning [23], anomaly detection [24–26], and time series analysis [27, 28].
4. Data and Methods
Our first dataset, that we label French Elections (FE), consists of a collection of more than 16M tweets, posted by more than 2 M different users. The tweets were posted between April 25 and May 7, 2017, the 2-weeks period leading to the second round of the French presidential election. A list of 23 keywords and hashtags was manually compiled and used to collect the data through the Twitter Search API4.
To classify the users as bots or humans, we employ the Botometer API5 previously known as BotOrNot [6], which provides a free-to-use, feature-based classification system. When queried about a Twitter user name or user ID, Botometer retrieves from Twitter information about more than a thousand features associated with that account, and returns a corresponding bot score. A bot score is a number representing the likelihood for the account to be controlled by a bot, and it ranges from 0 (definitely human) to 1 (definitely bot).
While, as of January 2020, the latest version of Botometer provides two separate scores, one excluding and one including language-dependent features, such distinction was yet to be implemented at the time of our research. The fact that the FE data contained tweets in different languages was therefore not an issue in this respect. For a more detailed description of the dataset, including its language distribution (see [12]).
Here, we use Botometer to calculate the bot score of more than 380 k accounts in our dataset, namely all that posted at least 5 tweets during the observation time, minus those that were since deleted (27 k), or which privacy setting prevented Botometer to access the necessary information (15 k accounts). The 380 k users are responsible for more than 12 M out of the overall 16 M tweets.
It is worth noting that Botometer does not use any session-related feature, nor does it incorporate any notion of activity sessions [29]: this is important to guarantee that the behavioral differences discussed below are not just an artifact of the classifier relying on session-based features (which would be circular reasoning).
The distribution of the bot scores is reported in Figure 1. To limit the risk of wrongly classifying a human account, we choose to only label as bots those users with a bot score ranking in the top 5% of the distribution, corresponding to a threshold value of 0.53. This is a conservative strategy informed by the fact that a false positive, i.e., labeling a human user as a bot, is generally associated to a higher cost than a false negative, especially when decisions such as account suspensions are informed by this classification. Furthermore, recent analyses demonstrated that, when studying human and bot interactions via Botometer, results do not significantly vary in the threshold range between 0.4 and 0.6 [29]. According to the same conservative strategy, we set the threshold for humans to 0.4, leaving unlabeled all the accounts with a score value between the two thresholds. Summarizing, we have 19 k users labeled as bots and 290 k users labeled as humans, while the reminding 78 k are left unlabeled.
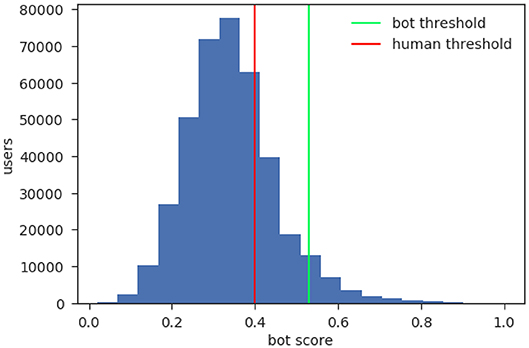
Figure 1. Frequency distribution of the bot scores obtained with Botometer. We plot the number of accounts in the FE dataset according to their Botometer score. We classified as bots the 5% top scoring accounts, corresponding to a minimum value of 0.53 (green line). We set instead 0.4 (red line) as a maximum threshold value for the labeling of a human. Both choices are informed by previous analyses and intended to reduce the risk of misclassifications [29].
The second dataset, that we call Hand-Labeled (HL), consists in three groups of tweets produced by bot accounts active in as many viral spamming campaigns at different times, plus a group of human tweets. All accounts are labeled by human annotators, and a thorough description of the dataset is provided in Cresci et al. [13]. In particular, the groups of accounts considered here are the ones named “social spambots #1-3” and “genuine accounts” in the paper, for a total of about 3.4 M tweets posted by 5 k bot accounts and 8.4 M tweets posted by 3.5 k human accounts.
We choose the two datasets because they complement each other: while, being the accounts therein labeled by human annotators, HL provides a more reliable ground truth than FE, FE is composed of tweets all posted in the same context (i.e., the 2017 French electoral campaign), whereas the tweets in HL were collected in four different instances. All data were collected in compliance with Twitter Terms of Service.
To organize the datasets in sessions, the tweets are first grouped by user and sorted according to the time of posting. A session is a group of consecutive tweets posted by the same user, and separated from the previous and following tweet by an amount of time larger than a certain threshold of T minutes; in other words, every time an user posts a tweet after a period of inactivity of at least T minutes, a new session starts. The position of a tweet in a session corresponds to the order in which the tweet was posted, e.g., the third tweet posted by an user in a certain session would have position 3. The length of a session is the total number of tweets the sessions consists of.
To determine the value of T we first considered the distribution of the inter-time between two consecutive tweets from the same user, reported in Figure 2. The overall distribution (cf. inset of Figure 2) displays the characteristic long tail, both for humans and bots. In human behavior, this is a common feature, known as burstiness [30]; observing burstiness among bots does not come as a surprise either, as the newer, most sophisticated bots are indeed known to sample their inter-event times from long-tailed distributions, precisely for the purpose of avoiding detection [12, 14]. However, a closer inspection, centered on the typical time range of a session duration (10 min to 2 h, main figure), highlights the presence of peaks corresponding to regular values (10 min, a quarter of an hour, half an hour and so forth) and, although the peaks are present in both distributions, they are significantly more pronounced in the case of bots.
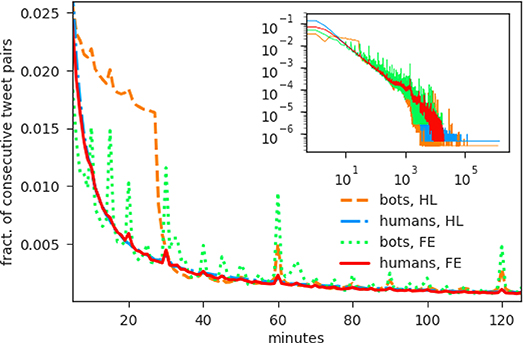
Figure 2. Inter-time distribution between two consecutive tweets. For both datasets and both categories of accounts, we plot the fraction of pairs of consecutive tweets that occurred with a given time separation (inter-time). The overall distribution is reported in the inset, while the main picture shows a detailed view of the inter-times between 10 min and 2 h. The overall distribution exhibits the characteristic long tail for both humans and bots. The detail reveals the presence of peaks corresponding to regular values (10 min, a quarter of an hour, half an hour and so forth); the peaks are present both in the humans' and bots' distribution, but they are much more marked in the latter.
Also informed by previous studies [10, 31], we set a threshold value of 60 min for our analysis, resulting in more than 250 k bot sessions and 2.6 M human sessions in FE, and more than 800 k bot sessions and 1 M human sessions in HL. The frequency distribution of the tweets according to their position in the session, plotted normalized in Figure 3 to highlight the comparison between humans and bots, is long tailed. In the FE dataset, humans and bots follow a qualitatively similar trend, with bots being more likely to engage in longer sessions (i.e., in sessions with a number of tweets in the order of the tens or larger). In HL, humans also follow a similar pattern, falling between the two group of users from FE, while bots have a different behavior, with a plateau followed by a steep descent: few sessions count more than 10 but <50 tweets; this may be due to the different nature of bots operating in different spamming campaigns.
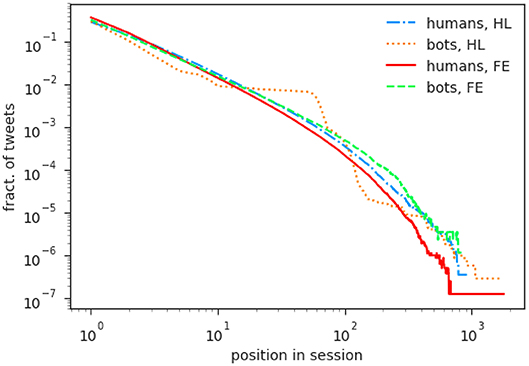
Figure 3. Fraction of tweets appearing in a given position in the course of a session. For both datasets and both categories of accounts, we plot the fraction of tweets posted at a given position in a session. In FE, both distributions (bots and humans) are long-tailed, with the first showing higher values in the tail, thus indicating that bots are likelier than humans to post more tweets in the course of the same session (i.e., without a break of 60 min or more). In HL, the two groups behave rather differently from one another: while humans fall between the two FE groups, bots follow a less regular trend, with a particularly pronounced plateau between position 10 and 50, followed by a steep descent.
5. Results
5.1. Experimental Analysis
Having organized the tweets in sessions, we proceed to study the temporal dynamics of the two categories of users, bots and humans. Our results are summarized in Figure 4. We focus on four quantities: the fraction of retweets (Figure 4A), and the fraction of replies (Figure 4B), among all tweets posted at a certain position in a session; the number of mentions appearing in a tweet (Figure 4C); and the length of the tweet itself, in characters (Figure 4D). We use two different scales for the FE (left) and HL (right) data, to account for the different nature of the two datasets and at the same time to better highlight the behavioral analogies within each group of users. For every measure we plot the mean with its standard error.
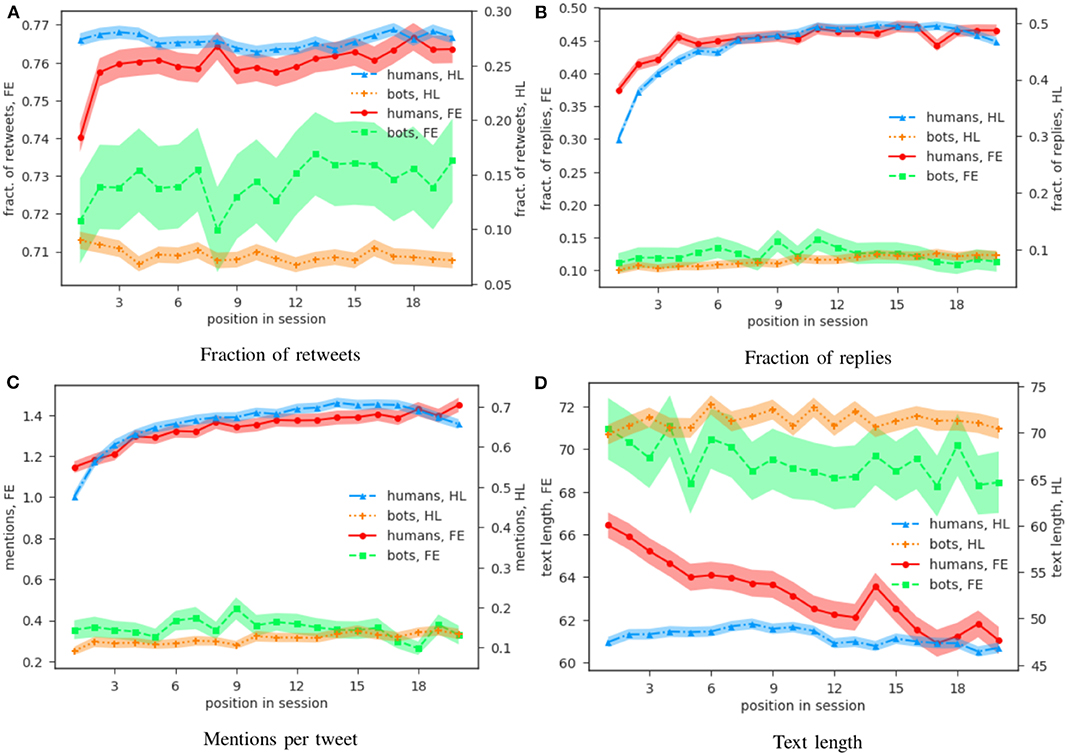
Figure 4. Trend of four different behavioral measures over the course of an online session. We plot, as a function of the tweet's position in its session, four behavioral indicators extracted from the tweets: the fraction of retweets, the fraction of replies, the average number of mentions per tweet, and the average text length (in characters). All the sessions considered here contain a similar number of posts (20–25) to limit biases due to the different behavioral patterns adopted by users in sessions of different length [10]. The number of sessions considered is thus 1,500 for the bots and 13 K for the humans in the FE dataset, and 1,300 for the bots and 5,800 for the humans in the HL dataset. In all quantities except (A), retweets have been excluded from the analysis, as we are only interested in original content produced by the users. The shaded area corresponds to one SEM (standard error of the mean), calculated separately for each point. We use different scales for the two datasets (FE on the left axis, HL on the right one) to facilitate the comparison within account types. For all measures, not only the datapoints are well separated between the two categories of users (within (within one SEM), but humans also show temporal trends which are not observed in bots. In particular: considering the fraction of retweets, shown in (A), values are higher for human users with respect to bots over all the course of a session; in the FE dataset humans also show an increase in their value, faster in the beginning (first 2–3 tweets), then slower, but still present during all the first 20 tweets. The situation is similar in the case of replies (B), where humans from both datasets show a similar increase over the first 5–6 tweets. Human users also use more mentions (C), with a roughly steady increase over the course of a session. As for the average length of the tweets (D), a decrease is evident for humans in FE, who also post shorter tweets with respect to their automated counterparts. In all the four measures considered, no clear trend emerges for the case of bots.
As detailed below, the first three of these four features can provide an indicator of the quantity and quality of the social interactions an user engages in over the course of a session. The text length is instead a measure of the amount of content produced by an user. As correlations between the length of a session and the dynamics of performance indicators have been observed on social networks [10, 11], we restrict our analysis to sessions of similar length; we want our sessions to be long enough to exhibit meaningful trends, yet short enough to occur in significant numbers, as the number of sessions consisting of at least N posts decreases rapidly with N (Figure 3). We thus choose to focus on sessions containing 20–25 posts, resulting in a total of 1,500 bot sessions and 13 k human sessions in the FE dataset, and 1,300 bot sessions and 5,800 human sessions in the HL dataset. In the following paragraphs, we detail our findings for each of the four features.
A retweet is a repost of a tweet previously posted by another user. We expect to see an increase in the number of human retweets during the course of a session, as users get exposed to more content and are thus more likely to engage in social interactions. The fraction of retweets over the total number of tweets, grouped by their position in the session (Equation 1), is shown in Figure 4A: in general, the fraction is higher for humans at all positions; in FE, the fraction increases for humans over all the course of their sessions, starting with a rapid growth in the first 2–3 posts and then slowing down. No equivalent trend appears among bots, that seem instead to oscillate around a constant value.
The reply (Figure 4B), as the name suggests, is a tweet posted in response to some other tweet. The same considerations as for the retweets apply here: we expect to see the fraction of replies increase over the course of a human sessions. Our results confirm our expectation: as for the retweets, the fraction of replies increases and decelerates, for humans, over all the first 20 tweets; the behavior is similar in the two datasets, with a rapid increase over the first 5–6 tweets, after which the value stabilizes around 0.5. Bots, on the other hand, don't show an analogous increase.
On Twitter, users can mention other users in their posts; another possible measure of social interactions is thus the average number of mentions per post. As for the previous cases, we expect the number of mentions to increase, on average, as human users proceed in their session. The results (Figure 4C) do indeed show an increase in the average number of mentions by humans over the course of the first 20 tweets; as in the case of the fraction of replies, a qualitative similarity between the two groups of human users is also apparent. Again, bots don't seem to change their behavior in the course of the session.
The features analyzed so far are all indicators of the amount of social interactions in which users engage. We now consider the average length (in characters) of a tweet, which is a measure of the amount of content produced and is thus an interesting indicator of the short-term behavioral dynamics. Before counting the number of characters, the tweet is stripped off all urls, mentions, and hashtags, so to only account for text effectively composed by the user. A previous study has failed to show any significant variation in this quantity over the course of a short-term session on Twitter [11]; however, analyses of other platforms have shown that the average post length decreases on similar time scales [10]. Here, human data show a clear decreasing trend in FE, whereas no trend emerges for humans nor bots in HL (Figure 4D).
Notice that for the last three quantities (replies, mentions, and text length) we have excluded all retweets from our analysis, as their content is not produced by their poster: whereas the fact of posing a retweet can be considered a behavioral indicator, the content of the retweet itself cannot.
In Table 1, we report statistics (mean, and standard deviation in brackets) for the four features considered above, grouped by users. In both datasets, bots tend to post fewer replies and retweets, and to use fewer mentions. The difference is, however, not large enough to be statistically significant as in all cases, except for the retweets in the HL dataset, it falls within one standard deviation. This evidence further contributes to substantiate the point that the differences observed in the behavioral evolution over the course of a session are not just emerging from features that classifiers such as Botometer would already be taking into account—a point that is particularly relevant with regard to the next section, where we show how the introduction of session features can improve account classification.
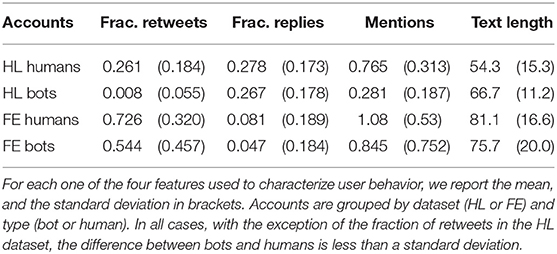
Table 1. Statistics for account groups.
In general, our experiments reveal the presence of a temporal evolution in the human behavior over the course of a session on an online social network, whereas, confirming our expectations, no evidence is found of a similar evolution for bot accounts. In the next section, we proceed to further investigate the significance of these temporal trends by incorporating them in a classifier for bot detection.
5.2. Prediction
As the experiments described in the previous section show, user behavior, as captured by the four metrics used above (fraction of retweets, fraction of replies, number of mentions, text length), evolves in a measurably different manner between bots and humans (Figure 4). To further investigate this difference, we implement a classifier that, leveraging the quantities considered above, categorizes tweets as either produced by a bot or a human. Using four different off-the-shelf machine learning algorithms, we train our classifier using 10-fold cross-validation on the HL datasets, which provides a reliable ground truth, as explained above and in Cresci et al. [13].
We proceed to organize the dataset in sessions separate by 60 min intervals as described in section 4. As detailed in Table 2, each tweet is tagged with three session features: (i) session ID (i.e., which session the tweet belongs to), (ii) position of the tweet in the session, (iii) and length of the session (as defined in section 4). Six behavioral features are also considered: (iv) whether the tweet is a retweet, or (v) a reply, (vi) the numbers of mentions, (vii) hashtags, (viii) urls contained in the tweet, and (ix) the text length. We use the nine features to train four classifiers, using as many different techniques: Decision Trees (DT), Extra Trees (ET), Random Forest (RF), and Adaptive Boosting (AB). The purpose of the session ID feature is to allow the classifiers to identify tweets that were posted as part of the same session. To make sure that such identification is possible within but not between the training and testing set, IDs in the latter were encrypted via a hash function.
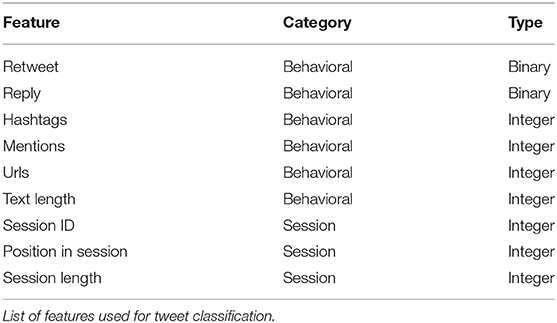
Table 2. Classifiers features.
The training and testing of the model is done via 10-fold cross-validation on the entire dataset. As a measure of the performance of the various classifiers, we use the Area Under the Curve of the Receiver Operating Characteristic (shortened as AUC and ROC, respectively). The ROC curve of a binary classifier plots its True Positive Rate against the corresponding False Positive Rate for different Sensitivity values, i.e., ranging from no positives to all positives (Equations 2, 3).
The AUC is usually expressed as a percentage of the maximum attainable value, which would correspond to an ideal classifiers (one that has True Positive Rate always equal to one); the higher the AUC, the better the classifier's performance. Notice that a perfectly random binary classifier would have an AUC of 50%.
The ROC curves are shown in Figure 5A: all the classifiers report an AUC of 97%, except for the AB, that scores 84%. Aside from the details of the effectiveness of each classifier, the results just described go to show that short-term behavioral patterns can effectively be used to inform bot detection.
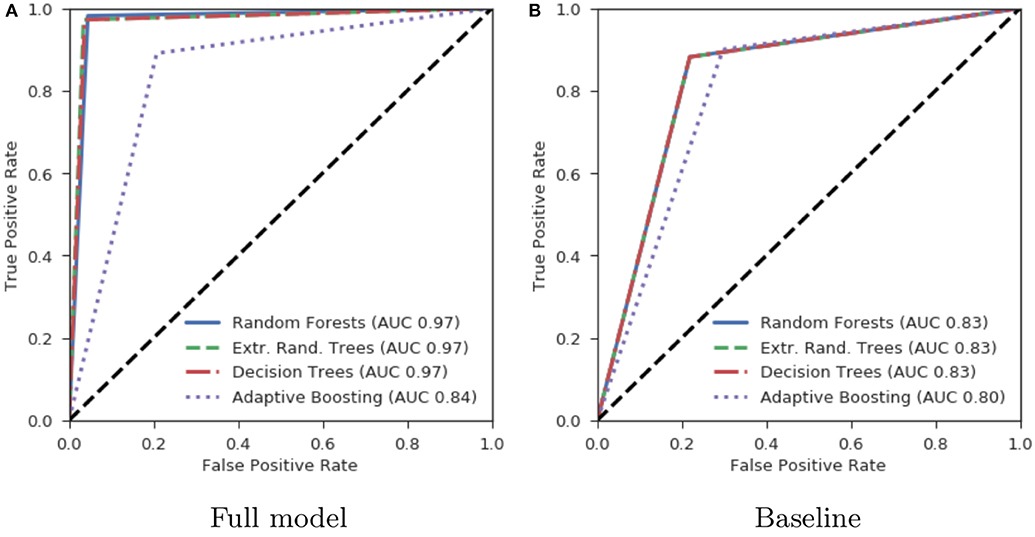
Figure 5. Area under the ROC curve plot. We plot the ROC curves for the eight classifiers trained (four including and for excluding session features) and report the corresponding AUC values. The four models leveraging the three session features as well as the six behavioral features, are shown in (A). These models all significantly outperform the baseline models, shown in (B), that do not include the three session features.
To precisely quantify the impact of the introduction of the session dynamics features, we train four more classifiers, equivalent in all respects to the ones described above except for the set of features used for the training: here only the behavioral features (retweet, reply, hashtags, mentions, urls, text length) are included while the three session features (session ID, position in session, session length) are left out. The four models (again DT, ET, RF, and AB) are trained and tested via 10-fold cross-validation, and the corresponding ROC curves are shown in Figure 5B. The new four models serve as a baseline to compare the full models to; the difference is particularly pronounced for the first three models (DT, ET, RF), for which the AUC yields a 83% for the baseline versions, 14 points lower than their counterparts trained with all the nine features. The AB model also performs worse without the session features (AUC 80%, compared to the 84% obtained with the full features).
All the testing of our classifiers was done, until this point, on the HL dataset. We would now be interested in carrying out some sort of testing on the dataset of the French election tweets introduced in section 4. As such dataset lacks annotations, a proper test can not be performed, but we can still exploit the Botometer scores to get some information about the performance of our classifiers, and again draw a comparison with the baseline case where session features are omitted. To this purpose, we let the bot threshold (Botometer score value above which an account is consider a bot) vary on all the range of possible values (0–1), and for each case compare the results given by the classifiers, trained on the HL dataset as described above, with these “annotations.” Let us remark that our purpose here is to evaluate the effectiveness of the introduction of the session features, and not to exactly evaluate the sensitivity of the classifiers.
The test is performed using the two AB classifiers (the full model and the baseline), and the results are shown in Figure 6. The left part of the graph is not actually very informative, as when the bot threshold is set below 0.4 the “positive” accounts will actually include many humans. It is roughly in correspondence of the 0.4 value that the True Positive Rate (Equation 2) of the classifier starts increasing, and although the baseline classifier's TPR increases as well, the former outperforms the latter at all points.
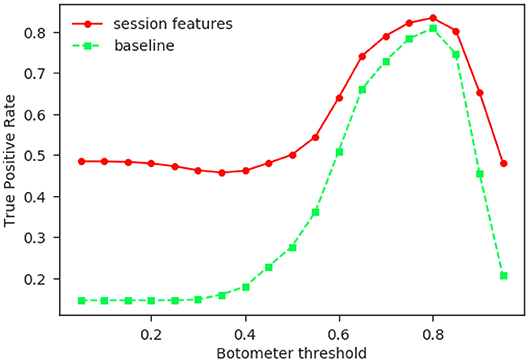
Figure 6. Comparison of the two AB classifiers. In this figure we compare the performance of the AB classifiers trained with (red circles) and without (green squares) including the session features. Both classifiers are trained on the HL and tested on the FE data. The set of “positives” is taken as all the tweets posted by accounts scoring more than the corresponding Botometer score (horizontal axis), and could indeed contain some human accounts, especially for lower values. Nonetheless, the higher TPR goes to show that the introduction of the session features significantly improves the performance of the classifier.
Summarizing, these results suggest that features describing the short-term behavioral dynamics of the users can effectively be employed to implement a bot detection system or to improve existing ones, further confirming that a difference exists in such dynamics between humans and bots.
6. Discussion
The results detailed in the previous two sections provide evidence of the existence of significant differences in the temporal evolution of behavior over the course of an online session between human and bot users.
In particular, in section 5.1 we analyse four different indicators of the users' behavior and find, among humans, trends that are not present among bots: first of all, an increase in the fraction of retweets and replies, and in the number of mentions contained in a tweet, quantities that can all together be seen as a measure of the amount of social interaction an user is taking part in; secondly, a decrease in the amount of content produced, measured as the average tweet length. Such trends are present up to the 20th post in human sessions, whereas the same indicators remain roughly constant for bots. This may be partly due to the fact that, as a sessions progresses, users grow more tired and become less likely to undertake more complex activities, such as composing an original post [11]. At the same time, we hypothesize that another possible (and possibly concurring) explanation may be given by the fact that, as time goes by, users are exposed to more and more posts, thus increasing their probability to react, for example by retweeting or by mentioning the author of a previous post. In both cases, bots would not be affected by such considerations, and no behavioral change should be expected from them.
In section 5.2, we use the results obtained in section 5.1 to inform a classification system for bot detection. Our purpose there is to highlight how the introduction of features describing the session dynamics (session ID, position of the tweet in the session, and length of the session) can substantially improve the performance of the detector. To this purpose, we use a range of different machine learning techniques (Decision Trees, Extra Trees, Random Forests, Adaptive Boosting), to train, through 10-fold cross-validation, two different sets of classifiers: one including the features describing the session dynamics (the full model), and one without those features (the baseline). The comparison between the two sets of models, carried out both on the annotated dataset used for the cross-validation and on the dataset of tweets concerning the French elections, where Botometer is instead employed, show that the full model significantly outperforms the baseline.
It is worth noting again that Botometer, while considering temporal features, does not implement any notion of activity sessions nor does it use any session-based features for bot classification [29]. This ensures that the behavioral differences highlighted in this work are genuine and not simply an artifact due to discriminating on features used for classification purposes (that would be circular reasoning); the comparison detailed in section 5.2, where classifiers trained with session features are shown to perform better than their session blind counterparts, corroborates such a claim.
6.1. Related Work
Bots in some occasions have been used for social good, e.g., to deliver positive interventions [32, 33]. Yet, their use is mostly associated with malicious operations. For example, bots have been involved in manipulation of political conversation [1–3, 7, 34], the spread of disinformation and fake news [8, 12, 21], conspiracy [18], extremist propaganda [35, 36], as well as stock market manipulation [37]. Concerns for public health also recently emerged [38–41]. This increasing evidence brought our research community to propose a wealth of techniques to address the challenges posed by the pervasive presence of bots in platforms like Facebook and Twitter. Social bot detection is one such example. Our work differentiates from this literature as it is not directly aimed at bot detection, yet our findings can be used to inform detection based on bot and human features and behaviors.
The study of bots' characteristic is another recent research thread that attracted much attention. Researchers discovered that bots exhibit a variety of diverse behaviors, capabilities, and intents [29, 42]. A recent technical memo illustrated novel directions in bot design that leverage Artificial Intelligence (AI): AI bots can generate media and textual content of quality potentially similar to human-generated content but at much larger scale, completely automatically [43]. In this work, we highlighted similarities and dissimilarities between bots' and humans' behavioral characteristics, illustrating the current state of bots' capabilities.
The ability of bots to operate in concert (botnets) attracted the attention of the cybersecurity research community. Examples of such botnets have been revealed on Twitter [20, 44]. Botnet detection is still in its early stage, however much work assumed unrestricted access to social media platform infrastructure. Different social media providers, for example, applied bot detection techniques in the back-end of other platforms, like Facebook [45, 46] and Renren (a Chinese Twitter-like social platform) [47, 48]. Although these approaches can be valuable and show promising results [45, 49, 50], for example to detect large-scale bot infiltration, they can be implemented exclusively by social media service providers with full access to data and system infrastructure.
Researchers in academic groups, who don't have unrestricted access to social media data and systems, proposed many alternative techniques that can work well with smaller samples of user activity, and fewer labeled examples of bots and humans. The research presented here is one such example. Other examples include the classification system proposed by Chu et al. [4, 51], the crowd-sourcing detection framework by Wang et al. [52], the NLP-based detection methods by Clark et al. [5], the BotOrNot classifier [6], a Twitter campaign detection system [53, 54], and deep neural detection models [23].
Some historical user activity data is still needed for these methods to function properly, either by indirect data collection [4, 5, 51, 52, 55], or, like in the case of BotOrNot [6], by interrogating the Twitter API (which imposes strict rate limits, making it of little use for large-scale bot detection). Given these limits, we believe that it is very valuable to have a deep understanding of human and bot behavioral performance dynamics: our findings can inform data collection and annotation strategies, can help improve classification accuracy by injecting expert knowledge and produce better, more informative and predictive features, and ultimately allow for a better understanding of interaction mechanisms online.
7. Conclusion
In the present work we have investigated the behavioral dynamics of social network users over the course of an online session, with particular attention to the differences emerging between human and bot accounts under this perspective. User session dynamics have been investigated in the literature before but, to the best of our knowledge, never applied to the problem of bot detection.
Our analysis revealed the presence of behavioral trends at the session level among humans that are not observed in bot accounts. We hypothesized two possible mechanisms motivating such trends: on one side, humans' performance deteriorates as they engage in prolonged online sessions; this decline has been attributed to a cognitive origin in related work. On the other hand, over the course of their online activity, humans are constantly exposed to posts and messages by other users, so their probability to engage in social interaction increases. Devising methods to further test each of these two hypotheses could possibly constitute an avenue for future research. Furthermore, the presence of such behavioral differences between the two categories of users can be leveraged to improve bot detection techniques. To investigate this possibility, we trained two categories of classifiers, one including and one excluding features describing the session dynamics. The comparison shows that session features bring an increase of up to 14% AUC, substantially improving the performance of bot detectors. This suggests that features inspired by cognitive dynamics can be useful indicators of human activity signatures. Importantly, the classifier adopted as a baseline does not leverage any session-related features, thus ensuring that the results we observe are genuine and not the artifact of circular reasoning. It may be an interesting object of future work to better characterize the interplay between the features studied here and other features leveraged by various bot detection techniques, such as the ones mentioned in section 6.1. Overall, our study contributes both to the ongoing investigation around the detection and characterization of social bots, and to the understanding of online human behavior, specifically the short-term dynamical evolution over the course of activity sessions.
Data Availability Statement
Data have been collected through the public Twitter API6. To comply with Twitter terms of service, data cannot be publicly shared. Interested future researchers may reproduce the experiments by following the procedure described in the paper. Anonymized data may be available upon request from Dr. Emilio Ferrara (ferrarae@isi.edu).
Author Contributions
All authors listed have made a substantial, direct and intellectual contribution to the work, and approved it for publication.
Funding
The authors gratefully acknowledge support by the Air Force Office of Scientific Research (AFOSR award #FA9550-17-1-0327), and by the Defense Advanced Research Projects Agency (DARPA contract #W911NF-17-C-0094, and grant #D16AP00115). The U.S. Government is authorized to reproduce and distribute reprints for Governmental purposes notwithstanding any copyright annotation thereon. The views and conclusions contained herein are those of the authors and should not be interpreted as necessarily representing the official policies or endorsements, either expressed or implied, of AFOSR, DARPA, or the U.S. Government.
Conflict of Interest
The authors declare that the research was conducted in the absence of any commercial or financial relationships that could be construed as a potential conflict of interest.
Acknowledgments
The authors thank Kristina Lerman (USC) for insightful discussions, Stefano Cresci and collaborators (IIT-CNR) for sharing the bot annotations, and the Botometer team (IU) for maintaining their public bot detection tool.
This manuscript has been released as a pre-print on arXiv.org [56].
Footnotes
1. ^Botometer: https://botometer.iuni.iu.edu/
2. ^BotSlayer: https://osome.iuni.iu.edu/tools/botslayer/
3. ^Bot Repository: https://botometer.iuni.iu.edu/bot-repository/
4. ^https://dev.twitter.com/rest/public/search
References
1. Forelle M, Howard P, Monroy-Hernández A, Savage S. Political bots and the manipulation of public opinion in Venezuela. arXiv:1507.0710 (2015). doi: 10.2139/ssrn.2635800
2. Bessi A, Ferrara E. Social bots distort the 2016 US Presidential election online discussion. First Monday. (2016) 21:14. doi: 10.5210/fm.v21i11.7090
3. Woolley SC. Automating power: social bot interference in global politics. First Monday. (2016) 21. doi: 10.5210/fm.v21i4.6161
4. Chu Z, Gianvecchio S, Wang H, Jajodia S. Detecting automation of twitter accounts: are you a human, bot, or cyborg? IEEE Trans Depend Sec Comput. (2012) 9:811–24. doi: 10.1109/TDSC.2012.75
5. Clark E, Williams J, Jones C, Galbraith R, Danforth C, Dodds P. Sifting robotic from organic text: a natural language approach for detecting automation on Twitter. J Comput Sci. (2016) 16:1–7. doi: 10.1016/j.jocs.2015.11.002
6. Davis C, Varol O, Ferrara E, Flammini A, Menczer F. Botornot: A system to evaluate social bots. In: WWW'16. Montreal, QC (2016). p. 273–4. doi: 10.1145/2872518.2889302
7. Howard PN, Kollanyi B. Bots, #strongerin, and #brexit: computational propaganda during the UK-EU referendum. SSRN Electron J. (2016). doi: 10.2139/ssrn.2798311. [Epub ahead of print].
8. Shao C, Ciampaglia GL, Varol O, Yang KC, Flammini A, Menczer F. The spread of low-credibility content by social bots. Nat Commun. (2018) 9:4787. doi: 10.1038/s41467-018-06930-7
9. Stella M, Ferrara E, De Domenico M. Bots increase exposure to negative and inflammatory content in online social systems. Proc Natl Acad Sci USA. (2018) 115:12435–40. doi: 10.1073/pnas.1803470115
10. Singer P, Ferrara E, Kooti F, Strohmaier M, Lerman K. Evidence of online performance deterioration in user sessions on reddit. PLoS ONE. (2016) 11:e161636. doi: 10.1371/journal.pone.0161636
11. Kooti F, Moro E, Lerman K. Twitter session analytics: profiling users–short-term behavioral changes. In: SocInfo'16. Bellevue, WA (2016). p. 71–86. doi: 10.1007/978-3-319-47874-6_6
12. Ferrara E. Disinformation and social bot operations in the run up to the 2017 French presidential election. First Monday. (2017) 22. doi: 10.5210/fm.v22i8.8005
13. Cresci S, Di Pietro R, Petrocchi M, Spognardi A, Tesconi M. The paradigm-shift of social spambots: evidence, theories, and tools for the arms race. In: WWW'17. Perth, WA (2017). p. 963–72. doi: 10.1145/3041021.3055135
14. Ferrara E, Varol O, Davis C, Menczer F, Flammini A. The rise of social bots. Commun ACM. (2016) 59:96–104. doi: 10.1145/2818717
15. Radford A, Wu J, Child R, Luan D, Amodei D, Sutskever I. Language models are unsupervised multitask learners. OpenAI Blog. (2019) 1:9.
16. Alarifi A, Alsaleh M, Al-Salman A. Twitter turing test: identifying social machines. Inform Sci. (2016) 372:332–46. doi: 10.1016/j.ins.2016.08.036
18. Subrahmanian V, Azaria A, Durst S, Kagan V, Galstyan A, Lerman K, et al. The DARPA Twitter bot challenge. Computer. (2016) 49:38–46. doi: 10.1109/MC.2016.183
19. Echeverria J, Zhou S. Discovery, retrieval, and analysis of the'star wars' botnet in Twitter. In: Proceedings of the 2017 IEEE/ACM International Conference on Advances in Social Networks Analysis and Mining. Sydney, NSW (2017). p. 1–8. doi: 10.1145/3110025.3110074
20. Abokhodair N, Yoo D, McDonald D. Dissecting a social botnet: growth, content and influence in Twitter. In: CSCW. Vancouver, BC (2015). p. 839–51. doi: 10.1145/2675133.2675208
21. Ferrara E. Measuring social spam and the effect of bots on information diffusion in social media. In: Complex Spreading Phenomena in Social Systems. Cham: Springer (2018). p. 229–55. doi: 10.1007/978-3-319-77332-2_13
22. Ferrara E. Bots, elections, and social media: a brief overview. In: Disinformation, Misinformation, and Fake News in Social Media. (2020).
23. Kudugunta S, Ferrara E. Deep neural networks for bot detection. Inform Sci. (2018) 467:312–22. doi: 10.1016/j.ins.2018.08.019
24. Minnich A, Chavoshi N, Koutra D, Mueen A. BotWalk: Efficient adaptive exploration of Twitter bot networks. In: Proceedings of the 2017 IEEE/ACM International Conference on Advances in Social Networks Analysis and Mining 2017. Sidney, NSW: ACM (2017). p. 467–74. doi: 10.1145/3110025.3110163
25. Gilani Z, Kochmar E, Crowcroft J. Classification of twitter accounts into automated agents and human users. In: Proceedings of the 2017 IEEE/ACM International Conference on Advances in Social Networks Analysis and Mining 2017. Sidney, NSW: ACM (2017). p. 489–96. doi: 10.1145/3110025.3110091
26. De Cristofaro E, Kourtellis N, Leontiadis I, Stringhini G, Zhou S, et al. LOBO: evaluation of generalization deficiencies in twitter bot classifiers. In: Proceedings of the 34th Annual Computer Security Applications Conference. San Juan, PR: ACM (2018). p. 137–46.
27. Chavoshi N, Hamooni H, Mueen A. DeBot: Twitter bot detection via warped correlation. In: ICDM. Barcelona (2016). p. 817–22. doi: 10.1109/ICDM.2016.0096
28. Stukal D, Sanovich S, Bonneau R, Tucker JA. Detecting bots on Russian political Twitter. Big Data. (2017) 5:310–24. doi: 10.1089/big.2017.0038
29. Varol O, Ferrara E, Davis C, Menczer F, Flammini A. Online human-bot interactions: detection, estimation, and characterization. In: International Conference on Web and Social Media. Montreal, QC (2017). p. 280–9.
30. Goh KI, Barabási AL. Burstiness and memory in complex systems. Europhys Lett. (2008) 81:48002. doi: 10.1209/0295-5075/81/48002
31. Halfaker A, Keyes O, Kluver D, Thebault J, Nguyen T, Shores K, et al. User session identification based on strong regularities in inter-activity time. In: WWW'15. Florence (2015). doi: 10.1145/2736277.2741117
32. Savage S, Monroy-Hernandez A, Höllerer T. Botivist: calling volunteers to action using online bots. In: CSCW. San Francisco, CA (2016). p. 813–22. doi: 10.1145/2818048.2819985
33. Mønsted B, Sapie zyński P, Ferrara E, Lehmann S. Evidence of complex contagion of information in social media: an experiment using Twitter bots. PLoS ONE. (2017) 12:e184148. doi: 10.1371/journal.pone.0184148
34. Metaxas PT, Mustafaraj E. Social media and the elections. Science. (2012) 338:472–3. doi: 10.1126/science.1230456
35. Ferrara E, Wang WQ, Varol O, Flammini A, Galstyan A. Predicting online extremism, content adopters, and interaction reciprocity. In: Social Informatics: 8th Intl. Conf. (2016) p. 22–39. doi: 10.1007/978-3-319-47874-6_3
36. Ferrara E. Contagion dynamics of extremist propaganda in social networks. Inform Sci. (2017) 418:1–12. doi: 10.1016/j.ins.2017.07.030
37. Ferrara E. Manipulation and abuse on social media. SIGWEB Newslett. (2015) 4. doi: 10.1145/2749279.2749283
38. Allem JP, Ferrara E. The importance of debiasing social media data to better understand e-cigarette-related attitudes and behaviors. J Med Intern Res. (2016) 18:e219. doi: 10.2196/jmir.6185
39. Allem JP, Ferrara E, Uppu SP, Cruz TB, Unger JB. E-cigarette surveillance with social media data: social bots, emerging topics, and trends. JMIR Public Health Surveillance. (2017) 3:e98. doi: 10.2196/publichealth.8641
40. Allem JP, Ferrara E. Could social bots pose a threat to public health? Am J Public Health. (2018) 108:1005. doi: 10.2105/AJPH.2018.304512
41. Chen E, Lerman K, Ferrara E. #COVID-19: The First Public Coronavirus Twitter Dataset. arXiv preprint arXiv:200307372 (2020).
42. Mitter S, Wagner C, Strohmaier M. A categorization scheme for socialbot attacks in online social networks. In: Web Science. Paris (2013).
45. Stein T, Chen E, Mangla K. Facebook immune system. In: Proc. of the 4th Workshop on Social Network Systems. Salzburg: ACM (2011). p. 8. doi: 10.1145/1989656.1989664
46. Beutel A, Xu W, Guruswami V, Palow C, Faloutsos C. Copycatch: stopping group attacks by spotting lockstep behavior in social networks. In: WWW'13. Rio de Janeiro (2013). p. 119–30. doi: 10.1145/2488388.2488400
47. Wang G, Konolige T, Wilson C, Wang X, Zheng H, Zhao BY. You are how you click: clickstream analysis for sybil detection. In: Proc. USENIX Security. Washington, DC: Citeseer (2013). p. 1–15.
48. Yang Z, Wilson C, Wang X, Gao T, Zhao BY, Dai Y. Uncovering social network sybils in the wild. TKDD. (2014) 8:4. doi: 10.1145/2556609
49. Cao Q, Sirivianos M, Yang X, Pregueiro T. Aiding the detection of fake accounts in large scale social online services. In: 9th USENIX Symp on Netw Sys Design & Implement. San Jose, CA (2012). p. 197–210.
50. Alvisi L, Clement A, Epasto A, Lattanzi S, Panconesi A. Sok: The evolution of sybil defense via social networks. In: SP'13. Berkeley, CA (2013). doi: 10.1109/SP.2013.33
51. Chu Z, Gianvecchio S, Wang H, Jajodia S. Who is tweeting on Twitter: human, bot, or cyborg? In: ACSAC'10. New York, NY (2010). p. 21–30. doi: 10.1145/1920261.1920265
52. Wang G, Mohanlal M, Wilson C, Wang X, Metzger M, Zheng H, et al. Social turing tests: crowd sourcing sybil detection. In: Proc. 20th Network & Distributed System Security Symposium. San Diego, CA (2013).
53. Ferrara E, Varol O, Menczer F, Flammini A. Detection of promoted social media campaigns. In: Proc. Intl. AAAI Conference on Web and Social Media. (2016). Available online at: http://www.aaai.org/ocs/index.php/ICWSM/ICWSM16/paper/view/13034
54. Varol O, Ferrara E, Menczer F, Flammini A. Early detection of promoted campaigns on social media. EPJ Data Sci. (2017) 6:13. doi: 10.1140/epjds/s13688-017-0111-y
55. Lee K, Eoff BD, Caverlee J. Seven months with the devils: a long-term study of content polluters on Twitter. In: ICWSM'11. (2011).
Keywords: social bots, behavioral dynamics, social media, bot detection, online behavior
Citation: Pozzana I and Ferrara E (2020) Measuring Bot and Human Behavioral Dynamics. Front. Phys. 8:125. doi: 10.3389/fphy.2020.00125
Received: 27 February 2020; Accepted: 30 March 2020;
Published: 22 April 2020.
Edited by:
Marco Alberto Javarone, University College London, United KingdomReviewed by:
Marco Antonio Amaral, Federal University of Southern Bahia, BrazilAndrea Galluzzi, Istituto Superiore di Sanità (ISS), Italy
Copyright © 2020 Pozzana and Ferrara. This is an open-access article distributed under the terms of the Creative Commons Attribution License (CC BY). The use, distribution or reproduction in other forums is permitted, provided the original author(s) and the copyright owner(s) are credited and that the original publication in this journal is cited, in accordance with accepted academic practice. No use, distribution or reproduction is permitted which does not comply with these terms.
*Correspondence: Iacopo Pozzana, iacopo@dcs.bbk.ac.uk