Forecasting COVID-19
 Matjaž Perc
 Nina Gorišek Miksić4,5
  Andraž Stožer
- 1Faculty of Natural Sciences and Mathematics, University of Maribor, Maribor, Slovenia
- 2China Medical University Hospital, China Medical University, Taichung, Taiwan
- 3Complexity Science Hub Vienna, Vienna, Austria
- 4Maribor University Medical Center, Maribor, Slovenia
- 5Faculty of Medicine, University of Maribor, Maribor, Slovenia
The World Health Organization declared the coronavirus disease 2019 a pandemic on March 11th, pointing to the over 118,000 cases in over 110 countries and territories around the world at that time. At the time of writing this manuscript, the number of confirmed cases has been surging rapidly past the half-million mark, emphasizing the sustained risk of further global spread. Governments around the world are imposing various containment measures while the healthcare system is bracing itself for tsunamis of infected individuals that will seek treatment. It is therefore important to know what to expect in terms of the growth of the number of cases, and to understand what is needed to arrest the very worrying trends. To that effect, we here show forecasts obtained with a simple iteration method that needs only the daily values of confirmed cases as input. The method takes into account expected recoveries and deaths, and it determines maximally allowed daily growth rates that lead away from exponential increase toward stable and declining numbers. Forecasts show that daily growth rates should be kept at least below 5% if we wish to see plateaus any time soon—unfortunately far from reality in most countries to date. We provide an executable as well as the source code for a straightforward application of the method on data from other countries.
1. Introduction
According to data in real time [1], confirmed coronavirus disease 2019 (COVID-19) cases are growing exponentially in most countries around the world. In Italy and Spain the pandemic is already overburdening the healthcare system [2], and shall the current trends persist, it will not take long before this becomes the grim reality also in many other European countries and the United States. Forecasting COVID-19 dissemination thus plays a key role [3–7]. In the first place, to inform governments and healthcare professional what to expect and which measures to impose, and secondly, to motivate the wider public to adhere to the measures that were imposed to decelerate the spreading lest a regrettable scenario will unfold [8, 9].
Research on epidemic processes has a long and fruitful history in statistical physics [10, 11]. Simple mathematical models that describe the essence of epidemic spreading can be used to fit the data with an overseeable number of parameters, and the obtained values can then be used to make informed predictions. In recent years, the research community has also accumulated overwhelming evidence in favor of complex and heterogeneous connectivity patterns in social networks [12–16]. These play a key role in determining the behavior of equilibrium and non-equilibrium systems in general, and the spreading of epidemics and finding optimal containment strategies in particular.
Interdisciplinary explorations at the interface of statistical physics, network science, and epidemiology, driven by massive amounts of data recording our health and way of life, have given rise to digital epidemiology [17] and to the theory of epidemic processes on complex networks [10]. From classical models that assume well-mixed populations, to the more recent models that account for behavioral feedback and the structure of our social networks, we have come a long way in better understanding disease transmission and disease dynamics. We are now able to use this knowledge to develop effective prevention strategies [11], and more broadly, we can use the synergies between these different fields of research to improve our lives and societies [18, 19].
Nonetheless, in times of urgency even the simplest model can be too complicated, and the small gaps between different fields of research can seem like gapping holes. In this paper, we therefore present a simple iterative method to forecast the number of COVID-19 cases, under the assumption that governmental data is legitimate and truthful. The goal is not to strive for meticulous accuracy nor to present our method as the state of the art, but simply to provide first insights and guidelines on elementary principles. We will be happy if our work motivates further research to yield more elaborate and accurate prediction methods.
2. Method
As input, our method requires only the readily available daily values of confirmed cases. We denote these values as xi, where i ∈ [0, n) is the index of days. Assuming we have n values available in total, we take the last m values of the xi series and determine the average growth rate during this time according to
We also record the minimal and the maximal growth rate during the last m days as G↓ and G↑, respectively. The simple iteration
already provides a decent forecast beyond i = n − 1, assuming the original m values are described well by exponential growth.
This, however, does not take into account that after h ≈ 14 days the majority of infected will recover, and that after d ≈ 21 days a fraction p ≈ 0.04 will die [1, 20–22] (see also ourworldindata.org/coronavirus). By acknowledging these case-recovery and fatality rates, we obtain a better forecast
where the asterisk emphasizes that is not the value that enters back into Equation (2) at the next iteration. If that was the case, the forecasted numbers of cases would drop fast. That might be a reasonable assumption if the number of infected would approach the population size, and if recovering from COVID-19 would mean becoming immune to the disease [23]. The former is not yet the case, while the later is also questionable given that there are reports of individuals being reinfected and the fact that there are now more different strains of SARS-CoV-2 identified and that the viral genome is evolving rapidly [24–26] (see also nextstrain.org/#ncov). Also of note, the values h, d, and p for COVID-19 vary significantly in the existing literature [1, 20–22, 27–29], but it is not the scope of this paper to determine them accurately. Rather, we use what seem to be reasonable estimates to illustrate our point. Importantly, sensible variations in h, d, and p do not affect the forecast that significantly. The key factor is the average growth rate G△, determined as per Equation (1).
We have found 7 ≤ m ≤ 14 to yield good results, whereby the lower bound ensures a reasonable statistics on G△ while the upper bound should still satisfy n − 1 − m ≥ d lest we run out of data (i < 0) in xi − d in Equation (3). We use m = 14 for the forecasts shown in Figure 1. Lastly, if we wish to rely on actual data in Equation (3) beyond i = n − 1, and taking into account h < d, we have to impose a forecasting horizon no longer than n − 1 + h.
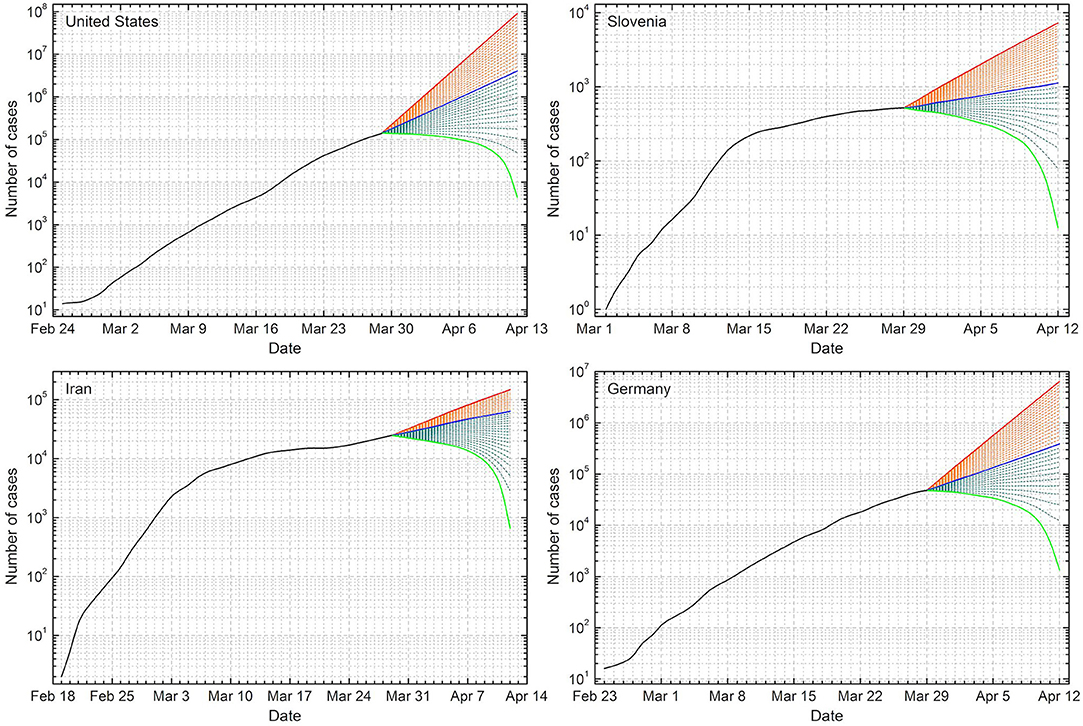
Figure 1. Forecasts of COVID-19 cases for the United States, Slovenia, Iran, and Germany. Black solid line denotes the actual data, which were for this analysis last updated March 29th. From this date onward we thus have the predicted values, where the solid blue line denotes the continuation of the trend of the past 14 days, i.e., if nothing would change. The uppermost solid red line denotes the prediction obtained if the maximal daily growth rate recorded during the past 14 days G↑ would increase by 20%, while the lowermost green line denotes the prediction if the daily growth rate would drop to zero from March 29th onward. Orange and olive dashed lines denote predictions for equally spaced decreasing daily growth rates from top to bottom. Plateaus in the next 14 days would be reached if: United States target daily growth rate ≈ 5.9% (4th line from the bottom), Slovenia target daily growth rate ≈ 3.7% (7th line from the bottom), Iran target daily growth rate ≈ 3.6% (10th line from the bottom), and Germany target daily growth rate ≈ 5.5% (5th line from the bottom).
We provide an executable as well as the source code in C for a straightforward application of the above method on any data. The executable searches for the file data.txt in the directory and reads the daily values of confirmed cases, which should be provided one number per line. The executable also asks for the year, month, and day of the first entry in the data.txt file, and for the value of m. The first output file is actual.txt, which contains three space separate columns, being the date, the number of cases on said date (returns what is in data.txt minus those recovered and dead up to then), and the growth rate during the previous day. The second output file is forecast.txt, which also contains three space separate columns, being the date, the forecasted number of cases on said date, and the average daily growth rate used for the prediction. The forecast is made for thirty different average daily growth rates, starting from a 20% increased G↑ (as determined whilst calculating G△ via Equation 1) and decreasing in equal intervals toward growth rate zero. Forecasts obtained with different growth rates are separated with an empty line.
3. Forecast
Results of the method are shown in Figure 1 for the United States, Slovenia, Iran, and Germany for 2 weeks onwards from March 29th. If the average growth rates during the past 14 days, corresponding to ≈ 30.6% for the United States, ≈ 9.0% for Slovenia, ≈ 7.5% for Iran, and ≈ 18.7% for Germany, persist, we will be looking at ≈ 3.9 million cases in the United States, ≈ 1, 200 cases in Slovenia, ≈ 63, 000 cases in Iran, and ≈ 380, 000 cases in Germany by April 12th, as shown by the solid blue lines in each graph. If the daily growth rates miraculously dropped to zero overnight, we would see what is shown with the solid green lines. That is of course completely unrealistic, but serves to illustrate what would be the best-case scenario. Solid red lines show the forecast obtained if the maximal daily growth rate recorded during the past 14 days, corresponding to ≈ 48.9% for the United States, ≈ 15.5% for Slovenia, ≈ 9.9% for Iran, and ≈ 34.2% for Germany, would increase by 20%. This is not the worst-case scenario, but it is arguably bad enough. According to this, Slovenia would have ≈ 7, 300 cases by April 12th, for example.
Given that the exponential growth still persists in all four examples considered in this work—note that the vertical scale in all graphs is logarithmic, and that straight lines thus correspond to exponential growth—the first goal is to arrest this very worrying trend. Between the green and the blue line we show forecasts obtained for daily growth rates between zero and the average of the past 14 days with dashed olive lines. By following the lines from bottom upwards, starting with the solid green line, we can identify the one that flattens out by April 12th. For the United States, for example, it is the 4th line, which corresponds to the ≈ 5.9% daily growth rate from March 29th onwards. This would thus be the target if we wished to see a plateau in the next 2 weeks there. For Germany the same target is ≈ 5.5% (5th line from the bottom), for Slovenia it is ≈ 3.7% (7th line from the bottom), and for Iran it is ≈ 3.6% (10th line from the bottom).
These are of course only approximate target values, but by and large, targeting daily growth rates below at least 5% seems reasonable and in line with what the countries that have thus far successfully responded to the COVID-19 pandemic have achieved.
4. Outlook
As we hope the presented forecasts clearly show, epidemic growth is a highly non-linear process, where every day lost to inaction is a day too much. Even just a few days down the road not acting today can mean the difference between a manageable situation and a hopelessly overburdened healthcare system. The outlook very much depends on whether we take these facts to heart and act accordingly, or not. Governments can impose traveling bans, close down shops and restaurants, and encourage us to stay at home. Ultimately, however, it is on each one of us to respect these restrictions and to do all that we can to minimize the chances for further infections.
Keeping the daily growth rates at least below 5% is an important target for a promising outlook. Data from China, where the COVID-19 pandemic seems to be coming to an end, confirm this prognosis. Around mid February the daily growth rates there dropped to around 4% and then to 3% and lower. This marked the beginning of the plateau of confirmed cases, which together with recoveries and deaths led to declining numbers of infected individuals. Singapore, South Korea, and Hong Kong, have also successfully turned their epidemics around by employing strict tactics used in China. Unfortunately, this has not been the case in many other countries [30].
We have two options. The first is to show collective intelligence and restrict our behavior so that new COVID-19 cases will not grow as rapidly as they do now. The second is that we continue to let it slide, until the situation will become so dire that draconian governmental decrees will force us to restrict our behavior [30]. There is still time to act, but a rosy outlook is moving away from us exponentially fast.
Data Availability Statement
Publicly available datasets were analyzed in this study. The executable, source code and data are available at: http://www.matjazperc.com/COVID-19.
Author Contributions
MP and AS designed and performed the research. MP, NG, MS, and AS wrote the manuscript.
Funding
This work was supported by the Slovenian Research Agency (Grant Nos. J4-9302, J1-9112, J2-1725, J3-9289, P1-0403, P3-0396, N3-0048, N3-0133, and I0-0029).
Conflict of Interest
The authors declare that the research was conducted in the absence of any commercial or financial relationships that could be construed as a potential conflict of interest.
References
1. Dong E, Du H, Gardner L. An interactive web-based dashboard to track COVID-19 in real time. Lancet Infect Dis. (2020). doi: 10.1016/S1473-3099(20)30120-1. [Epub ahead of print].
2. Remuzzi A, Remuzzi G. COVID-19 and Italy: what next? Lancet. (2020). doi: 10.1016/S0140-6736(20)30627-9. [Epub ahead of print].
3. Li Q, Guan X, Wu P, Wang X, Zhou L, Tong Y, et al. Early transmission dynamics in Wuhan, China, of novel coronavirus–infected pneumonia. N Engl J Med. (2020) 382:1199–207. doi: 10.1056/NEJMoa2001316
4. Zhou T, Liu Q, Yang Z, Liao J, Yang K, Bai W, et al. Preliminary prediction of the basic reproduction number of the Wuhan novel coronavirus 2019-nCoV. J Evid Based Med. (2020) 13:3–7. doi: 10.1111/jebm.12376
5. Zhao S, Lin Q, Ran J, Musa SS, Yang G, Wang W, et al. Preliminary estimation of the basic reproduction number of novel coronavirus (2019-nCoV) in China, from 2019 to 2020: a data-driven analysis in the early phase of the outbreak. Int J Infect Dis. (2020) 92:214–7. doi: 10.1016/j.ijid.2020.01.050
6. Liu Y, Gayle AA, Wilder-Smith A, Rocklöv J. The reproductive number of COVID-19 is higher compared to SARS coronavirus. J Travel Med. (2020) 27:taaa021. doi: 10.1093/jtm/taaa021
7. Lai A, Bergna A, Acciarri C, Galli M, Zehender G. Early phylogenetic estimate of the effective reproduction number of SARS-CoV-2. J Med Virol. (2020). doi: 10.1002/jmv.25723. [Epub ahead of print].
8. Ippolito G, Hui DS, Ntoumi F, Maeurer M, Zumla A. Toning down the 2019-nCoV media hype – and restoring hope. Lancet Respir Med. (2020) 8:230–1. doi: 10.1016/S2213-2600(20)30070-9
9. McCloskey B, Zumla A, Ippolito G, Blumberg L, Arbon P, Cicero A, et al. Mass gathering events and reducing further global spread of COVID-19: a political and public health dilemma. Lancet. (2020) 395:1096–9. doi: 10.1016/S0140-6736(20)30681-4
10. Pastor-Satorras R, Castellano C, Van Mieghem P, Vespignani A. Epidemic processes in complex networks. Rev Mod Phys. (2015) 87:925. doi: 10.1103/RevModPhys.87.925
11. Wang Z, Bauch CT, Bhattacharyya S, d'Onofrio A, Manfredi P, Perc M, et al. Statistical physics of vaccination. Phys Rep. (2016) 664:1–113. doi: 10.1016/j.physrep.2016.10.006
12. Boccaletti S, Latora V, Moreno Y, Chavez M, Hwang D. Complex networks: structure and dynamics. Phys Rep. (2006) 424:175–308. doi: 10.1016/j.physrep.2005.10.009
13. Holme P, Saramäki J. Temporal networks. Phys Rep. (2012) 519:97–125. doi: 10.1016/j.physrep.2012.03.001
14. Boccaletti S, Bianconi G, Criado R, del Genio C, Gómez-Gardeñes J, Romance M, et al. The structure and dynamics of multilayer networks. Phys Rep. (2014) 544:1–122. doi: 10.1016/j.physrep.2014.07.001
15. Kivelä M, Arenas A, Barthelemy M, Gleeson JP, Moreno Y, Porter MA. Multilayer networks. J Complex Netw. (2014) 2:203–71. doi: 10.1093/comnet/cnu016
16. Lü L, Chen D, Ren X-L, Zhang Q-M, Zhang Y-C, Zhou T. Vital nodes identification in complex networks. Phys Rep. (2016) 650:1–63. doi: 10.1016/j.physrep.2016.06.007
17. Salathe M, Bengtsson L, Bodnar TJ, Brewer DD, Brownstein JS, Buckee C, et al. Digital epidemiology. PLoS Comput Biol. (2012) 8:e1002616. doi: 10.1371/journal.pcbi.1002616
18. Helbing D, Brockmann D, Chadefaux T, Donnay K, Blanke U, Woolley-Meza O, et al. Saving human lives: what complexity science and information systems can contribute. J Stat Phys. (2015) 158:735–81. doi: 10.1007/s10955-014-1024-9
20. Huang C, Wang Y, Li X, Ren L, Zhao J, Hu Y, et al. Clinical features of patients infected with 2019 novel coronavirus in Wuhan, China. Lancet. (2020) 395:497–506. doi: 10.1016/S0140-6736(20)30183-5
21. Lazzerini M, Putoto G. COVID-19 in Italy: momentous decisions and many uncertainties. Lancet Glob Health. (2020). doi: 10.1016/S2214-109X(20)30110-8. [Epub ahead of print].
22. Baud D, Qi X, Nielsen-Saines K, Musso D, Pomar L, Favre G. Real estimates of mortality following covid-19 infection. Lancet Infect Dis. (2020). doi: 10.1016/S1473-3099(20)30195-X. [Epub ahead of print].
23. Chen D, Xu W, Lei Z, Huang Z, Liu J, Gao Z, et al. Recurrence of positive sars-cov-2 rna in covid-19: a case report. Int J Infect Dis. (2020). doi: 10.1016/j.ijid.2020.03.003. [Epub ahead of print].
24. Zhou P, Yang X-L, Wang X-G, Hu B, Zhang L, Zhang W, et al. A pneumonia outbreak associated with a new coronavirus of probable bat origin. Nature. (2020) 579:270–3. doi: 10.1038/s41586-020-2012-7
25. Ceraolo C, Giorgi FM. Genomic variance of the 2019-nCoV coronavirus. J Med Virol. (2020) 92:522–8. doi: 10.1002/jmv.25700
26. Tang X, Wu C, Li X, Song Y, Yao X, Wu X, et al. On the origin and continuing evolution of SARS-CoV-2. Nat Sci Rev. (2020) nwaa036. doi: 10.1093/nsr/nwaa036
27. Lauer SA, Grantz KH, Bi Q, Jones FK, Zheng Q, Meredith HR, et al. The incubation period of coronavirus disease 2019 (covid-19) from publicly reported confirmed cases: estimation and application. Ann Intern Med. (2020). doi: 10.7326/M20-0504. [Epub ahead of print].
28. Jung S, Akhmetzhanov AR, Hayashi K, Linton NM, Yang Y, Yuan B, et al. Real-time estimation of the risk of death from novel coronavirus (COVID-19) infection: inference using exported cases. J Clin Med. (2020) 9:523. doi: 10.3390/jcm9020523
29. Zhou F, Yu T, Du R, Fan G, Liu Y, Liu Z, et al. Clinical course and risk factors for mortality of adult inpatients with COVID-19 in Wuhan, China: a retrospective cohort study. Lancet. (2020) 395:1054–62. doi: 10.1016/S0140-6736(20)30566-3
Keywords: COVID-19, pandemic, disease dynamics, exponential growth, virality
Citation: Perc M, Gorišek Miksić N, Slavinec M and Stožer A (2020) Forecasting COVID-19. Front. Phys. 8:127. doi: 10.3389/fphy.2020.00127
Received: 30 March 2020; Accepted: 01 April 2020;
Published: 08 April 2020.
Edited by:
Alex Hansen, Norwegian University of Science and Technology, NorwayReviewed by:
Adriano Barra, University of Salento, ItalyXingru Chen, Dartmouth College, United States
Copyright © 2020 Perc, Gorišek Miksić, Slavinec and Stožer. This is an open-access article distributed under the terms of the Creative Commons Attribution License (CC BY). The use, distribution or reproduction in other forums is permitted, provided the original author(s) and the copyright owner(s) are credited and that the original publication in this journal is cited, in accordance with accepted academic practice. No use, distribution or reproduction is permitted which does not comply with these terms.
*Correspondence: Matjaž Perc, matjaz.perc@gmail.com