Predicting COVID-19 Peaks Around the World
 Constantino Tsallis1,2,3
  Ugur Tirnakli4*
- 1Centro Brasileiro de Pesquisas Fisicas, National Institute of Science and Technology for Complex Systems, Rio de Janeiro, Brazil
- 2Santa Fe Institute, Santa Fe, NM, United States
- 3Complexity Science Hub Vienna, Vienna, Austria
- 4Department of Physics, Faculty of Science, Ege University, Izmir, Turkey
The official data for the time evolution of active cases of COVID-19 pandemics around the world are available online. For all countries, a peak has been either observed (China and South Korea) or is expected in the near future. The approximate dates and heights of those peaks have important epidemiological implications. Inspired by similar complex behavior of volumes of transactions of stocks at the NYSE and NASDAQ, we propose a q-statistical functional form that appears to describe satisfactorily the available data for all countries. Consistently, predictions of the dates and heights of those peaks in severely affected countries become possible unless efficient treatments or vaccines, or sensible modifications of the adopted epidemiological strategies, emerge.
It is possible to predict the thermostatistical properties of uncountable physical systems at thermal equilibrium through the one-body distribution p(ϵ) ∝ ω(ϵ)e−βϵ, where ω(ϵ) is the density of states as a function of the energy ϵ, multiplied by the celebrated Boltzmann factor e−βϵ, β being the inverse temperature. The function ω(ϵ) comes from mechanical considerations (classical, quantum, relativistic) related with the number of degrees of freedom and does not depend on the temperature; the exponential weight comes instead from standard statistical-mechanical considerations. In many cases it is, either exactly or approximatively, w(ϵ) ∝ ϵα (α ∈ R). For the thermostatistical properties of the stationary- or quasi-stationary-state of wide classes of complex systems, the Boltzmann factor is to be generalized into the q-exponential factor [1–3]. This procedure yielded quite satisfactory results for high-frequency stock-markets, such as the NYSE, NASDAQ, and others [4–6].
Let us focus now on the data available for the COVID-19 pandemics. Soon after the beginning of the pandemics, several studies analyzing the available data and employing different models and candidate functions started to appear in the literature [7–12]. Most of them are interested in the behavior of total cases and fatality curves. We will concentrate here on the analysis of the active cases and deaths per day. Inspection of the public data1 (updated on a daily basis) and, in particular, of the time evolution of the number N of active cases (surely a lower bound of the unknown actual numbers) showed a rather intriguing similarity with the distributions of volumes of stocks. Along this line, we adopt the following functional form for each country or region:
with C > 0, α > 0, β > 0, γ > 0, q > 1, and t0 ≥ 0. The constant t0 indicates the first day of appearance of the epidemic in that particular region; it is conventionally chosen to be zero for China; for the other countries, it is the number of days elapsed between the appearance of the first case in China and the first case in that country. The normalizing constant C reflects the total population of that particular country. For α = 0, if γ = 1, we recover the standard q-exponential expression; if γ = 2, it is currently referred to in the literature as q-Gaussian; for other values of γ, it is referred to as stretched q-exponential. Through the inspection of the roles played by the four non-trivial parameters, namely (α, β, γ, q), it became clear that (α, β) depend strongly on the epidemiological strategy implemented in that region in addition to the biological behavior of the coronavirus in that geographical climate. In contrast, the parameters (γ, q) appear to be more universal, mainly depending on the coronavirus. Therefore, we investigate several countries that have not reached their peaks yet, with the basic assumption that these two parameters would not change much from one country to another, and we fixed these values at the values that we determine for China, since this country has already had nearly the full evolution of the pandemic. This assumption seems to be working. For other countries whose peaks have already been reached, we use the same functional form (1) but adjusting all parameters for a better fit. The results for China and South Korea are given in Figure 1. It is evident that, although the functional form (1) does yield satisfactory results for both China and South Korea, the (γ, q) parameter values differ somewhat for each of these countries. On the other hand, as can easily be seen from Figure 2, our assumption is corroborated by several countries that we have numerically analyzed. In Table 1, we present the forecasted dates and heights of the peaks, as well as the values of the fitting parameters using the data accumulated until April 28, 2020.
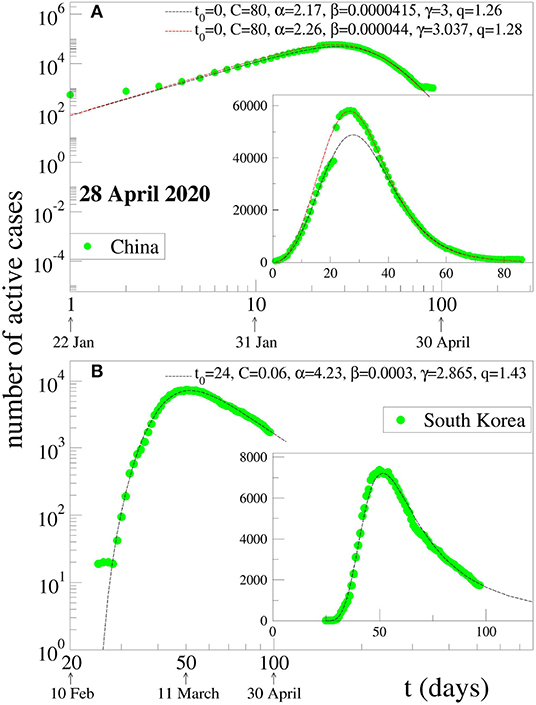
Figure 1. Two possible fits for the evolution of active COVID-19 cases in (A) China and (B) South Korea: the dots are the data available at 28 April 2020, and the lines are fits using Equation (1). For China, a strange kink is present in the ascending part of the data curves, which means that it is not possible to make a single fit that would satisfactorily account for both the increasing and decreasing parts. We here present two log-log representations of different curves that describe either the increasing part or the decreasing part but not both. Inset: linear-linear representation of the same data.
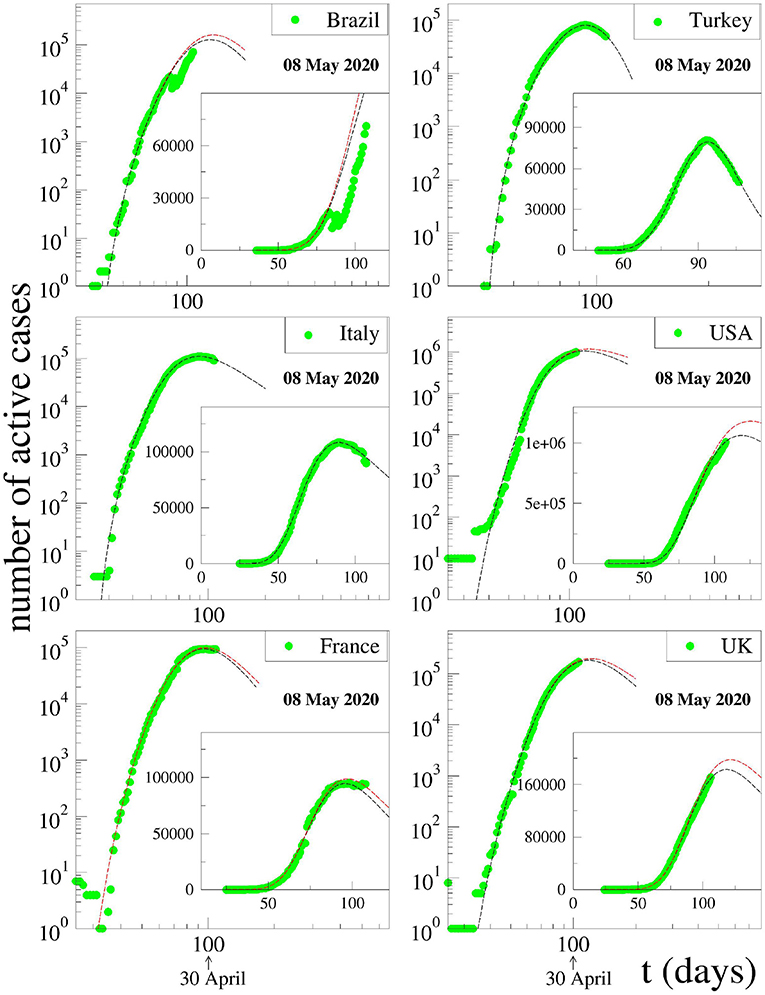
Figure 2. Fits of the data for active cases available on 08 May 2020 for various severely affected countries around the world with Equation (1). The fitting parameters γ and q are fixed at the values for China for all countries that have not yet reached their peak values. Notice that, in the case of Brazil, a disruption occurred in the publicly available data in mid-April. We do not know the cause of this. Coincidentally, however, precisely at that time, the President of Brazil decided to change his Minister for Health.
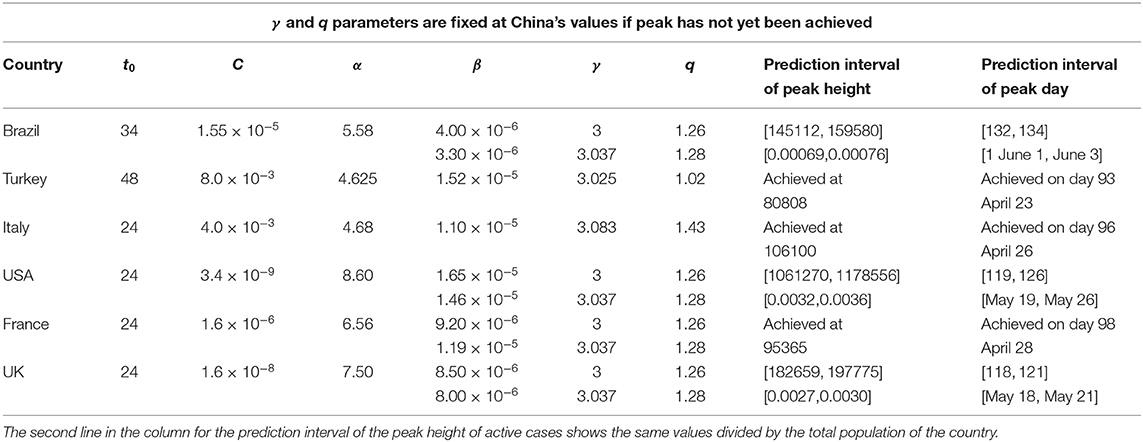
Table 1. The values of the parameters and predictions for the maximum number of active cases and for the day at which the maximum will be achieved.
We also test our formula (1) and assumption for the evolution of deaths per day. Again, we fixed the (γ, q) parameter values at China's results, which can be seen in Figure 3, and tried to fit the data of the same six countries. It is quite surprising to see that the results given in Figure 4 seem to suggest that it is also possible to fit the evolution of deaths per day without changing these two parameters.
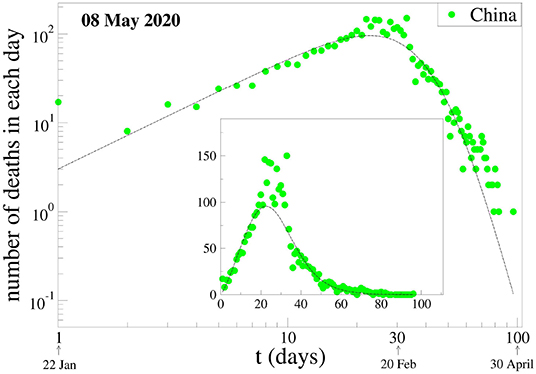
Figure 3. Evolution of deaths due to COVID-19 per day in China. The data are those available at 28 April 2020. The fitting parameters γ and q are fixed at one of the two choices for the values for China, namely (γ, q) = (3, 1.26). The other fitting parameters, namely (Cdeath, αdeath, βdeath), have been chosen to better fit the data available for China.
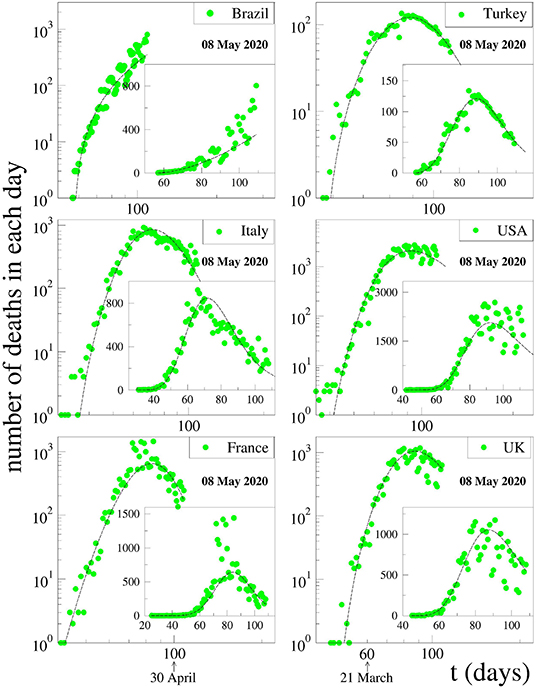
Figure 4. Fits of data on deaths per day for various strongly affected countries around the world with Equation (1). The data are those available at 08 May 2020. The fitting parameters γ and q are fixed at one of the two choices for the values for China, namely (γ, q) = (3, 1.26). The other fitting parameters, namely (Cdeath, αdeath, βdeath), have been chosen to better fit the available data for each country.
We may summarize as follows. The death curve of South Korea is atypical in the sense that it sensibly differs from all of those that we analyzed in the present work. Because of that, we have not included it here. We remind the reader that the values for (γ, q) used for the South Korea evolution curve of active cases also differ from those used for all the other countries, which reinforces the fact that some sort of exceptionality exists there for reasons that are unknown to us. For all countries that have not reached their peak values yet, we have adopted the values of (γ, q) obtained from the inspection of the entire curve of China. In all cases, we have dismissed the form of the short initial transient after the appearance of the first active case. The extrapolation procedure is tested in various countries, as indicated in Figure 5. We have indicated, for four typical countries, how the predicted day and height of the peak evolves with time while gradually incorporating the newly available data (which not only add recent information but also modify old public information, even the day of first appearance of a Covid-19 case in a particular country). As we can see, the peak date is more robustly predicted than the peak height. Indeed, 1 and even 2 months before, it has been possible to correctly predict the date within the span of 1 week. The prediction for the height is more sensitive to the new information and can easily fluctuate between simple and double depending on the country and its pandemic health strategy (or lack of it), in particular as concerns population mobility.
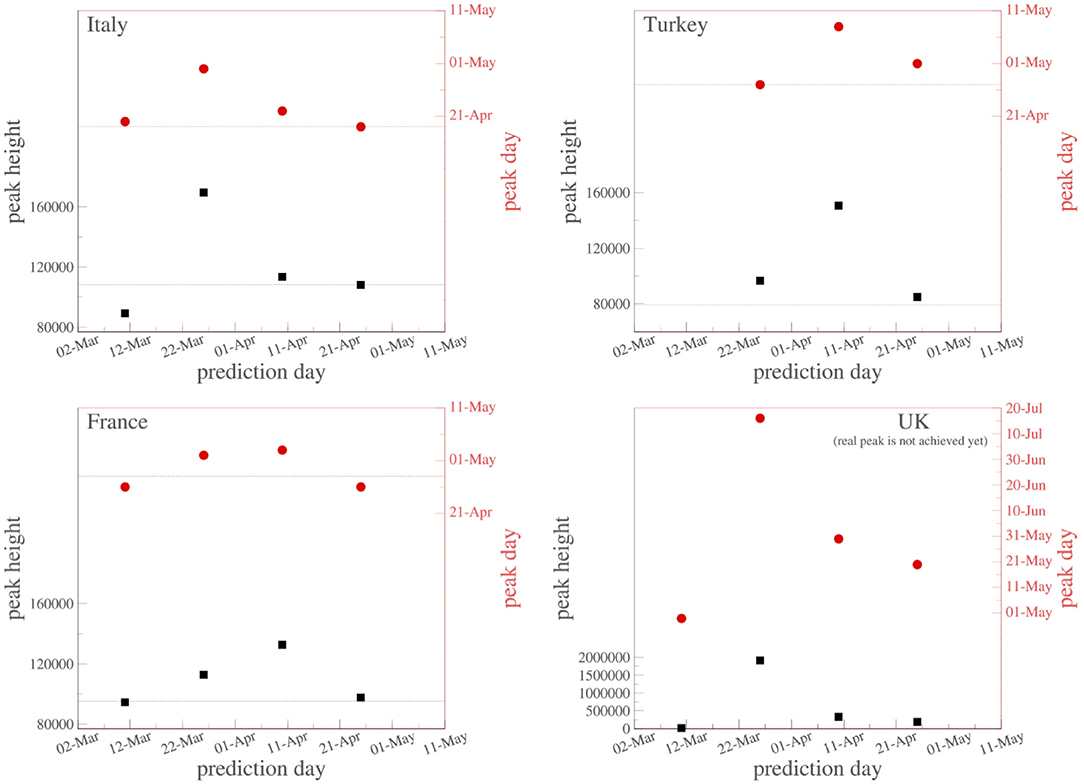
Figure 5. Successive predictions of the date and height of the peak of active cases in Italy, Turkey, France, and the United Kingdom using gradually updated data. The red (black) dashed line indicates, for Italy, Turkey, and France, the currently known real values for the peak date (height). The peak has not yet been achieved in the United Kingdom.
We verify that the present work appears to belong to the realm of complex systems, which includes not only, as mentioned above, high-frequency financial transactions (with α > 0) [4, 5] but also anthropological issues, such as medieval trading networks and biotech intercorporate networks (with α < 0) [13], and relaxation in spin-glasses [14], as well as q-Weibull distribution-like systems [15–18], which correspond to the particular case α = γ − 1. It remains open as a highly desirable goal to formulate a model which, along lines somewhat similar to epidemiological models, such as the SIR one, would predict an evolution curve, such as the present Equation (1). To be more precise, a great variety of SIR-like epidemiological models have been proposed in the literature. They typically yield an increase before the peak quite that is similar to the decrease after the peak. The behavior in our present Equation (1) is at variance with such characteristics, since it provides a power-law increase (with a typically large positive exponent α as illustrated in the table) and a quite different power-law decrease (with negative exponent given by [α − γ/(q − 1)], the absolute value of which can independently be either larger or smaller than α) after the peak. We emphasize that such increase-decrease quantitative behaviors appear to satisfactorily conform to reality, in contrast with the logistic-like growth behavior typical of most SIR-like models. An important issue remains to be clarified, namely the conditions under which the values of (γ, q) could indeed be (strictly or nearly) universal and essentially determined by the biology of the infecting agent, such as the present COVID-19. Let us also mention that, quite obviously, there is nearly everywhere a severe under-notification of the publicly available data for active cases (and even deaths). The real number could easily be 10 times larger, depending on the particular region. However, the consequences of this lack of important information onto the real number of deaths are somewhat mitigated by making use of the case fatality rate, which is relatively stable throughout recent weeks for a given country and can be found at websites, such as2,3. Finally, the present prediction algorithm could, in principle, be included within an internet app, which could access the data publicly available at a given website and automatically update the predicted dates and heights of the disease peaks of epidemics, such as the present Covid-19 one. Any initiative along these lines would be highly welcome.
Data Availability Statement
Publicly available datasets were analyzed in this study. This data can be found here: https://www.worldometers.info/coronavirus/#countries.
Author Contributions
All authors listed have made a substantial, direct and intellectual contribution to the work, and approved it for publication.
Conflict of Interest
The authors declare that the research was conducted in the absence of any commercial or financial relationships that could be construed as a potential conflict of interest.
Acknowledgments
We have benefitted from useful remarks by E. P. Borges, R. Dickman and P. M. C. Oliveira as well as from partial support by CNPq and Faperj (Brazilian Agencies).
Footnotes
1. ^Available online at: https://www.worldometers.info/coronavirus/#countries (accessed May 08, 2020).
2. ^Available online at: https://www.cebm.net/covid-19/global-covid-19-case-fatality-rates/ (accessed May 08, 2020).
3. ^Available online at: https://coronavirus.jhu.edu/data/mortality (accessed May 08, 2020).
References
1. Tsallis C. Possible generalization of Boltzmann-Gibbs statistics. J Stat Phys. (1988) 52:479. doi: 10.1007/BF01016429
2. Gell-Mann M, Tsallis C. Nonextensive Entropy–Interdisciplinary Applications. New York, NY: Oxford University Press (2004).
3. Tsallis C. Introduction to Nonextensive Statistical Mechanics–Approaching a Complex World. New York, NY: Springer (2009).
4. Tsallis C, Anteneodo C, Borland L, Osorio R. Nonextensive statistical mechanics and economics. Phys A. (2003) 324:89. doi: 10.1016/S0378-4371(03)00042-6
5. Osorio R, Borland L, Tsallis C. Distributions of high-frequency stock-market observables. In: Gell-Mann M, Tsallis C, editors. Nonextensive Entropy–Interdisciplinary Applications. New York, NY: Oxford University Press (2004). p. 321.
6. Ruiz G, de Marcos AF. Evidence for criticality in financial data. Eur Phys J B. (2018) 91:1. doi: 10.1140/epjb/e2017-80535-3
7. Zlatic V, Barjašić I, Kadović A, Štefančić H, Gabrielli A. Bi-stability of SUDR+K model of epidemics and test kits applied to COVID-19. (2020) arXiv [Preprint]. arXiv:2003.08479.
8. Vasconcelos GL, Macêdo AMS, Ospina R, Almeida FAG, Duarte-Filho GC, Brum AA, et al. Modelling fatality curves of COVID-19 and the effectiveness of intervention strategies. medRxiv. (2020). doi: 10.1101/2020.04.02.20051557
9. Piccolomini EL, Zama F. Preliminary analysis of COVID-19 spread in Italy with an adaptive SEIRD model. (2020) arXiv [Preprint]. arXiv:2003.09909.
10. Perc M, Gorišek Miksić N, Slavinec M, Stožer A. Forecasting COVID-19. Front Phys. (2020) 8:127. doi: 10.3389/fphy.2020.00127
11. Pluchino A, Biondo AE, Giuffrida N, Inturri G, Latora V, Le Moli R, et al. A novel methodology for epidemic risk assessment: the case of COVID-19 outbreak in Italy. (2020) arXiv [Preprint]. arXiv:2004.02739.
12. Bastos SB, Cajueiro DO. Modeling and forecasting the early evolution of the Covid-19 pandemic in Brazil. (2020) arXiv [Preprint]. arXiv:2003.14288v2.
13. White DR, Kejzar N, Tsallis C, Farmer D, White S. A generative model for feedback network. Phys Rev E. (2006) 73:016119. doi: 10.1103/PhysRevE.73.016119
14. Pickup RM, Cywinski R, Pappas C, Farago B, Fouquet P. Generalized spin glass relaxation. Phys Rev Lett. (2009) 102:097202. doi: 10.1103/PhysRevLett.102.097202
15. Picoli S Jr, Mendes RS, Malacarne LC. q-exponential, Weibull, and q-Weibull distributions: an empirical analysis. Phys A. (2003) 324:678. doi: 10.1016/S0378-4371(03)00071-2
16. Assis EM, Borges EP, Vieira de Melo SAB. Generalized q-Weibull model and the bathtub curve. Int J Qual Reliab Manage. (2013) 30:720. doi: 10.1108/IJQRM-Oct-2011-0143
17. Podesta TSV, Rosembach TV, Dos Santos AA, Martins ML. Anomalous diffusion and q-Weibull velocity distributions in epithelial cell migration. PLoS ONE. (2017) 12:e0180777. doi: 10.1371/journal.pone.0180777
Keywords: COVID-19, pandemics, complex systems, non-extensive statistical mechanics, epidemiology
Citation: Tsallis C and Tirnakli U (2020) Predicting COVID-19 Peaks Around the World. Front. Phys. 8:217. doi: 10.3389/fphy.2020.00217
Received: 24 April 2020; Accepted: 20 May 2020;
Published: 29 May 2020.
Edited by:
Matjaž Perc, University of Maribor, SloveniaReviewed by:
Vinko Zlatic, Rudjer Boskovic Institute, CroatiaLuiz G. A. Alves, Northwestern University, United States
Copyright © 2020 Tsallis and Tirnakli. This is an open-access article distributed under the terms of the Creative Commons Attribution License (CC BY). The use, distribution or reproduction in other forums is permitted, provided the original author(s) and the copyright owner(s) are credited and that the original publication in this journal is cited, in accordance with accepted academic practice. No use, distribution or reproduction is permitted which does not comply with these terms.
*Correspondence: Ugur Tirnakli, ugur.tirnakli@ege.edu.tr