A Portable Ultrasound System for Detecting Food Sweetness Based on Chewing Dynamics: A Preliminary Investigation
 Ye Zhan
 Jingwen Luo2
  Lidai Wang
 Tarunraj Singh
 Jun Xia
- 1Optical and Ultrasonic Imaging Laboratory, Department of Biomedical Engineering, University at Buffalo, State University of New York, Buffalo, NY, United States
- 2Department of Biomedical Engineering, City University of Hong Kong, Hong Kong, China
- 3Control, Dynamics and Estimation Laboratory, Department of Mechanical and Aerospace Engineering, University at Buffalo, State University of New York, Buffalo, NY, United States
Type 1 diabetes (T1D) is an incurable disease that affects 1. 25 million Americans. Diabetic patients typically rely on subcutaneous insulin infusions to regulate their glucose levels. A major contributor to their blood glucose levels is the amount of sugar intake, which cannot be easily tracked. While ultrasound imaging has been used to investigate the relationship between food characteristics and tongue movement, the technique utilized a bulky transducer array that cannot be translated into daily monitoring. Capitalizing on advanced electronics and data processing technologies, we developed a portable system that utilizes only a single ceramic disk to quantify the tongue movement in response to various levels of sweetness. After acquiring 32 subject datasets, we found a significant correlation between food sweetness and tongue movement. Our system can potentially be miniaturized into a wearable device for monitoring sugar intake, which will ultimately help T1D patients to better monitor and control their blood glucose levels and balance their diets accordingly.
Introduction
Type 1 diabetes (T1D) is an autoimmune disease that currently has no cure [1]. People with T1D typically rely on insulin pump therapy (subcutaneous insulin infusion) to control their blood glucose level. Before each meal, T1D patients are recommended to conduct a pre-bolus insulin injection, the amount of which is determined by the projected carbohydrates intake and the personal insulin-to-carb ratio. The pre-bolus approach can effectively avoid a sudden increase in blood glucose level after a meal [2]. However, because it is difficult to quantify the number of carbohydrates in the food, there are uncertainties resulting from this approach. If the dose of injected insulin is largely different from the actual need, the patient may be at risk of hyperglycemia or hypoglycemia. Therefore, there is an unmet clinical need for a portable device that can continuously monitor sugar intake.
The physical and chemical compositions determine the flavor of the food [3, 4], which is also reflected in the chewing behavior. In addition, the biomechanical properties determine the duration and the amount of oral processing before swallowing. For example, solid food is mixed with saliva and fragmented by teeth to form soft, coherent clumps [5]. Low viscosity liquids can be swallowed with minimal processing. But intense flavors, acidic, or icy liquids will remain in the mouth for a longer period of time to increase the pH of the buffer in the saliva and to equilibrate the product to body temperature for further dilution with saliva. Generally, after the start of oral processing, the swallowing process is divided into three-phase, oral transit phase, swallow phase, and clearance phase. Previous experimental results show that during oral transit time, there was a relatively significant movement of the tongue and food characteristics and tongue movement features are closely related [6–8]. Therefore, the texture and flavor of the food may both influence people's chewing behavior. In this research, we will focus on the same food consistency and investigate how different levels of sweetness affect oral processing.
Ultrasonic imaging is a powerful technique used to quantify oral processing [1]. This technique was demonstrated by de Wijk et al. [9] using a linear transducer array, which contained a row of piezoelectric crystals. The ultrasonic probe was placed under the subject's chin to receive the sagittal-view image of the tongue. The ultrasound probe can generate a video of tongue images through internal computer analysis. By processing temporal B-scan images, with the tongue as the region of interest, the magnitude of tongue movements can be quantified [10]. René's research investigated the taste attributes, specifically sweetness and bitterness [9]. However, this technique can be relatively bulky because a transducer array is required to capture the B-scan image.
To address this issue, we replaced the transducer array with a single ceramic disk and developed an algorithm to quantify the tongue movement based on A-line ultrasound data, which is also widely used in the medical field [11]. In terms of data acquisition, we used a smartphone-based recording system that is portable and more energy-efficient than the transducer arrays used in the previous study [12]. Our study indicates that there is a correlation between the tongue movement and food sweetness, and our design could potentially be translated into a wearable device for daily monitoring of sugar intake.
Materials
Figure 1 shows a schematic drawing of our system. A 4.25 MHz ceramic disk with a diameter of 7 mm and thickness of 0.5 mm (Steminc) was used for ultrasound transmission and receiving. Ultrasound pulses were provided by an ultrasound pulse-receiver (Panasonic, Model 5070PR), which outputs 50 ns pulses at 100 Hz (repetition rate). Before the experiment, we applied ultrasound gel to the ceramic disk. We then attached it under the chin of the subject (about two fingers away from the tip of the chin) using adhesive tape. Since we used a planar transducer element with 7 mm diameter field of view, a slight shift in the transducer placement will not impact the result. The reflected ultrasound echo signal was detected by a portable oscilloscope (SmartScope) with a sampling frequency of 50 MHz. For each A-line, we acquired 2,048 points, which corresponds to 40 μs of data acquisition time. This time period corresponds to a 6 cm travel distance in tissue and is sufficient for the collection of reflected signals from the tongue. The SmartScope was connected to the smartphone through a USB cable and all acquisition parameters were controlled from the smartphone app. The received signals were displayed in real-time on the smartphone and saved in its memory for future analysis.
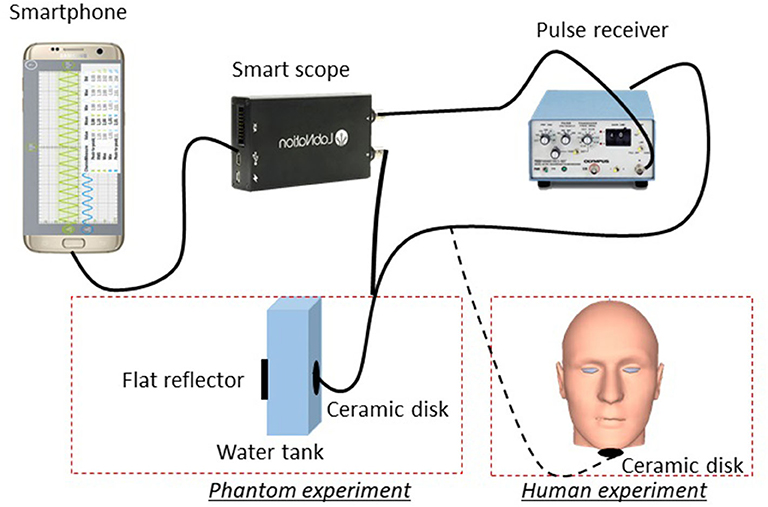
Figure 1. A schematic drawing of the experimental set-up.
For phantom experiments, we placed the ceramic transducer inside a 10-mm-wide water tank. A metal plate was placed at the other side of the tank to serve as an acoustic reflector. The echo arrival time reveals the distance between the transducer and the metal plate. To simulate the tongue motion, we used a voice-coil motor to move the reflector at different amplitudes and frequencies. The phantom experimental results will be used to verify whether our data processing method can reflect different motion states (vibration amplitudes and frequencies).
For human trials, our subjects' ages range between 19 and 30 years old, and the ratio of male to female was about 1:1. Based on visual assessment, all subjects are within the healthy body mass index (BMI) range (20–25). All experiments were conducted at room temperature (25°C). During the experiment, the ceramic transducer was placed under the chin, while the surface of the tongue acted as the reflector. To test the relationship between food sweetness and tongue movement, food with three different sweetness levels (high, middle, and low) were prepared based on a mixture of 300 ml skim milk and 15 g gelatin (Kraft Heinz Foods Company). Low-sweetness samples were prepared without sweetener, middle-sweetness samples were prepared by adding 10 g of sweetener (Truvia, Cargill, Inc.), and high-sweetness samples were prepared by adding 20 g of sweetener. Samples were then distributed into an ice cube maker (5 g/cube) and solidified in a freezer for 4 h. After solidification, the samples sat at room temperature for 20 min before the experiment [9]. To avoid influence from food attribute, each sample cube is identical in size, hardness, and smell. The subjects were given the samples (around 15 × 15 × 15 mm), and the process of chewing in the bulk phase was recorded for 7 s using the SmartScope. Recording started immediately at the beginning of chewing and ended 7 s later. This period covered the bulk phase (the first 5 s of oral processing), where oral movement is highly correlated with food characteristics [9]. During the experiment, the subjects were told to avoid speaking. No special instructions regarding oral movement and swallowing were provided. To avoid any interference between the contiguous measurements, subjects were asked to rinse their mouths with water before and after each experiment and between each trial. The procedure was repeated two times for each subject. Three food samples at three different sweetness levels were tested twice for each subject, generating 192 datasets (3 sweetness level × 2 tests × 32 subjects). These datasets will be processed and compared with the different sweetness levels of the food sample to evaluate their correlation.
Data Processing Methods
Figure 2 shows an acoustic A-line acquired in the phantom experiment. The oscillation at time zero corresponds to acoustic firing. The reflected echo signal is shown at around 25 μs, which corresponds to the total travel time for the acoustic pulse. As we moved the reflector closer to the transducer, the peak (red) also shifted to the left accordingly. This result clearly indicates that the movement of the flat reflector can be precisely monitored by pulse-echo ultrasound. The same principle was used to capture tongue movement.
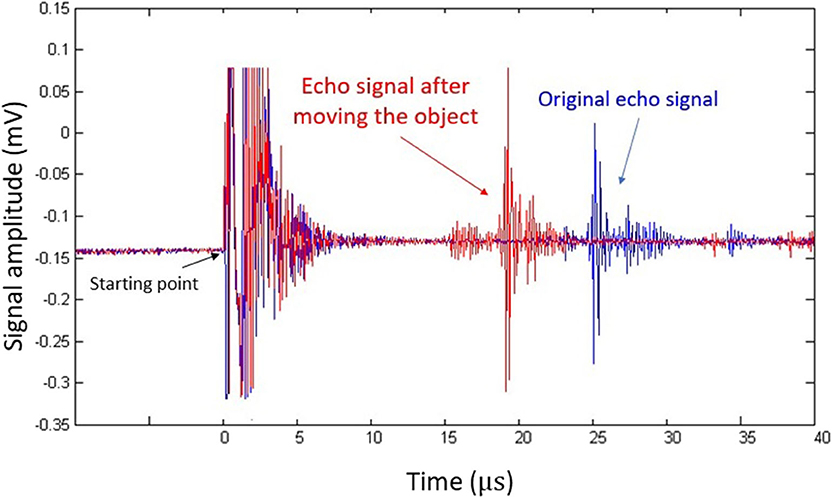
Figure 2. Pulse-echo ultrasound signal acquired in the phantom experiment. The blue plot represents the original echo signal, while the red one represents signals acquired after the flat reflector was placed closer to the transducer.
To quantify the movement of the reflector, we developed two algorithms: one was based on cross-correlation (CC), while the other was based on standard deviation (STD). The CC method has been widely used to quantify the shift between two plots by computing their cross-correlation coefficient [9]. In our case, each A-line signal records the instantaneous position of the tongue. The magnitude and frequency of the reflector movement can be calculated by cross-correlating the two neighboring A-lines [7]. If there was no movement, the correlation coefficient would be 1.00. Otherwise, the correlation coefficient would be <1.00. The larger the movement, the smaller the correlation coefficient. However, breathing and heartbeat can cause slight fluctuations, which can influence the result of the correlation coefficient method. The STD approach may address this issue because it represents the volatility of tongue movements. STD focuses on the signal fluctuation within a specific window in the A-line (oral processing). The intense tongue movement creates a larger signal fluctuation, leading to a higher variation. Movements caused by respiration or heartbeat are much milder than that of the tongue, and therefore they have limited influence on the STD values. In contrast, any small shifts in the A-line may lead to a change in the CC value. Because all subjects are within the healthy BMI range, variations in the amount of adipose tissue in the chin are not significant. Nevertheless, for each subject, we manually verified the data processing window to ensure that it covers the tongue surface.
A quantitative score, named the fractal index (FI), is used to quantify the movement based on A-lines or STD values. FI reflects the sum of the first derivative of the CC or STD processed data. René's work [9] verified that the FI factor of the CC-processed data is positively correlated with the movement amplitude and intensity of the echo. In this study, we verified whether the STD-derived FI would offer similar or better results.
Results
The algorithms were first validated in the phantom. The movement was created by a voice coil actuator, which oscillates the reflecting metal plate. To mimic different magnitudes of tongue movement at the same frequency, we fixed the driving frequency at 10 Hz and increased the driving voltage from 3 to 9 V. Results from the correlation coefficient method are presented in Figure 3A, and the results from the STD method are presented in Figure 3B. The results show that the FI factor is positively correlated with the movement magnitude.
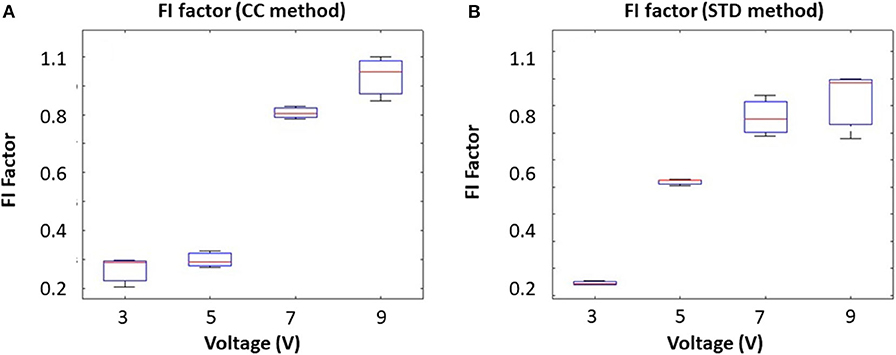
Figure 3. Input voltage (Amplitude) corresponding to the FI factor based on different methods: (A) the correlation coefficient method and (B) the STD method.
To mimic different tongue movement frequencies, we fixed the driving voltage at 5 V and increased the driving frequency from 10 to 100 Hz. Results from the correlation coefficient method are presented in Figure 4A, and the results from the STD method are presented in Figure 4B. These experiments show that the FI factor is positively correlated with movement frequency. It should be noted that during the experiment, we observed a non-linearity correlation between voltage and oscillation magnitude, which might have caused the non-linearity in Figures 3A, 4A. However, that won't affect our in vivo experiment result.
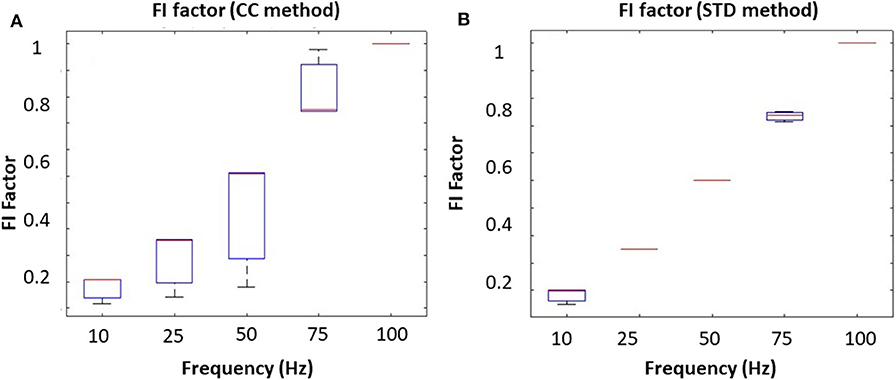
Figure 4. The oscillating frequency corresponding to the FI factor base on different methods: (A) correlation coefficient method and (B) the STD method.
Figure 5 represents a single A-line acquired in the human trials. In this figure, ultrasound reflection can be seen at time 28 μs, which corresponds to a 42-mm round-trip distance. Based on human anatomy [13], this echo was generated by reflection from the bottom surface of the tongue. When the tongue moves, both the amplitude and delay time of the ultrasound echo will vary, and these parameters can be used to quantify oral movement. Because ultrasound echo from the tongue surface looks quite different from background signals, this feature was used to verify the location of tongue surface.
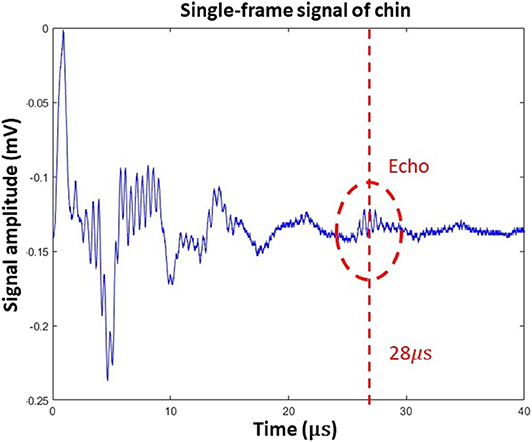
Figure 5. A single A-line of human data acquired by a transducer placed under the chin.
The CC and STD algorithms were also used to process human data, and the results are shown in Figures 6, 7, respectively. Figure 6A shows the temporal correlation coefficient of 1,000 frames (acquired in 10 s). Figure 6B indicates correlation coefficient data after being smoothed by a moving-average filter with a 3-pixel window size [9]. The first deviation for the smoothed data is shown in Figure 6C. For better illustration, Figure 6D is a magnified image of Figure 6C, where every chewing cycle is clearly displayed.
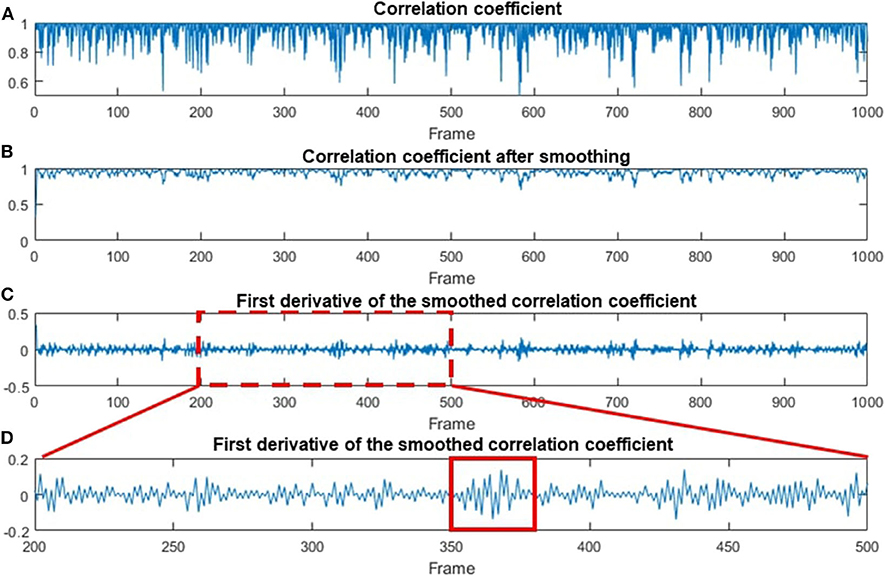
Figure 6. Data processing steps based on the CC method. (A) The original CC-processed data as a function of the frame number. (B) The smoothing-processed plot of (A). (C) The first deviation of the smoothed data in (B). (D) A magnified plot of a section in (C), where multiple chewing cycles can be clearly seen. A red solid line box is used to indicate one of the chewing cycles.
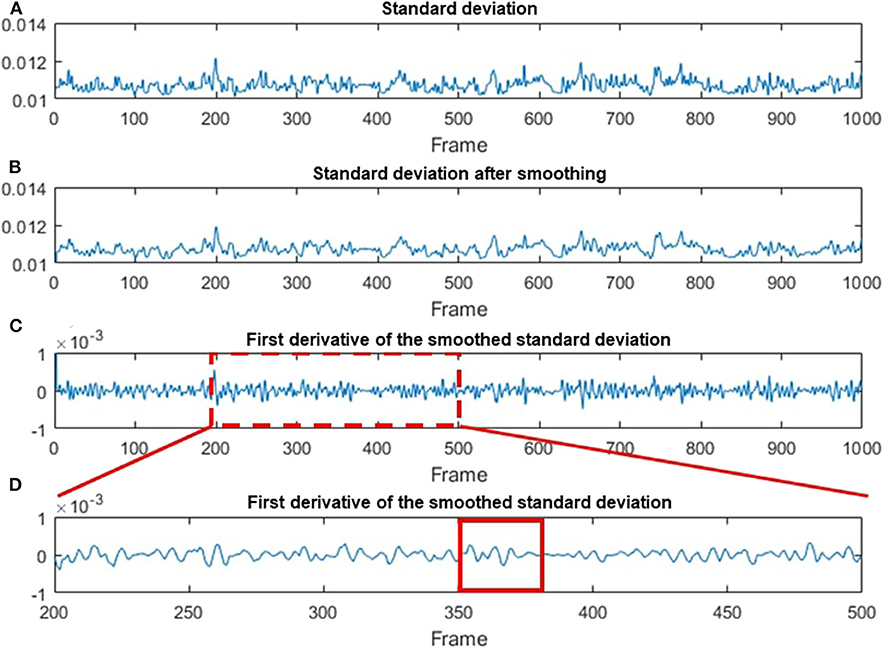
Figure 7. Data processing steps based on the STD method. (A) The original STD-processed data as a function of the frame number. (B) The smoothing-processed plot of (A). (C) The first deviation of the smoothed data in (B). (D) A magnified plot of a section in (C), where multiple chewing cycle can be clearly seen. A red solid line box is used to indicate one of the chewing cycles.
Figure 7A shows the original STD data as a function of the frame number. Figure 7B indicates STD data after being smoothed by a 3-pixel window size moving-average filter. The first deviation for the smoothing data is demonstrated in Figure 7C. Figure 7D is a magnified image of Figure 7C, where each chewing cycle can be clearly seen. Based on the result in Figure 7C, we calculated the FI factor and compare it with the different levels of food sweetness.
Analysis of variance (ANOVA) was used to verify whether there are significant differences in tongue movement among different food sweetnesses. The test was conducted with 32 subjects, each of whom was tested with three different sweetnesses and repeated three times for each sweetness. The results were presented in Table 1. ANOVA was then applied to the FIs to compare tongue movement for foods with different sweetnesses. ANOVA verified the significant differences among FIs of three different sweetnesses during the bulk phase (Table 2) [14]. The results showed an increased tongue activity for higher sweetness samples. We used a single sample t-test [15] to analyze the difference between the two conditions. Equation (1) is used in the t-test, where is the mean of the differences between the FI of two different sweetness tests, n represents the sample size, u0 is population mean, and s is the standard deviation of the difference. The FIs were multiplied by 1,000 in the t-test to avoid leading zeros in the sums of squares when ANOVA was applied [9].
For the high and middle sweetness (H-M) comparison, we found that the P-value was 7.19% in the CC method and 0.44% in the STD method. For the middle and low sweetness (M-L) comparison, the P-value was 7.19% in the CC method and 1.44% in the STD method. For the high and low (H-L) sweetness comparison, the P-value was <0.01% in both methods. These results indicate that the tongue movement varied significantly at different food sweetness levels. Also, the STD method performed better than the CC method in differentiating food sweetness. This occurred because the CC method is more susceptible to small changes, such as respiration and heartbeat, while the STD method is more sensitive to relatively large variations, like chewing and swallowing. Therefore, in this experiment, the STD method obtained relatively better results. Plots of FI distribution (Figures 8, 9) further confirm the decreasing tendency of the FI with the reduction in sweetness.
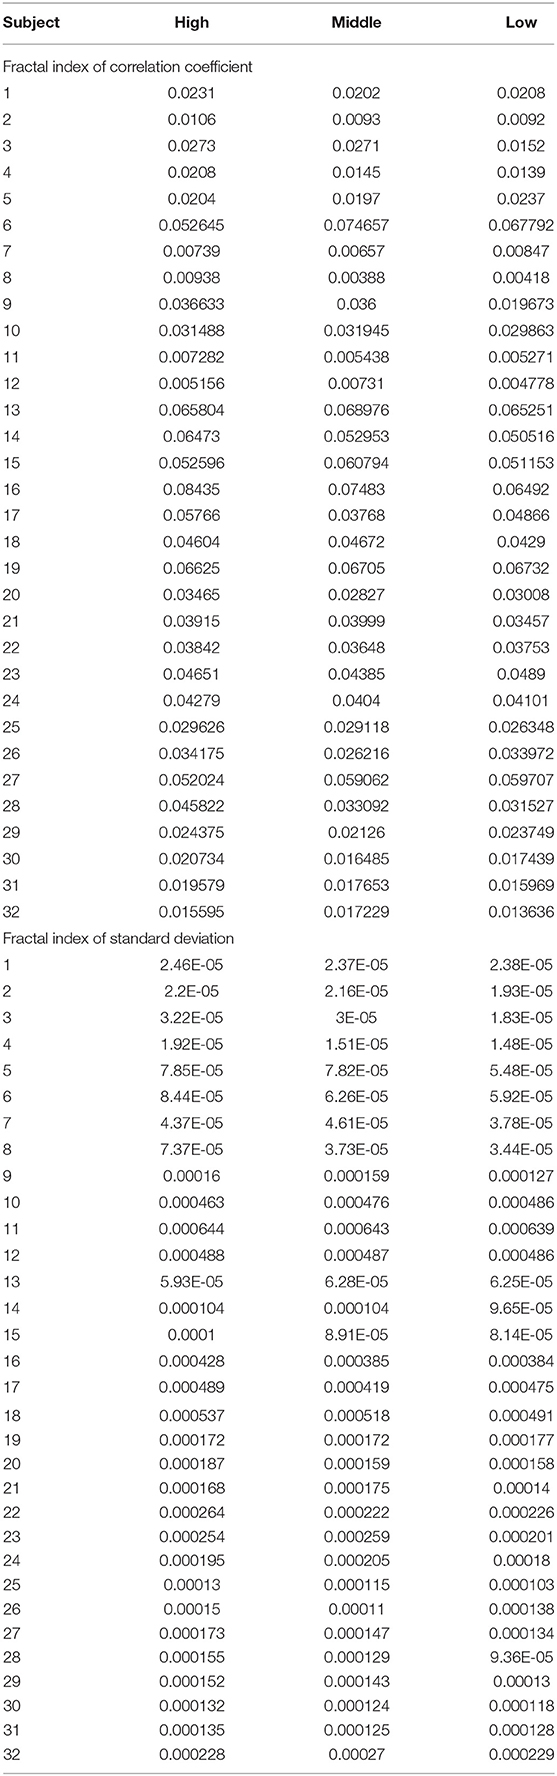
Table 1. Fractal index data for every experimental subject.
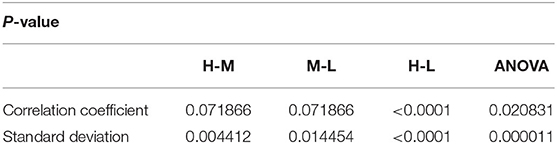
Table 2. P-value of different comparison pairs.
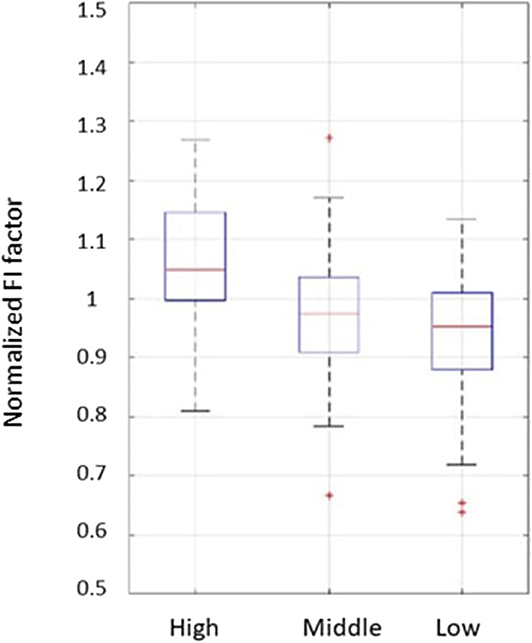
Figure 8. Plots from the fractal index of correlation coefficient method. Each set of subject data was normalized by its mean value to eliminate fluctuations caused by different transducer positions.
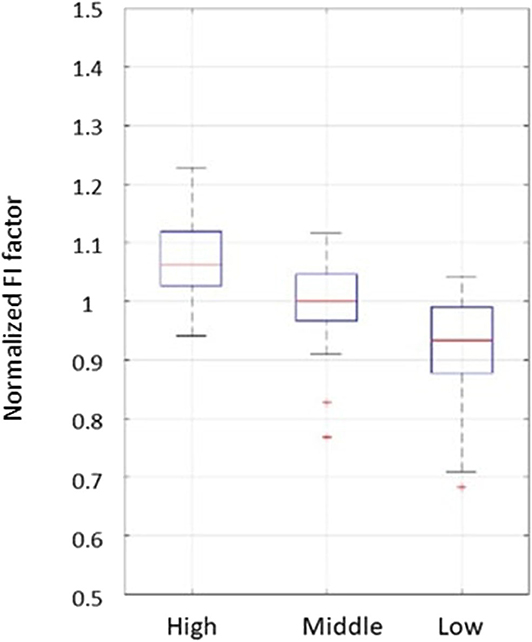
Figure 9. Plots from the fractal index of standard deviation method. Each set of subject data was normalized by its mean value to eliminate fluctuations caused by different transducer positions.
Due to variations in different individual's chewing behavior, a direct comparison of the FI among subjects would render inaccurate results. To address this issue, we developed a self-calibration procedure, where each subject's FI factors are self-normalized by the mean FI of the same subject at three different sweetness levels. After normalization, the FI factors of different subjects would fall within a similar range for easy comparison. The results from 32 subjects using the data processing method described above are shown in Figures 8, 9. Our conclusion was further validated by calculating the effect size [16], which is the ratio of the difference between two FI index means and their standard deviation. The result is shown in Table 3. Here, effect size >0.8, and 1.2 indicates a large difference between the two groups. Based on the Table 3, the STD method is generally better than the CC method, and for both CC and STD methods, apparent differences can be seen between high and low sweetness levels.
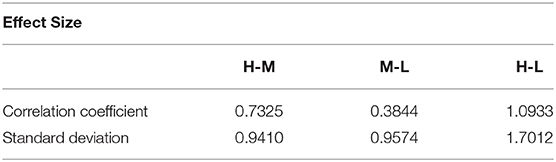
Table 3. Effect size of different comparison pairs.
From all these results, we can conclude that the sweetness of food has a significant correlation with oral processing behavior: the sweeter the food, the more intense the tongue moves. It should be noted that our device was designed to be used by the same subject and cross-subject comparison will not be needed for future applications.
Discussion and Conclusion
In this study, we developed a portable ultrasound system that consists of a ceramic disk, an ultrasound pulser, and a smartphone-controlled smartscope. After each ultrasound pulse, the ceramic disk collects temporal data, which represents the position of the tongue. Multiple ultrasound pulses are associated with multiple sets of temporal data to track the oral process and tongue movement. Our results indicate that there is a positive correlation between the sweetness of food and tongue movement. We hope this approach could be used in the future to track sugar intake in patients with diabetes.
While we have demonstrated encouraging results, future improvements are still needed. First, although the size of the transducer and the oscilloscope have been significantly reduced, the ultrasound pulse generator is still relatively large. This issue can potentially be addressed by using a mobile ultrasound pulser chip, such as the ultrasonic signal processor and transducer driver produced by Texas Instruments with a size of 6 × 5 mm2 [17]. Recent advances in smartphones also enabled mobile ultrasound systems [18], whose techniques might be implemented in our future design to make the system even more portable. Second, the position of transducer placement is not ideal. A potential solution is to integrate the sensor with an earbud and place it right under the ear to monitor jaw movement. This position will be more convenient for daily usage and the device can potentially also record the sound of chewing [19]. Third, the user interface needs to be optimized. Ideally, the software should be able to track patients' sugar intake from day to day and notify the patient if the intake is significantly higher than the typical value.
Data Availability Statement
All datasets generated for this study are included in the article/supplementary material.
Ethics Statement
The studies involving human participants were reviewed and approved by the University at Buffalo Institutional Review Board (UB-IRB). The participants provided their written informed consent to participate in this study.
Author Contributions
YZ designed the experimental setup, processed the data, and wrote the article. JL collected and analyzed experimental data and participated in the manuscript writing. SN and TS offered guidance in data processing and manuscript revision. LW guided the experimental design and data processing. JX supervised the project and revised the manuscript. All authors contributed to the article and approved the submitted version.
Funding
This project was partially supported by the University at Buffalo's IMPACT award.
Conflict of Interest
The authors declare that the research was conducted in the absence of any commercial or financial relationships that could be construed as a potential conflict of interest.
References
1. Atkinson MA, Eisenbarth GS. Type 1 diabetes: new perspectives on disease pathogenesis and treatment. Lancet. (2001) 358:221–9. doi: 10.1016/S0140-6736(01)05415-0
2. Kim S. Calculating Insulin Dose. (2019) Available online at: https://dtc.ucsf.edu/types-of-diabetes/type2/treatment-of-type-2-diabetes/medications-and-therapies/type-2-insulin-rx/calculating-insulin-dose/
3. Hutchings JB, Lillford P. The perception of food texture-the philosophy of the breakdown path. J Texture Stud. (1988) 19:103–15. doi: 10.1111/j.1745-4603.1988.tb00928.x
4. Prinz J, Lucas P. Mastication and swallowing: an optimisation model. Proc R Soc Lond B. (1997) 264:1715–21. doi: 10.1098/rspb.1997.0238
5. Liu L, Hammond EG. The role of particles in the perception of flavours. J Food Qual. (2000) 23:521–8. doi: 10.1111/j.1745-4557.2000.tb00577.x
6. Chen J, Engelen L. Food Oral Processing: Fundamentals of Eating and Sensory Perception. Summit, NJ: John Wiley & Sons (2012). doi: 10.1002/9781444360943
7. Neyraud E, Peyron MA, Vieira C, Dransfield E. Influence of bitter taste on mastication pattern. J Dent Res. (2005) 84:250–4. doi: 10.1177/154405910508400308
8. Engelen L, de Wijk RA. Oral processing and texture perception. In: Chen J, Engelen L, editors. Food Oral Processing: Fundamentals of Eating and Sensory Perception. Oxford: Wiley-Blackwell. (2012) p. 159–76. doi: 10.1002/9781444360943.ch8
9. de Wijk RA, Wulfert F, Prinz JF, de Wijk RA, Wulfert F, Prinz JF. Oral processing assessed by M-mode ultrasound imaging varies with food attribute. Physiol Behav. (2006) 89:15–21. doi: 10.1016/j.physbeh.2006.05.021
10. Prinz JF, Ng KW, Prinz JF, Ng KW. Characterization of sounds emanating from the human temporomandibular joints. Arch Oral Biol. (1996) 41:631–9. doi: 10.1016/S0003-9969(96)00070-2
11. Erikson KR, Fry FJ, Jones JP. Ultrasound in medicine-a review. IEEE Trans Sonics Ultrasonics. (1974) 21:144–70. doi: 10.1109/T-SU.1974.29810
12. Green JR, Wang YT, Green JR, Wang YT. Tongue-surface movement patterns during speech and swallowing. J Acoustical Soc Am. (2003) 113:2820–33. doi: 10.1121/1.1562646
14. Stangroom J. One-Way Repeated Measures ANOVA Calculator (2019). Available online at: https://www.socscistatistics.com/contact3/
15. Stangroom J. Single Sample T-Test Calculator (2019). Available online at: https://www.socscistatistics.com/tests/tsinglesample/default.aspx
16. Cohen H. Statistical Bower Analysis for Behavioral sciences. Hillsdale, NJ: Lawrence Erlbaum Associates (1988).
17. Bageshwar DV, Pawar A, Khanvilkar VV, Kadam VJ. Photoacoustic spectroscopy and its applications–a tutorial review. Eur J Anal Chem. (2010) 5:187–203.
18. Gummadi S, Eisenbrey JR, Li J, LI Z, Forsberg F, Lyschik A, et al. Advances in modern clinical ultrasound. Adv Ultrasound Diagn Ther. (2018) 2:51–63. doi: 10.37015/AUDT.2018.180801
Keywords: ultrasound system, food sweetness, tongue movements, wearable sensor, portable device
Citation: Zhan Y, Luo J, Nandi S, Wang L, Singh T and Xia J (2020) A Portable Ultrasound System for Detecting Food Sweetness Based on Chewing Dynamics: A Preliminary Investigation. Front. Phys. 8:266. doi: 10.3389/fphy.2020.00266
Received: 16 January 2020; Accepted: 12 June 2020;
Published: 24 July 2020.
Edited by:
Lorenzo Pavesi, University of Trento, ItalyReviewed by:
Chao Tao, Nanjing University, ChinaTamás Gábor Csapó, Budapest University of Technology and Economics, Hungary
Copyright © 2020 Zhan, Luo, Nandi, Wang, Singh and Xia. This is an open-access article distributed under the terms of the Creative Commons Attribution License (CC BY). The use, distribution or reproduction in other forums is permitted, provided the original author(s) and the copyright owner(s) are credited and that the original publication in this journal is cited, in accordance with accepted academic practice. No use, distribution or reproduction is permitted which does not comply with these terms.
*Correspondence: Jun Xia, junxia@buffalo.edu