A Simple Approach for Experimental Characterization and Validation of Proton Pencil Beam Profiles
 Paulina Stasica1,2
  Jakub Baran1
  Carlos Granja3
  Nils Krah4,5
  Grzegorz Korcyl6
  Cristina Oancea3 Monika Pawlik-Niedźwiecka1,6 Szymon Niedźwiecki6
  Marzena Rydygier7 Angelo Schiavi8
  Antoni Rucinski1
  Jan Gajewski1*
- 1Proton Radiotherapy Group (NZ62), Institute of Nuclear Physics Polish Academy of Sciences, Kraków, Poland
- 2Faculty of Physics and Applied Computer Science, AGH University of Science and Technology, Kraków, Poland
- 3ADVACAM, Prague, Czechia
- 4University of Lyon, CNRS, CREATIS UMR 5220, Lyon, France
- 5University of Lyon, CNRS, IP2I UMR 5822, Lyon, France
- 6Faculty of Physics, Astronomy and Applied Computer Science, Jagiellonian University, Kraków, Poland
- 7Cyclotron Center Bronowice, Institute of Nuclear Physics Polish Academy of Sciences, Kraków, Poland
- 8Department of Basic and Applied Sciences for Engineering, Sapienza University of Rome, Rome, Italy
A precise characterization of therapeutic proton pencil beams is essential for the commissioning of any treatment planning system (TPS). The dose profile characterization includes measurement of the beam lateral dose profile in the beam core and far from the beam core, in the so called low-dose envelope, and requires a sophisticated detection system with a few orders of magnitude dynamic range. We propose the use of a single-quantum-sensitive MINIPIX TIMEPIX detector, along with an in-house-designed holder to perform measurements of the pencil beam dose profile in air and in water. We validated the manufacturer calibration of the MINIPIX TIMEPIX detector in proton beams of various energies and compared the deposited energy spectra to Monte Carlo (MC) simulations. The precision of the lateral dose profile measurements has been systematically validated against Krakow proton facility commissioning data and dose profile simulations performed with MC codes Gate/Geant4 and Fred. We obtained an excellent agreement between MINIPIX TIMEPIX measurements and simulations demonstrating the feasibility of the system for a simple characterization and validation of proton pencil beams. The proposed approach can be implemented at any proton therapy facility to acquire experimental data needed to commission and validate analytical and MC-based TPS.
1. Introduction
The dosimetric advantage of proton beams in radiotherapy is due to their depth-dose distribution (Bragg curve), which allows us to minimize the dose deposited in healthy tissues and to maximize it in the tumor region [1, 2]. After many years of research and development, a growing interest in proton radiotherapy is observed. According to data provided by the Particle Therapy Co-Operative Group (https://www.ptcog.ch/, 2020), there are 91 proton (or proton and carbon ion) radiotherapy facilities in operation, 33 under construction, and 27 in the planning stage all around the world. Upon startup of each new proton facility, for the purpose of launching a treatment planning system (TPS), a commissioning of the proton pencil beam is required. The beam commissioning, which includes, e.g., an experimental characterization of lateral and longitudinal beam profiles, is a demanding and time-consuming experimental procedure. In this paper, we propose a new approach for characterization of lateral beam profiles in air and in water to simplify the procedure of beam data library acquisition and TPS commissioning.
The procedure of dosimetric commissioning and validation of single pencil beams was established and applied by several ion beam therapy facilities [3–5]. It is usually performed within commercially available active and/or passive dosimetry systems. However, the existing solutions do not offer dynamic range, and the possibility to perform measurements in water with single quantum sensitivity has not been reported as feasible when using only one device. Passive dosimetry (TLD, photochromic films) might have wider dynamic range, but the dose is integrated. Such detectors often require technologically complicated and time-consuming post-processing, and the response is often dependent on the LET. Scintillator-based detectors, such as Lynx, show a dynamic range of two orders of magnitude and cannot be easily used in water due to its large size. Active dosimetry with ionization chambers requires a complex correction procedure for temperature, pressure, recombination effect, etc. Moreover, none of these methods are single-quantum sensitive.
The state-of-the-art experimental approach for proton beam commissioning is to measure lateral dose profiles in air with a scintillating screen and CCD camera [6–10]. This method allows us only to measure the major component of the lateral beam dose profile characterized by a Gaussian distribution. In fact, primary particles scatter on the passive components of a beam delivery system, such as gantry nozzle equipment and range shifters/compensators, building up an additional dose envelope of the lateral beam profiles [6], which is recognized as a nuclear halo. The nuclear halo is often approximated in TPS by a double Gaussian model of proton pencil beam. The accurate characterization of pencil beam lateral dose profiles is particularly important for facilities using very small beam sizes as the uncertainty of the nuclear halo modeling is propagated over a greater number of beams [6, 11]. Also, the effect is pronounced for small, shallowly located targets that are irradiated with a limited number of beams because the uncertainties are not averaged [11]. Still, the measurements of the dose envelope are often neglected because characterization of pencil beam nuclear halo requires dedicated detector technology with sufficient sensitivity and accuracy.
In order to compensate for the uncertainties in the beam modeling caused by the dose envelope, some of the proton centers investigate and develop new detection techniques for characterization of the lateral beam profile far from the beam core. For instance, in the Krakow proton facility, passive dosimetry [12, 13] or single particle sensitive methods like scCVD diamond detectors [14] have been investigated. Refer to the following publications and their references for review of beam halo measurement approaches [15, 16] and more generally proton beam commissioning protocols [17–20].
Within the commissioning stage, a validation of the beam model implementation in TPS is required, and it is typically performed by means of experimental measurements in water. The dose in complex radiation fields consisting of several pencil beams is usually measured, and, if necessary, field size factors are applied to correct for experimental and computational uncertainties of the pencil beam modeling [21]. The introduction of Monte Carlo (MC) tools in the clinical routine offers computational accuracy, allowing for consideration of the nuclear halo in patient treatment plan simulations. However, the experimental validation of single pencil beam dose profiles in water, including the nuclear halo, is even more demanding than in air because it requires operation of the detector in water. There is still a necessity to provide more accurate, fast, and easy-to-use experimental methods for characterization of the low-dose envelope of proton pencil beams.
Here, we propose an alternative to the existing solutions, to be applied for measurements in air and in water with higher resolution, single particle sensitivity, and improved detector dynamic range. Our approach allows for experimental characterization and validation of lateral and longitudinal dose profiles of a proton beam halo up to 150 mm off the beam core. For this purpose, we used MINIPIX TIMEPIX semiconductor pixel detector, an in-house-developed detector holder, and water phantom. The proposed experimental setup can be used for commissioning and validation measurements both in air and in water. We measured pencil beam profiles and compared the results to the facility commissioning data, TPS calculations, and Monte Carlo (MC) simulations, demonstrating the feasibility of the approach.
2. Materials and Methods
2.1. Proton Radiotherapy Facility
The Krakow proton beam facility has been in clinical operation since October 2016, offering protons for radiation therapy treatment as well as for physics and radiobiology experiments. The Krakow facility offers stable beam intensities ranging from 1 to 300 nA and scanning pencil beam within an energy range from 70 to 226 MeV, which corresponds to range in water from 4.2 to 31.8 cm. The microstructure of the proton beam produced by C-235 IBA cyclotron in Krakow consists of 0.79 ns micropulses generated with the frequency 106 MHz, which is common to all beam intensity settings. The lateral beam size (1σ) ranges depending on the proton beam energy and application of a range modulator (range shifter - RS) from about 3 to 15 mm. The RS made of 4.2 cm thick PMMA material, mounted at the gantry nozzle, is used to modulate proton range.
In Krakow, Eclipse TPS version 13.6 (Varian Medical Systems, Palo Alto, CA, US), commissioned against experimental data, is used for treatment planning. The TPS in this version is equipped only with an analytical pencil beam algorithm [22]. Longitudinal dose profile measurements were performed in water using a Bragg Peak Chamber (PTW, Freiburg, Germany). Lateral dose profiles in air were measured using LYNX scintillating screen (IBA Dosimetry, Schwarzenbruck, Germany) and thermoluminescence detectors (TLDs) in the primary Gaussian and the dose envelope regions, respectively. Eclipse TPS was used to compute 3D pencil beam dose profiles in water. In addition to the clinical TPS, the dose profiles were simulated using a secondary dose computation tool, FRED MC code [23] that was commissioned and validated for quality assurance purposes in Krakow [Gajewski et al. accepted]. The proton beam model used by the clinical TPS and FRED have been adopted for GATE/Geant4 simulations performed in this work.
2.2. MINIPIX TIMEPIX Detector and Data Acquisition Software
In this study, we propose using the technology of pixel semiconductor detectors, TIMEPIX from ADVACAM (https://advacam.com), for characterization of therapeutic proton pencil beams and validation of TPS and MC simulations. TIMEPIX is a commercial version of MEDIPIX detector developed at CERN and is widely used for radiation research, e.g., in proton and ion beam therapy [24–29], in brachytherapy [27, 30], in radiation dosimetry [31–34], in particle accelerator environments [35], or for space radiation characterization on board of the International Space Station [36–38]. The single particle sensitivity of the device finds applications in particle therapy as well as for very small field dosimetry needed for investigations on in-vitro and animal model systems [39].
Due to the single-quantum sensitivity and particle tracking capability, TIMEPIX technology enables particle-by-particle dosimetry of proton pencil beams in wide dynamic range. It is achievable thanks to hybrid semiconductor pixel architecture and highly integrated signal electronics (amplifier, amplitude discriminators, and digital counter). TIMEPIX processes signal from single-quantum events on-board using a megahertz frequency clock and multi-channel analyzer with 11.8k channels per pixel enabling measurement of the number of events, the energy, or the time of interaction. These features offer a wide dynamic range of the MINIPIX TIMEPIX in term of quantum sensitivity and noiseless particle type identification (neutrons, X rays, light, and heavy charged particles) as well as measurements of particle flux (from single particles up to 106 in event by event spectrometry tracking mode and 108 in integrated counting mode), linear energy transfer (0.1–500 keV/μm in silicon), or directional tracking in a wide field of view (2π solid angle) [40].
In this work, a compact MINIPIX TIMEPIX detector was used (Figure 1, left). The entire MINIPIX TIMEPIX has dimensions of 77 × 21 × 10 mm, and its total weight is 25 g. The sensitive volume of the semiconductor silicon sensor (14.08 × 14.08 × 0.3 mm) consists of a 2D array of 256 × 256 pixels, and each has dimensions of 55 × 55 μm. The ionizing particle penetrating the sensitive volume of the MINIPIX TIMEPIX produces electric charge, which is collected by adjacent electrode pixels forming a cluster. The charge collected by each pixel is converted by an analog-to-digital (ADC) converter into a signal. As long as the ADC output is not saturated and its response is linear to the collected charge, we can assume that the measured energy deposited by two or more particles in the same time and position (overlapping) is equal to a sum of the single energy depositions (non-overlapping). The signal read-out is performed in each pixel individually in a single frame acquisition time of typical length of about 1–100 ms. The MINIPIX TIMEPIX frame read-out dead-time is 22 ms. Data acquisition electronics is fully integrated, connected to the computer via USB port and does not require a dedicated cooling system. The temperature effect on energy deposition measurement is negligible [41]. For more details on the TIMEPIX detector technology, refer to [40, 42, 43] and references.
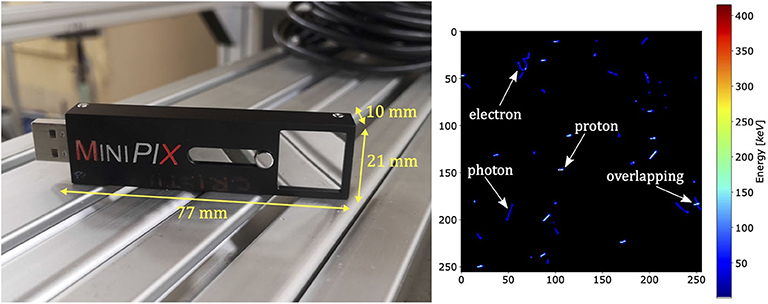
Figure 1. The MINIPIX TIMEPIX detector equipped with a TIMEPIX ASIC and 300 μm thick silicon sensor (left) and an example frame obtained from the measurements (right). Clusters are produced by different particles in mixed radiation field of proton pencil beam in water. Low-LET narrow, curly tracks are typical for electrons, high-LET wide, straight tracks for energetic heavy charged particles such as protons, and low-LET straight tracks are characteristic for photons. In the right side of the frame, an example of overlapping clusters is shown.
The MINIPIX TIMEPIX detector is equipped with a data acquisition and real-time visualization software, PIXET PRO, which also provides data processing tools for cluster morphology analysis. Figure 1 (right) shows an example of data frame acquired in Krakow. The morphology of each cluster is characterized by the following: the position of the cluster center of mass, the total energy deposited, the cluster length, and the angle at which the particle enters the detector. The cluster analysis enables identification of impinging particle type [43]. The analysis of multiple clusters enables particle-by-particle experimental characterization of the mixed radiation fields consisting of primary and secondary protons, secondary electrons, photons, etc. Depending on the primary particle fluence, the single frame acquisition time needs to be adjusted for each measurement individually in order to minimize the overlapping of the clusters. The cluster overlapping effect occurs when different particles at short time intervals produce clusters, which are so close to each other that they overlap and are recognized by PIXET PRO software as a single cluster of larger energy deposition. The shortest single frame acquisition time (1 ms) determines the maximal primary particle fluence, which can be used for measurement. In case of measurements performed in the beam core, the lowest clinically available beam current (1 nA) was too high to avoid the detector saturation. Therefore, the unregulated accelerator dark current was used for measurements in the beam core and the stable beam current of 1 nA off the beam core.
2.3. Dose Calculation Engines
In this work, the dose distributions were calculated using the clinical TPS used in the Krakow proton facility (cf. section 2.1) as well as two MC toolkits: GATE/Geant4 (version 8.2), interfaced to Geant4 (version 10.4.p2) [44] and FRED MC (version 3.0.18) [23]. GATE/Geant4 is a full MC simulation engine transporting all the primary and secondary particles contributing to the dose deposition. FRED is a fast, GPU-accelerated MC tool transporting primary and secondary protons, deuterons, and tritons, whereas the energy from gammas and delta-electrons is deposited at their production point. Because the GPU parallelization and physics are trimmed down to the processes relevant for proton dose calculations, the computation time is reduced up to a factor 100 with respect to GATE/Geant4 computations running on CPU [45].
2.4. Calibration Measurements
The MINIPIX TIMEPIX detector is calibrated by the manufacturer aiming at a uniform response of each individual pixel to energy depositions from X-rays source [46]. In principal, primary and/or secondary particles can enter the detector surface at any angle, which specially occurs measuring mixed radiation field produced by a proton beam in water. In this work, we performed a validation of the detector response to proton beams impinging the detector surface at different angles. We compared the energy deposition spectra obtained experimentally to MC simulations. Moreover, the measurements allowed to determine optimal detector angle with respect to the beam core used in further acquisitions.
2.4.1. Experimental Setup and Data Acquisition
The MINIPIX TIMEPIX was exposed to proton pencil beams of nominal energies E70, E100, E150, and E200, corresponding to proton mean energies and energy spreads (standard deviation) at the detector position of 70.5 (0.6) MeV, 100.1 (0.8) MeV, 149.9 (1) MeV, and 199.6 (1) MeV, respectively. For each nominal energy, the detector was positioned at the isocentre in air (in the beam core) at β angles ranging from 27° to 83°. We defined β as the angle between the normal to the silicon sensor surface and the proton beam axis (cf. Figure 2). The accelerator dark current was used allowing to keep the particle fluence low enough to avoid saturation of the detector and to minimize the cluster overlapping.
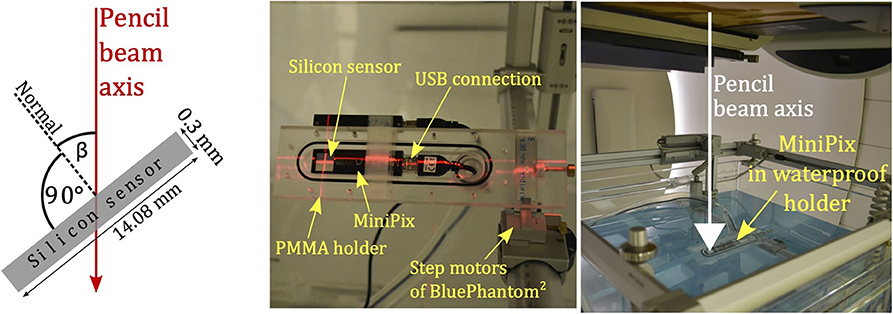
Figure 2. Schematic illustration of MINIPIX TIMEPIX detector silicon sensor and the definition of β angle between the normal to the silicon sensor surface and proton pencil beam axis (left), MINIPIX TIMEPIX placed in the PMMA holder positioned in water phantom without the waterproof cover (middle), and immersed in the water phantom filled with water for profile measurements (right).
2.4.2. Monte Carlo Simulations
We performed MC simulations of the calibration setup in GATE/Geant4 toolkit. The MINIPIX TIMEPIX detector active volume was simulated as a 14.08 × 14.08 × 0.3 mm3 cube made out of silicon (ρ = 2.33g/cm3, Ipot = 173eV [47]). The detector was positioned at the isocentre at β angles, mimicking the experimental conditions. For simulations of proton pencil beams, the MC implementation of the clinical beam model based on Krakow proton facility commissioning measurements was used. We used the QGSP_BIC_HP_EMZ physics list, which contains the high precision (HP) model for low-energy neutrons and the most precise electromagnetic physics (EMZ) [48]. We used production cuts in the active volume of 10 μm for protons, electrons, and gammas. For each individual calibration simulation the total number of 106 primary particles were simulated. Using a phase space actor in GATE/Geant4 we scored the type, energy, angle, and position of the incidence of each primary particle crossing the detector surface. The history of the interactions and energy depositions of primary and secondary particles of unique identification number (UID) was scored using a GATE/Geant4 sensitive volume.
2.4.3. Data Analysis
The results scored by the phase space actor and the GATE/Geant4 sensitive volume were merged based on the primary particle UID. The total energy deposited in the detector by a single primary proton was calculated as a sum of all energy depositions from the primary and secondary particles scored inside the GATE/Geant4 sensitive volume.
For each primary proton energy and detector angular position (β), the energy deposition distributions obtained from the MINIPIX TIMEPIX measurements were compared to the GATE/Geant4 simulations. Due to a simplified geometry implemented in the MC simulations, i.e., omitting the detector case and the PMMA holder, in simulations, all the primary particles entered the detector at nearly the same angle β (cf. Figure 2). In fact, in the experimental conditions, the particles can enter the detector at different angles because they scatter on the MINIPIX TIMEPIX case and on the holder. For this reason, to compare the results of measurements and simulations, we filtered out from the experimental data particles, entering the detector at an angle different than ±3°. The β angle was obtained from the cluster morphology by calculating its track in the silicon sensor. In addition we compared the mean deposited energy measured by the MINIPIX TIMEPIX detector and simulated in GATE/Geant4 to the deposited energy calculated based on PSTAR data of proton stopping power in silicon [47].
2.5. Dose Profile Characterization
The experimental setup was used for two types of dose profile measurements. We performed lateral dose profile measurements in air to demonstrate the capability of the MINIPIX TIMEPIX detector to be used for commissioning and characterization of proton therapeutic pencil beams. Next, we performed lateral and longitudinal dose profile measurements in water to validate the pencil beam propagation performed by TPS and MC simulations.
2.5.1. Experimental Setup, Beam Conditions, and Data Acquisition
The MINIPIX TIMEPIX detector was positioned in a dedicated, waterproof, in-house-designed PMMA holder mounted inside the water phantom (BluePhantom2 by IBA). We enclose the technical sketch of the PMMA holder in Supplementary Materials. The detector sensitive volume was positioned at isocentre using water phantom step motors and laser patient positioning system. Based on the step motor movement and laser positioning system accuracy, we estimate the setup positioning uncertainty as 1mm. The MINIPIX TIMEPIX was positioned at an angle β = 45°. See the middle panel of Figure 2 for the detector placed in the phantom (in air) without the waterproof cover and the right panel of Figure 2 for the detector placed in water.
The lateral proton pencil beam profiles in air and in water were acquired for proton beams at nominal energies E100, E150, and E200 with and without range shifter. All the measurements were performed using the lowest possible accelerator beam current of 1 nA to keep the beam current stable between measurements. The shortest acquisition time frame duration used by Timepix was 1 ms. Therefore, the time architecture of the beam is negligible for the measurements performed in the integration mode. For the 1 nA beam current, we did not perform measurements with the detector placed in the beam core (0–20 mm away from the isocentre), as, at such a current, the primary proton yield leads to detector saturation for a single acquisition frame. For dose profile measurements, the time frame duration was set by the software operator based on a real-time visual assessment of the data in the PIXET PRO software. Before starting the data acquisition, while the beam was on, the most optimal time frame duration was selected allowing acquisition of the maximal possible number of clusters in one frame and avoiding cluster overlapping effect. The total acquisition time of each measurement in single point of radiation field depends on particle fluence, and it was from 20 to 40 s and thus resulted in the order of 104–106 registered single particle events (clusters). In total, we performed 26 proton pencil beam lateral and longitudinal dose profile measurements.
For measurements in air, MINIPIX TIMEPIX was positioned at the gantry room isocentre, and lateral profiles were acquired at the distance from 30 to 180 mm away from the isocentre. Following the measurements in air, BluePhantom2 was filled with water. See Figure 3 for simulated 2D dose distributions of proton pencil beams in water with and without range shifter for three investigated nominal proton beam energies. Note that each detector position along the axis of measurement data acquired with a 2D MINIPIX TIMEPIX detector is integrated to one measurement point corresponding to center of mass of the detector surface. This is because the analysis of the acquired data has shown that the particle fluence and energy deposition gradient within the 14 × 14 mm2 detector frame do not vary for measurement points from 45 to 150 mm away from the beam core. The dose distributions are overlapped with lines indicating which lateral and longitudinal dose profiles were measured. We measured lateral dose profiles at three depths, at 1/2 and 3/4 of the proton beam range, and as in the Bragg peak position. For 150 MeV proton beam, the longitudinal profiles were measured at the distance of 25, 37, 49, and 61 mm away from the isocentre.
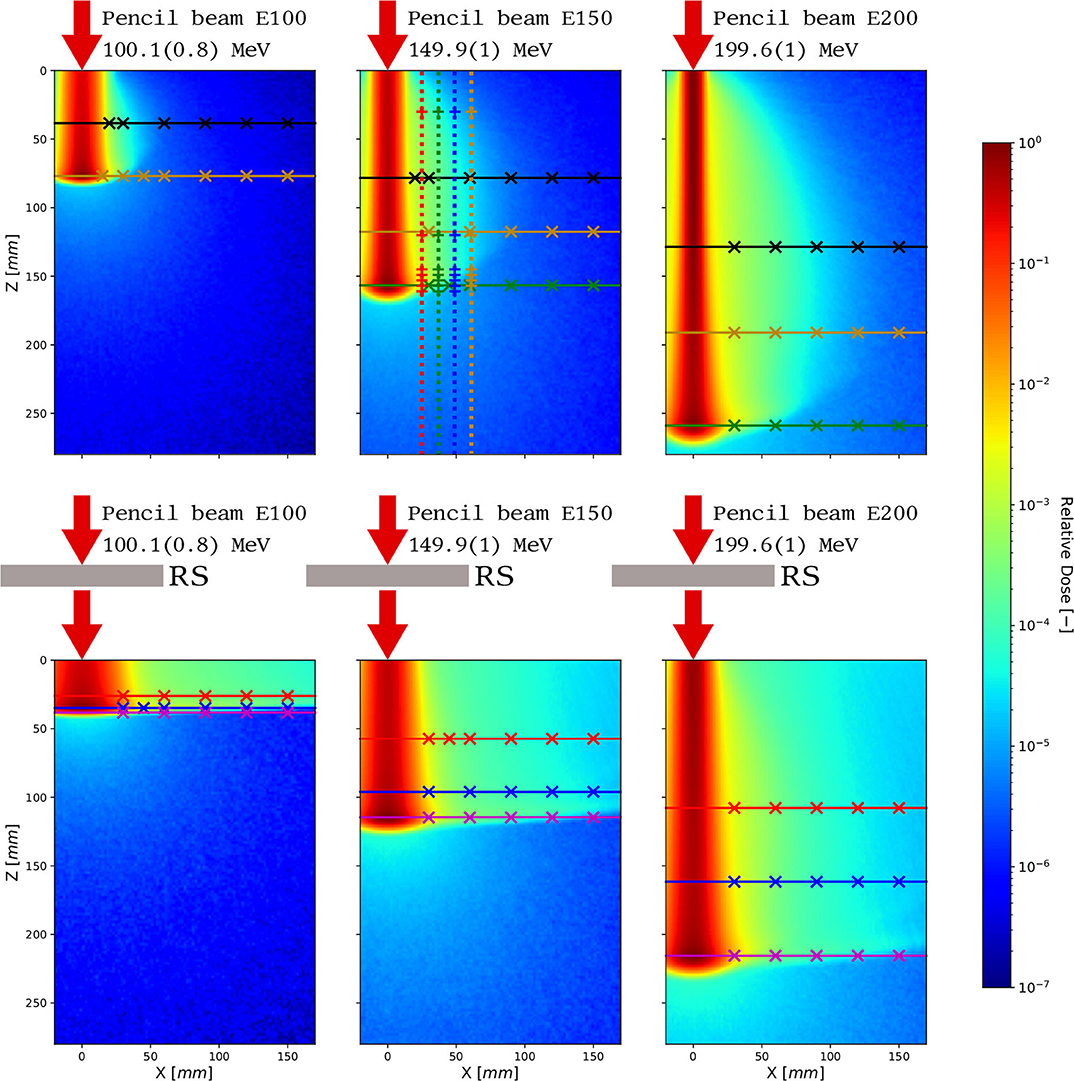
Figure 3. 2D dose profiles obtained from MC simulation of proton beams at three nominal energies with (bottom) and without (top) the RS. The lateral and longitudinal dose profiles measured with MINIPIX TIMEPIX are shown, and the measurement points are marked with crosses. The color convention used to illustrate measured dose profiles is the same as the one used in the figures in the results sections 3.3 and 3.4.
2.5.2. Monte Carlo Simulations
The dose distributions in water for the nominal energies used in the experiment with and without the RS were calculated using clinical TPS (analytical dose computation algorithm) as well as simulated in GATE/Geant4 and FRED MC engines. In GATE/Geant4, we used the QGSP_BIC_HP_EMZ physics list with 1 mm production cut for gammas, electrons, and positrons and 10 μm for protons. In both MC engines, a high statistics of 109 primaries were simulated in order to obtain the beam dose envelope in water up to 150 mm far from the beam core. The dose was scored in water in 2 × 2 × 2 mm3 voxels.
2.6. Data Analysis
The data pre-processing was performed using PIXET PRO track processing tool, which provided a list of clusters and their parameters for each measurement performed at the given point of radiation field. For analysis of the dose profiles we extracted from PIXET PRO, we noted the following: (i) the total energy deposition in each cluster, (ii) the cluster position in the detector sensor, (iii) the total number of frames, and (iv) the frame duration time for each measurement point. For each measurement point, we calculated the relative dose rate D:
where Ei is the total energy deposited by a particle in a cluster, m is the mass of the detector silicon sensor, tacq is the frame acquisition time (constant within one measurement point), and n is the total number of frames acquired in one measurement point.
The visualization and comparison of the lateral dose profiles obtained experimentally in air and in water to simulations were performed as follows. The maximum value of the lateral beam dose profile simulated in GATE/Geant4, FRED, and TPS were normalized. The dose experimental profiles were adjusted to the corresponding simulated profiles using least mean square algorithm. This was the optimal method to visualize and compare the experimental and simulation results because the dose rate at the profile maximum varies depending on primary beam energy and measurement depth. The value of relative dose rate obtained experimentally was not modified between the measurement points within a single profile.
Next, we compared lateral and longitudinal dose profiles measured with MINIPIX TIMEPIX in water with the simulations of 3D dose profiles performed with clinical TPS, fast MC code FRED, and full MC code GATE/Geant4. A median filter with kernel size of 5 was used for lateral GATE/Geant4 profiles at the distance larger than 50 mm from the beam core to compensate for the statistical fluctuations of MC simulation.
For the purpose of visualization of the longitudinal dose profile measurement in water, the maximum value of the 3D dose distribution simulated in GATE/Geant4, FRED, and TPS was normalized to 1. The longitudinal profiles simulated at the distance from beam core are plotted according to the normalization, and the MINIPIX TIMEPIX measurement results were adjusted to the simulations using the same least mean square algorithm.
3. Results
3.1. Calibration Measurements
Figure 4 (left panel) shows an example of energy deposition spectra for detector angle β= 57° (cf. Figure 2 left panel) and nominal proton energy E150. The spectrum obtained experimentally (raw data) exhibits considerable amount of clusters with low-energy depositions (below 0.4 MeV) and particles incoming at significantly smaller angles than β. These clusters are produced mostly by photons originating from the gantry nozzle equipment (plane-parallel and multiwire ionization chambers), which are not explicitly simulated in the GATE/Geant4. The main energy deposition peak, with the maximum of about 0.5 MeV, is produced by the protons entering the detector at angle 57 ± 3°. The peaks to the right, with the maximum of about 1 MeV and 1.6 MeV, result from the overlapping effect, where respectively two or three primary protons overlap creating a single clusters with the doubled or tripled energy deposition. The overlapped clusters exhibit larger incident angles than the primaries in the main energy deposition peak. The overlapping effect is not taken into account in GATE/Geant4 simulations. In order to compare the spectra obtained experimentally with the MC simulations, all the particles incoming at angles different than 57±3° were filtered out. As a result of the filtration, the energy depositions from particles produced at the gantry nozzle equipment, as well as from overlapping clusters are removed from the energy deposition spectrum. Figure 4 (left panel) shows the spectra obtained experimentally before and after filtering, spectra obtained from simulations, and the measured angle of the incoming particles as a function of deposited energy.
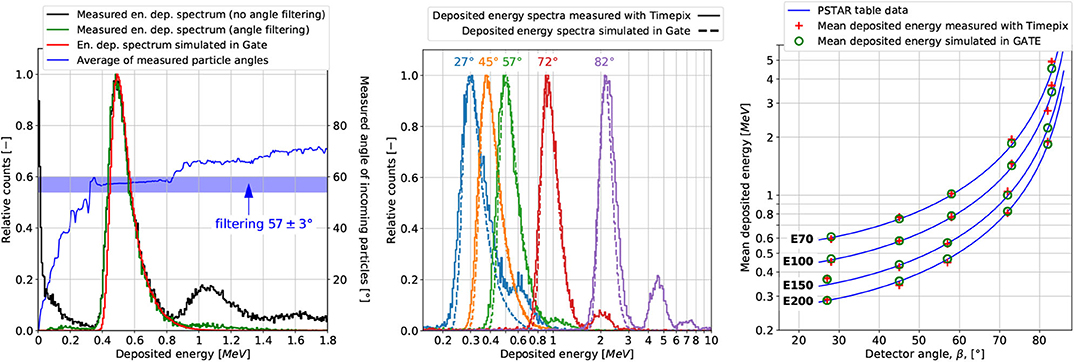
Figure 4. Example of energy deposition spectrum for proton beam at the nominal energy E150 measured with MINIPIX TIMEPIX positioned at angle β = 57° before and after filtering for the particles incidence angle (±3°) as well as the one obtained from GATE/Geant4 MC simulation (left). Energy deposition spectra after applying the cluster filtering procedure for nominal energy E150 and various β detector angles (middle). Mean energy deposited in MINIPIX TIMEPIX was exposed to nominal proton energies E70, E100, E150, and E200 when positioned at various angles. The measurement results are compared to MC simulations and data calculated based on PSTAR stopping power tables (right).
Figure 4 (middle panel) shows energy deposition spectra for nominal energy E150 and various β angles after angle filtering β±3°. The maximum value and width of the energy deposition spectra increase with the detector angle. This is because the average track length, thus the total energy deposited by a single particle crossing the detector active volume, increases with the detector angle with respect to the beam direction. The main energy deposition peak shapes, and positions are comparable with the simulations. The mean deposited energy obtained from MINIPIX TIMEPIX measurements (after filtering), simulated in GATE/Geant4 MC and calculated based on PSTAR stopping power data are presented in Figure 4 (right panel). The mean deposited energy simulated in GATE/Geant4 is consistent within 100 keV with the value expected from the PSTAR database in the entire range of the investigated detector angles and energies. The discrepancy between the mean energy deposition measured with MINIPIX TIMEPIX and the expected value from the PSTAR database, for detector angle β less than 73°, ranges from 1 to 60 keV. For angles greater than 73° it is higher, up to 550 keV. This might be an effect of registering particles scattered on the MINIPIX TIMEPIX case made of aluminum, which produce long clusters of large energy depositions. Therefore, for the beam profile measurements in water and in air, the detector angle of 45° was chosen.
3.2. Beam Spot Profiles in Air
Figure 5 shows proton pencil beam lateral profiles measured for nominal energies E100, E150, and E200 in air, at the isocentre, without and with the RS. The profile shapes measured with MINIPIX TIMEPIX correspond well to TPS beam model data obtained during the facility commissioning. The high sensitivity of MINIPIX TIMEPIX allowed to perform measurements in significant distance from the beam core (from 30 mm up to 180 mm) in relative dose range of three orders of magnitude. This allowed to measure the buildup of the nuclear halo.
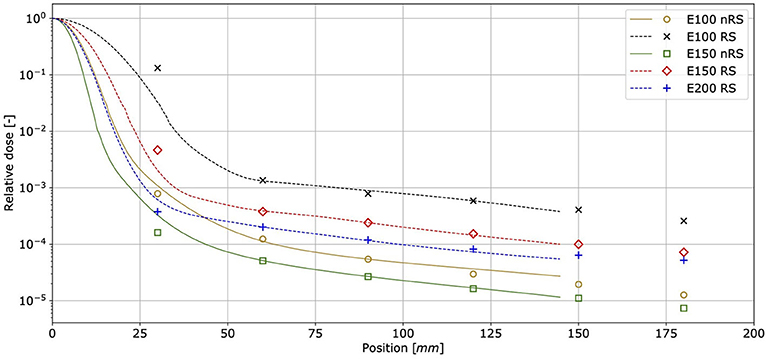
Figure 5. Lateral pencil beam dose profiles measured at the gantry room isocentre in air for primary proton beams at three nominal energies. Points correspond to MINIPIX TIMEPIX measurement results, whereas solid and dashed lines are the data obtained from TPS beam model without RS (nRS) and with RS, respectively.
3.3. Lateral Profiles in Water
Figure 6 shows MINIPIX TIMEPIX results in water performed with and without the RS for three nominal beam energies E100, E150, and E200. The measurement results of (i) the first Gaussian term obtained with the LYNX scintillating screen and (ii) the low-dose envelope (nuclear halo) obtained with MINIPIX TIMEPIX are compared with GATE/Geant4 and FRED MC simulations.
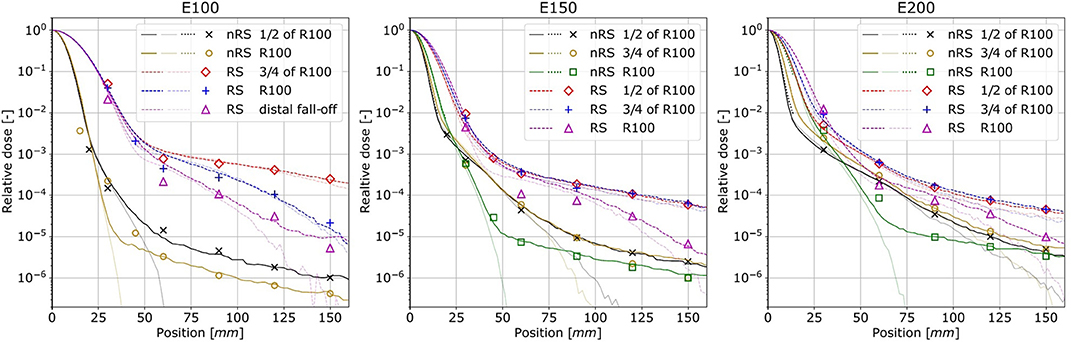
Figure 6. Lateral beam dose profiles measured in water at different depths for three beam nominal energies. Points correspond to MINIPIX TIMEPIX measurement results, dotted lines are results of measured with LYNX detector, whereas solid and dashed lines are the GATE/Geant4 data without (nRS) and with RS, respectively. Corresponding transparent lines presents FRED simulations result.
We observed an excellent agreement between the shape of the profiles obtained experimentally with LYNX and MINIPIX TIMEPIX and simulated with full MC code GATE/Geant4 up to 150 mm far from the beam core. The shapes of the lateral dose profiles were also accurately reproduced at different depths in water and behind the RS. In FRED simulations, the shapes of the lateral dose profiles in comparison to MINIPIX TIMEPIX measurements were well-mimicked up to four orders of magnitude. The disagreement for more distant measurement points is due to the fact the FRED code does not transport secondary gammas and electrons. Note, that in terms of performance, tracking rate achieved with GPU-accelerated MC code FRED was up to 3.6·106 primary/s on a single GPU card, compared to 1.1·103 primary/s with GATE/Geant4 running on CPU cluster.
3.4. Longitudinal Profiles in Water
Figure 7 presents proton pencil beam longitudinal dose profiles in water for beam nominal energy E150. The beam range measured with MINIPIX TIMEPIX is in agreement with the GATE/Geant4 simulations, even at the distance of 61 mm from the beam core, whereas TPS does not predict any dose at this distance.
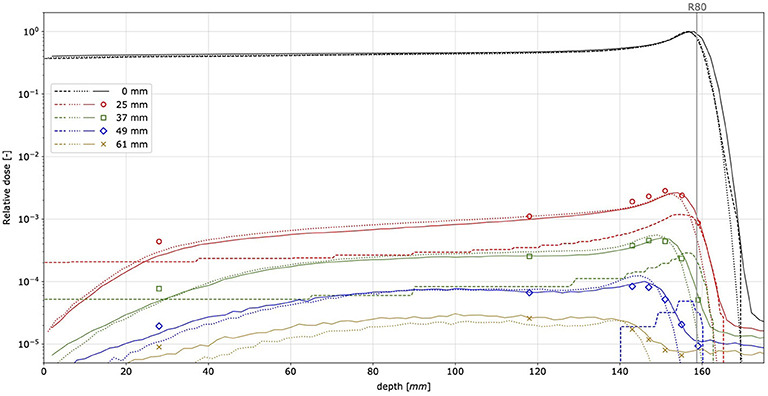
Figure 7. Longitudinal pencil beam dose profiles measured in water for proton beam nominal energy E150. Points correspond to MINIPIX TIMEPIX measurement results, whereas for solid, dotted, and dashed lines, they correspond to GATE/Geant4, FRED, and TPS simulations, respectively. The mean proton range of 158.7 mm is marked by a vertical line (R80).
4. Discussion
In the frame of this work we performed a validation of the detector calibration for protons. The comparison of the calibration measurements and MC simulations demonstrate that the MINIPIX TIMEPIX accurately measures energy deposited by proton beams. The comparison of the mean energy deposition in the detector to MC simulation results and PSTAR data indicates that positioning of the detector at 45° with respect to the beam axis is the most optimal for the measurements. The calibration measurements provide information on the energy deposited by particles producing separate or overlapping clusters (c.f. Figure 4, middle panel). The total energy deposited by several particles forming separate clusters and an overlap of clusters is nearly the same. Therefore, we assume that cluster overlapping does not influence the total dose measured in a single frame, as long as the signal in a pixel is within the dynamic range from 4 keV/pixel up to 2 MeV/pixel [49]. Here, we performed only the validation of the calibration for protons in energy range from 70 to 200 MeV, whereas in the mixed radiation field in water, a wider energy spectrum of particles can be registered by the detector. The response of the MINIPIX TIMEPIX detector to other radiation types was studied elsewhere [Granja et al., under review].
The measurements of the lateral and longitudinal pencil beam dose profiles performed with the MINIPIX TIMEPIX detector in air and in water show its capability to measure the dose with the dynamic range of up to four orders of magnitude. The measurements of the beam lateral profiles in air correspond well to the TPS beam model data obtained during the facility commissioning. The beam lateral and longitudinal profiles measured in water are in an excellent agreement with GATE/Geant4 simulations. We presented the relative difference between measurements and simulations normalized to the dose value in the beam core. For the lateral beam profiles in air, the relative difference is below 0.004% for the beam halo measurement points at 45–150 mm away from the beam core and 10% for the measurements at 30 mm away from the beam core. In case of lateral beam profiles in water the difference between the measurement and simulation is below 0.1% of the dose in the beam core. The difference increases up to 1.3% for the measurement points at 30 mm off the beam core. Higher discrepancy between measurements and simulations close to the beam core results from high dose gradients in this region. This leads to significantly different particle fluence measured in different locations of the detector sensitive area measuring close to the beam core. For longitudinal beam profiles in water the relative difference between the measurement and simulation is less than 0.12%. Because of the limited time resolution of the MINIPIX TIMEPIX detector, it was not possible to perform measurements in the beam core, where the fluence of particles was high, causing detector saturation. A new generation of the TIMEPIX detectors, the MINIPIX TIMEPIX 3 (ADVACAM), offers time resolution better than the MINIPIX TIMEPIX used in this work. MINIPIX TIMEPIX 3 will allow for measurements in the beam core and in therapeutic fields, where the particle fluence is high. This will be particularly important for patient treatment plan verification when several beams of various energies contribute to in-point distributions of LET spectrum. In order to minimize the fraction of particles scattered on the aluminum detector case, an alternative, e.g., PMMA case, should be considered.
Since MINIPIX TIMEPIX provides information about a single particle energy deposition and its track length, it is possible to calculate the linear energy transfer (LET) value of each particle penetrating the detector sensor. Future work will focus on an experimental characterization of the energy deposition and the LET spectra in mixed radiation fields produced by therapeutic proton beams in water. The results will be used for validation of MC codes and TPS, aiming at improved physical and biological modeling in proton radiotherapy.
Data Availability Statement
The raw data supporting the conclusions of this article will be made available by the authors, without undue reservation.
Author Contributions
PS, AR, JG, CG, GK, CO, MP-N, SN, and MR performed the experiments. PS and JG made the experiment data analysis and prepared figures. CG and CO provided expertise in MINIPIX TIMEPIX data analysis. JG performed the MC simulations, analyzed the data, and prepared the figures. MP-N and JB provided expertise in GATE/Geant4 MC simulations and data analysis. AS developed and made substantial improvements in FRED source code required to enable presented studies. PS, AR, and JG drafted the manuscript. NK extensively reviewed the manuscript. AR and JG designed the project. AR acquired funding. All authors contributed to the article and approved the submitted version.
Funding
This project was carried out within the Reintegration programme of the Foundation for Polish Science co-financed by the EU under the European Regional Development Fund—grant no. POIR.04.04.00-00-2475/16-00.
Conflict of Interest
CG and CO are employed by ADVACAM, Prague, Czechia.
The remaining authors declare that the research was conducted in the absence of any commercial or financial relationships that could be construed as a potential conflict of interest.
Acknowledgments
We acknowledge Aleksander Krempa from Krakow proton therapy center for IT support during implementation of this project. This research was supported in part by computing resources of ACC Cyfronet AGH. We acknowledge the support of NVIDIA Corporation with the donation of the GPU used for FRED MC simulations.
Supplementary Material
The Supplementary Material for this article can be found online at: https://www.frontiersin.org/articles/10.3389/fphy.2020.00346/full#supplementary-material
Supplementary Data Sheet 1. PMMA holder technical sketch.
Supplementary Data Sheet 2. PMMA holder technical sketch.
Supplementary Data Sheet 3. PMMA holder technical sketch.
Supplementary Data Sheet 4. PMMA holder technical sketch.
Supplementary Data Sheet 5. PMMA holder technical sketch.
References
1. Durante M, Orecchia R, Loeffler JS. Charged-particle therapy in cancer: clinical uses and future perspectives. Nat Rev Clin Oncol. (2017) 14:483. doi: 10.1038/nrclinonc.2017.30
2. Durante M. Proton beam therapy in Europe: more centres need more research. Brit J Cancer. (2018) 120:777–8. doi: 10.1038/s41416-018-0329-x
3. Grevillot L, Bertrand D, Dessy F, Freud N, Sarrut D. A Monte Carlo pencil beam scanning model for proton treatment plan simulation using GATE/GEANT4. Phys Med Biol. (2011) 56:5203. doi: 10.1088/0031-9155/56/16/008
4. Testa M, Schümann J, Lu HM, Shin J, Faddegon B, Perl J, et al. Experimental validation of the TOPAS Monte Carlo system for passive scattering proton therapy. Med Phys. (2013) 40:121719. doi: 10.1118/1.4828781
5. Fracchiolla F, Lorentini S, Widesott L, Schwarz M. Characterization and validation of a Monte Carlo code for independent dose calculation in proton therapy treatments with pencil beam scanning. Phys Med Biol. (2015) 60:8601–19. doi: 10.1088/0031-9155/60/21/8601
6. Harms J, Chang CW, Zhang R, Lin L. Nuclear halo measurements for accurate prediction of field size factor in a Varian ProBeam proton PBS system. J Appl Clin Med Phys. (2020) 21:197–204. doi: 10.1002/acm2.12783
7. Saini J, Cao N, Bowen SR, Herrera M, Nicewonger D, Wong T, et al. Clinical commissioning of a pencil beam scanning treatment planning system for proton therapy. Int J Part Therapy. (2016) 3:51–60. doi: 10.14338/IJPT-16-0000.1
8. Pidikiti R, Patel BC, Maynard MR, Dugas JP, Syh J, Sahoo N, et al. Commissioning of the world's first compact pencil-beam scanning proton therapy system. J Appl Clin Med Phys. (2018) 19:94–105. doi: 10.1002/acm2.12225
9. Boon SN, van Luijk P, Böhringer T, Coray A, Lomax A, Pedroni E, et al. Performance of a fluorescent screen and CCD camera as a two-dimensional dosimetry system for dynamic treatment techniques. Med Phys. (2000) 27:2198–208. doi: 10.1118/1.1289372
10. Russo S, Mirandola A, Molinelli S, Mastella E, Vai A, Magro G, et al. Characterization of a commercial scintillation detector for 2-D dosimetry in scanned proton and carbon ion beams. Phys Med Eur J Med Phys. (2017) 34:48–54. doi: 10.1016/j.ejmp.2017.01.011
11. Zhu XR, Poenisch F, Lii M, Sawakuchi GO, Titt U, Bues M, et al. Commissioning dose computation models for spot scanning proton beams in water for a commercially available treatment planning system. Med Phys. (2013) 40:041723. doi: 10.1118/1.4798229
12. Gajewski J, Klosowski M, Olko P. Two-dimensional thermoluminescence dosimetry system for proton beam quality assurance. Radiat Meas. (2016) 90:224–7. doi: 10.1016/j.radmeas.2015.12.019
13. Sa̧del M, Bilski P, Sankowsk a M, Gajewski J, Swakoń J, Horwacik T, et al. Two-dimensional radiation dosimetry based on LiMgPO4 powder embedded into silicone elastomer matrix. Radiat Meas. (2020) 133:106255. doi: 10.1016/j.radmeas.2020.106255
14. Rydygier M, Jastrzab M, Krzempek D, Nowak T, Grzanka L, Bednarczyk P, et al. Radiotherapy proton beam profilometry with scCVD diamond detector in single particle mode. Radiat. Protect. Dosimetry. (2018) 180:282–5. doi: 10.1093/rpd/ncx305
15. Lin L, Ainsley CG, Mertens T, De Wilde O, Talla PT, McDonough JE. A novel technique for measuring the low-dose envelope of pencil-beam scanning spot profiles. Phys. Med. Biol. (2013) 58:N171–80. doi: 10.1088/0031-9155/58/12/N171
16. Grevillot L, Stock M, Palmans H, Osorio Moreno J, Letellier V, Dreindl R, et al. Implementation of dosimetry equipment and phantoms at the MedAustron light ion beam therapy facility. Med Phys. (2018) 45:352–69. doi: 10.1002/mp.12653
17. Karger CP, Jäkel O, Palmans H, Kanai T. Dosimetry for ion beam radiotherapy. Phys Med Biol. (2010) 55:21. doi: 10.1088/0031-9155/55/21/R01
18. Chang CW, Huang S, Harms J, Zhou J, Zhang R, Dhabaan A, et al. A standardized commissioning framework of Monte Carlo dose calculation algorithms for proton pencil beam scanning treatment planning systems. Med Phys. (2020) 47:1545–57. doi: 10.1002/mp.14021
19. Giordanengo S, Manganaro L, Vignati A. Review of technologies and procedures of clinical dosimetry for scanned ion beam radiotherapy. Phys Med. (2017) 43:79–99. doi: 10.1016/j.ejmp.2017.10.013
20. Giordanengo S, Palmans H. Dose detectors, sensors, and their applications. Med Phys. (2018) 45:e1051–72. doi: 10.1002/mp.13089
21. Schwaab J, Brons S, Fieres J, Parodi K. Experimental characterization of lateral profiles of scanned proton and carbon ion pencil beams for improved beam models in ion therapy treatment planning. Phys Med Biol. (2011) 56:7813–27. doi: 10.1088/0031-9155/56/24/009
22. Soukup M, Fippel M, Alber M. A pencil beam algorithm for intensity modulated proton therapy derived from Monte Carlo simulations. Phys Med Biol. (2005) 50:5089–104. doi: 10.1088/0031-9155/50/21/010
23. Schiavi A, Senzacqua M, Pioli S, Mairani A, Magro G, Molinelli S, et al. Fred: a GPU-accelerated fast-Monte Carlo code for rapid treatment plan recalculation in ion beam therapy. Phys Med Biol. (2017) 62:7482–504. doi: 10.1088/1361-6560/aa8134
24. Bisogni MG, Cirrone GAP, Cuttone G, Del Guerra A, Lojacono P, Piliero MA, et al. Medipix2 as a tool for proton beam characterization. Nuclear Instrum Methods Phys Res A. (2009) 607:48–50. doi: 10.1016/j.nima.2009.03.115
25. Jakubek J, Granja C, Jakel O, Martisikova M, Pospicil S. Detection and track visualization of primary and secondary radiation in hadron therapy beams with the pixel detector Timepix. In: IEEE Nuclear Science Symposium Conference Record. Knoxville: IEEE. (2010). p. 1967–9. doi: 10.1109/NSSMIC.2010.5874118
26. Gallas RR, Arico G, Burigo LN, Gehrke T, Jakubek J, Granja C, et al. A novel method for assessment of fragmentation and beam-material interactions in helium ion radiotherapy with a miniaturized setup. Phys Med. (2017) 42:116–26. doi: 10.1016/j.ejmp.2017.09.126
27. Rosenfeld A, Alnaghy S, Petasecca M, Cutajar D, Lerch M, Pospisil S, et al. Medipix detectors in radiation therapy for advanced quality-assurance. Radiat Measurements. (2020) 130:106211. doi: 10.1016/j.radmeas.2019.106211
28. Martiíková M, Jakubek J, Granja C, Hartmann B, Oplka L, Pospíil S, et al. Measurement of secondary radiation during ion beam therapy with the pixel detector Timepix. J Instrument. (2011) 6:C11014. doi: 10.1088/1748-0221/6/11/C11014
29. Opalka L, Granja C, Hartmann B, Jakubek J, Jaekel O, Martisikova M, et al. Linear energy transfer and track pattern recognition of secondary radiation generated in hadron therapy beam in a PMMA target. J Instrument. (2013) 8:C02047. doi: 10.1088/1748-0221/8/02/C02047
30. Loo K, Petasecca M, Safavi M, Lerch M, Han Z, Jakubek J, et al. BrachyView: a novel in-body imaging system for prostate brachytherapy. In: IEEE Nuclear Science Symposium Conference Record. Valencia: IEEE. (2011). p.279–81. doi: 10.1109/NSSMIC.2011.6154497
31. Rosenfeld AB. Electronic dosimetry in radiation therapy. Radiat Meas. (2006) 41(Suppl. 1):134–53. doi: 10.1016/j.radmeas.2007.01.005
32. Reza S, Wong WS, Fröjdh E, Norlin B, Fröjdh C, Thungström G, et al. Smart dosimetry by pattern recognition using a single photon counting detector system in time over threshold mode. J Instrument. (2012) 7:C01027. doi: 10.1088/1748-0221/7/01/C01027
33. Rubovič P, Bergmann B, Ekendahl D, Hulka J, Judas L, Kohout Z, et al. Timepix detector as a tool for X-ray and gamma dosimetry. Radiat Meas. (2017) 107:39–42. doi: 10.1016/j.radmeas.2017.10.012
34. Michel T, Bohnel M, Durst J, Sievers P, Anton G. Low energy dosimetry with photon counting pixel detectors such as medipix. IEEE Trans Nuclear Sci. (2009) 56:417–23. doi: 10.1109/TNS.2009.2015229
35. George SP, Severino CT, Fröjdh E, Murtas F, Silari M. Measurement of an accelerator based mixed field with a Timepix detector. J Instrument. (2015) 10:P03005. doi: 10.1088/1748-0221/10/03/P03005
36. Kroupa M, Bahadori A, Campbell-Ricketts T, Empl A, Hoang SM, Idarraga-Munoz J, et al. A semiconductor radiation imaging pixel detector for space radiation dosimetry. Life Sci Space Res. (2015) 6:69–78. doi: 10.1016/j.lssr.2015.06.006
37. Stoffle N, Pinsky L, Kroupa M, Hoang S, Idarraga J, Amberboy C, et al. Timepix-based radiation environment monitor measurements aboard the International Space Station. Nuclear Instrum Methods Phys Res A. (2015) 782:143–8. doi: 10.1016/j.nima.2015.02.016
38. Turecek D, Pinsky L, Jakubek J, Vykydal Z, Stoffle N, Pospisil S. Small dosimeter based on Timepix device for international space station. J Instrument. (2011) 6:C12037. doi: 10.1088/1748-0221/6/12/C12037
39. Dudak J, Zemlicka J, Krejci F, Polansky S, Jakubek J, Mrzilkova J, et al. X-ray micro-CT scanner for small animal imaging based on Timepix detector technology. Nuclear Instrum Methods Phys Res A. (2015) 773:81–6. doi: 10.1016/j.nima.2014.10.076
40. Granja C, Kudela K, Jakubek J, Krist P, Chvatil D, Stursa J, et al. Directional detection of charged particles and cosmic rays with the miniaturized radiation camera MINIPIX TIMEPIX. Nuclear Instrum Methods Phys Res A. (2018) 911:142–52. doi: 10.1016/j.nima.2018.09.140
41. Turecek D, Jakubek J. Dependence on temperature and pixel threshold of the calibration for the Timepix detector and its correction method. J Instrument. (2013) 8:C01010. doi: 10.1088/1748-0221/8/01/C01010
42. Ballabriga R, Campbell M, Llopart X. Asic developments for radiation imaging applications: the medipix and timepix family. Nuclear Instrum Methods Phys Res A. (2018) 878:10–23. doi: 10.1016/j.nima.2017.07.029
43. Granja C, Jakubek J, Polansky S, Zach V, Krist P, Chvatil D, et al. Resolving power of pixel detector Timepix for wide-range electron, proton and ion detection. Nuclear Instrum Methods Phys. Res A. (2018) 908:60–71. doi: 10.1016/j.nima.2018.08.014
44. Sarrut D, Bardiés M, Boussion N, Freud N, Jan S, Létang J, et al. A review of the use and potential of the GATE Monte Carlo simulation code for radiation therapy and dosimetry applications. Med Phys. (2014) 41:64301. doi: 10.1118/1.4871617
45. Rucinski A, Gajewski J, Olko P, Rinaldi I, Patera V, Schiavi A. GPU-accelerated Monte Carlo code for fast dose recalculation in proton beam therapy. Acta Phys Polonica B Proc Suppl. (2017) 2017:1–6. doi: 10.5506/APhysPolB.48.1625
46. Jakubek J. Precise energy calibration of pixel detector working in time-over-threshold mode. Nuclear Instrum Methods Phys Res A. (2011) 633:262–66. doi: 10.1016/j.nima.2010.06.183
47. Berger MJ, Coursey JS, Zucker MA, Chang J. Stopping-Power & Range Tables for Electrons, Protons, and Helium Ions. (2017). Available online at: https://www.nist.gov/pml/stopping-power-range-tables-electrons-protons-and-helium-ions
48. Resch AF, Elia A, Fuchs H, Carlino A, Palmans H, Stock M, et al. Evaluation of electromagnetic and nuclear scattering models in GATE/Geant4 for proton therapy. Med Phys. (2019) 46:2444–56. doi: 10.1002/mp.13472
Keywords: proton therapy, dose, semiconductor pixel detector, Timepix detector, Monte Carlo simulation
Citation: Stasica P, Baran J, Granja C, Krah N, Korcyl G, Oancea C, Pawlik-Niedźwiecka M, Niedźwiecki S, Rydygier M, Schiavi A, Rucinski A and Gajewski J (2020) A Simple Approach for Experimental Characterization and Validation of Proton Pencil Beam Profiles. Front. Phys. 8:346. doi: 10.3389/fphy.2020.00346
Received: 30 May 2020; Accepted: 22 June 2020;
Published: 28 October 2020.
Edited by:
Yolanda Prezado, INSERM U1021 Signalisation normale et pathologique de l'embryon aux thérapies innovantes des cancers, FranceReviewed by:
Jeff Buchsbaum, National Institutes of Health (NIH), United StatesMarie Vidal, Centre Antoine Lacassagne, France
Copyright © 2020 Stasica, Baran, Granja, Krah, Korcyl, Oancea, Pawlik-Niedźwiecka, Niedźwiecki, Rydygier, Schiavi, Rucinski and Gajewski. This is an open-access article distributed under the terms of the Creative Commons Attribution License (CC BY). The use, distribution or reproduction in other forums is permitted, provided the original author(s) and the copyright owner(s) are credited and that the original publication in this journal is cited, in accordance with accepted academic practice. No use, distribution or reproduction is permitted which does not comply with these terms.
*Correspondence: Jan Gajewski, jan.gajewski@ifj.edu.pl