Ionizing Radiation Effects on Hs 578Bst Microtubules
 L. Bruni
 M. Manghi1,2
  S. Croci
- 1Museo Storico della Fisica e Centro Studi e Ricerche Enrico Fermi, Rome, Italy
- 2Dipartimento di Medicina e Chirurgia, Università di Parma, Parma, Italy
- 3Fondazione IRCCS Istituto Nazionale dei Tumori di Milano, Milan, Italy
- 4Abbelight, Paris, France
Microtubules are one of the three components of the cell cytoskeleton. They are hollow wires, with a diameter of about 25 nm, formed by 13 laterally associated protofilaments composed by dimers of α and β-tubulin. Microtubules are dynamic structures which undergo constant modifications by shrinking and elongating in a phenomenon called treadmilling. Microtubules intervene in various fundamental aspects of the biology of a cell. They contribute to determine the shape of a cell, play a role in the cell movement, and in the intracellular transport of organelles during motion and mitotic chromosome segregation. Despite the relevance of the processes mediated by microtubules most studies on the effects of ionizing radiations focus their attention on the damages delivered to DNA. In this paper we attempt to assess the effects borne by IRs to the microtubules network as a biological target. In this study we irradiated Hs 578Bst cells (a no-cancer, no-immortalized, human breast epithelial cell line) with an 8 Gy single dose of either X-rays or protons. After the irradiated cells fixation, the microtubules were imaged by means of stochastic optical reconstruction microscopy to characterize the network disruption. In our results, Microtubules fibers integrity appears to not have been significantly affected at the administered dose of protons and X-rays, nonetheless we observed differences in the MT network distribution and fiber curvatures.
Introduction
Microtubules (MT) are one of the three components of the eukaryotic cell cytoskeleton. MTs are modular structures composed of protofilaments which are sequences of heterodimers made by pairs of α- and β-tubulin monomers (αβ-tubulin) that align in a head-to-tail fashion [1]. Filaments of αβ-tubulin laterally associate eventually closing up to form a hollow wire-like structure made of 13 protofilaments. MTs are dynamic structures which undergo constant elongation and shrinkage through polymerization and depolymerization in a phenomenon called treadmilling. The homeostasis of the MT lattice, alternatively defined “dynamic instability,” is thus controlled by the balance between the processes of adding and removing αβ-tubulin heterodimers which determines the phases of growth and shortening of the tubules. The phase when the balance of the process tips in favor of a rapid depolymerization is called “catastrophe,” whereas the opposite phase, where protofilaments recover, is called “rescue” [2, 3]. Since protofilaments are oriented sequences of polar αβ-tubulin heterodimers their concatenation results in the construction of protofilaments with polar ends that exhibit different behavior with respect to the processes of polymerization and depolymerization, the first taking place prevalently at the “plus end” of the filament where β-tubulin is exposed.
The hydrolysis of GTP bound to the E-site of β-tubulin into GDP is the key process that drives the MT conformational changes, leading the entire web toward rearrangements and generating mechanical strain on the microtubules [4, 5].
MTs stretch out from cellular structures called microtubule-organizing centers (MTOC) and extend toward the boundary of the cell. Centrosome-based MTOCs (cMTOC) were thought to be the most relevant centers organizing MTs until a recent paper [6] showed that in several animal cells they are neither the only nor the most relevant MTOCs, since they account for less than 10% of the overall MTs web. In these cells other cytoplasmatic sites, such as the Golgi bodies and other sites located in proximity of the cell boundary, were found to originate and organize MT bundles. This new fact sheds light on the MT network role and importance and is spurring new studies on the topic. Figure 1 depicts an example of MTs organization, distribution, and density as it could be structured in a fibroblast. Even though MTOCs can be everywhere throughout the cell cytoplasm, the MT density in fibroblasts is unevenly distributed and generally higher in regions far from the cell boundaries. Figure 2 shows the MT network of a cell taken from the control set of our experiment reconstructed by means of STORM imaging.
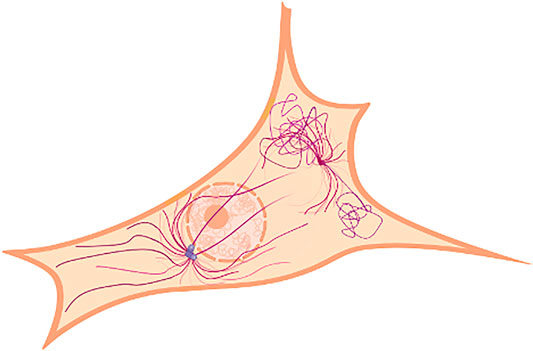
FIGURE 1. Schematic representation of a centrosomal microtubule-organizing center tied to the nucleus and the microtubule organization proximal to the edge of a cell.
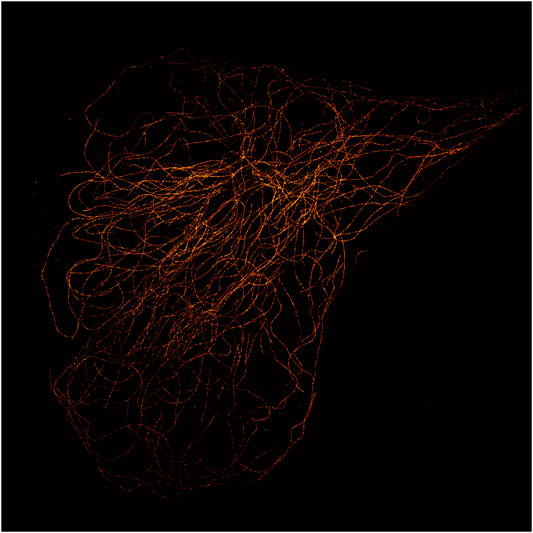
FIGURE 2. MT STORM image of a control cell (Hs 578Bst cell line). α-Tubulin probed with mouse anti-human primary antibody and goat anti-mouse AlexaFluor 555 as the secondary antibody.
Treadmilling causes the MT web to transform and rearrange generating mechanical strain [5]. The dynamic instability between the phases of growth and shrinkage induces MTs to constantly bend and buckle that often results in MT lattice breaking, a type of event that, at a sufficiently high occurrence rate, affects many cellular activities, such as migration, motility, and chromosome segregation [7]. The MTs elastic properties are the physical factors that determine the way MT fibers respond to mechanical strain and stimuli. These properties ultimately are determined by the molecular structure of the filaments and it has been shown that any disruption that may interfere with the polymerization also alters the basic elastic characteristics of an MT (e.g., the Young modulus) thus changing its mechanical properties [8, 9]. MTs are involved in an extensive range of cellular processes such as intracellular transport, chromosome separation during mitosis, cell polarity, and morphogenesis tuning. MTs make up structural elements that control cilia and flagella. Since MTs are fundamental constituents of other cytoskeletal structures, such as the mitotic spindle involved in the cellular proliferation, they became a biological target for the treatment of cancer.
IRs are largely used for treating oncological pathologies because rapidly proliferating cancer cells are more sensitive than normal cells in relation to DNA damages. Nonetheless therapeutic protocols make use of different types of radiations, namely photons and protons, each one having different RBE [10–12].
RBE is measured from the dose response curve using an endpoint, namely the survival fraction, as a reference. The survival curve is usually fitted with a linear-quadratic mathematical model which is still today the most important tool in preclinical and clinical radiobiology. The interpretation of linear-quadratic model parameters could be strictly linked to DNA damages such as base damages or strand break [13]. However many could be considered as primary endpoints such as double strand breaks, chromosome aberrations, mutations, foci formation, and micronuclei formation which also fit the linear-quadratic relationship leading to the same RBE relationship as for cell survival [14].
It is a general assumption that, similarly to genomic DNA, macromolecules that play vital roles in the cell physiology are affected by IRs but less is known about the IR specific effectiveness in damaging such structures. It can be argued that specific radiation types can have differential disruption efficacies that could lead to differential probabilities of cellular death [15, 16].
For example tumor cells irradiated with protons show a higher apoptotic rate than those irradiated with photons. Some studies suggest that proton irradiation might significantly impair the primary cancer cells step-up to the metastasis formation and in addition low-energy protons could comparatively be more effective than photons in inhibiting the metastatic cells migration [17]. For this reason when examining radiation effects on cellular growth the specific damages delivered to cytoskeletal structures ought to be taken into account.
It is well established that there are effects that are not related to the direct delivery of energy to the DNA of cells affected by radiation. These effects include signaling pathways that are not dependent on DNA damage, bystander responses, adaptive responses, low dose hypersensitivity, genomic instability, and the inverse dose-rate effect [18].
The aim of the present paper is to carry out a preliminary study of cytoskeletal microtubules as biological targets of IRs such as protons and X-rays. We irradiated with an 8 Gy single dose of either X-rays or protons since in unpublished data collected with atomic force microscopy we observed that significant cytoskeletal remodeling took place at about 8 Gy.
In the case of breast cancer the therapeutic approach includes the irradiation of non-cancer tissue bordered by the neoplastic resected masses. For this reason in the presented study we used the Hs 578Bst cell that comes from the normal breast tissue peripheral to an infiltrating ductal carcinoma and is the nearest cellular model to the breast epithelial tissue used in a conventional cell biology laboratory. We irradiated cells taken from the Hs 578Bst cell line and attempted an assessment of the induced modifications by comparing the MT networks density, distribution, and curvature using stochastic optical reconstruction microscopy (STORM).
Materials and Methods
Cell Culture
Cells of the human breast cancer Hs 578Bst cell line were purchased from American Type Culture Collection (ATCC) in partnership with LGS standard. Hs 578Bst cells were cultivated on Hybrid Care Medium (ATCC), provided with 10% of fetal bovine serum (Invitrogen). Cells were incubated at 37°C in a humidified atmosphere at 5% CO2. The cell culture dilution was carried out as soon as 90–100% of the cell dish bottom was covered, and the cell medium was refreshed every 48–72 h.
Sample Preparation and Irradiation
Before cell seeding and irradiation, the coverglasses (Marienfeld), 20 mm2 wide and 1.5 mm thick, were sealed on the bottom of the cell dishes, in order to avoid them floating through the medium. The bottom was previously washed with PBS (Lonza) 1X, suitable for cell culture. The dishes were left open under the cabinet flow for about 30′ to dry them and to secure the coverglass sealing. After, the sealing cells were seeded homogeneously on the coverglass, at the concentration of 4,000 cells/ml. Cells were irradiated 24 h after this procedure was completed.
Proton Irradiation of Hs 578Bst Cell
Since the experimental set up of the proton irradiation facility required the dishes to be placed upright, they were completely filled with medium in order to keep the cells submerged. To prevent medium leaking, dishes were wrapped with parafilm®. Cells were irradiated at the Proton Therapy Center (Trento—Italy) with a 150 MeV proton beam and a dose rate of 1.2 Gy/min. The total dose delivered was 8 Gy without fractioning, a dose that corresponds to the center of the spread-out Bragg peak. The combination of a tantalum foil and a collimation system (made of PVC) ensured a homogeneous dose delivery into an area of 6 cm2, significantly larger than the cell dish size [19]. After the irradiation, each sample was placed into an incubator suitable for cell culturing, waiting for the induced radioactivity to decay.
Hs 578Bst Cell Line X-Ray Irradiation
X-ray irradiation was done using an Xstrahl cabinet irradiator at the Trento Institute for Fundamental Physics and Applications facility. Single exposure 8 Gy doses were delivered at an applied voltage of 195 kVp. The cell dishes were placed on a rotating plate within the irradiator cabinet, so as to uniformly deliver the dose to the overall cell cultures.
Nanoscopy Imaging
Sample Preparation
After the sample irradiation procedure, cell medium was removed and samples were washed with PHEM 1.5X. After prefixation/denaturation with a mix of glutaraldehyde (Sigma) and triton (Sigma), cells were fixed with paraformaldehyde (Sigma) and glutaraldehyde (Sigma) for 10′ and then washed three times with PBS 1X (Sigma). After blocking with BSA (Invitrogen), cells were incubated with anti α-tubulin (Sigma) for 1 h at 37°C. The antibody was diluted in PBS with BSA at 1%. Following the primary hybridization, the samples were washed with PBS 1X, to get rid of antibody excess and incubated with secondary antibody [Alexafluo 555—(Sigma)] diluted in PBS 1X supplemented by BSA 1%. The reaction took 1 h at 37°C. Then the samples were washed with PBS 1X from the excess of the antibody mix solution and fixated with formaldehyde (Sigma) and again washed with PBS 1X. After the aldehyde reactions were blocked with NH4Cl, the samples were stocked at 4°C within sterile PBS 1X waiting for super resolution microscopy measurements.
Imaging
Samples were mounted with the SMART Kit buffer (Abbelight, Paris, France). The 3D STORM images were acquired using a SAFe360 module (Abbelight) coupled to an inverted bright-field Olympus IX71 microscope, equipped with a ×100 oil-immersion objective with a high numerical aperture (1.49 NA). This quad-view system (dual-cam sCMOS cameras, Orcaflash v4, Hamamatsu) provided 3D nanoscopy information with high isotropic localization precision (15 nm × 15 nm × 15 nm). Axial information was obtained by a technique named DAISY [20], coupling super-critical angle fluorescence (SAF) and strong astigmatism of the point spread function. Twenty-thousand frames at 50 ms were acquired to collect the single-molecule detections and reconstruct a nanoscopy image. The resulting coordinate tables and images were processed and analyzed using the SAFe NEO software (Abbelight).
Statistical and Data Analysis
STORM images were analyzed using the ImageJ software [21] to calculate the MT area occupancy. Control and irradiated groups were compared with one-way ANOVA and a Tukey statistical test. Filament reconstruction and MT curvature were calculated with the MATLAB® based SIFNE software [22]. Statistics and graphing were performed in MATLAB. For each population the Kolmogorov–Smirnov statistical test was performed on a subpopulation of 300 randomly extracted values.
Results
The contribution of secondary radiation generated by the interaction between the proton beam and the experimental setup (Petri dish and culture medium) was estimated with a Monte Carlo Fluka simulation [14, 15] whose details are outside the scope of this paper. The simulation results showed this contribution to be negligible with respect to the dose delivered by the primary beam (secondary dose contribution <1%).
A comparison of the MT network structural organization between control and irradiated cells showed no observable MT ruptures. We estimated for each cell both the total and peripheral occupancy ratio of the MT network. The total occupancy ratio was calculated dividing the total MT network extension, measured as the number of MT-identified pixels, by the total area of the cell. The total area of the cell was estimated by counting the number of pixels contained in a polygonal region drawn as to accurately delimit the external boundary of the cell. The peripheral occupancy ratio was calculated dividing the MT network extension contained in an annular region along the cell boundary by the total MT network extension. The annular band of a cell was delimited on the outer edge by the polygon that contains the entire cell and, on the inner edge, by the same polygon rescaled by a factor suitable to have a ∼4 μm width. Figure 3 shows an example of such annular bands. The generally lower density of MTs near the cell boundaries and the smaller cellular thickness in such regions reduce the probability of MT overlapping and buckling thus enabling a more accurate identification and analysis of the fibers with SIFNE. Table 1 summarizes the computed total and peripheral occupancy ratios.
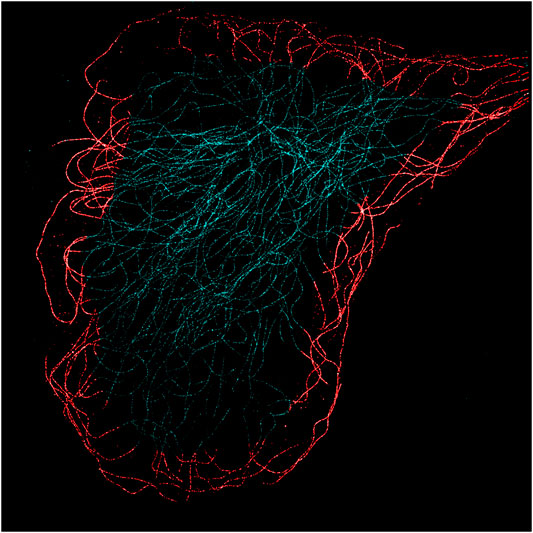
FIGURE 3. MT STORM image of a control cell (Hs 578Bst cell line). The 4 μm annular band marked in red is the region selected to evaluate the MT occupancy and curvature.
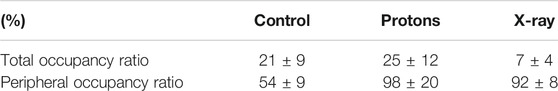
TABLE 1. Computed total and peripheral occupancy ratios.
The different occupancies are also evident in the 3D color visualization (supplemented material). The control cell shows a higher (Supplementary Figure S1) (green) region clearly located near the nucleus, a cell zone where the centrosomal microtubule-organizing center (cMTOC) is placed. Usually in proliferating (i.e., cancer cells) and not in differentiated cells the cMTOC is found in a similar cell site [17]. The MT network of control cells seems to originate from a specific point near the nucleus. On the contrary, in the irradiated samples it is not possible to recognize such organization and a different distribution is also demonstrated by a color map indicating different altitudes. Control and irradiated groups were compared with a one-way ANOVA test that showed no statistical difference in the total occupancy ratios (p = 0.12) but revealed a significant difference in the peripheral occupancy ratio when comparing the control and the irradiated groups (p = 0.02). The outcome of the former test was confirmed by a Tukey test which indicated significant differences between the control and proton irradiated groups (p = 0.02) as well as between the control and X-ray irradiated groups (p = 0.03). The same test rejected a difference between the two irradiated groups (p = 0.88). The second characteristic investigated was the MTs curvature. The molecular aspects of MT functions have been intensively studied, but how the global MT networks collectively contribute to the physical and biochemical attributes of cells has not been fully understood [8, 23]. Nonetheless, the potential importance of the latter is supported by emerging examples in which the physical properties of MTs directly participate in cellular physiology in a highly regulated manner [6, 24].
The analysis of microtubule bending, especially in vivo, may serve as a useful tool for measuring the net mechanical stress in different regions of the cell. In addition, microtubule buckling near the cell edge suggests mechanical compression [25]. To analyze MT curvatures we used SIFNE software, to both reconstruct the MTs and calculate the curvature values of each selected filament [22].
We selected a sector of the annular band that encompassed the leading edge of the cell, where the curvatures of the MTs were more evident. In Figure 4, an example of the SIFNE-reconstructed MTs is displayed for the selected sector of a control cell. In migrating cells, the MT structure is polarized toward the direction where the cells are moving. In fibroblasts and endothelial cells, the centrosome and most MTs are oriented toward the leading edge [26]. Also epithelial cells have MTs oriented in such a way that plus ends are stretched toward the leading edge, where the MTs growth prevalently takes place [9, 27, 28].

FIGURE 4. Microtubule reconstructed filaments occupying the 4 μm band identified as the leading edge of the cell. MTs were reconstructed with the SIFNE software, using the cell shown in Figure 3.
We extracted from the SIFNE internal data structures the whole collection of single pixelwise (pw) curvature data in order to proceed with the computation of the mean values. Since the curvature average values were calculated out of the whole set of individual reconstructed MT pixels contained in the selected sector we disregarded the fact that filaments had in general been clipped by the selection of the region of interest. For each cell and for all reconstructed filaments the pw curvature values were computed [22]. In Figure 5A shows the distributions of the pixelwise curvature values of the control and of the X‐ray irradiated cells while in Figure 5B the same distributions are shown for the control and proton irradiated cells. The pw curvature mean and standard deviation (SD) of each group are shown in Table 2.
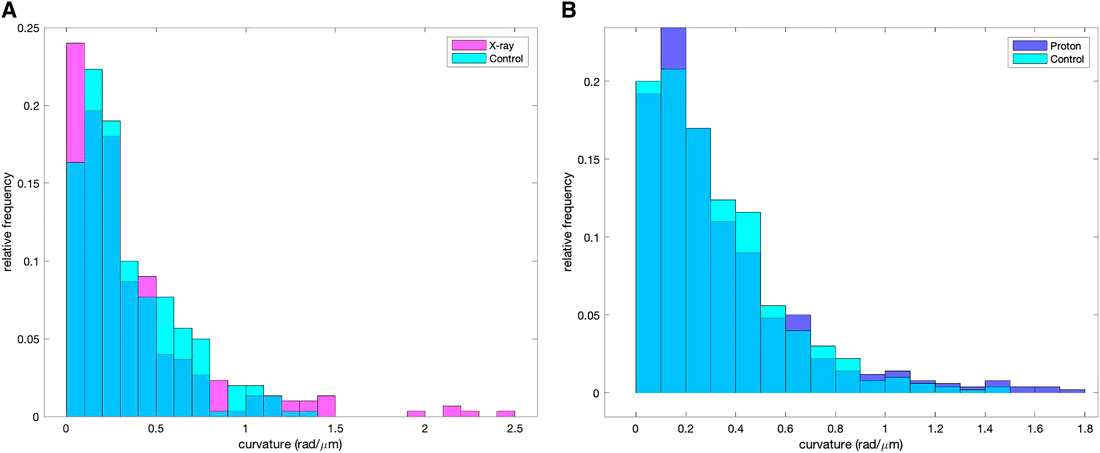
FIGURE 5. Pixelwise curvature distribution of the reconstructed MTs of the control and the proton-irradiated samples (A). Relative pixelwise curvature distributions of the reconstructed MTs of the control and X-ray irradiated samples (B).
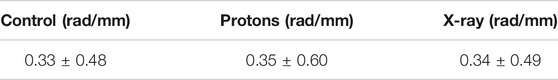
TABLE 2. Pixelwise curvature mean and standard deviation (SD) of each group.
These values in Table 2 are in complete agreement with literature [29].
A pairwise comparison of the control group with the two irradiated groups based on the Kolmogorov-Smirnov test did not reveal statistical difference (p = 0.76 for the control/protons comparison, p = 0.23 for control/X-ray comparison). We explain the lack of significant difference between the groups with the fact that the curvature distributions are highly concentrated at low values, as the median values of the curvatures were 0.27 rad/μm for the control group and ∼0.25 rad/μm for both the irradiated groups. We then focused our attention on the high curvature values in the tail of the distributions limiting our analysis to values higher than 0.92 rad/μm (which delimits the 5% highest values in the control group). Some studies made quantitative analysis of the conditions that led to MT breaking [29] and showed an overall average curvature value of 0.39 rad/μm whereas MTs that eventually broke had a much higher average curvature of 1.5 rad/μm. Various processes contribute to bringing an MT into the curvature range that might lead to rupture, all of them affecting the molecular structure of the MT and reducing the tubule Young modulus. The modulation of the MT mechanical properties exerted by the association to external proteins is a possible mechanism that might account for the breaking of MTs in cells under compression and the interaction with kinesins could be the cause of molecular alterations that reduce the Young modulus [7]. We therefore restricted our analysis to the highest curvature value range to seek information about the fibers that might have undergone some process that degraded their pristine mechanical features.
The MT curvature distribution comparisons are shown in Figure 6A (control and X-ray irradiated groups) and in Figure 6B (control and proton irradiated groups). The Kolmogorov–Smirnov test on the high curvature distribution values shows a clear difference between control and proton-irradiated populations (p = 6 × 10⁻⁵) as well as between control and X-ray irradiated groups (p = 7 × 10⁻⁵). The same statistical test could not differentiate between protons and X-ray irradiated distributions (p = 0.89). Such high curvature distributions had a median value of 1.13 rad/μm for the control, 1.24 rad/μm for the proton-irradiated, and 1.23 rad/μm for the X-ray irradiated group.
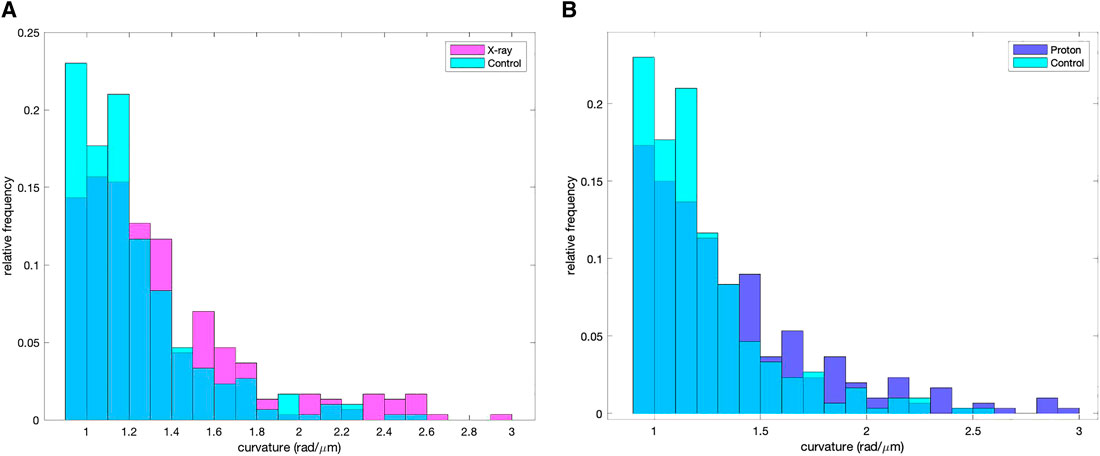
FIGURE 6. Pixelwise curvature distribution of the reconstructed MTs for pixelwise curvature values >0.92 rad/μm. (A) Control and proton-irradiated samples, (B) control and X-ray irradiated samples.
Discussion and Conclusion
It is easy to notice that in the control cells the MTs do not evenly fill all the cell districts. The MT network seems to be more dense is some regions and, likewise, the percentage of MT-occupied areas varies when different cells are compared. Prior to cell fixation, if the cells were migrating toward a particular coverslip district, the MTs lattice and its web structure were constantly under modification and rearrangement. The observed variability is also due to the fact that we chose different cell morphologies to create a wider picture of the control cell MT distribution. Our analysis of the MT area occupancy revealed two findings correlated to the MTs distribution inside the cells. The first is connected to the MT density: the control and the proton-irradiated groups have the same MT area occupancy ratio, while cells irradiated with X-rays, show lower MT density values. Nevertheless the ANOVA test did not reveal any difference between the groups and, if any difference existed, a larger number of samples would have been needed in order to improve the statistical power of the test.
The second aspect is linked to the MTs distribution between control and irradiated groups. The Tukey test for the peripheral occupancy ratio indicated a significant difference between control and irradiated groups and no difference between the irradiated groups. The control indicates that the MTs are more concentrated into the central part of the cell while the irradiated groups exhibit a substantially constant density throughout. Proton and X-ray irradiations might have damaged, either directly or indirectly, the cMTOC pushing the cells toward a reorganization of the cMTOC sites. Cell cycle progression and cellular differentiation are associated with a significant loss of centrosomal activities as well as its MTOC properties. As a consequence the reorganization of microtubules into non-centrosomal arrays is mandatory for cell life [30, 31]. A change in MT distributions, in particular in the case of proton-irradiated samples where the MT density did not change, could be a sign of MT severing or reorganization.
Concerning the MT curvature results and considering only curvatures higher than 0.92 rad/μm, we observe a significant difference between control and irradiated groups, with a significantly higher pw curvature median value. Because the curvature is strictly connected to the external mechanical stress and to the Young’s modulus, these differences need to be investigated in detail in order to better understand the reasons why they occur. Higher compression could be a cause in the case of proton-irradiated cells, where the MTs density in that region is higher with respect to the control group. However this does not explain X-ray data, where the density is lower. Higher curvature could be a sign of change of the Young’s modulus due to a modification of the intrinsic MT proprieties or an alteration in the MT surroundings, for example because of the presence of proteins binding to the MT molecular structure [32]. At this point, there could be many a speculation about the biological explanations for these findings also because many questions are still open [33].
In conclusion, results show that MTs respond in a similar way in the case of proton and X-ray irradiation, both in terms of MT peripheral occupancy and in terms of the change of MT curvature. Nevertheless, a larger number of cells is needed to create clearer statistical insight into MT total occupancy after X-ray or proton irradiations. Because of the MT dimensions, that are comparable with DNA, and given the self-repairing and self-healing capabilities of MTs, MTs could be a promising biological target for IRs. Unlike DNA, which is located in the nucleus of the cell, the MT network is distributed throughout the cell therefore it can be an indicator of possible damages that may occur alongside the cell edge as well as in the area near the nucleus.
Data Availability Statement
The raw data supporting the conclusions of this article will be made available by the authors, without undue reservation.
Author Contributions
LB, MM, FR, EG, VC, and SC. SC and LB conceived the presented work; LB carried out the experiments; SC performed data analysis; FR attended the brainstorming about the biological implications; EO performed the Fluka simulations; VC performed STORM measurements together with SC and LB; MM discussed the results giving contribute to data analysis and to the final version of the manuscript.
Conflict of Interest
The authors declare that the research was conducted in the absence of any commercial or financial relationships that could be construed as a potential conflict of interest.
Funding
Museo Storico della Fisica e Centro Studi e Ricerche Enrico Fermi, Rome, Italy supported this research with a grant. The publication costs of the manuscript have been supported by the Italian Ministry for Education University and Research, PRIN 2017, Grant # 2017T8CMCY.
Acknowledgments
We would like to warmly thank Prof Vincenzo Patera (Università degli Studi di Roma, La Sapienza) and Dr Michela Marafini (Università degli Studi di Roma—La Sapienza and Museo Storico della Fisica e Centro Studi e Ricerche Enrico Fermi) for the Fluka simulations. We would like to thank Prof Francesco Tommasino, Dr. Emanuele Scifoni, and Dr. Enrico Verroi for supporting us over the course of X-ray and protons irradiations at TIFPA—Trento Institute for Fundamental Physic and Applications and Proton Therapy Center—Trento. We would like to thank Prof. Giuseppe Pedrazzi (University of Parma) for their contribution to the statistical analysis.
Supplementary Material
The Supplementary Material for this article can be found online at: https://www.frontiersin.org/articles/10.3389/fphy.2020.579081/full#supplementary-material
References
1. Ohi, R, and Zanic, M. Ahead of the curve: new insights into microtubule dynamics, F1000Res (2016). 5:314. doi:10.12688/f1000research.7439.1
2. Manka, SW, and Moores, CA. Microtubule structure by cryo-EM: snapshots of dynamic instability. Essays Biochem (2018). 62:737–51. doi:10.1042/EBC20180031.
3. Van Steenbergen, V, Boesmans, W, Li, Z, de Coene, Y, Vints, K, Baatsen, P, et al. Molecular understanding of label-free second harmonic imaging of microtubules. Nat Commun (2019). 10:3530. doi:10.1038/s41467-019-11463-8.
4. Alushin, GM, Lander, GC, Kellogg, EH, Zhang, R, Baker, D, and Nogales, E. High-resolution microtubule structures reveal the structural transitions in αβ-tubulin upon GTP hydrolysis. Cell (2014). 157:1117–29. doi:10.1016/j.cell.2014.03.053.
5. Schaedel, L, John, K, Gaillard, J, Nachury, MV, Blanchoin, L, and Théry, M. Microtubules self-repair in response to mechanical stress. Nat Mater (2015). 14:1156–63. doi:10.1038/nmat4396.
6. Karsenti, E, Nédélec, F, and Surrey, T. Modelling microtubule patterns. Nat Cell Biol (2006). 8:1204–11. doi:10.1038/ncb1498.
7. Kabir, AMR, Sada, K, and Kakugo, A. Breaking of buckled microtubules is mediated by kinesins. Biochem Biophys Res Commun (2020). 524:249–54. doi:10.1016/j.bbrc.2020.01.082. CrossRef Full Text |
8. Vorobjev, IA, Svitkina, TM, and Borisy, GG. Cytoplasmic assembly of microtubules in cultured cells. J Cell Sci (1997). 110(Pt 21):2635–45.
9. Waterman-Storer, CM, and Salmon, ED. Actomyosin-based retrograde flow of microtubules in the Lamella of migrating epithelial cells influences microtubule dynamic instability and turnover and is associated with microtubule breakage and treadmilling. J Cell Biol (1997). 139:417–34. doi:10.1083/jcb.139.2.417.
10. Zhang, X, Lin, SH, Fang, B, Gillin, M, Mohan, R, and Chang, JY. Therapy-resistant cancer stem cells have differing sensitivity to photon versus proton beam radiation. J Thorac Oncol (2013). 8:1484–91. doi:10.1097/JTO.0b013e3182a5fdcb.
11. Durante, M. New challenges in high-energy particle radiobiology. Br J Radiol (2014). 87:20130626. doi:10.1259/bjr.20130626.
12. Tommasino, F, and Durante, M. Proton radiobiology. Cancers (2015). 7:353–81. doi:10.3390/cancers7010353.
13. McMahon, SJ. The linear quadratic model: usage, interpretation and challenges. Phys Med Biol (2018). 64:01TR01. doi:10.1088/1361-6560/aaf26a.
14. Paganetti, H. Relative biological effectiveness (RBE) values for proton beam therapy. Variations as a function of biological endpoint, dose, and linear energy transfer. Phys Med Biol (2014). 59:R419–72. doi:10.1088/0031-9155/59/22/R419.
15. Reisz, JA, Bansal, N, Qian, J, Zhao, W, and Furdui, CM. Effects of ionizing radiation on biological molecules-mechanisms of damage and emerging methods of detection. Antioxidants Redox Signal (2014). 21:260–92. doi:10.1089/ars.2013.5489.
16. Niemantsverdriet, M, van Goethem, M-J, Bron, R, Hogewerf, W, Brandenburg, S, Langendijk, JA, et al. High and low LET radiation differentially induce normal tissue damage signals. Int J Radiat Oncol Biol Phys (2012). 83:1291–7. doi:10.1016/j.ijrobp.2011.09.057.
17. Jasińska-Konior, K, Pochylczuk, K, Czajka, E, Michalik, M, Romanowska-Dixon, B, Swakoń, J, et al. Proton beam irradiation inhibits the migration of melanoma cells. PLoS ONE (2017). 12:e0186002. doi:10.1371/journal.pone.0186002.
18. Prise, KM, Schettino, G, Folkard, M, and Held, KD. New insights on cell death from radiation exposure. Lancet Oncol (2005). 6:520–8. doi:10.1016/S1470-2045(05)70246-1.
19. Tommasino, F, Rovituso, M, Bortoli, E, La Tessa, C, Petringa, G, Lorentini, S, et al. A new facility for proton radiobiology at the Trento proton therapy centre: design and implementation. Phys Med (2019). 58:99–106. doi:10.1016/j.ejmp.2019.02.001.
20. Cabriel, C, Bourg, N, Jouchet, P, Dupuis, G, Leterrier, C, Baron, A, et al. Combining 3D single molecule localization strategies for reproducible bioimaging. Nat Commun (2019). 10:1980. doi:10.1038/s41467-019-09901-8.
21. Rasband, WS. ImageJ. Available at: https://imagej.nih.gov/ij/ (2019). 1997–2018.
22. Zhang, Z, Nishimura, Y, and Kanchanawong, P. Extracting microtubule networks from superresolution single-molecule localization microscopy data. MBoC (2017). 28:333–45. doi:10.1091/mbc.e16-06-0421.
23. Vasileva, E, and Citi, S. The role of microtubules in the regulation of epithelial junctions. Tissue Barriers (2018). 6:1539596. doi:10.1080/21688370.2018.1539596.
24. Ando, D, Korabel, N, Huang, KC, and Gopinathan, A. Cytoskeletal network morphology regulates intracellular transport dynamics. Biophys J (2015). 109:1574–82. doi:10.1016/j.bpj.2015.08.034.
25. Bouchet, BP, and Akhmanova, A. Microtubules in 3D cell motility. J Cell Sci (2017). 130:39–50. doi:10.1242/jcs.189431.
26. Wittmann, T, and Waterman-Storer, CM. Cell motility: can Rho GTPases and microtubules point the way?. J Cell Sci (2001). 114:3795–803.
27. Wadsworth, P. Regional regulation of microtubule dynamics in polarized, motile cells. Cell Motil Cytoskeleton (1999). 42:48–59. doi:10.1002/(SICI)1097-0169(1999)42:1<48::AID-CM5>3.0.CO;2-8 |
28. Ballestrem, C, Wehrle-Haller, B, Hinz, B, and Imhof, BA. Actin-dependent lamellipodia formation and microtubule-dependent tail retraction control-directed cell migration. MBoC (2000). 11:2999–3012. doi:10.1091/mbc.11.9.2999.
29. Odde, DJ, Ma, L, Briggs, AH, DeMarco, A, and Kirschner, MW. Microtubule bending and breaking in living fibroblast cells. J Cell Sci (1999). 112(Pt 19):3283–8.
30. Muroyama, A, and Lechler, T. Microtubule organization, dynamics and functions in differentiated cells. Development (2017). 144:3012–21. doi:10.1242/dev.153171.
31. Wu, J, and Akhmanova, A. Microtubule-organizing centers. Annu Rev Cell Dev Biol (2017). 33:51–75. doi:10.1146/annurev-cellbio-100616-060615.
32. VanBuren, V, Cassimeris, L, and Odde, DJ. Mechanochemical model of microtubule structure and self-assembly kinetics. Biophys J (2005). 89:2911–26. doi:10.1529/biophysj.105.060913.
Keywords: microtubules, protons, Hs 578Bst cell line, ionizing radiations, super resolution microscopy
Citation: Bruni L, Manghi M, Gioscio E, Caorsi V, Rizzi FM and Croci S (2020) Ionizing Radiation Effects on Hs 578Bst Microtubules. Front. Phys. 8:579081. doi: 10.3389/fphy.2020.579081
Received: 01 July 2020; Accepted: 17 September 2020;
Published: 16 November 2020.
Edited by:
Marco Durante, GSI Helmholtz Center for Heavy Ion Research, GermanyReviewed by:
Valeria Panzetta, University of Naples Federico II, ItalyFrancesco Tommasino, University of Trento, Italy
Copyright © 2020 Bruni, Manghi, Gioscio, Caorsi, Rizzi and Croci. This is an open-access article distributed under the terms of the Creative Commons Attribution License (CC BY). The use, distribution or reproduction in other forums is permitted, provided the original author(s) and the copyright owner(s) are credited and that the original publication in this journal is cited, in accordance with accepted academic practice. No use, distribution or reproduction is permitted which does not comply with these terms.
*Correspondence: S. Croci, simonetta.croci@unipr.it