Quartz-Tuning-Fork-Enhanced Spectroscopy Based on Fast Fourier Transform Algorithm
 Guangxiang Yang1
  Linguang Xu
- 1Chongqing Engineering Laboratory for Detection, Control and Integrated System, Chongqing Technology and Business University, Chongqing, China
- 2Laser Spectroscopy and Sensing Laboratory, Anhui University, Hefei, China
In this paper, a gas sensing technique based on quartz-crystal-tuning-fork-enhanced spectroscopy (QCTFES) and wavelength modulation spectroscopy (WMS) is reported. To explore the capabilities of this technique, a near-infrared (NIR) diode laser emitting at 1,653 nm and a QCTF-based photoelectric detector are developed for measuring trace methane (CH4). For signal processing, a fast and effective signal analysis method based on the fast Fourier transform (FFT) algorithm is proposed for extracting the absorption intensity signal of the QCTFES-WMS, instead of a lock-in amplifier used for harmonic signal demodulation in traditional QCTF-based detection techniques. Primary laboratory results indicate that an excellent linearity response of CH4 concentration and optical power levels are founded, and a detection limit of 64 ppm is achieved with a 1-s averaging time, which can be further improved to 9 ppm at an optimal integral time of 250 s. Improvements in sensitivity and detectivity can be significantly achieved by using laser sources with higher output power. Compared to traditional WMS technique-based semiconductor photodetectors, the room-temperature QCTF-based WMS shows significant advantages of super-broadband wavelength response, much cheap and tiny.
Introduction
Global warming and climate change are two current key issues to all countries in the world. To better understand the sources and sinks of atmospheric greenhouse gases and other trace gases, real-time and in-site monitoring of their atmospheric concentration change is essential in developing atmospheric models for a scientific understanding of atmospheric chemistry and environmental change [1]. Atmospheric methane (CH4) is a significant greenhouse gas by influencing tropospheric ozone (O3) and stratospheric water vapor (H2O), with a warming impact of 25 times greater than carbon dioxide (CO2), although its average mixing ratio ~1.8 parts per million by volume (ppmv) in earth atmosphere is much lower than CO2 (~460 ppm). Moreover, CH4 is also well-known as an industrial safety hazard, especially in the natural gas and coal mining industry, and a biomarker linked to gut bacteria in clinical medicine [2]. Therefore, various analytical techniques have been developed for methane detection, including chemical method and optical techniques. In comparison, optical detection techniques provide the features of non-invasive, point-of-care quantification of gas concentration without any sample preparation. The main laser-based spectroscopic detection techniques, such as multi-path cell-based tunable diode laser absorption spectroscopy (MPC-TDLAS), high-precision optical cavity spectroscopy [i.e., cavity ring down spectroscopy (CRDS) or cavity-enhanced absorption spectroscopy (CEAS), integrated cavity output spectroscopy (ICOS)], photoacoustic spectroscopy (PAS) or quartz-enhanced photoacoustic spectroscopy (QEPAS), intracavity absorption spectroscopy, and optical frequency comb cavity-enhanced absorption spectroscopy, provide the significant merits of high sensitivity and high selectivity [3].
The spherical CH4 molecule exhibits very complex infrared spectrum features with numerous perturbations to energy levels and band interactions. Four candidate regions near the mid-infrared (MIR) atmospheric windows of ~3.3 μm (v3 band) and ~7.7 μm (v1 band) and two near-infrared (NIR) regions of ~2.3 μm and ~1.65 μm are suitable for methane detection, as shown in Figure 1; the simulated data are taken from the high-resolution atmospheric transmission molecular absorption (HITRAN16) database [4]. The fundamental absorption line transitions in the MIR spectral regions are stronger by two orders of magnitude than those of the first overtone band in the NIR regions. Sensitive CH4 detection has been reported using quantum cascade lasers (QCLs) and interband cascade lasers (ICLs) [5–9]. However, the MIR laser sources and optoelectronic detectors are still costly compared to the devices operating in NIR, typically an infrared mercury cadmium telluride (MCT) detector (VIGO Systems) [10]. Due to the essential factors of semiconductor materials, their wavelength response range is limited, and the detectivity is the inverse proportion to the bandwidth. For this issue, QCTF-based photoelectric detection technology was proposed for mid-infrared gas absorption spectroscopy [11–13]. Unlike the common QEPAS technique (QCTFs as optoacoustic transducers) [14], this technique exploits quartz piezoelectric properties of QCTFs to realize the transformation of the photoelectric signal, which makes the cost-efficient detector suitable for the whole electromagnetic radiation range. Recently, it has been proved to have a photothermal effect due to the photo-thermo-elastic conversion process [15] and was demonstrated with higher sensing capability than traditional TDLAS and QEPAS [16, 17]. Moreover, the QCTF-based detection technique has been successfully demonstrated with significant advantages for standoff photoacoustic spectroscopy [18, 19]. QCTF-based detection techniques are especially attractive for developing portable spectroscopic gas sensors. However, a commercial lock-in amplifier (typical Stanford Model SRS-830 or Zurich Instruments model MFLI) was usually used to extract the amplitude information from the tuning fork signal in all the related works [15–19], which obviously limits a need for developing miniaturized and inexpensive sensors.
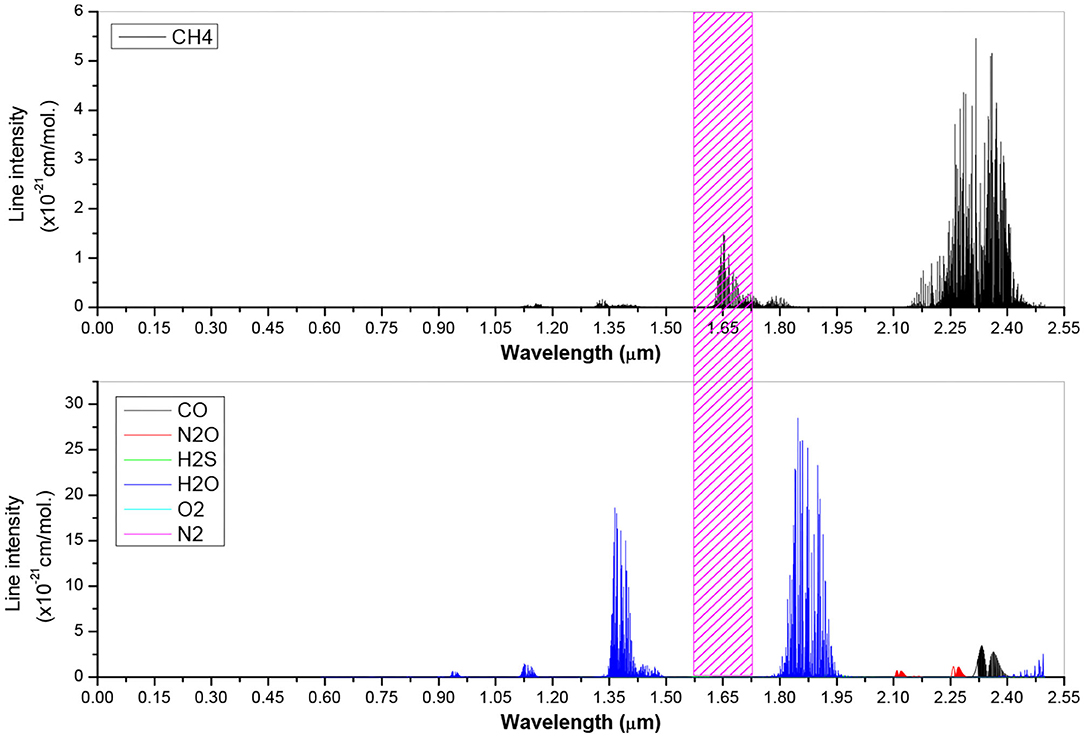
Figure 1. HITRAN-based simulation of methane and other species absorption lines.
In this work, we report a high-sensitivity gas sensing technique based on a DFB diode laser emitting around 1.653 μm and a QCTF-based wavelength modulation spectroscopy (WMS). Unlike the common QEPAS technique, where the laser beam is passed through the gap between the tines of QCTF, in this work, a standard QCTF used a photoelectric detector by utilizing its piezoelectric effect and resonance effect to measure the light intensity signal. Unlike a common WMS technique, a lock-in amplifier is used for harmonic signal demodulation [20]; here, the absorption intensity signal of the QCTF detector is directly extracted by Fast Fourier transform (FFT) algorithm analysis. To demonstrate the applicability for spectroscopic application, the reported QCTF-based WMS technique is employed for trace methane gas detection.
Experimental Details
The experimental platform is designed as shown in Figure 2. Methane (CH4) was selected as the target of interest due to its important effect in the fields of atmospheric environment. In order to cover the strong absorption line of CH4 near 6046.95 cm−1, a near-infrared distributed feedback (DFB) diode laser emitting at 1,653 nm was used as the excitation light source. For gas measurement, a quartz gas absorption cell with 45° wedge windows was used, which is specially designed to avoid etalon effect. A CaF2 mirror was chosen as a gas cell window for the absorption path because of its good transmittance in the whole infrared region and good chemical stability. The gas cell is equipped with a temperature sensor and pressure gauge for recording experimental parameters [21]. Instead of the traditional semiconductor detector, a homemade photoelectric detector based on QCTF was used for measuring the laser signal. After being transmitted from the gas cell, the laser beam was directly focused on the surface of the QCTF tine by an optical lens (CaF2, focal length f =25 cm). When the incident light was modulated or pulsed at the resonant frequency of the QCTF, a periodic driving force induces a mechanical resonance of the tuning fork, which in turn yields a piezoelectric current due to the piezoelectric effect of the quartz material. Since the piezoelectric current generated by the QCTF is very weak, a low-noise preamplifier with a feedback resistor of 10 MΩ was developed to magnify the current signal. For a more detailed description of the QCTF-based photoelectric detector, we refer the reader to [12]. The QCTF detector signal is digitized by a data acquisition card (NI USB-6212) with 16 bits of resolution and finally transferred to a laptop computer and a custom-written LabView-based program for real-time signal processing. The laser wavelength can be coarsely and finely tuned by varying its operating temperatures and injecting currents, respectively, which was controlled by a homemade electronic module. Generally, absorption spectra are obtained by sweeping the laser wavelength over absorption features of CH4 using a low-frequency tuning waveform generated from a LabView function generator. In this study, wavelength modulation spectroscopy (WMS) and a 2nd harmonic detection technique were selected to enhance the detection sensitivity. Therefore, a sinusoidal dither signal was synchronously added to the laser driver to modulate the laser wavelength with the modulation frequency of f 0/2, where f 0 was the QCTF resonance frequency. Instead of the custom digital lock-in amplifier (DLIA) technique, here, the 2nd harmonic (2f ) absorption signal was directly extracted by a self-developed algorithm based on fast Fourier transform (FFT), as shown in Figure 3. Details of comparison for both demodulation methods are made with different CH4 samples, and the calculated signal-to-noise ratio (SNR) are summarized in Table 1. The proposed FFT demodulation algorithm shows better performance than the DLIA technique in terms of calculating efficiency and parameter dependencies, and a SNR enhancement factor between 1.6 and 3.0 is obtained. The results indicate that the lower the SNR of the raw spectral signal, the better the SNR improvement factor.
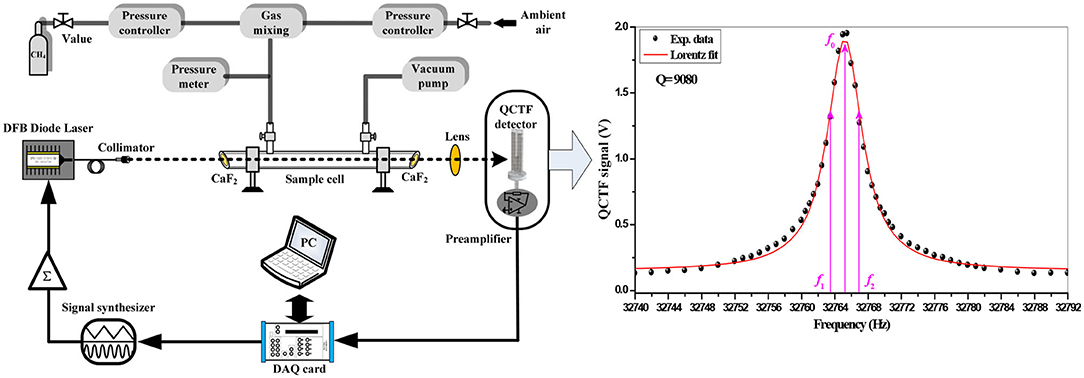
Figure 2. Schematic configuration of the CH4 sensor system.
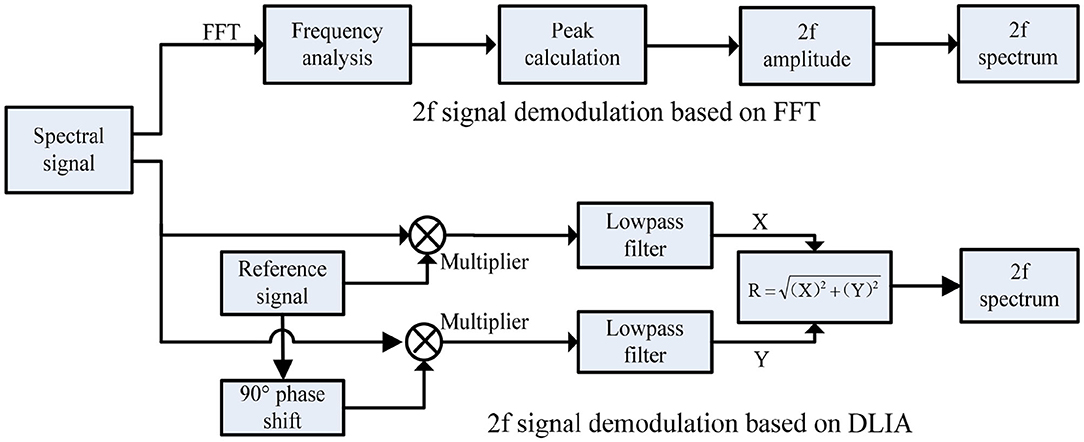
Figure 3. Flowchart of two signal demodulation algorithms.
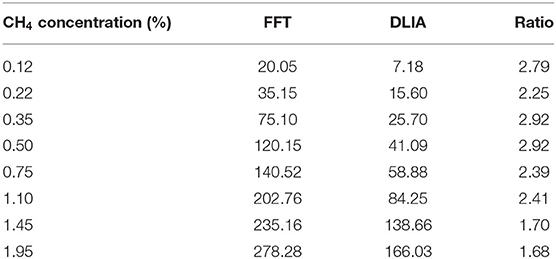
Table 1. Comparison of 2f signals SNR extracted by FFT and DLIA demodulation algorithm.
Results and Discussion
In the case of WMS-2f detection technique, the amplitude of the 2nd harmonic signal shows significant dependence on the laser modulation amplitude. In theory, the 2f signal amplitude is maximized at a modulation index of 2.2, which is defined as the ratio of modulation amplitude and molecular absorption line width, yielding the highest SNR. Therefore, the influence of the laser modulation amplitude on the WMS-2f signal amplitude is first investigated and shown in Figure 4, which was measured with a sample gas pressure fixed at 1 atm. The result shows that the normalized WMS-2f signal amplitudes increases with the increase of the modulation amplitude and then presents a downward trend. The optimal modulation amplitude was experimentally found to be 40 mV for 1.63% CH4.
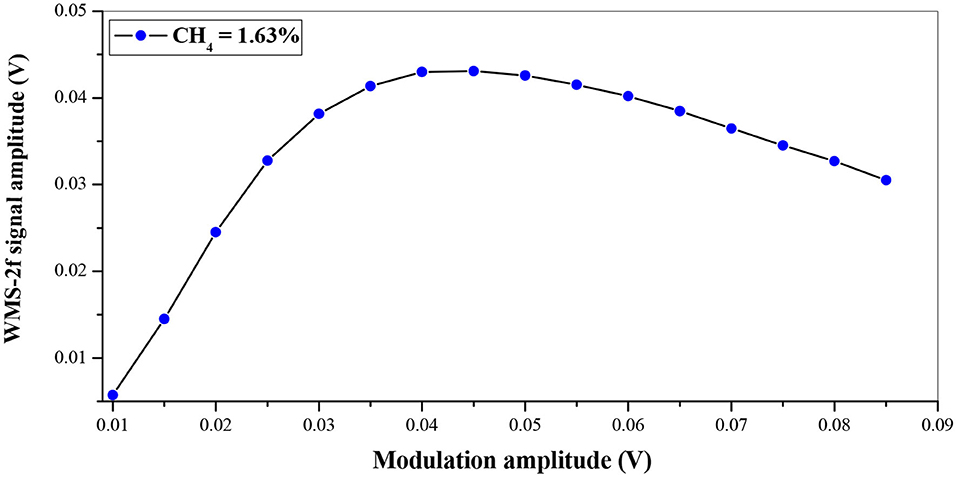
Figure 4. The relationship of the WMS-2f signal amplitude of CH4 and laser modulation amplitude at one atmospheric pressure.
Unlike the calibration-free direction absorption spectroscopy (DAS), the high-sensitivity WMS technique must be calibrated before the actual application to gas detection. For calibrating the gas sensor system, a series of CH4 samples were prepared by dilution of a basic primary standard with high pure N2. For example, the experimentally measured WMS-2f spectra with different CH4 mixing ratios are presented in Figure 5. For clarity, the WMS-2f signal amplitude at the central position was plotted as a function of gas concentration and analyzed by a linear regression algorithm, which is shown in Figure 6. A regression coefficient R2 of 0.999 was obtained; this result indicates that the gas sensor system has a good linearity, which shows a good agreement with the theoretical expectation.
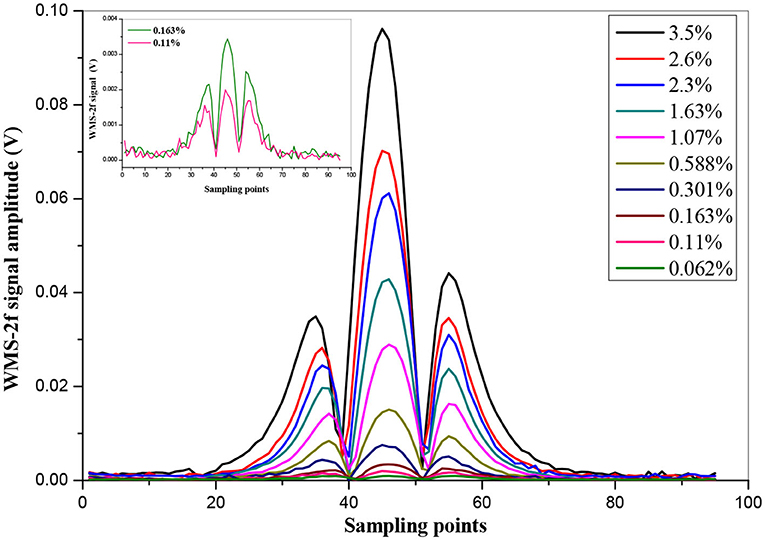
Figure 5. WMS-2f spectra recorded with different CH4 gas concentration.
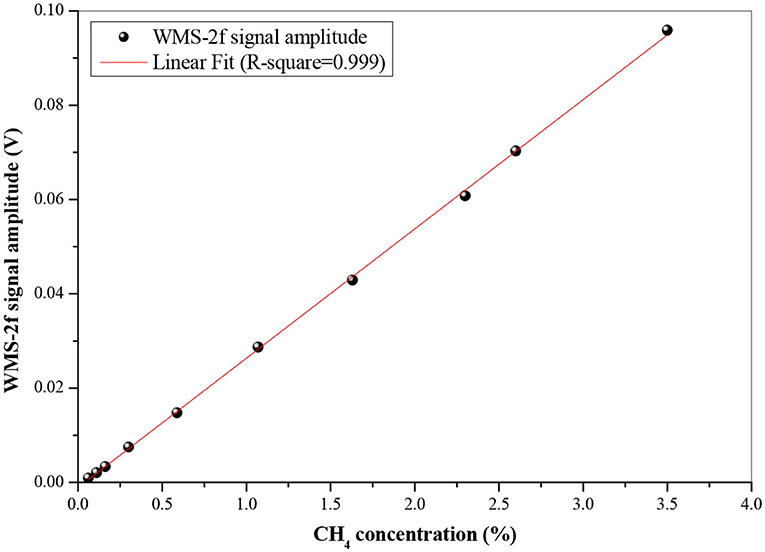
Figure 6. The relationship of CH4 gas concentration and WMS-2f signal amplitudes. The line is the best linear fit.
To evaluate the stability and repeatability of the sensor system, continuous measurement at a constant concentration of 1.63% CH4 was made and analyzed using Allan's variance analysis method. The continuous measurement was operated for several hours. For example, the result (as shown in Figure 7) indicates that a detection limit of ~64 ppm is achieved for a 1-s averaging time, which can be further improved to 9 ppm with increasing average time to 250 s.
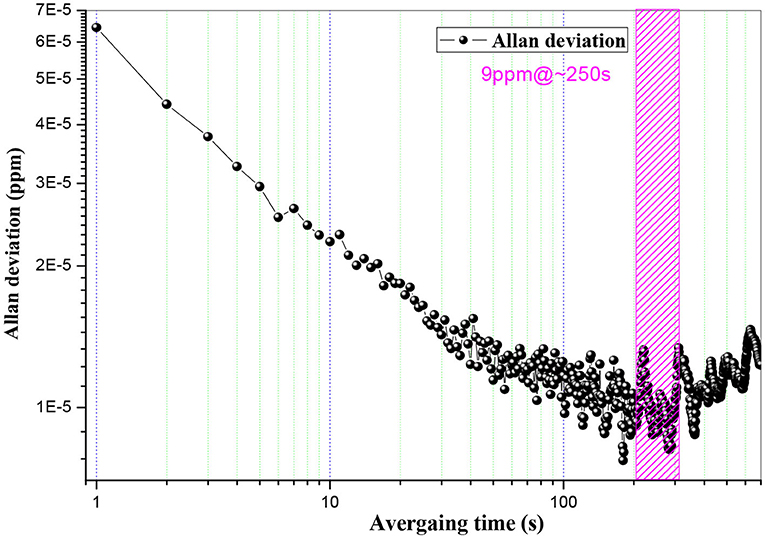
Figure 7. Allan deviation plot as a function of signal average time.
Similar to the photoelectric effect of semiconductor detectors, the QCTF detector is based on the piezoelectric effect and resonance effect. Linear response characteristics of the detector on incident light intensity also need to be calibrated. For this experiment, the relationship between the QCTF signal amplitude and incident laser power was observed. Figure 8 presents the dependence of the QCTF detector response on the incident laser power with a CH4 mixing ratio of 1.63%. A good linearity (R2 = 0.998) between the QCTF detector signal amplitude and the incident laser power was found under the limited experimental conditions. From this result, we can conclude that the sensor sensitivity can be significantly improved by using light sources with higher output power. Moreover, the detectivity of the QCTF detector can be further improved by fabricating it in a vacuum cavity, where the Q factor has the maximum response.
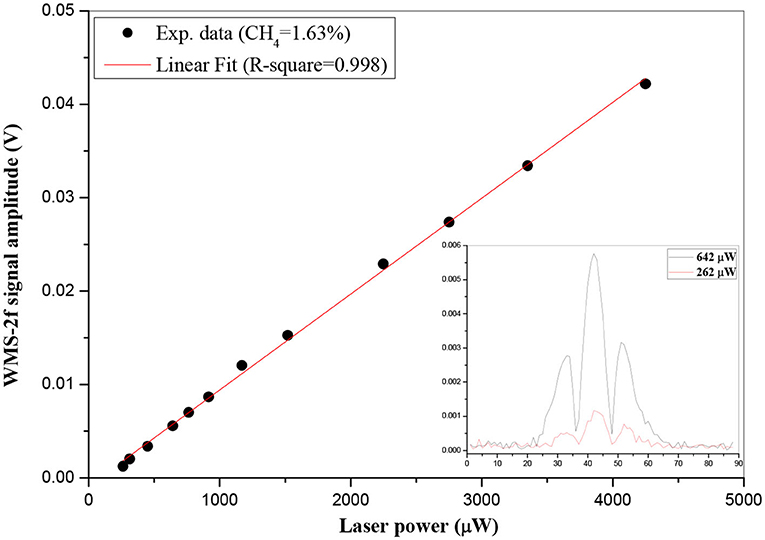
Figure 8. Dependence of the QCTF signal amplitude on the incident laser power.
Conclusion
In this paper, a trace gas sensing technique based on quartz-tuning-fork enhanced wavelength modulation spectroscopy is reported and demonstrated for CH4 gas measurement. For signal processing, a fast and effective signal analysis method based on the FFT algorithm is developed, instead of a lock-in amplifier used for harmonic signal demodulation in traditional QCTF-based detection techniques. The proposed FFT demodulation algorithm shows better performance than the DLIA technique in terms of calculating efficiency and parameter dependencies, and a SNR enhancement factor between 1.6 and 3.0 is obtained. To demonstrate the applicability for spectroscopic application, the reported sensor technique is evaluated for methane gas detection. The results indicate that the QCTF-based WMS gas sensor has an excellent linearity response of the CH4 concentration and the incident laser power. Under limited experimental conditions, a detection limit of 64 ppm is achieved for a 1-s averaging time, which can be further improved to 9 ppm with an averaging time of 250 s.
Improvements in sensitivity and detectivity can be significantly achieved by using light sources with higher output power or enhancing the Q factor of the QCTF in a vacuum environment. Compared to traditional semiconductor photodetectors, the QCFT-based detector shows a significant advantage of ultra-wide spectral response range. Therefore, the gas sensor system can be simply modified for other species measurement by only replacing with new laser sources at other spectral regions, especially for some gas species with near infrared fingerprint absorption features, such as acetylene (C2H2@1520 nm), water vapor (H2O@1392 nm), hydrogen fluoride (HF@1340 nm), ammonia (NH3@1531 nm), oxycarbide (CO@1568 nm and CO2@1432 nm), and hydrogen sulfide (H2S@1576 nm), as summarized in Table 2. Optical fiber coupling characteristics of near infrared DFB diode lasers are preferred as spectroscopic radiation sources, and a W-level output power can be easily realized by combining with an erbium-doped fiber amplifier (EDFA) [22–24]. Furthermore, when compared to the costly MCT detector commonly used in mid-infrared laser spectroscopy, the room-temperature QCFT detector is much cheap and tiny [5, 25–28].
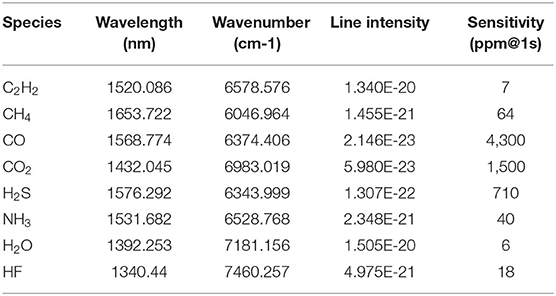
Table 2. Detectable molecule in the near infrared spectral range and the estimated sensitivity.
Data Availability Statement
The original contributions presented in the study are included in the article/supplementary material, further inquiries can be directed to the corresponding author/s.
Author Contributions
GY was responsible for the experimental setup and writing. LX was responsible for the data processing and picture editing of this paper. HL was responsible for the revision of the paper. JL was responsible for the verification of the overall experiment. All the authors made positive contributions to the work.
Funding
This work was partly funded by the financial support from Chongqing Science and Technology Bureau (cstc2019jscx-msxmX0007), the National Natural Science Foundation of China (41875158, 61675005), the National Program on Key Research and Development Project (2016YFC0302202), and the Open Fund of State Key Laboratory of Applied Optics (SKLAO2020001A13).
Conflict of Interest
The authors declare that the research was conducted in the absence of any commercial or financial relationships that could be construed as a potential conflict of interest.
References
1. Thompson AM. The oxidizing capacity of the earth's atmosphere: probable past and future changes. Science. (1992) 256:1157–65. doi: 10.1126/science.256.5060.1157
2. Bayrakli I. Breath analysis using external cavity diode lasers: a review. J Biomed Opt. (2017) 22:40901–15. doi: 10.1117/1.JBO.22.4.040901
3. Zhang L, Tian G, Li J, Yu B. Applications of absorption spectroscopy using quantum cascade lasers. Appl Spectrosc. (2014) 68: 1095–107. doi: 10.1366/14-00001
4. Gordon IE, Rothman LS, Hill C, Kochanov RV, Tan Y, Bernath PF, et al. The HITRAN2016 molecular spectroscopic database. J Quant Spectrosc Radiat Transf. (2017) 203:3–69. doi: 10.1016/j.jqsrt.2017.06.038
5. Ren W, Jiang W, Tittel FK. Single-QCL-based absorption sensor for simultaneous trace-gas detection of CH4 and N2O. Appl Phys B. (2014) 117:245–51. doi: 10.1007/s00340-014-5828-8
6. Wang Q, Wang Z, Ren W. Wavelength-stabilization-based photoacoustic spectroscopy for methane detection. Meas Sci Technol. (2017) 28:aa6a08. doi: 10.1088/1361-6501/aa6a08
7. Dong L, Li C, Sanchez NP, Gluszek AK, Griffin RJ, Tittel FK. Compact CH4 sensor system based on a continuous-wave, low power consumption, room temperature interband cascade laser. Appl Phys Lett. (2016) 108:011106. doi: 10.1063/1.4939452
8. Ye W, Li C, Zheng C, Sanchez NP, Gluszek AK, Hudzikowski AJ, et al. Mid-infrared dual-gas sensor for simultaneous detection of methane and ethane using a single continuous-wave interband cascade laser. Opt Express. (2016) 24:16973–85. doi: 10.1364/OE.24.016973
9. Chen C, Newcomb RW, Wang Y. A trace methane gas sensor using mid-infrared quantum cascaded laser at 7.5 μm. Appl Phys B. (2013) 113:491–501. doi: 10.1007/s00340-013-5473-7
11. Sun J, Deng H, Liu N, Wang H, Yu B, Li J. Mid-infrared gas absorption sensor based on a broadband external cavity quantum cascade laser. Rev Sci Instrum. (2016) 87:123101–6. doi: 10.1063/1.4968041
12. Ding J, He T, Zhou S, Zhang L, Li J. Quartz tuning fork-based photodetector for mid-infrared laser spectroscopy. Appl Phys B. (2018) 124:78–9. doi: 10.1007/s00340-018-6950-9
13. Li J, Liu N, Ding J, Zhou S, He T, Zhang L. Piezoelectric effect-based detector for spectroscopic application. Opt Lasers Eng. (2019) 115:141–8. doi: 10.1016/j.optlaseng.2018.11.020
14. Liu K, Li J, Wang L, Tan T, Zhang W, Gao X, et al. Trace gas sensor based on quartz tuning fork enhanced laser photoacoustic spectroscopy. Appl Phys B. (2009) 94:527–33. doi: 10.1007/s00340-008-3233-x
15. Ma Y, He Y, Tong Y, Yu X, Tittel FK. Quartz-tuning-fork enhanced photothermal spectroscopy for ultra-high sensitive trace gas detection. Opt Express. (2018) 26:32103–10. doi: 10.1364/OE.26.032103
16. He Y, Ma Y, Tong Y, Yu X, Tittel FK. Ultra-high sensitive light-induced thermoelastic spectroscopy sensor with a high Q-factor quartz tuning fork and a multipass cell. Opt Lett. (2019) 44:1904–7. doi: 10.1364/OL.44.001904
17. Zhang Q, Chang J, Cong Z, Wang Z. Quartz tuning fork enhanced photothermal spectroscopy gas detection system with a novel QTF-self-difference technique. Sensor Actuator A. (2019) 299:111629. doi: 10.1016/j.sna.2019.111629
18. Van Neste CW, Senesac LR, Thundat T. Standoff photoacoustic spectroscopy. Appl Phys Lett. (2008) 92:234102. doi: 10.1063/1.2945288
19. Sharma RC, Kumar D, Bhardwaj N, Maini AK. Quartz enhanced laser photoacoustic sensors for remote sensing. Curr Sci. (2013) 104:1548–51.
20. Liu K, Wang L, Tan T, Wang G, Zhang W, Chen W, et al. Highly sensitive detection of methane by near-infrared laser absorption spectroscopy using a compact dense-pattern multipass cell. Sens Actuators B Chem. (2015) 220:1000–5. doi: 10.1016/j.snb.2015.05.136
21. Yang G, Wen Y. A Controllable DCCS-Based PT temperature sensor in high precision molecular spectroscopy application. IEEE Access. (2020) 8:42519–28. doi: 10.1109/ACCESS.2020.2977163
22. Engelbrecht RA. Compact NIR fiber-optic diode laser spectrometer for CO and CO2. Spectrochim Acta A. (2004) 60:3291–8. doi: 10.1016/j.saa.2003.11.033
23. Chen K, Zhang B, Liu S, Yu Q. Parts-per-billion-level detection of hydrogen sulfide based on near-infrared all-optical photoacoustic spectroscopy. Sens Actuators B Chem. (2019) 283:1–5. doi: 10.1016/j.snb.2018.11.163
24. Wu H, Dong L, Zheng H, Liu X, Yin X, Ma W, et al. Enhanced near-infrared QEPAS sensor for sub-ppm level H2S detection by means of a fiber amplified 1582 nm DFB laser. Sens Actuators B. (2015) 221:666–72. doi: 10.1016/j.snb.2015.06.049
25. Wu H, Dong L, Liu X, Zheng H, Yin X, Ma W, et al. Fiber-Amplifier-Enhanced QEPAS sensor for simultaneous trace gas detection of NH3 and H2S, Sensors. (2015) 15:26743–55. doi: 10.3390/s151026743
26. Tao L, Sun K, Khan MA, Miller D J, Zondlo MA. Compact and portable open-path sensor for simultaneous measurements of atmospheric N2O and CO using a quantum cascade laser. Opt Express. (2012) 20:28106–18. doi: 10.1364/OE.20.028106
27. Li J, Parchatka U, Fischer H. Development of field-deployable real time QCL spectrometer for simultaneous detection of ambient N2O and CO. Sens Actuators B Chem. (2013) 182:659–67. doi: 10.1016/j.snb.2013.03.073
Keywords: laser spectroscopy, QCTFES, FFT, WMS, Trace gas detection
Citation: Yang G, Xu L, Liang H and Li J (2020) Quartz-Tuning-Fork-Enhanced Spectroscopy Based on Fast Fourier Transform Algorithm. Front. Phys. 8:582503. doi: 10.3389/fphy.2020.582503
Received: 12 July 2020; Accepted: 22 September 2020;
Published: 30 October 2020.
Edited by:
Wei Ren, The Chinese University of Hong Kong, ChinaReviewed by:
Jianming Wen, Kennesaw State University, United StatesHongpeng Wu, Shanxi University, China
Copyright © 2020 Yang, Xu, Liang and Li. This is an open-access article distributed under the terms of the Creative Commons Attribution License (CC BY). The use, distribution or reproduction in other forums is permitted, provided the original author(s) and the copyright owner(s) are credited and that the original publication in this journal is cited, in accordance with accepted academic practice. No use, distribution or reproduction is permitted which does not comply with these terms.
*Correspondence: Jingsong Li, ljs0625@126.com