CryptoKitties Transaction Network Analysis: The Rise and Fall of the First Blockchain Game Mania
 Xin-Jian Jiang
 Xiao Fan Liu
- 1School of Computer Science and Engineering, Southeast University, Nanjing, China
- 2Web Mining Laboratory, Department of Media and Communication, City University of Hong Kong, Hong Kong, China
CryptoKitties was the first widely recognized blockchain game. Players could own, breed, and trade kitties, which are the only prop in the game. The game gained explosive growth upon its release but quickly collapsed in a short time. This study analyzes its entire player activity history for the first time in literature and tries to find the reasons for the rise and fall of this first blockchain game mania. First, we extracted the five million transaction records among 100 thousand addresses involved in CryptoKitties in the past three years. Based on the numbers of addresses involved in the game each day, we divide the game progress into four stages: the primer, the rise, the fall, and the serenity. We construct a temporal kitty ownership transfer network and analyze the varying network parameters in the four stages. We find that a large number of players poured in during the 10th and 18th days since the game release and quickly exited in the following month. Since then, a few big players have gradually dominated the game, concentrating the game resources. Through further analysis, we find that the main reason for the rapid increase in the game popularity was the increase of public attention by media outlets, while the reasons for the rapid decline in the game popularity include the oversupply of kitties, the decreasing of player income, a widening gap between the rich and poor players, and the limitations of blockchain systems. Based on these observations, we advise on the further blockchain game design: (1) to finely control the production of props and avoid an oversupply, (2) to balance the gaming cost and revenue and protect the enjoyment of players, (3) to narrow down the gap between rich and poor and create an equal gaming community, (4) to consider the limitations of blockchain systems in their game designs.
1 Introduction
Blockchain, emerged as the underlying supporting technology for Bitcoin [1], is a distributed ledger system providing non-tampering and traceability functionalities. Ethereum [2], also known as the blockchain 2.0 platform, further adds supports for smart contracts, which are programs that can be stored and executed on the blockchain system [3]. Developers can use smart contracts to create various decentralized applications, especially games.
Blockchain games are considered to have unique advantages over traditional online games in that their gaming data and logic are transparently stored and executed on blockchains [4]. These advantages particularly suit games with in-game payment and chance mechanisms, e.g., gambling, which often suffered from trust issues in traditional online environment. As a result, current designs of blockchain games mainly revolve around the generation, ownership, and trading of virtual assets [5].
Cryptokitties is a blockchain game released on Ethereum in late November 2017. Players can own, trade, and create virtual kitties, represented by non-fungible tokens meeting the ERC-721 token standard in the game. The attributes and transactions of kitties are recorded in the Ethereum blockchain. Once released, CryptoKitties soon gained massive popularity that its transactions accounted for more than 10% of the entire Ethereum traffic in early December 2017 [6].
Nonetheless, Min et al. [4] claimed that most of the current blockchain games lack playability. Possible reasons include that current blockchain platforms restrict developers from implementing complex game functions, current developers are paying insufficient attention to the players’ gaming experience, and lack a competitive market in the blockchain game industry. Not surprisingly, the popularity of CryptoKitties only lasted for a short period, too.
In this study, we aim to fully unveil the collective user behaviors in the game and the reasons leading to the game’s rapid rise and fall by analyzing blockchain transaction records. Specifically, we first construct a kitty ownership transfer network and investigate the network structural changes over time. Then, we conjecture and verify the possible reasons for the rapid changes in gaming popularity from four perspectives: the supply and demand of kitties, the profitability in the game, the inequality of players’ wealth, and the limitations of blockchain systems. Based on our observations, we pinpoint the deficiencies in the design of CryptoKitties and provide suggestions for further development of blockchain games.
Network analysis methods have been applied to cryptocurrency transaction records in many previous works. Chen et al. [7] constructed three graphs with ether transfer, contract creation, and contract invocation, found a power-law degree distribution, and revealed anomalies in these graphs. Somin et al. [8] also found a power-law degree distribution in the ERC20 token transfer network. Guo et al. [9] further revealed a bow-tie structure in the Ethereum transaction network. Except for the Ethereum blockchain, similar methods have also been used to analyze transactions on other blockchains, such as EOSIO [10].
The rest of this paper is organized as follows. CryptoKitties’ gaming rules are introduced in Section 2. In Section 3, we construct the kitty ownership transfer network and define network structural properties. In Section 4, we divide the progress of the game into four stages and examine the changes of network parameters in different stages. We will discuss the reasons for the rapid change in the popularity of CryptoKitties in Section 5. Section 6 concludes the study and provides suggestions for the further development of blockchain games.
2 Gaming Rules
As shown in Table 1, the CryptoKitties game has five smart contracts: the Core contract, GeneScience contract, Offers contract, SalesAuction contract, and SiringAuction contract. The names of these contracts could be found on Etherscan [11]. Based on these contracts, players can trade or transfer kitties with other players and breed new kitties.
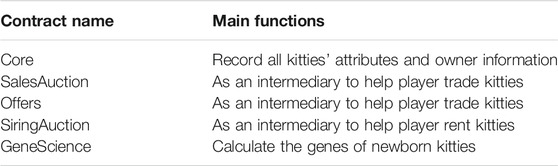
TABLE 1. CryptoKitties’s smart contracts.
There are three ways to trade or transfer a kitty. (1) Using the SalesAuction contract. The seller lists a kitty for sale with an initial price, a final price, and a price change period to the SalesAuction contract. The initial price is usually higher than the final price. After the auction begins, the kitty price will change linearly from the initial price to the final price at a constant rate during the price change period. The price will not change after this period. Unless bid by a buyer or canceled by the seller, the kitty will remain in the SalesAuction contract. Upon receiving a bid, the SalesAuction contract will send the kitty to the buyer and transfer the payment to the seller. The game publisher also sells 0-generation kitties to players in this way. (2) Using the Core contract. A player can either call the transfer function to transfer his kitty to another player or the approve function to allow other players to transfer his kitty. Authorized players can call transfer from function to transfer other players’ kitties. Transferring a kitty in this way does not necessarily mean that the player is trading the kitty but can also be sending a kitty as a gift to a friend. (3) Using the Offers contract. In this way, the buyer initiates a request to the seller and sends the purchase fee to the Offers contract. If the seller accepts the request, the Offers contract will transfer the kitty to the buyer’s address and send the purchase fee to the seller.
When trading kitties through the SalesAuction, the game publisher charges the sellers for 3.75% of the dealing price as a handling fee. Same rate of dealing price will be charged to the buyers using the Offers contracts. When calling any function in each contract, the players also need to pay gas fees to Ethereum miners through their Ethereum wallet. The gas fee is usually between 0.0001eth and 0.01eth.
There are two ways to breed a new kitty. (1) A player selects two of his own kitties as parameters and call the breed With Auto function in the Core contract with a breeding fee. After this operation, the mother kitties (can be arbitrarily chosen between the two) will become pregnant for a period. After this period, a player, also called the midwife, will call the give birth function in the Core contract to give birth to the new kitty. The newborn kitty will be transferred to the owner of the mother kitty. The breeding fee will be compensated to the midwife for their Ethereum gas fees paid. (2) A player breeds with one of his own kitties and another rented from the Siring Auction contract, which lists a number of kitties owned by the lenders. A midwife is also needed in this case. When a kitty is rented out through the Siring Auction contract, the game publisher will charge the lender 3.75% of the rent as a handling fee.
The breeding fee varied over time (see Figure 1). It was set to 0.002eth at the game’s release. However, due to the congestion of the Ethereum network resulting from the gaming transactions, the gas fee was raised. The game publisher increased the breeding fee to 0.015eth and later adjusted it to 0.008eth. Such adjustment happened several times afterward, but despite that, the breeding fee has been stable at 0.008eth.
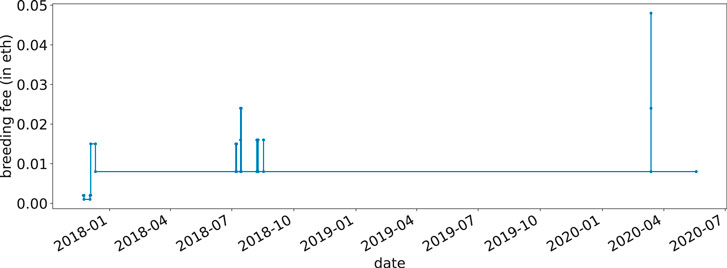
FIGURE 1. Changes of the breeding fee.
3 Data and Methods
3.1 Blockchain Transactions
We synchronized an Ethereum parity client in full mode and used the eth_getLogs method to extract the transactions in CryptoKitties. The transactions span from November 23, 2017, to May 19, 2020. The data involved 1,923,901 kitties, 104,517 addresses, and 5,173,521 transfer records. There are nine types of transactions (see Table 2) related to the movements of kitties, including the trading, transferring, and the new birth of kitties. Consider participation rate as the ratio of the number of addresses that take part in a specific activity to the number of all addresses in CryptoKitties, buying kitties through the SalesAuction contract has the highest participation rate (84.6%), indicating that most players would buy at least one kitty from the official marketplace. Participation rates are also high for breeding kitty (64.9%) and selling kitty through the SalesAuction contract (51.8%). Players showed low interest in lending (38.1%) and renting kitties (26.6%). Only a very small number of players (less than 1%) traded kitties through the Offers contract.
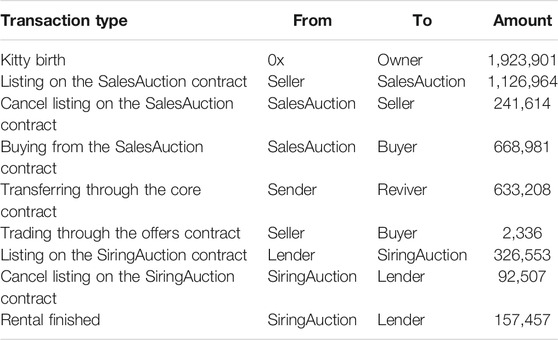
TABLE 2. Nine types of transactions related to the movements of kitties.
3.2 Constructing Ownership Transfer Network of Kitties
The actual ownership of the kitties only changes when (1) the sales auction on the SalesAuction contract is fulfilled, (2) the trading through the Offers contract is fulfilled, and (3) kitties are transferred directly using functions in the Core contract. Therefore, We construct the kitty ownership transfer network
3.3 Network Structural Properties
We use the average degree, non-zero in-/out-degree ratio, Gini coefficient of in-, out-, and total degrees, average clustering coefficient, density, reciprocity, and assortativity to describe the structural properties of the network.
The average degree
The non-zero in-/out-degree ratio
The Gini coefficient
where
The average clustering coefficient c is used to measure the clustering degree of the network, which is defined as
where
Network density
The reciprocity
The degree assortativity coefficient r measures the similarity of connections in the network with respect to the node degree:
where
4 Collective Behaviors of CryptoKitties Players
4.1 The Four Stages of Game Progress
Using the numbers of daily addresses related to CryptoKitties transactions, the game can be divided into four stages: the primer, the rise, the fall, and the serenity, as shown in Figure 2.
1. The primer: The game was released on November 23, 2017. There were not many players before December 2, 2017.
2. The rise: A large number of players entered the game since December 2, 2017. The game popularity rapidly increased before reaching a peak on December 10.
3. The fall: Since then, the popularity has dropped sharply. At the beginning of 2018, the game’s popularity is less than 10% of its peak.
4. The serenity: After January 15, 2018, the popularity stabilized into a long-term slow downward trend. Figure 3 shows four snapshots of the network in each of the stages. The network size shrinks apparently over time.
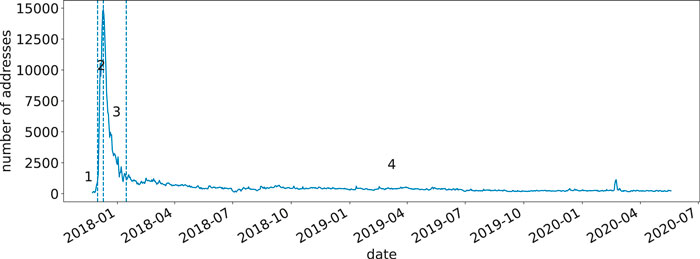
FIGURE 2. Four stages of the game. The three dotted lines correspond to December 1, 2017, December 10, 2017, and January 15, 2018, respectively.
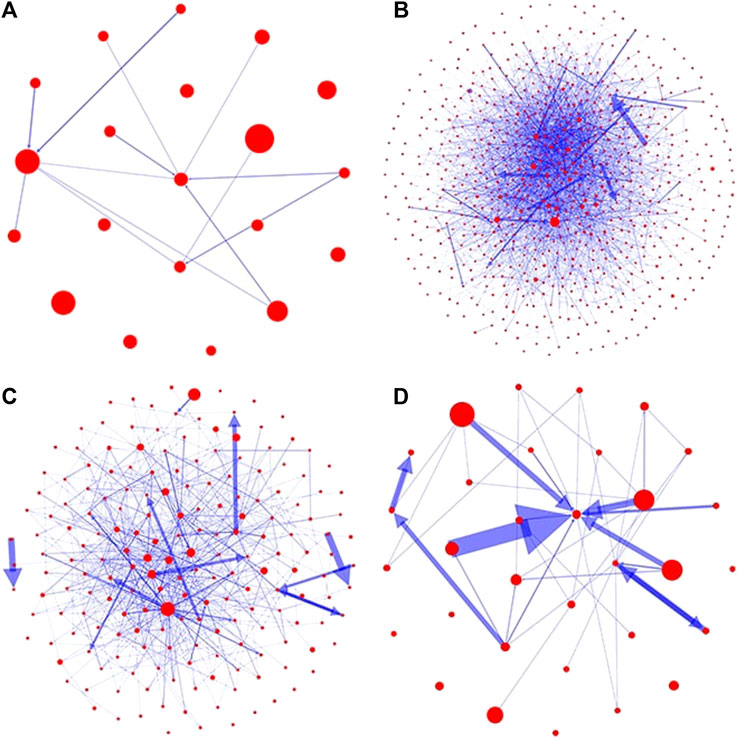
FIGURE 3. Visualizations of typical networks in every stage. Nodes in the network are filtered by out-degree. (A) There aren’t many early players in stage 1. (B) The network contains a large number of nodes in stage 2. (C) The network shrinks in stage 3. (D) Only long-term players are left in stage 4.
4.2 Evolution of the Network Structure
The evolution of network structural properties in the four stages are shown in Figure 4. In the first stage, the Gini coefficient of out-degrees decreased suddenly. This is because almost all 0-generation kitties were transferred from the game publisher’s addresses to the players in the first few days. Soon after that, players began to breed new kitties and sell them to each other. The decreases in average degree, network density, and average clustering coefficient result from early players entering the game and expanding the network. Meanwhile, the assortativity coefficient stayed negative because low-degree players tended to trade with high-degree players, who are the game publisher.
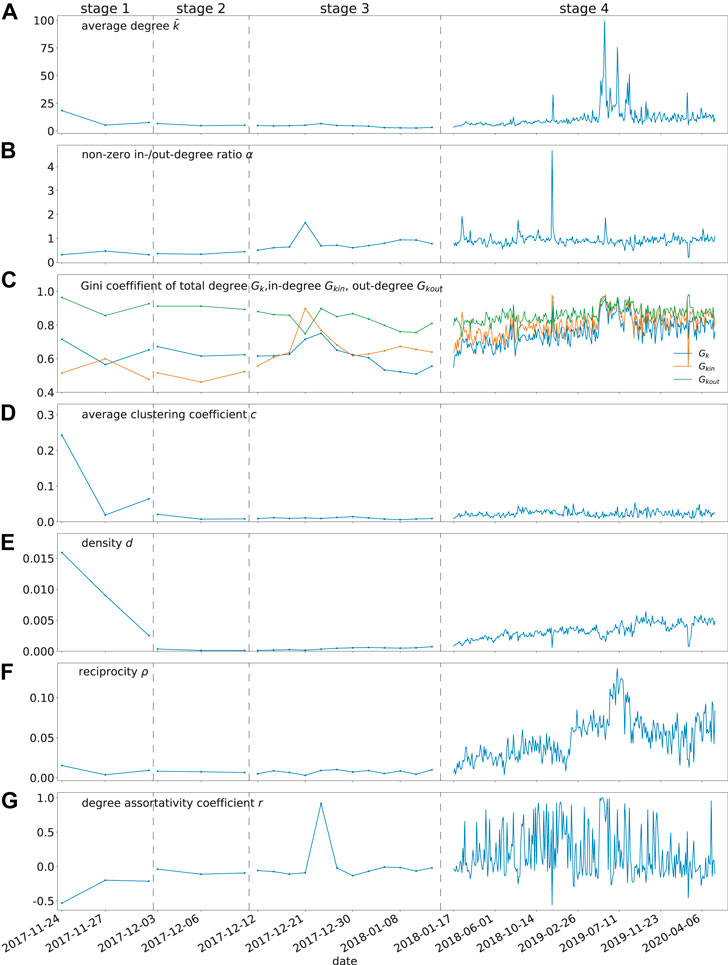
FIGURE 4. Evolution of the network structural properties over time. (A) The average degree, (B) the non-zero in-/out-degree ratio, (C) the Gini coefficients of in-, out-, and total degrees, (D) the average clustering coefficient, (E) network density, (F) reciprocity, and (G) assortativity. Dotted lines separates the four stages. The labels on the x-axis represent the middle date of time windows. The x-axis are re-scaled to better illustrate the parameter dynamics in stages 1, 2 and 3.
In the second stage, the network density stayed low due to the large number of players entering the game. The degree assortativity coefficient increased to zero, meaning that low-activity players tended to transfer kitties among themselves rather than trading with high-activity players.
In the third stage, the non-zero in-/out-degree ratio maintained an upward trend, indicating that the ratio of sellers to buyers was increasing, and market competition was intensifying. The Gini coefficient of out-degrees decreased gently, indicating that even the seller/buyer ratio increased, the gap between sales volume among sellers was narrowing. However, in-degrees’ Gini coefficient went up suddenly. The anomalous data point around December 23, 2017, was caused by an exceptionally large number of transactions made by a handful of addresses.
In the fourth stage, the increasing average degree and reciprocity indicate that the players left in the games were actively trading with each other. The Gini coefficients all maintained an upward trend, indicating a large gap forming in these players: some big players were gradually dominating the game.
Note that the average degree, Gini coefficients, and reciprocity suddenly increased in June 2019. We found that they were caused by the launch of Wrapped Cryptokitties (WCK), which is an ERC-20 token contract, enabling players to exchange unwanted ERC-721 kitties for WCK and use WCK to exchange other kitties. The replacement of a large number of ERC-721 kitties with WCK resulted in a sudden fluctuation in the network structure.
4.3 Changes in the Kitty Ownership Transferring Methods
There are three ways to transfer the ownership of kitties: through the SalesAuction, Offers, or Core contracts. The changes in the proportions of the three methods over time are shown in Figure 5. In the early days of the game, the ownership transfer of kitties was mainly realized through the SalesAuction contract. Later, the proportion of transferring kitties with the method in Core contract gradually increased. After April 2019, this method had become the main way of transferring kitty ownerships. The number of kitties transferred through the Offers contract was always small.
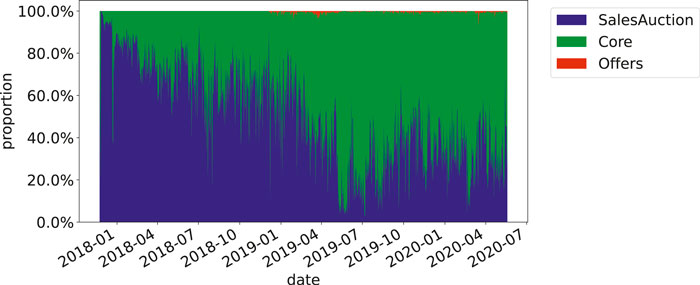
FIGURE 5. The change in proportion of three methods to transfer the kitties.
Cost was the main reason for this change. Players tend to transfer kitties at a lower cost. When buying and selling kitties through the SalesAuction and Offers contracts, players need to pay a transaction fee to the game publisher, usually 3.75% of the transaction amount. Using the transfer method in the Core contract, in contrast, only requires a gas fee payment. Therefore, some third-party trading platforms emerged to help players trade kitties, charging fewer transaction fees. For example, the transaction fee charged by the OpenSea trading platform is only 2.5%.
5 Reasons for the Rise and Fall of CryptoKitties
5.1 Reasons for the Explosive Growth of Game Popularity
On December 2, 2017, the kitty with ID 1 was sold for 247eth, i.e., more than US $100,000 [12]. This message spread quickly on the Internet, generating a large amount of attentions. Figure 6 shows the Google trend index of CryptoKitties and number of daily addresses related to CryptoKitties transactions. Kitties traded at extremely high prices will undoubtedly attract media attention and bring many new players to the game. The increased attention from Internet users eventually led to the explosive growth of the game’s popularity. We cannot rule out the possibility that the game publisher deliberately made the news that a special kitty has being sold at an extremely high price. In fact, almost all transactions with an amount greater than 100eth occurred in early December 2017, which corresponds precisely to the rise stage of the game. Nonetheless, despite of the cause, media exposure had indeed increased the game popularity significantly.
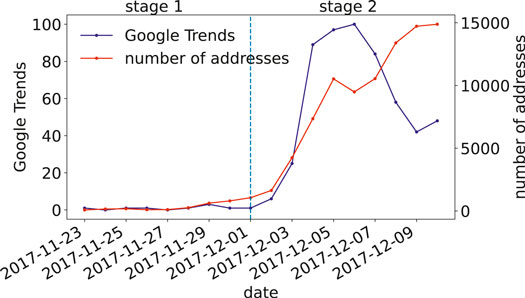
FIGURE 6. Google Trends of CryptoKitties and the numbers of daily active addresses.
Cryptocurrencies, such as Bitcoin, show a positive correlation between their prices and the sizes of the user groups [13–15]. The kitties in the game are ERC-721 token, and therefore, the same rule applies. On the one hand, the expansion of the player community has increased the demand for kitty tokens and promoted the rise of kitty price. On the other hand, the increase in kitty price attracted more players to join the community. Eventually, the entry of a large number of players into the game has led to a surge in demand for kitties, hence the kitty price (see Figure 7). The mean price of kitties in each day is significantly higher than the median price because a small number of kitties were sold at significantly higher prices than average.
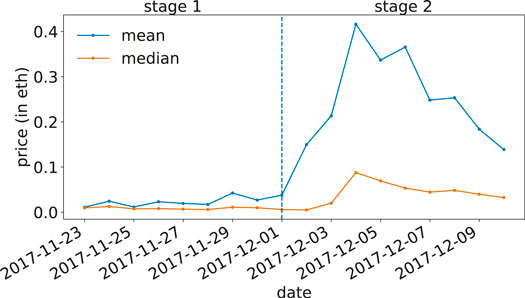
FIGURE 7. Mean and median prices of the kitties sold in each day.
5.2 Reasons for the Rapid Fading of Game Popularity
The rapid growth of game popularity only lasted less than ten days. Since then, the number of players has dropped sharply. Lee et al. [16] noted that users’ playing behaviors in CryptoKitties are affected by speculative and enjoyable factors. Here, we propose four specific reasons that could account for the rapid decline in game popularity: the out-of-balance of the supply and demand of kitties; the loss of profit in kitty trading; the increasing gap between the rich and poor players, and the limitations of blockchain systems.
5.2.1 The out of Supply and Demand Balance
The large number of players poured in during the explosive growth stage bred a large number of kitties in a very short time. Since December 4, 2017, the number of new kitty listings has significantly exceeded the number of kitties sold every day, resulting in a rapid increase in the number of kitties left on sale, i.e., stock inventory (see Figure 8A). The kitty market has become a buyer’s market, and the competition has intensified. The ratio of a successful sale for kitties listed on each day also decreased (see Figure 8B), and the turnover time, i.e., the average time interval between kitty listing and trade closing becomes longer (see Figure 8C).
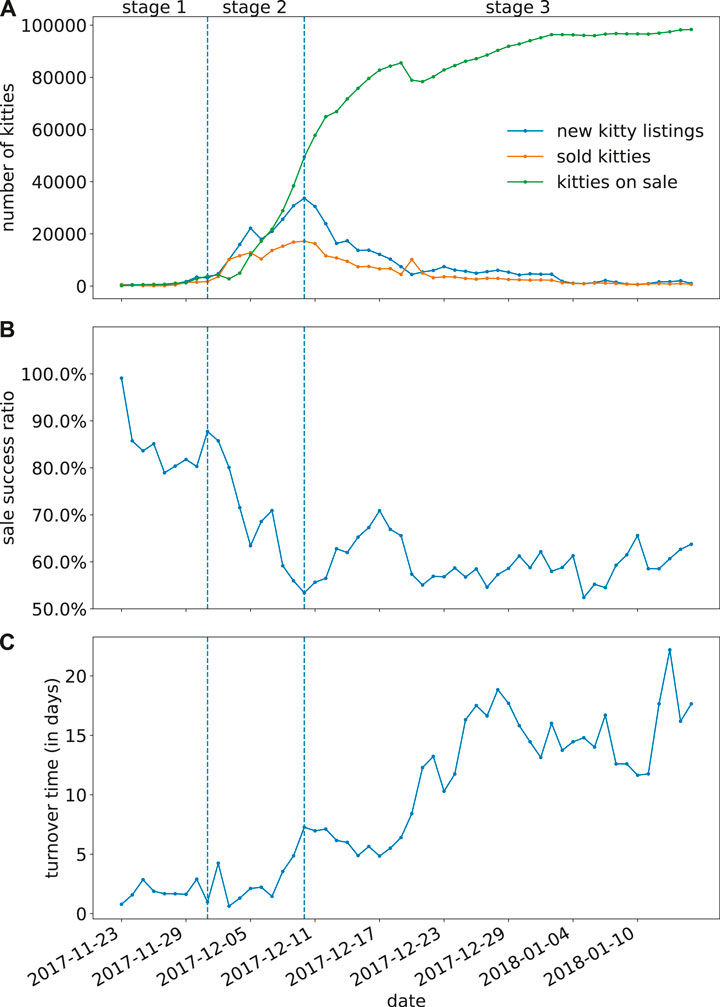
FIGURE 8. The supply and demand of kitties in the market. (A) The numbers of new kitty listings, kitties sold, and kitties on sale in the market every day. (B) The ratio of successful sale for kitties listed on each day. (C) Turnover time, i.e., the average time interval between kitty listing and trade closing for kitties listed on each day. Dotted lines separates the stage 1, 2 and 3.
5.2.2 The Loss of Profit in Kitty Trading
Buchholz et al. [17] pointed out that the value of cryptocurrencies has no benchmark but purely depend on the supply and demand in the market. As the supply of kitties significantly overwhelmed the demand, the price of kitties dropped significantly. Profit is an important motivation to encourage the players to stay in the game. If their revenue from selling kitties becomes lower than the costs, the players’ enthusiasm will decline or even disappear.
Teoretically, suppose a player uses two of his own kitties to breed a new kitty and sell it at the median kitty price (excluding the 0-generation kitties) through the SalesAuction contract on the same day. The average cost of breeding and selling a kitty in one day can be written as
where
where
Figure 9A shows that the cost break-down for breeding and selling increased sharply in stage 2. Among all the costs, the breeding fee is the highest, followed by the miner’s fee for the selling operation, and the miner’s fee for the breeding operation is the lowest. Figure 9B shows that starting from December 13, 2017, the average profit for a player to breed and sell a kitty became negative, indicating that the player may lose money when playing the game.
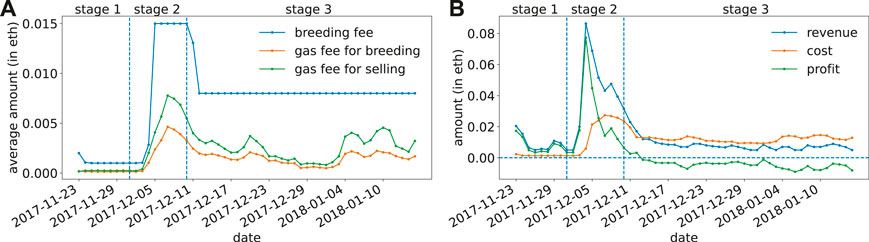
FIGURE 9. The loss of profit in kitty sales. (A) The average breeding fee, gas fee for breeding, and gas fee for selling a kitty through SalesAuction contract on each day. (B) The revenue (median price of kitties), cost, and profit for breeding and selling a kitty on each day. Dotted lines separates the stage 1, 2 and 3.
The actual in-game breeding and sale may not happen on the same day. For every kitty sold, the seller’s actual profit can be evaluated by the difference between the breeding or acquisition cost and selling revenue. Here, we also estimate the actual profit of kitties sold each day. For the kitty sold for the first time, the seller’s profit can be written as
where v is the price at which the kitty is sold,
where
Figure 10 shows the probability of generating a positive profit by selling kitties each day. After December 6, 2017, this probability for kitty resales became less than 50%. After December 13, 2017, this probability for selling self-bred kitties became less than 50%. Whether the player sells kitties bred by self or previously purchased, there is a great chance of losing money.
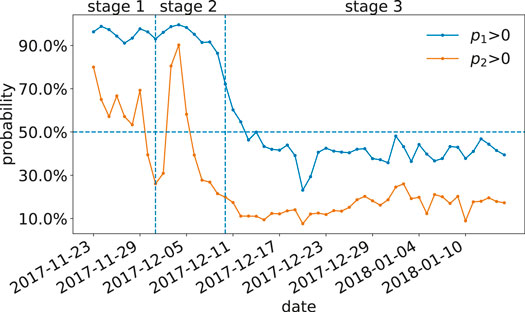
FIGURE 10. The probability of generating positive profit in selling a kitty each day. Dotted lines separates the stage 1, 2 and 3.
5.2.3 The Increasing Gap Between the Rich and Poor
Players receive revenue from selling and lending kitties. In the first stage of the game, the Gini coefficient of daily revenue from selling and leasing increased significantly (see Figure 11A), and that of the cumulative revenue for all the addresses also increased significantly (see Figure 11B). After entering the third stage, although the Gini coefficient of the revenue earned by players from selling and renting fluctuated, they all remained at a relatively high level (greater than 0.6). The Gini coefficient of accumulated revenue stayed at a high level (greater than 0.8). Since 0-generation kitties were mainly sold by game publisher, these sales were not considered when counting the revenue of players. Our results show that the gap between the rich and poor in the game expanded. A few players earned most of the money from the game, while most can only get very little income, if any. The increasing gap in the revenue has caused most players’ gaming experience to deteriorate, and they gradually withdrew from the game.
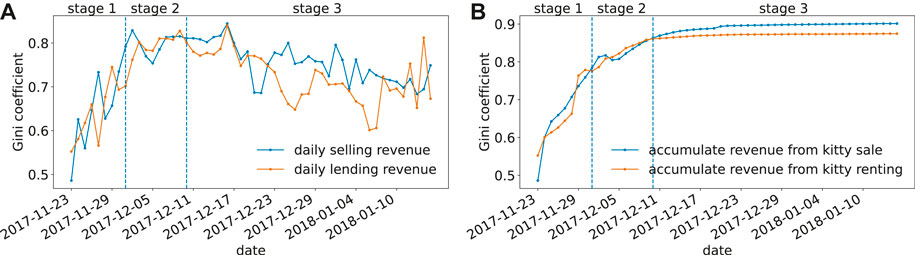
FIGURE 11. Gini coefficients of (A) daily selling and lending revenue and (B) the accumulate revenue from kitty sale and renting for all the addresses. Dotted lines separates the stage 1, 2 and 3.
Not only the revenues, kitty ownerships were also gradually concentrated to a few players. The Gini coefficient of the number of kitties owned by all addresses at each stage is shown in Figure 12. When counting the number of kitties belong to an address, unsold kitties in the SalesAuction contract belong to the seller, and unrented kitties in the SiringAuction contract belong to the lender. In the first and second stages, many new players entered the game, all making purchasing, and the Gini coefficient gradually decreased. However, as the number of new players decreased and existing players quit, the Gini coefficient rose in the third stage and kept rising in the fourth stage. As of April 2020, the Gini coefficient of kitties with addresses has exceeded 0.8. At this time, the resources in CryptoKitties became highly concentrated.
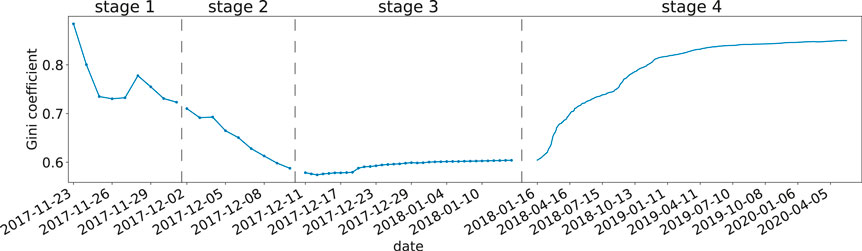
FIGURE 12. The Gini coefficient of kitties owned by all addresses. Dotted lines separates the four stages. The x-axis are re-scaled to better illustrate the parameter dynamics in stages 1, 2 and 3.
5.2.4 Limitations of Blockchain Systems
The cost of performing operations on a public blockchain system is highly volatile due to the unstable price of cryptocurrencies, resulting in it difficult to control the cost of the applications deployed on the blockchain. As CryptoKitties was deployed on Ethereum, the cost of playing the game (including the costs of buying, breeding, and renting kitties, as well as the fees paid to Ethereum miners) has risen significantly due to the rapid rise of Ether price in the third stage. Ether price increased from US $451 on December 10, 2017, to US $1,322 on January 10, 2018 (see Figure 13), resulting in a significant increase in the cost of playing the game, raising the bars for new players entering the game.
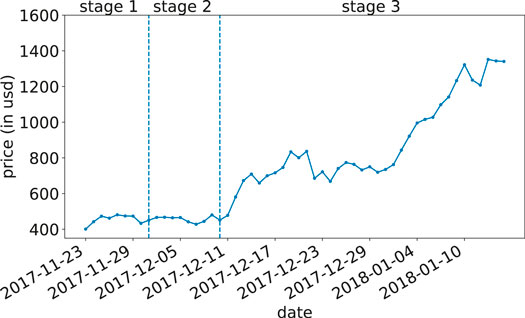
FIGURE 13. The Ether price. Dotted lines separates the stage 1, 2 and 3.
In addition to the cryptocurrency price, other potential limitations of blockchain systems include the unnecessary gas cost by poorly designed smart contracts and the low system throughput (measured in transaction per second, TPS). Under-optimized smart contracts will consume more gas than necessary [18], making it more expensive for users to play games. Chen et al. [19, 20] studied the gas cost mechanism of Ethereum and proposed a way to optimize smart contracts through analyzing bytecodes, potentially reducing the gaming costs. The low throughput of Ethereum [21] has rendered that concurrent operations by many users are not feasible. Once too many players have joined the game, the time needed to validate operations in the game takes too long, therefore sabotaging the players' gaming experiences.
6 Conclusion
This paper is the first to fully unveil the user activities in the once most popular blockchain game CryptoKitties and identify the reasons for its rise and fall. Based on the number of addresses associated with the game every day, we divide the process of CryptoKitties into four stages: the primer, the rise, the fall, and the serenity. We extracted all the five million kitty transactions from the Ethereum blockchain and constructed the kitty ownership transfer network for characterizing the user behaviors. We found that a large number of players flooded in the game in the early days but quickly withdrew later, and a few big players gradually took control of the game.
We found that the public attention drew by the message that a special kitty was sold at an extremely high price eventually led to the explosive growth of game popularity. For the rapid decline of the popularity, reasons including 1) the oversupply of game props, i.e., the kitties, 2) the loss of profit in the game prop trading, 3) the increasing gap between the wealth distribution among the players, and 4) the limitations of blockchain are accounted for.
Drawing from these observations, we advise on the designing of future blockchain games as follows.
1. Design a reasonable prop output mechanism to keep a balance between supply and demand.
2. Provide a mechanism for adjusting player income to prevent players losing money in prop trading with a high probability.
3. Design a mechanism to narrow down the gap between the rich and poor and prevent the revenue from being gained by only a few players.
4. To fully consider the limitations of blockchain systems in the game design.
Data Availability Statement
Publicly available datasets were analyzed in this study. This data can be found here: https://github.com/jiangxjcn/Cryptokitties-analysis.git.
Author Contributions
Both authors designed the study and wrote the paper. XJJ conducted data analysis.
Funding
This work is supported by CityU Start-up Grant for New Faculty (No. 7200649) and CityU Strategic Research Grant (No. 11503620).
Conflict of Interest
The authors declare that the research was conducted in the absence of any commercial or financial relationships that could be construed as a potential conflict of interest.
Acknowledgments
We thank Si-Hao Liu and Ying-Hao Zhang for their suggestions on the revision of this article.
References
2. Buterin V. Ethereum white paper: a next generation smart contract & decentralized application platform (2014).
3. Mohanta BK, Panda SS, Jena D. An overview of smart contract and use cases in blockchain technology. In: 2018 9th International conference on computing, communication and networking technologies (INCCCNT); 2018 July 10–12; Bangalore, India. NEW YORK: IEEE (2018), 1–4.
4. Min T, Wang H, Guo Y, Cai W. Blockchain games: a survey. In: 2019 IEEE Conference on Games (CoG); 2019 August 20–23; London, United Kingdom. NEW YORK: IEEE (2019). p. 1–8.
5. Scholten OJ, Hughes NGJ, Deterding S, Drachen A, Walker JA, Zendle D. Ethereum crypto-games: mechanics, prevalence, and gambling similarities. In: Chi Play’19: Proceedings of the Annual Symposium on Computer-Human Interaction in Play; 2019 October 17; Barcelona, Spain. New York: ACM (2019) 379–89.
6.Cryptokitties craze slows down transactions on ethereum (2017). Available from: http://www.bbc.com/news/technology-42237162 (Accessed December 5, 2017).
7. Chen T, Zhu Y, Li Z, Chen J, Li X, Luo X, et al. Understanding ethereum via graph analysis. In: IEEE INFOCOM ’18 conference on computer communications; 2018 April 16–19; Honolulu, HI, USA. NEW YORK: IEEE (2018a). p. 1484–92.
8. Somin S, Gordon G, Altshuler Y. Social signals in the ethereum trading network (2018). p. 12097. Available from: arXiv:1805.12097.
9. Guo D, Dong J, Wang K. Graph structure and statistical properties of ethereum transaction relationships. Inf Sci (2019) 492:58–71. doi:10.1016/j.ins.2019.04.013
10. Huang Y, Wang H, Wu L, Tyson G, Luo X, Zhang R, et al. Understanding (Mis)Behavior on the EOSIO blockchain. Proc ACM Meas Anal Comput Syst (2020) 4(2):1–28. doi:10.1145/3392155
11.Etherscan. The ethereum block explorer (2017). Available from: https://etherscan.io/ (Accessed May 19, 2020).
12. Tepper F. People have spent over $1 m buying virtual cats on the ethereum blockchain (2017). Available from: https://techcrunch.com/2017/12/03/people-have-spent-over-1m-buying-virtual-cats-on-the-ethereum-blockchain/ (Accessed December 4, 2017).
13. Baumann A, Fabian B, Lischke M. Exploring the bitcoin network. In: 10th International Conference on Web Information Systems and Technologies volume 2: WEBIST ’14; 2014 Apr 3–5; Barcelona, Spain. Setúbal, Portugal: SciTePress (2014), 369–74.
14. Sorgente M, Cibils C. The reaction of a network: exploring the relationship between the bitcoin network structure and the bitcoin price (2014). Available from: http://snap.stanford.edu/class/cs224w-2014/projects/cs224w-27-final.pdf (Accessed December 10, 2014).
15. Szücs I, Kiss A. Quantitative analysis of bitcoin exchange rate and transactional network properties. In: 9th International Conference on Applied Informatics; 2014 Jan 29–Feb 1; Eger, Hungary. (2015), vol. 1, 201–11.
16. Lee J, Yoo B, Jang M. Is a blockchain-based game a game for fun, or is it a tool for speculation? an empirical analysis of player behavior in crypokitties. In: Xu JJ, Zhu B, Liu X, Shaw MJ, Zhang H, and Fan M, editors. The ecosystem of e-business: technologies, stakeholders, and connections. WEB 2018. Lecture Notes in Business Information Processing. vol. 357. Cham, Switzerland: Springer International Publishing (2018). p. 141–8.
17. Buchholz M, Delaney J, Warren J, Parker J. Bits and bets, information, price volatility, and demand for bitcoin (2012). Available from: https://www.reed.edu/economics/parker/s12/312/finalproj/Bitcoin.pdf (Accessed May 19, 2020).
18. Chen T, Li X, Luo X, Zhang X. Under-optimized smart contracts devour your money. In: 2017 IEEE 24th international conference on software analysis, evolution and reengineering (SANER); 2017 Feb 20–24; Klagenfurt, Austria. NEW YORK: IEEE (2017). p. 442–6.
19. Chen T, Li Z, Zhou H, Chen J, Luo X, Li X, et al. ving money in Towards saving money in using smart contracts. In: 2018 IEEE/ACM 40th international conference on software engineering: new ideas and emerging technologies results (ICSE-NIER); 2018 May 27–June 3; Gothenburg, Sweden. NEW YORK: IEEE (2018b). p. 81–4.
20. Chen T, Li X, Wang Y, Chen J, Li Z, Luo X, et al. An adaptive gas cost mechanism for ethereum to defend against under-priced DoS attacks. In: Liu J, , and Samarati P, editors. International conference on information security practice and experience; 2017 December 13–15; Melbourne, Australia. Cham, Switzerland: Springer (2017b). p. 3–24.
Keywords: cryptokitties, blockchain game, ethereum, transaction network, game design
Citation: Jiang X-J and Liu XF (2021) CryptoKitties Transaction Network Analysis: The Rise and Fall of the First Blockchain Game Mania. Front. Phys. 9:631665. doi: 10.3389/fphy.2021.631665
Received: 20 November 2020; Accepted: 21 January 2021;
Published: 03 March 2021.
Edited by:
Hui-Jia Li, Beijing University of Posts and Telecommunications (BUPT), ChinaReviewed by:
Xiapu Luo, Hong Kong Polytechnic University, Hong KongJiajing Wu, Sun Yat-Sen University, China
Copyright © 2021 Jiang and Liu. This is an open-access article distributed under the terms of the Creative Commons Attribution License (CC BY). The use, distribution or reproduction in other forums is permitted, provided the original author(s) and the copyright owner(s) are credited and that the original publication in this journal is cited, in accordance with accepted academic practice. No use, distribution or reproduction is permitted which does not comply with these terms.
*Correspondence: Xiao Fan Liu, xf.liu@cityu.edu.hk