Simulation of Information Spreading on Twitter Concerning Radiation After the Fukushima Nuclear Power Plant Accident
 Yukie Sano
 Hiroyuki A. Torii
 Yosuke Onoue3
  Kazuko Uno
- 1Faculty of Engineering, Information and Systems, University of Tsukuba, Ibaraki, Japan
- 2School of Science, The University of Tokyo, Tokyo, Japan
- 3College of Humanities and Sciences, Nihon University, Tokyo, Japan
- 4Louis Pasteur Center for Medical Research, Kyoto, Japan
Information spreading on social media is a crucial issue to build a safe society. In particular, during emergencies, misinformation and uncertain information can lead to social disruption and cause significant damage to our lives. Here we built a retweet network from 24 million radiation-related tweets by 1.3 million accounts in the immediate aftermath of the Fukushima nuclear power plant accident in 2011. Then we simulated the information spreading on the network to explore ways to spread scientifically accurate information. Our simulation replicated the reality in which the number of scientific evidence-based tweets experienced a gradual decline while the number of emotional tweets increased. We also showed that increasing new direct retweets from the influencers could effectively spread scientific evidence-based information in our hypothetical simulations.
Introduction
In ancient and modern times, all sorts of uncertain information appear during and after disasters whether natural or human-made. It has been documented since Roman times that rumors have been used as a sort of weapon. During World War II in the 1940s, people were at the mercy of much uncertain information, and innocent people were harmed in places where they were not on the battlefield [1]. Uncertain information was also spread in many countries during the COVID-19 pandemic in 2020. The new term “infodemic” (it comes from information and pandemic) was created, and experts warned of the risks [2, 3]. During the infodemic in 2020, since people were at home due to the lockdown, uncertain information came and went mainly on social media.
The same thing happened in 2011 when the Great East Japan Earthquake struck Japan. Damages caused by the earthquake itself, the tsunami and the collapse of buildings were enormous. Moreover, the accident at the Fukushima Daiichi nuclear power plant (1F), located 220 km from the Tokyo metropolitan area, affected many people extensively and long-lasting. Due to this accident, many people in certain areas of Fukushima Prefecture were forced to evacuate. At the peak time, 165 thousand people evacuated and still, 30 thousand people continue to live away from their hometown. During this decade, some people have died of illness or committed suicide due to the stress of being forced to suddenly leave their homes and live in new communities in temporary housing. These are called disaster-related deaths.
The 1F accident was the cause of the confusion [4, 5]. After the accident, people shared information about radiations. Because radiation cannot be seen directly and scientific knowledge is necessary to understand accurate information about radiation, many people looked for various details regarding radiation on social media. This information was shared largely, especially in Twitter space in 2011, Japan.
Despite being a crucial case, there has been little in-depth social media analysis of Fukushima and the radiation aftermath of the disaster. To tackle the issue, Tsubokura et al. collected and analyzed the data from the Japanese Twitter space, using technical terminology to comprehensively describe the information exchanged about the 1F accident [6]. They showed that retweets (RTs) accounted for more than half of the information exchanged about the 1F accident. Furthermore, RTs from influential sources, known as “influencers,” accounted for 80.3% of the total RTs, even though they occupy only 2% of Twitter accounts.
These influencers could then be broadly divided into three groups by applying the document vector analysis. The first group of people tweeted rationally which described the effect of radiation based on science-based facts. The second group of people tweeted emotionally and criticized the government and Tokyo Electric Power Company. The third group consists of news agencies and journalists who are related to mass media [6]. Hereafter we refer to the second group of people who tweeted with an emotional expression as Group B and the remaining two groups as Group A.
To empirically identify each group’s impact and explore ways to spread scientifically accurate information about radiation efficiently, it is crucial to go ahead with Tsubokura’s study [6] and discuss information spreading under the various scenarios. However, information spreading, which is also known as complex contagions [11], is difficult to understand, unlike a physical phenomenon whose motion is deterministically delivered by kinetics laws. Therefore, we developed a simulation using a modified voter model with a real RT network. Specifically, by using the same data set in Ref. [6], we simulated the information spreading on a real RT network immediately after the 1F accident, originating from the real influencers. As a result, we showed that Group A was influential during the first week after the accident. However, Group A lost its influence after a month, and the tweets from Group B cover the majority of discussion about radiation on Japanese Twitter space. These simulation results replicated the fact that the tweet from Group B spread more widely than Group A in real data analysis [6]. Here we performed simulations under hypothetical scenarios to respond accurately and quickly to social crises, especially in the age of infodemic.
Materials and Methods
Network Data
We used the same Japanese Twitter data as used in Ref. [6] related to the 1F accident and/or radiation from March 2 to September 15 in 2011 (i.e., the first six months after the Great East Japan Earthquake). The total number of tweets and retweets during the period was 24,287,299 from 1,397,941 accounts. From this data, we built a weighted directed network in which the nodes are Twitter accounts, and the links are RT relations. If there was an object in the retweeted_status in the original JSON data, we treated it as RT. Therefore, we only used direct retweets. The code for this pre-processing is available at the following URL (https://github.com/likr/twitter-analysis2018/edit/master/scripts/). The link direction is from the RT origin to the RT destination (a tweet author), representing the information flow (Figure 1A). Thus, the number of outgoing links indicates retweeted frequency, while the number of incoming links indicates retweet frequency.
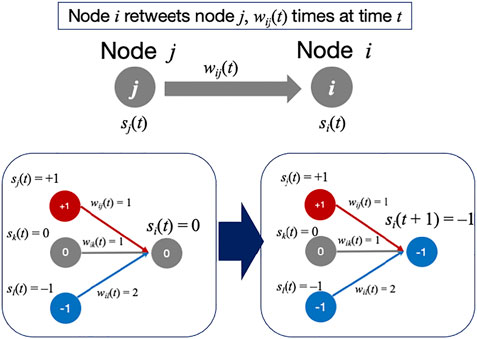
FIGURE 1. (A) An example of drawing directed and weighted link from tweets. (B) Our opinion model. An example where the node i changes its opinion si(t) at time t + 1.
We built the network the way mentioned above because we assume that if an account i retweets another account j, i agrees with and supports j’s opinion. If i retweets j more than once, then i strongly agrees with j. Of course, it is also possible that i may retweet to refute j’s opinion especially when they are quoted tweets. However, we made this assumption because as of 2011, only about three years since Twitter became widespread in Japan, and most people used RT to show their agreement.
During the whole period under the study, the number of nodes and links were 813,876 and 7,528,370, respectively, with the largest connected component accounting for 99% in total. When we look at the RT network weekly, the size of the network decreases over time as the number of tweets about 1F accident and/or radiation decreases (Figure 2A). Degree distribution of the whole period shows a highly skewed distribution in both incoming and outgoing links. When compared with the lognormal and power-law distributions [27], the incoming link was significantly (p < 0.01) closer to the lognormal distribution. There was no significant difference between the two distributions for the outgoing link, and the power-law exponent is 1.87 for power-law distribution (Figure 2B). This skewed distribution in number of RTs is similar to the result of an earlier work showing that the retweet and retweeted frequency follows a power-law function with its exponent being 1 [7]. A simple Barabási‐Albert (BA) model—growth and preferential attachment process—generates its power-law exponent three analytically [8]. Our degree distribution and the power-law exponent are not exactly the same as in the previous studies. This could be limited to tweets about 1F accident and/or radiation in our research. We do not go into the detail of the mechanism in this paper but will discuss RT dynamics at another time. The number of links for most nodes is small, and the percentage of nodes with less than three links is 63.3% for incoming and 58.8% for outgoing links (Figure 2C).
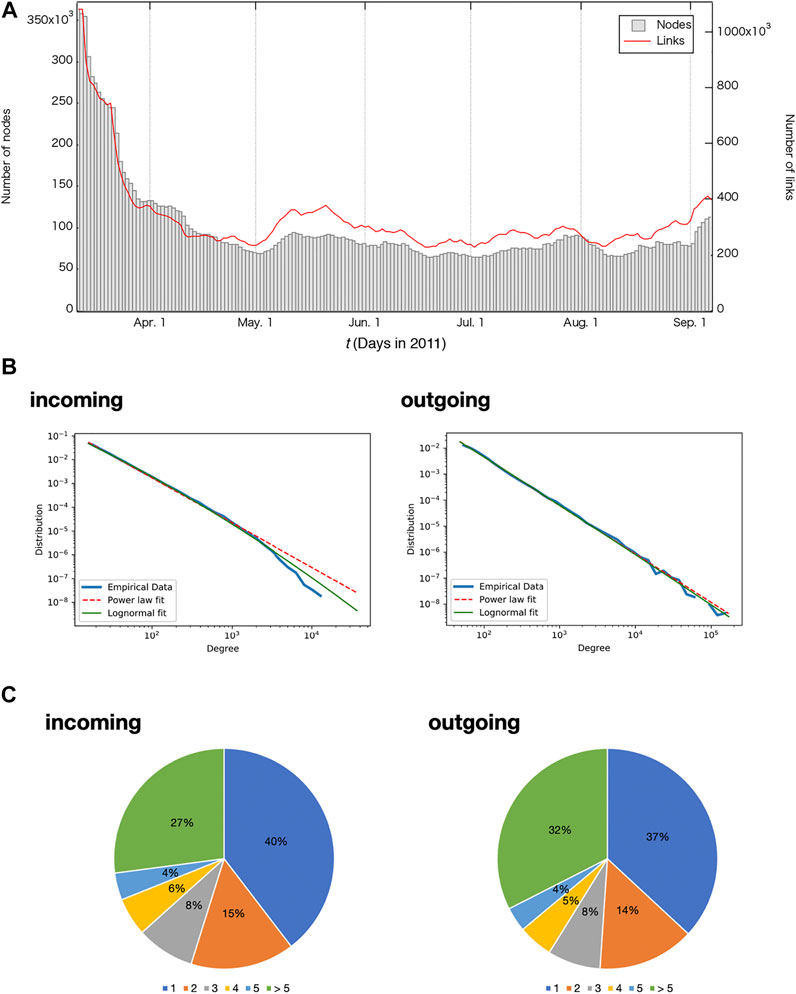
FIGURE 2. (A) The number of nodes and links of the retweet network built from the radiation-related tweets after the 1F accident per week. There were large numbers of nodes and links immediately after the 1F accident but gradually decreased with time. (B) Degree distribution of both incoming (retweeted) and outgoing (retweet) link. For incoming link, lognormal distribution (green solid line) is selected p < 0.01 while outgoing link distribution is not statistically selected. Power-law exponent is 1.93 for incoming link and 1.87 for outgoing link in the figure. (C) Pie chart of the number of links in the retweet network for the whole observed period. More than half of the nodes have less than two in both incoming and outgoing links.
Model
There are a variety of opinion dynamics models [9–12]. One of the most representative and longest established ones is the voter model. The voter model is also called the Ising model in physics literature [13, 14]. A simple voter model in which nodes have binary opinions with externalities is also well-known in economics [15]. In a voter model, the nodes choose one of their neighbors to mimic their opinions at each time step. A voter model’s dynamics is not direct voting by all neighbors, but the majority will have a probabilistic advantage. A natural extension of the binary voter model is that a node chooses its opinion, i.e., state, from multiple opinions, called the Potts model [16].
There is another model that has binary opinions as in the voter model, but all of its neighbors directly influence each node [17, 18]. In these models, nodes have a threshold and make decisions according to that threshold. Both in analytical solutions and numerical simulations, Watts has confirmed that the threshold and an average number of neighbors to determine whether a global cascade occurs [17]. Watts’ cascade model was initially studied in networks without link directions and weights. Since then, the model has been largely extended to include the case with link direction and weights [19, 20] as well as degree correlations [21]. Furthermore, Watts and colleagues have confirmed the “social influence” assumed in the model in an experiment using an artificial music market [22].
Running the simulation on real data gives us a new perspective. Karimi et al. ran Watts’ cascade model on six real networks and found that the temporal network structure increases the cascade size [23]. Combining real Twitter data with simulations is also underway to analyze information spreading in what-if scenarios [10, 24, 25]. Takayasu et al. used SIR-like model and showed that the false rumor cascade size decreased in case that the timing of anti-rumor transmission was earlier than the reality [24]. Tripathy et al. ran the two models on a real network with about 50,000 nodes to propose an anti-rumor strategy on Twitter [25]. However, these simulations do not fully take into account the link directions and weights that the real network contains.
We built our opinion model based on the Watts’ cascade model with three opinions that takes into account the RT dynamics. We consider a model that incorporates the strength of one’s own opinions to update his/her opinions, because we assume that nodes are influenced by their neighbors and their own beliefs when they update their opinions. This own opinion corresponds to the threshold in Watts’ cascade model.
Assume that each node i has one of the internal states of si(t) = {−1, 0, 1} at time t. Here, we assign si(t) = +1 to Group A and si(t) = −1 to Group B. The state si(t) = 0 corresponds to a neutral state that does not belong to either of these groups. Initially, all nodes are set at the neutral state of si(t) = 0, except for the influencers. At time t, node i receives an input from its neighbor node j that has retweeted. Here we consider the direction and the weight wij(t) of the link. When a node i does not have an incoming link from a node j, then wij(t) = 0. A node i determines its next internal state si(t + 1) based on the value mi(t), which is the sum of the inputs from its all neighbors (Figure 1B):
where ni is the number of links directed to node i (i.e., number of incoming links of node i), and ai is the parameter that describes the strength of node i’s own opinion. Let us assume that ai is normalized 0 ≤ ai < 1, and that it does not change with time. When ai∼1, node i refers its own state, and no update occurs when si(t) ≠ 0. On the other hand, when ai = 0, si (t + 1) is determined entirely by inputs from the i’s neighbors. This corresponds to the situation that a node updates its opinion fully depending on its neighbors. Therefore, when ai is small, a node is more likely to change its opinion. A node i updates its opinion next time si (t + 1) based on mi(t) with the following threshold.
Due to this rule, when ai > 0.5, once a node i has its opinion si(t) ≠ 0, a node i is unlikely to change its opinion. Only when wij(t) has a large value, a node i may change the sign of mi(t) and update si (t + 1). We count the number of nodes in each internal state si(t); VA(t) is the number of nodes with si(t) = +1 and VB(t) is the number of nodes with si(t) = −1. Finally, we evaluate R(t) = VB(t)/VA(t) as the ratio of the Group B to Group A.
Network Data Assimilation Simulation
We simulate the proposed model on the real RT network as follows:
(1) Set the target period
We bring out the real network data for the target period t, where t denotes a week starting from t days after the date of the earthquake. To see R(t)’s gradual fluctuations, we use the overlapping time windows; t = 1 from March 12–19 in 2011, and t = 2 from March 13–20 in 2011. Finally, t = 181 = T is from September 8–15 in 2011.
(2) Set the initial conditions and influencers
For the initial condition, based on the previous study [6], we set the top nine influencers in each group who retweeted most during the whole period. Here we set si(t) = +1 as influencers in Group A. Also, we set si(t) = −1 as influencers in Group B. All remaining nodes were set to si(t) = 0.
(3) Update opinion with the model
We repeat the simulation with our model. Here we repeat 50 steps because the number of nodes in each state does not change anymore (Figure 3). After 50 steps we count the number of nodes with si(t) = +1 as VA(t) and the number of nodes si(t) = −1 as VB(t), and calculate the ratio R(t).
(4) Shift the target period and repeat the simulation
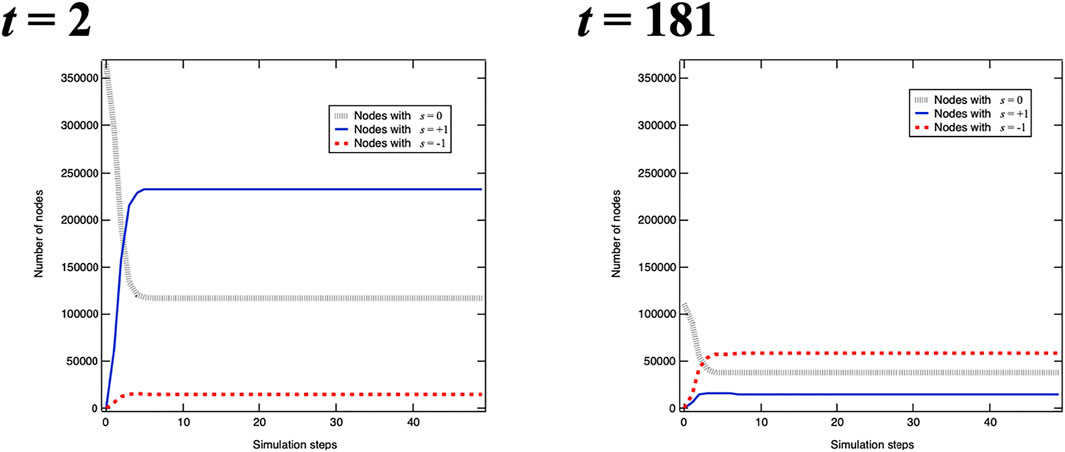
FIGURE 3. Examples of simulations at step t. The vertical axis indicates the number of nodes as a function of simulation steps in the one simulation at t = 2 and t = 181. The number of nodes does not change after 50 simulation steps.
We change the target period from t to t + 1 and repeat the simulation.
Results
Real Data Case
In the previous study [6], the number of RTs from influencers belonging to Groups A and B were identified. Therefore, we used the values as a benchmark to replicate the influence of Groups A and B. In the real data, the number of RTs from Group B, VBreal(t), begins to increase around t = 20 (i.e., April in 2011). Then Rreal(t) = 2.4 at t = 181 (i.e., September in 2011). This indicates that the number of retweets from Group B containing emotional expressions about radiation accounted for more than that of Group A containing more scientific description. In fact, around t = 10 (i.e., March in 2011), Groups A predominated because many scientists and mass media repeatedly tweeted their evidence-based facts and people retweeted them. However, the number of tweets from influencers in Group A declined, instead, the tweets from influencers in Group B increased.
To check the validity of our simulation, we compared R(t), the ratio of the nodes in Group B to that in Group A. We compared the real number Rreal(t) from the data and simulation results Rsim(t) for the same target period t. Because the value of R(t) fluctuates widely with t, we compared the 7-days moving average
Optimization of Fixed-Parameter ai
Figure 4A shows the simulation results with a fixed ai value for every node. Since we never know ai for each node, we fixed the value a for simplicity. First, when a < 0.2, the sum of error
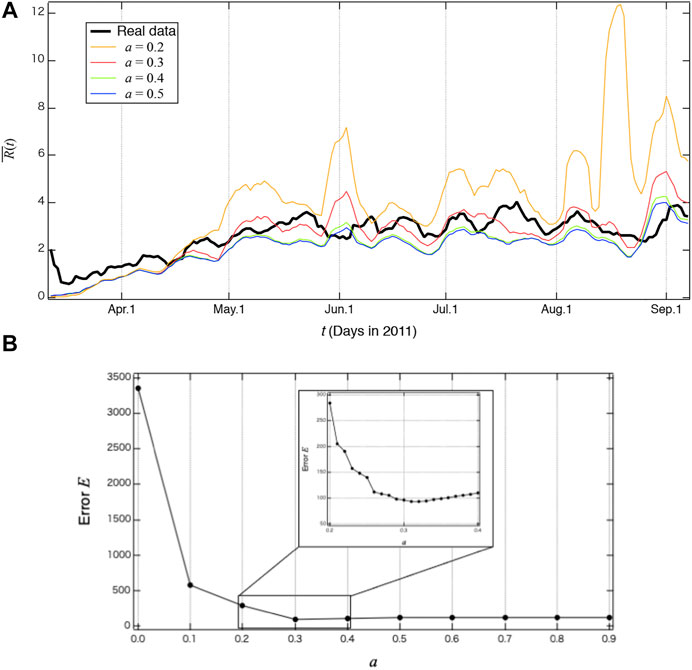
FIGURE 4. (A) The 7-days moving average ratio
We will discuss the obtained value of a = 0.31 in more detail: if a is greater than 0.5, nodes do not change their opinion once they are in either si(t) = +1 or si(t) = −1 by its definition in Eqs 1, 2. On the other hand, if a is close to zero, nodes easily change their opinion depending on their neighbors. Original Watts’ cascade model is known that global cascades do not occur when the threshold value exceeds about 0.25, even smaller average degree [17]. In our simulation with real network data, which most nodes have a smaller number of neighbors (Figure 2C), the global cascade does not occur when a exceeds 0.3. Furthermore, when a is large, nodes hardly change their opinions once they are si(t) ±1. As a result, the value of
The above results for a fixed parameter ai showed that a = 0.31 yields the simulation results most similar to the real results. However, fixing ai for all nodes is not practical to simulate real social phenomena. Therefore, we add noise to ai so that ai = 0.31. Here we set a uniform random number [0, 0.62] for each ai. Figure 5 shows the mean and standard deviation of the values over ten iterations of the simulation with ai = 0.31, changing ai for each node. We can confirm that the parameter ai with noise also replicate the real data.
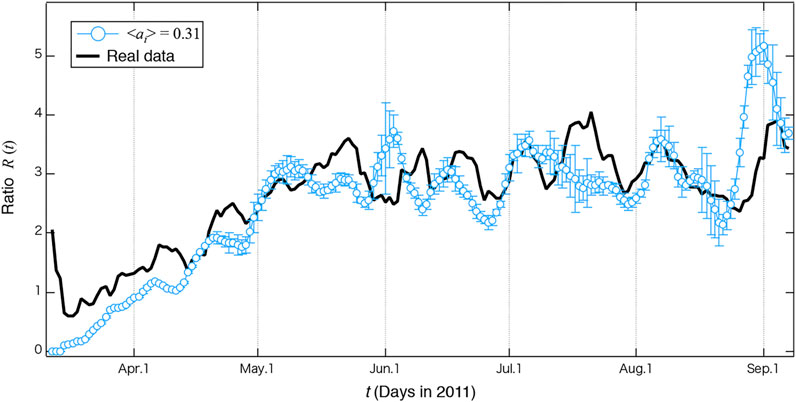
FIGURE 5. Simulation results for ⟨ai⟩ = 0.31, which is the most accurate reproduction of the real data. The error bars represent the standard deviation calculated from ten iterations.
Application of Simulation with Hypothetical Scenarios
Finally, we present the simulation results under hypothetical scenarios based on the simulation with ai = 0.31. Comparing hypothetical scenarios will help us consider a new strategy to convey scientific evidence-based tweets instead of emotional tweets. Here we apply the following three scenarios (Figure 6).
• Scenario (1): Add a new node to retweet influencers directly
• Scenario (2): Increase the number of RTs from nodes which have already retweeted the influencers
• Scenario (3): Add a new node to retweet nodes which have already retweeted the influencers
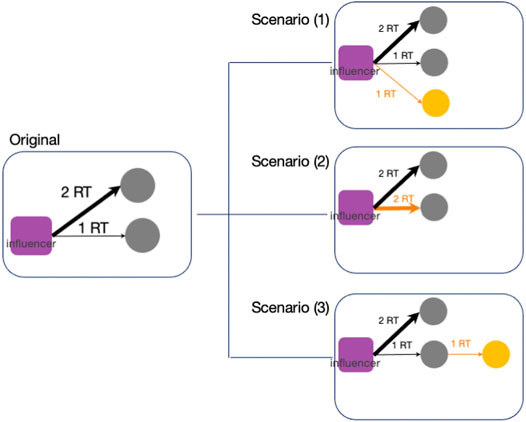
FIGURE 6. Schematic diagram of our hypothetical scenarios. Orange nodes and arrows are the hypothetical setup parts. In Scenario (1), we add new nodes to retweet influencers directly; in Scenario (2), we increase the number of RTs for nodes that have already retweeted; and in Scenario (3), we added new nodes to retweet nodes which have already retweeted the influencers.
We compared these three scenarios, with a 10% increase in RTs for nine influencers in each group. Since increasing RTs corresponds to adding new links to the network, therefore, in the actual simulation, we randomly added and changed the link connections, and compared them on average over ten iterations. Here we simulated six scenarios. With scenarios (1A), (2A), and (3A) where scenarios (1), (2), and (3) were applied to only nine influencers in Group A. With scenarios (1B), (2B), and (3B) when scenarios (1), (2), and (3) were applied to only nine influencers in Group B.
In Figure 7, we compared the mean ⟨R′(t)⟩ which is the hypothetical simulation result, and the mean R(t) which is the original simulation result over the entire period for the six scenarios (1A)–(3B). When we apply the scenarios (1)–(3) only to the influencers in Group A, R′(t)/R(t)< 1, we can reduce the influence of Group B. Especially the scenario (1A), which is adding new node who retweet influencers in Group A directly, has the largest impact to reduce the influence of Group B. On the other hand, when we apply the scenarios only to the influencers in Group B, it yields R′(t)/R(t) > 1. When we compared the absolute value |R’(t)/R(t) −1|, the most impactful of these scenarios is (1A). Our result suggests that to increase the influence of Group A with science-based and less emotional tweets, increasing the number of nodes who retweet the key influencers directly is effective.
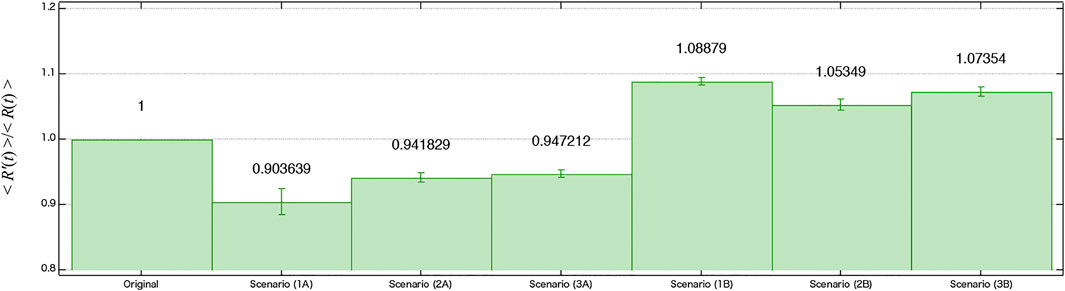
FIGURE 7. Comparison of hypothetical simulation result of ⟨R′(t)⟩, which is the average ratio between the number of nodes that belong to Group B divided by the number of nodes that belong to Group A, in each scenario, with the result of the original simulation set to unity. Scenario (1A) can reduce the average ratio of Group B most effectively.
Discussion
Although we cannot see radiation nor information directly, it continues to affect our lives. Here we have analyzed and simulated radiation-related tweets after the 1F accident in 2011. Over the first six months after the accident, scientifically based tweets decreased. Instead, tweets containing more emotional expressions began to spread among the radiation-related tweets in the Japanese Twitter space.
To explore the ways to spread scientifically accurate information about radiation efficiently, we first built a weighted directed network from the tweet data. Next, we introduced a model of opinion dynamics where each node has its own intentions but is also influenced by its RT neighbors. When the strength of each node’s opinion ai is 0.31, it best reproduces the real data. This suggests that each node is influenced by its neighbors, taking also into account its own opinion. Then we have introduced this model on the built RT network with real influencers in various hypothetical scenarios. The hypothetical simulation allows us to quantify what kind of RTs can increase a particular group’s influence. Although our simulation setup is simple, it can provide suggestions on how to make the information more widely available, even on complicated RT networks.
There remain limitations of our research both in developing network and simulation models. For developing the network, we employed that direction of the link is from RT source to tweet author assuming endorsement in RTs. Using Twitter data in 2011, when Twitter is relatively new in Japan, we believe that this was an appropriate assumption to some extent since RTs played a major role in information spreading. However, especially nowadays that RTs are often used to argue for opposing views, the way of developing a network will need to be considered more carefully. For the simulation model, we assumed that each node has three discrete states (opinions) by majority vote deterministically. However, it is also clear that real opinions have shades and are not discrete in just three states. Moreover, people do not decide by simple majority vote. For example, the bounded-confidence model [26], which has continuous values in opinions and incorporates the opinions of people whose opinions are similar to one’s own, is a strong candidate in the information spreading about a radiation-related issue such as this.
Our analysis shows that the role of influencers is crucial from the view of the network. In the future, it will also be important to analyze the nodes which are directly connected to the influencers. Also, more in-depth knowledge about networks, such as time-varying networks and analysis using multilayer networks, can provide a more accurate picture of information spreading. Not only in radiation information spreading, but uncertain information spreading has also been observed in political and vaccine information [28, 29]. Behind these phenomena, it has been pointed out that the information that spreads easily has novelty and attractive narratives. Although we did not go into the text of these tweets in-depth, we hope to work with psychologists to analyze the tweets in more detail in the future and reflect the results in our simulations.
In addition to network analysis, it is essential to develop the simulations as well. By varying the parameter ai over time or fixing the ai of a particular influencer, we can expect more realistic simulations. For example, introducing ai proportional to the number of RTs (outgoing links of node i) is a strong candidate because it reflects the fact that influencers often act as opinion leaders and are unlikely to change their opinions. Also, in the hypothetical scenarios, we performed the simulation with increasing RTs from influencers this time. However, measuring the impact of the simulation with decreasing RTs from influencers in Group B will also give a new perspective to spread information from Group A. Another important direction is to examine the timing of the information transmission. For example, examining how many RTs from Group B can be reduced if the timing of information spreading from Group A is earlier than reality. Our simulation could be widely applied in information spreading social media, not only for radiation-related information, but also for e.g., delivering correct vaccine information.
Data Availability Statement
Twitter data used in this study is available for purchase through NTT DATA and Twitter, Inc. To comply with Twitter terms of service, Twitter data cannot be publicly shared. Other raw data supporting the conclusion of this article (simulation codes and result data) will be made available by authors, without undue reservation.
Author Contributions
All authors contributed to the conception of the paper. YS, HT YO, and KU designed the whole structure of the research. YS and YO constructed the network data. YS and HT developed the model. YS performed the simulations. YS and HT wrote sections of the paper.
Funding
This work was supported by Research on the Health Effects of Radiation organized by the Ministry of the Environment (MOE), Japan. YS acknowledges support from JSPS KAKENHI Grant Number 20K19928.
Conflict of Interest
The authors declare that the research was conducted in the absence of any commercial or financial relationships that could be construed as a potential conflict of interest.
Acknowledgments
We would like to thank the members of the MOE project (Research title: “How to spread accurate scientific-based information in real time after large-scale disasters: a multifaceted research of radiation related information spreading on Twitter after the 3.11”) for the fruitful discussion.
References
2. Zarocostas J. How to Fight an Infodemic. The Lancet (2020) 395(10225):676. doi:10.1016/s0140-6736(20)30461-x
3. WHO . Director-general’s Remarks at the media Briefing on 2019 Novel Coronavirus on 8 February 2020 (2020). Available at: https://www.who.int/dg/speeches/detail/director-general-s-remarks-at-the-media-briefing-on-2019-novel-coronavirus---8-february-2020 (Accessed June 11, 2021).
4. Goto A, Rudd RE, Lai AY, Yoshida K, Suzuki Y, Halstead DD, et al. Leveraging Public Health Nurses for Disaster Risk Communication in Fukushima City: a Qualitative Analysis of Nurses’ Written Records of Parenting Counseling and Peer Discussions. BMC Health Serv Res (2014) 14(1):129. doi:10.1186/1472-6963-14-129
5. Kai M. Some Lessons on Radiological protection Learnt from the Accident at the Fukushima Dai-Ichi Nuclear Power Plant. J Radiol Prot (2012) 32(1):N101–N105. doi:10.1088/0952-4746/32/1/n101
6. Tsubokura M, Onoue Y, Torii HA, Suda S, Mori K, Nishikawa Y, et al. Twitter Use in Scientific Communication Revealed by Visualization of Information Spreading by Influencers within Half a Year after the Fukushima Daiichi Nuclear Power Plant Accident. PLOS One (2018) 13(9):e0203594. doi:10.1371/journal.pone.0203594
7. Bild DR, Liu Y, Dick RP, Mao ZM, Wallach DS. Aggregate Characterization of User Behavior in Twitter and Analysis of the Retweet Graph. ACM Trans Internet Technol (2015) 15(1). doi:10.1145/2700060
8. Barabási A-L, Albert R. Emergence of Scaling in Random Networks. Science (1999) 286(5439):509–12. doi:10.1126/science.286.5439.509
9. Castellano C, Fortunato S, Loreto V. Statistical Physics of Social Dynamics. Rev Mod Phys (2009) 81(2):591–646. doi:10.1103/revmodphys.81.591
10. Serrano E, Iglesias CA, Garijo M. A Survey of Twitter Rumor Spreading Simulations. Comput Collective Intelligence (2015) 9329:113–22. doi:10.1007/978-3-319-24069-5_11
12. Battiston F, Cencetti G, Iacopini I, Latora V, Lucas M, Patania A, et al. Networks beyond Pairwise Interactions: Structure and Dynamics. Phys Rep (2020) 874:1–92. doi:10.1016/j.physrep.2020.05.004
13. Clifford P, Sudbury A, “ . A Model for Spatial Conflict. Biometrika (1973) 60(3):581–8. doi:10.1093/biomet/60.3.581
14. Holley RA, Liggett TM. Ergodic Theorems for Weakly Interacting Infinite Systems and the Voter Model. Ann Probab (1975) 3(4):643–63. doi:10.1214/aop/1176996306
15. Schelling TC. Hockey Helmets, Concealed Weapons, and Daylight Saving. J Conflict Resolution (1973) 17:381–428. doi:10.1177/002200277301700302
17. Watts DJ. A Simple Model of Global Cascades on Random Networks. Proc Natl Acad Sci (2002) 99:5766–71. doi:10.1073/pnas.082090499
18. Centola D, Eguíluz VM, Macy MW. Cascade Dynamics of Complex Propagation. Physica A: Stat Mech its Appl (2007) 374:449–56. doi:10.1016/j.physa.2006.06.018
19. Gai P, Kapadia S. Contagion in Financial Networks. Proc R Soc A (2010) 466:2401–23. doi:10.1098/rspa.2009.0410
20. Hurd TR, Gleeson JP. On Watts' cascade Model with Random Link Weights. J Complex Networks (2013) 1:25–43. doi:10.1093/comnet/cnt003
21. Dodds PS, Payne JL. Analysis of a Threshold Model of Social Contagion on Degree-Correlated Networks. Phys Rev E (2009) 79:066115. doi:10.1103/physreve.79.066115
22. Salganik MJ, Dodds PS, Watts DJ. Experimental Study of Inequality and Unpredictability in an Artificial Cultural Market. Science (2006) 311:854–6. doi:10.1126/science.1121066
23. Karimi F, Holme P. Threshold Model of Cascades in Empirical Temporal Networks. Physica A: Stat Mech its Appl (2013) 392:3476–83. doi:10.1016/j.physa.2013.03.050
24. Takayasu M, Sato K, Sano Y, Yamada K, Miura W, Takayasu H. Rumor Diffusion and Convergence during the 3.11 Earthquake: A Twitter Case Study. PLOS One (2015) 10(4):e0121443. doi:10.1371/journal.pone.0121443
25. Tripathy RM, Bagchi A, Mehta S. A Study of Rumor Control Strategies on Social Networks. In: Proc. of the 19th ACM International Conference on Information and Knowledge Management (2010). p. 1817–20.
26. Deffuant G, Neau D, Amblard F, Weisbuch G. Mixing Beliefs Among Interacting Agents. Advs Complex Syst (2000) 03:87–98. doi:10.1142/s0219525900000078
27. Alstott J, Bullmore E, Plenz D. Powerlaw: A python Package for Analysis of Heavy-Tailed Distributions. PLoS One (2014) 9(1):e85777. doi:10.1371/journal.pone.0085777
28. Vosoughi S, Roy D, Aral S. The Spread of True and False News Online. Science (2018) 359(6380):1146–51. doi:10.1126/science.aap9559
Keywords: social media, simulation - computers, opinion dynamics model, network science, risk communication
Citation: Sano Y, Torii HA, Onoue Y and Uno K (2021) Simulation of Information Spreading on Twitter Concerning Radiation After the Fukushima Nuclear Power Plant Accident. Front. Phys. 9:640733. doi: 10.3389/fphy.2021.640733
Received: 12 December 2020; Accepted: 07 June 2021;
Published: 23 June 2021.
Edited by:
Miguel Angel Fuentes, Santa Fe Institute, United StatesReviewed by:
Juan Pablo Cárdenas, Net-Works, ChileWoo-Sung Jung, Pohang University of Science and Technology, South Korea
Copyright © 2021 Sano, Torii, Onoue and Uno. This is an open-access article distributed under the terms of the Creative Commons Attribution License (CC BY). The use, distribution or reproduction in other forums is permitted, provided the original author(s) and the copyright owner(s) are credited and that the original publication in this journal is cited, in accordance with accepted academic practice. No use, distribution or reproduction is permitted which does not comply with these terms.
*Correspondence: Yukie Sano, sano@sk.tsukuba.ac.jp